
Abstract
The purpose of this study was to determine whether fiber hyperplasia occurs in the rat plantaris muscle during postnatal weeks 3–20. Total muscle fiber number, obtained via the nitric acid digestion method, increased by 28% during the early postnatal rapid growth phase (3–10 weeks), whereas the number of branched fibers was consistently low. Whole-muscle mitotic activity and amino acid uptake levels showed an inverse relationship to the increase in total fiber number. The expression of MyoD mRNA (RT-PCR) levels decreased from 3 to 20 weeks of age, as did the detection of anti-BrdU- and MyoD-positive cells in histological sections. Immunohistochemical staining patterns for MyoD, myogenin, or developmental myosin heavy chain on sections stained for laminin (identification of the basal lamina) and electron micrographs clearly indicate that de novo fiber formation occurred in the interstitial spaces. Myogenic cells in the interstitial spaces were negative for the reliable specific satellite cell marker M-cadherin. In contrast, CD34 (an established marker for hematopoietic stem cells)-positive cells were located only in the interstitial spaces, and their frequency and location were similar to those of MyoD- and/or myogenin-positive cells. These findings are consistent with fiber hyperplasia occurring in the interstitial spaces of the rat plantaris muscle during the rapid postnatal growth phase. Furthermore, these data suggest that the new fibers may be formed from myogenic cells in the interstitial spaces of skeletal muscle and may express CD34 that is distinct from satellite cells.
Keywords
T
It generally has been accepted that in growing animals muscle fibers increase in length by the addition of new sarcomeres and increase in diameter by the addition of myofibrils. These two factors are believed to account for the postnatal increases in total muscle mass (Goss 1978). Because de novo fiber formation is thought to be complete before (Ontell and Dunn 1978; Ontell and Kozeka 1984) or shortly after birth (Ross et al. 1987), the possibility for an increase in muscle fiber number (i.e., hyperplasia) during postnatal growth has often been discounted. Whether this is the case, however, is controversial. Based on total fiber counts in cross sections at the mid-belly of the muscle, the number of fibers in the rat medial pterygoid muscle doubles during the first 6 weeks after birth (Rayne and Crawford 1975). Similarly, a marked increase in the number of fibers in the rat plantaris, soleus, and extensor carpi radialis longus muscles was observed during the first 3 weeks of postnatal growth (Chiakulas and Pauly 1965).
After birth, satellite cells located between the basal lamina and the plasma membrane of myofibers in growing and mature muscles are considered to be the only source of myogenic precursors in skeletal muscles (Mauro 1961; Bischoff 1989; Yablonka-Reuveni 1995). At least some of these satellite cells are active mitotically in the muscles of growing animals and contribute myonuclei to muscle fibers that are enlarging and lengthening to maintain a relatively constant myonuclear/cytoplasmic ratio (Moss and Leblond 1971). On the basis of direct fiber counts using the nitric acid digestion method, we have demonstrated that the number of fibers in the rat plantaris muscle increases (∼30%) during postnatal weeks 3–10 (Tamaki and Uchiyama 1995). The source of the cells to support these “new” fibers is unknown. Although it seems appropriate to speculate that satellite cells are involved, a role for other myogenic precursor cells cannot be discounted. A role for satellite cells is demonstrated when a mature muscle is damaged and satellite cells are activated and then proliferate, differentiate, and fuse with the damaged fibers and/or form new myofibers within the basal lamina cylinder (reviewed by Bischoff and Heintz 1994). A similar scenario could be occurring during the early postnatal rapid growth period.
An important limitation to many of the earlier studies reporting satellite cell activity has been the lack of specific markers for satellite cells. In the past decade, however, several useful markers have been identified. MyoD is a myogenic determination gene that encodes transcription factor (Weintraub et al. 1991; Weintraub 1993), and is expressed in activated satellite cells (Cornelison and Wold 1997). M-cadherin is expressed in quiescent, active and replicative satellite cells (Irintchev et al. 1994). CD34, an established marker of hematopoietic stem cells (Krause et al. 1996), has been reported to be present in some quiescent satellite cells (Beauchamp et al. 2000; Lee et al. 2000). In addition, myogenin and developmental myosin heavy chain (MHC) are markers of cell differentiation from myogenic cells to myotubes and myofibers (Cusella-De Angelis et al. 1992; di Maso et al. 2000; Weintraub 1993). Therefore, a combination of these markers can be used to identify the state of the satellite and/or myogenic cells.
The primary purpose of the present study was to determine the role of satellite cells in fiber hyperplasia in the plantaris muscle of rapidly growing rats. Our hypothesis was that satellite cells provided the nuclear material for the formation of “new” fibers during this developmental period. Changes in muscle mass and the number of muscle fibers were compared to the expression of the myogenic transcription factors MyoD and the changes in the mitotic activity and amino acid uptake levels in whole muscles of 3–20-week-old rats. We also examined new muscle fiber formation by electron microscopy and myogenin, developmental MHC, M-cadherin, and CD34 immunohistochemistry (IHC). Our results confirm that muscle hyperplasia occurs in the plantaris muscle of growing rats and suggest that new fiber formation in the interstitial spaces may be derived from a myogenic cell population that primarily resides in the interstitial spaces of the muscle.
Materials and Methods
Animals
Wistar male rats (specific pathogen-free, 3–20 weeks old, n = 137) were used in this study. The rats were housed in standard cages and provided food and water ad libitum. The room temperature (RT) was kept at 23 ± 1C and a 12:12-hr light:dark cycle was maintained throughout the experiment. All experimental procedures were conducted in accordance with the Japanese Physiological Society Guide for the Care and Use of Laboratory Animals as approved by the Tokai University School of Medicine Committee on Animal Care and Use and followed the American Physiological Society Animal Care Guidelines. The numbers of rats used at each time point and for each analysis are summarized in Table 1. For the histological and IHC analyses and the muscle fiber counts, the rats were sacrificed with an overdose of sodium pentobarbital (60 mg/kg IP). The plantaris muscle was removed bilaterally, trimmed of excess fat and connective tissue, wet-weighed, and then immediately frozen in isopentane pre-cooled by liquid nitrogen and/or prepared for further analysis (see below). Frozen samples were stored at −80C. For the remaining analyses, the methods for sample preparation are described below.
Determination of Muscle Fiber Number
The total number of fibers and the number of branched fibers in the plantaris muscle were determined using a modified nitric acid digestion method (Tamaki et al. 1989, 1992a, b, 1993, 1994, 1996). Briefly, the frozen muscle was thawed in distilled water for 10 min and immersed in 15% nitric acid (Wako Pure Chemical; Osaka, Japan) for 2–3 hr at RT. The muscle then was washed in cooled distilled water for 60 min at 4C. The solution was changed from distilled water to 0.01 M PBS, pH 7.4, and stored at 4C. Subsequently, small muscle fiber bundles were transferred to a silicone-coated Petri dish containing 0.01 M PBS (pH 7.4) at RT. All fibers were teased free, and the total numbers of “straight” and branched fibers were carefully and precisely counted under a dissection microscope (X10–15).
Summary of the number of rats used for each analysis
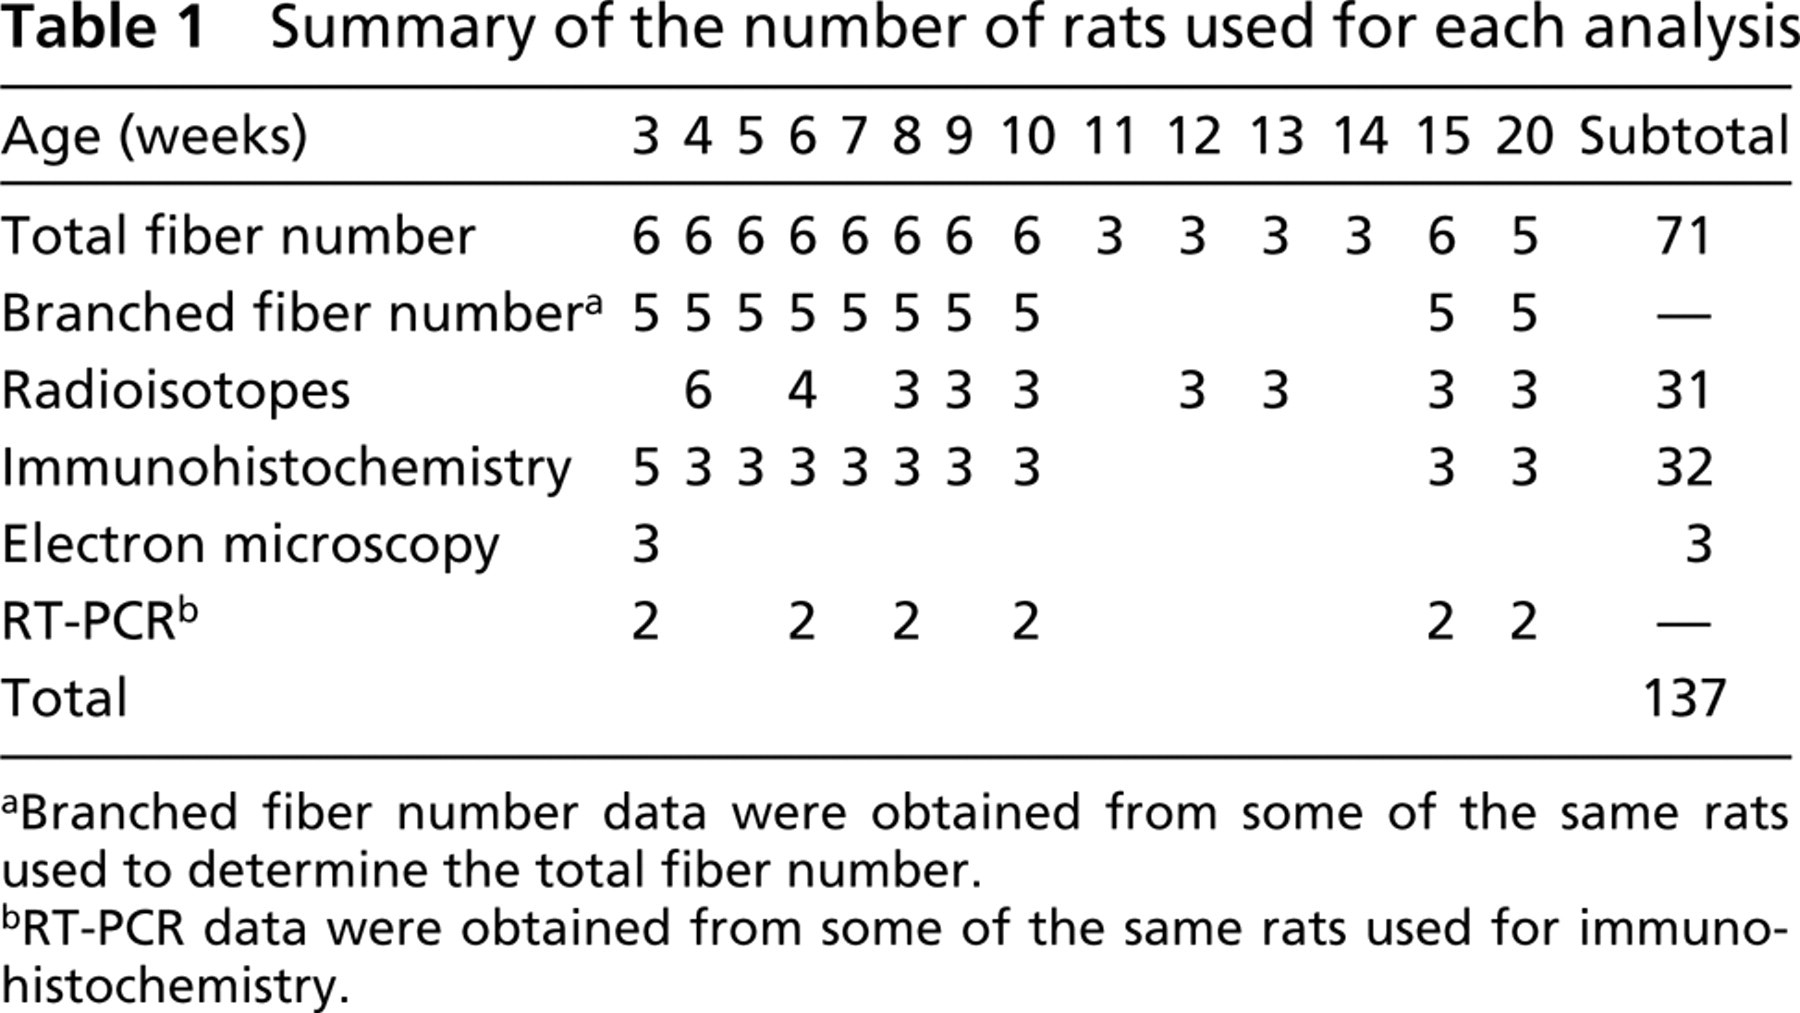
aBranched fiber number data were obtained from some of the same rats used to determine the total fiber number.
bRT-PCR data were obtained from some of the same rats used for immunohistochemistry.
Determination of Mitotic Activity and Amino Acid Uptake
Our previous studies indicate that in vivo [3H]thymidine and [14C]leucine labeling are useful methods to detect the mitotic activity and amino acid uptake in muscles, respectively (Tamaki et al. 1997, 2000, 2001). Analyses of mitotic activity and muscle amino acid uptake were determined in 4–20-week-old rats (n = 31; Table 1). [3H]-Thymidine (methyl [3H]); 15.5 MBq/kg IP; specific activity 247.9 GBq/mmol (NEN Life Science Products; Boston, MA) and [14C]-leucine ([14C](U)); 1.15 Mbq/kg, IP; specific activity 13.6 GBq/mmol (NEN Life Science Products) were injected 1 or 3 hr before sampling to label proliferating cells and proteins that use leucine during protein synthesis, respectively. The rats were sacrificed and the muscles prepared as described above. Each muscle was homogenized in 0.02 M phosphate buffer (PB; pH 7.4) at a 1:20 dilution at 4C. In the next step, 1 ml of the homogenate from each muscle sample was added to 5 ml of 10% trichloroacetic acid (TCA) and mixed well. This mixture was centrifuged (2050 × g for 10 min) and the upper solution (TCA) was removed. This procedure was repeated five times and the remaining TCA-insoluble material was collected and dried with 70% ethanol. The dried material was treated overnight with 1 ml of dissolving solution (Solvable; Packard, Meriden, CT) at 45C and then a 10-ml liquid scintillation cocktail (Atomlight; Packard) was added to count radioactivity (Beckman LS4800; Fullerton, CA). The total protein concentration in each homogenate was measured and the radioactivity of each sample was expressed in dpm (disintegration/min)/mg protein.
Determination of Myosin Synthesis
Determination of the synthesis of the contractile component was performed at the same time points and for the same muscles as for the analysis of mitotic activity and amino acid uptake. The contractile component (mostly myosin) was extracted with 0.6 M KCl solution (50 ml) from a 1-ml homogenate for 15 min at 4C and filtered with three sheets of gauze. The extracted KCl solution was diluted with cool distilled water (1:20), which resulted in the reappearance of myosin deposits. The diluted solution was passed through an omnipore non-dissolving membrane filter (10 μm aperture and 47 mm diameter; Nihon Millipore, Yonezawa, Japan). The membrane containing the deposits was dried, cut into several pieces, and soaked in a dissolving solution overnight at 45C. The radioactivity was counted using the same procedures employed for the mitotic activity and protein synthesis analyses. Values were expressed as dpm/mg protein.
Histological and Immunohistochemical Analyses
Histological and IHC analyses were performed in 3–20-week-old rats (Table 1). 5-Bromo-2′-deoxyuridine (BrdU; Takeda Chemical, Osaka, Japan), a non-radioactive marker for DNA synthesis, was injected (100 mg/kg IP) 1 hr before sampling. This procedure labels proliferating cells in muscle (Tamaki et al. 1997, 2000). Each frozen muscle was equilibrated at −20C and transversely cut into three (for 3–6-week-old muscle) to six (for 8–20-week-old muscle) blocks of approximate equal length. Serial transverse sections (7 μm thick; 10–18 sections) were cut from each block to allow full characterization of the entire muscle (Tamaki et al. 1996). Hematoxylin-eosin (H&E) staining was performed on four to eight sections to examine the general morphology and to determine the cross-sectional area (CSA) of individual fibers. Digital photographs were taken from each muscle section stained with H&E and analyzed by a microcomputer and NIH imaging software. The overall mean CSA of ∼100 fibers and whole-muscle cross-sectional area (used for the comparison of the number of BrdU- and MyoD-positive cells/mm2) was determined from a cross-section of each muscle at each time point. The data are expressed as mean ± SE.
For the remaining six to ten sections, IHC staining was performed using BrdU (1:50, monoclonal anti-BrdU; Becton-Dickinson, San Jose, CA) or MyoD (1:50, monoclonal anti-MyoD1, 5.8A; Dako, Carpinteria, CA), antibodies to identify proliferating (BrdU) and myogenic (MyoD) cells. The numbers of cells reacting positively for anti-BrdU and MyoD per whole-muscle cross-section were counted under a light microscope and reported as mean ± SE/mm2. Monoclonal anti-myogenin (1:100, F5D; Dako) and monoclonal anti-developmental myosin heavy chain (1:40, NCL-MHCd; Novocastra, Newcastle, UK) antibodies were used to determine whether myogenic cells had differentiated into myotubes or myofibers. Monoclonal anti-laminin (1:100; Chemicon International, Temecula, CA) antibody was used to identify the basal lamina and to determine whether the myogenic cells were located inside and/or outside of the basal lamina of the parent fiber. Goat polyclonal anti-M-cadherin (1:200, N-19; Santa Cruz Biotechnology, Santa Cruz, CA) and goat polyclonal CD34 (1:50, C-18; Santa Cruz Biotechnology) antibodies were used to determine whether the myogenic cells corresponded to satellite cells, as has been reported previously (Irintchev et al. 1994; Beauchamp et al. 2000; Lee et al. 2000). Anti-mouse IgG F(ab')2 from sheep combined with horseradish peroxidase (1:75; Amersham International, Poole, UK) was used as the secondary antibody for BrdU staining and biotinylated rabbit anti-mouse (1:200; Dako) and anti-goat (1:400; Dako) were used as the secondary antibody for the other immunostainings. For the BrdU immunostaining, the sections were fixed in 70% ethanol for 15 min at 4C and treated with 100% methanol containing 0.3% H2O2 to inhibit endogenous peroxidase for 30 min at RT. The sections then were treated with 2 N HCl for 60 min at RT for DNA denaturation, followed by washing in 0.01 M PBS (pH 7.4). Immunoreactivity was visualized by the biotin-avidin complex peroxidase reaction (Dako) and 0.02% 3,3-diaminobenzidine (DAB; the reaction products were brown and/or dark brown; Wako Pure Chemical) and 0.02% 4-chloro-1-naphthol (the reaction products were gray and/or purple; Wako Pure Chemical)/0.05M Tris-HCl buffer, pH 7.4, containing 0.005% H2O2. Individual cells were characterized from the staining patterns on serial sections or from individual sections with double or triple immunostaining. For example, first the immunostaining was visualized by DAB and photographed. The sections then were immersed in 0.1 M glycine-HCl buffer (pH 2.2) for 1 hr at RT to remove the antibodies (reaction products of DAB remained). The sections were washed well in PBS and the second immunostaining was started. These reactions were visualized by 4-chloro-1-naphthol. Two reaction colors can be seen in a section at this time. In some instances the sections were counterstained with methyl green and eosin to identify nuclei and the entire cytoplasm of all muscle fibers.
Electron Microscopy
Electron microscopic analyses of the plantaris muscle from 3-week-old rats were performed (n = 3; Table 1). The animals were anesthetized with sodium pentobarbital (60 mg/kg IP) and immediately perfused with PBS and 2% paraformaldehyde and 1% glutaraldehyde/0.05 M PB, pH 7.4. The plantaris muscles were carefully dissected and placed in the same fixative for 2 hr at 4C. Each muscle then was divided into three portions in the same manner as described for the IHC analyses. Each portion was divided into small pieces and fixed overnight in 2.5% glutaraldehyde/0.05 M PB at 4C. The samples were washed in 0.1 M PB and fixed in 1% osmium tetroxide/0.05 M PB for 3 hr at 4C. After fixation, the samples were dehydrated with serial graded ethanol and acetone and were prepared for electron microscopic analysis.
Reverse Transcriptase-polymerase Chain Reaction (RT-PCR) Analyses
Expression of MyoD mRNA was analyzed in 3-, 6-, 8-, 10-, 15-, and 20-week-old rats (two rats at each time point, n = 12; Table 1). The plantaris muscles stored at −80C were equilibrated at −20C and 200–300 sections (15 μm thick) were cut from each muscle with a cryostat. Sections were collected in microtubes under RNase-free conditions and total RNA was extracted with Trizol reagent (Life Tech; Boston, MA). RNA quantity was determined by an optical density measurement at 260 nm. Primer pairs and the nucleotide position used for PCR amplification of MyoD mRNA were as follows: MyoD-forward, 5′-GTGCAAGCGCAAGACCACTAA-3′ and MyoD-reverse, 5′-TGCAGACCTTCAATGTAGCGG-3′ (182 bp). RT-PCR was performed using an RNA-PCR kit (Perkin-Elmer; Norwalk, CT). To enable a comparison among the six age groups, 25 and 28 PCR cycles were chosen: β-Actin-forward, 5′-TGCAGAAGGAGATTACTGCC-3′ and β-actin reverse, 5′-GCAGCTCAGTAACAGTCC-3′ (211 bp) was used as a stably expressed reference mRNA (an internal control) (Suopanki et al. 1999). Primer concentration of β-actin and MyoD was 1:5.
Statistics
All data are presented as mean ± SE.
Results
Changes in Body and Plantaris Mass
Both the body and plantaris muscle masses rapidly increased until 10 weeks of age (∼10-fold increase, Figure 1). For the next 10 weeks the growth rate was slower. The growth curves for the body and plantaris masses were parallel, with the plantaris mass consistently being ∼0.1% of the body mass. The numbers of rats used for each of the following analyses are listed in Table 1.
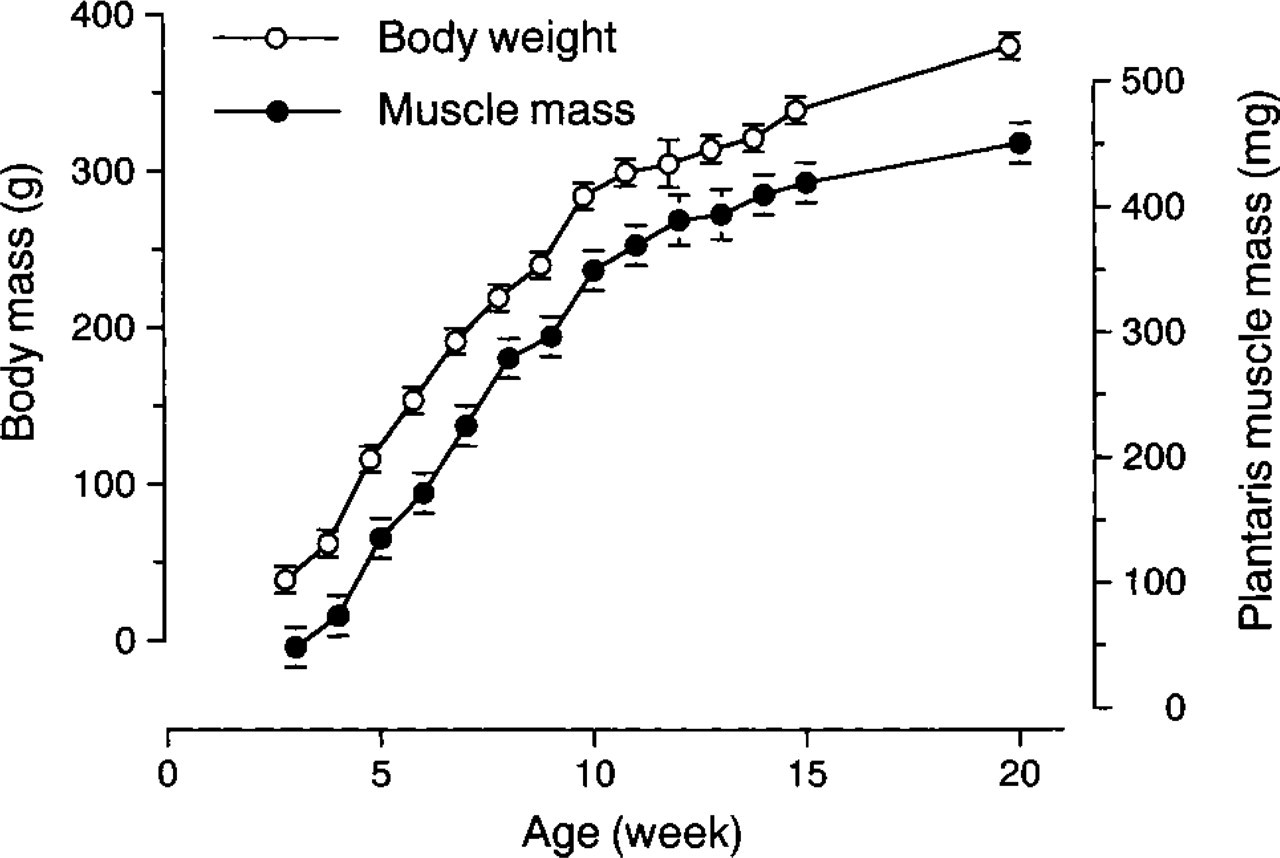
Increases in body and plantaris muscle mass during postnatal weeks 3–20. The growth curves are nearly parallel, showing a rapid increase up to about 10 weeks and a less rapid increase thereafter. Open circles, body weight; closed circles, plantaris muscle weight.
Total Number of Fibers and Branched Fibers and Mean CSA of the Fibers in the Plantaris Muscle
The mean total number of fibers in the plantaris muscle increased by 28% from 3 (8737 ± 162) to 10 (11,215 ± 451) weeks of age. Total fiber number then was consistent (∼11,000 fibers) until 20 weeks of age (Figure 2A). The number of branched fibers was similar throughout the experimental period, i.e., an average of ∼30 branched fibers or ∼0.3% of the total fiber number (Figure 2B). The pattern of increase in fiber CSA was similar to that observed for body and plantaris mass, a rapid increase up to ∼10 weeks and a slower rate thereafter (compare Figures 1 and 2C).
Thymidine and Amino Acid Uptake Rates and Fraction of Amino Acid Uptake for Myosin
The uptake of [3H]-thymidine rapidly decreased from 4 to 8 weeks and was consistently low thereafter (Figure 2D). The uptake of [14C]-leucine (Figure 2E) and of the myosin fraction (Figure 2F) also decreased rapidly from 4 to 8 weeks, but both were slightly elevated during weeks 10–13. The pattern of change for these parameters was almost inverse to the volumetric and numerical measurements, i.e. body and muscle mass, total fiber number and mean fiber CSA (compare Figures 2A and 2C vs Figures 2D–2F).
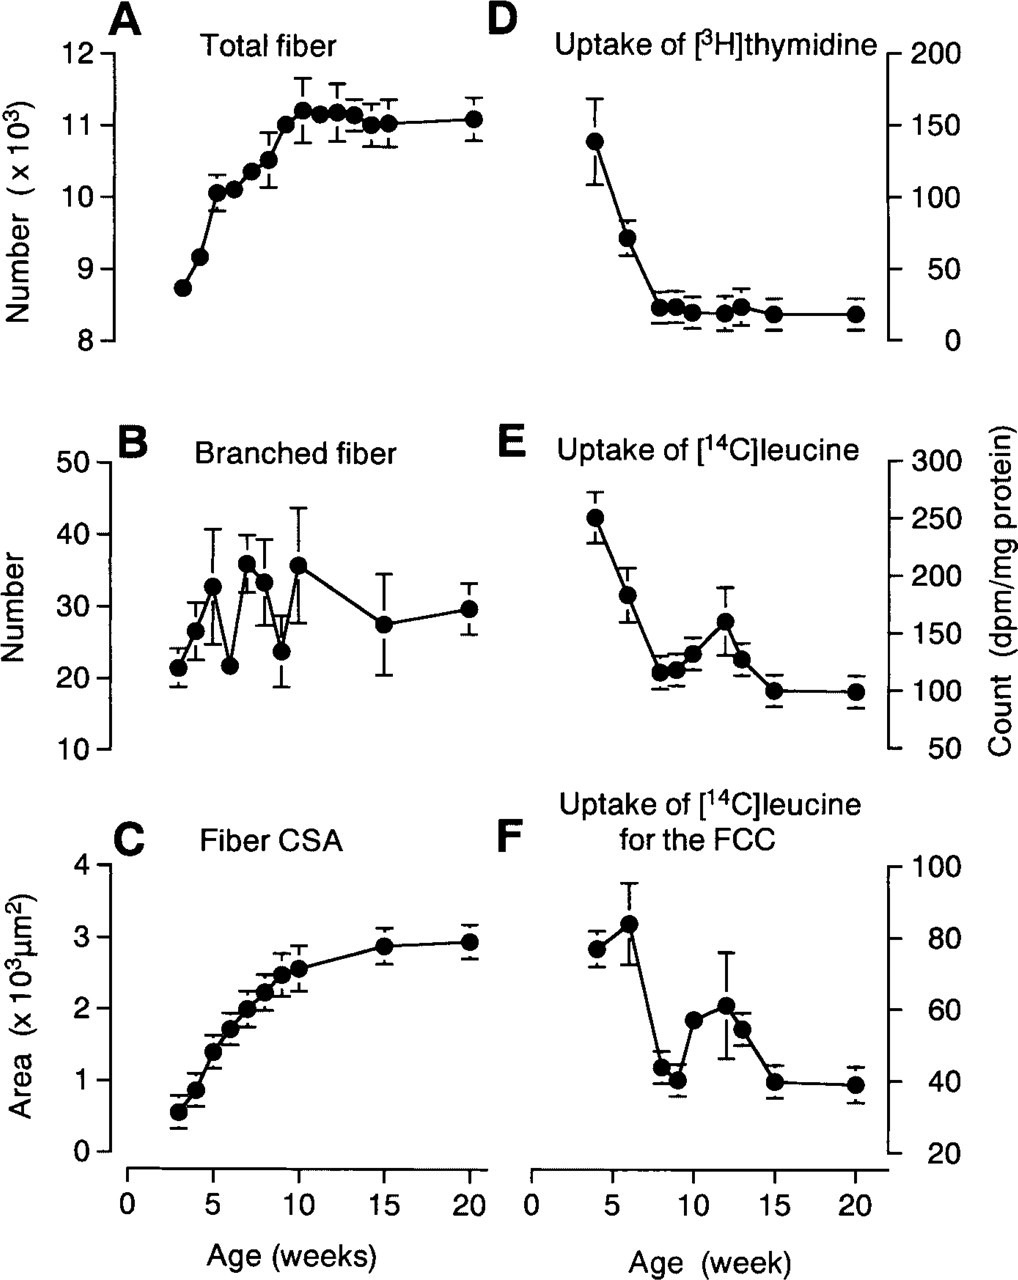
Changes in total fiber number
Changes in the Number of BrdU- and MyoD-positive Cells
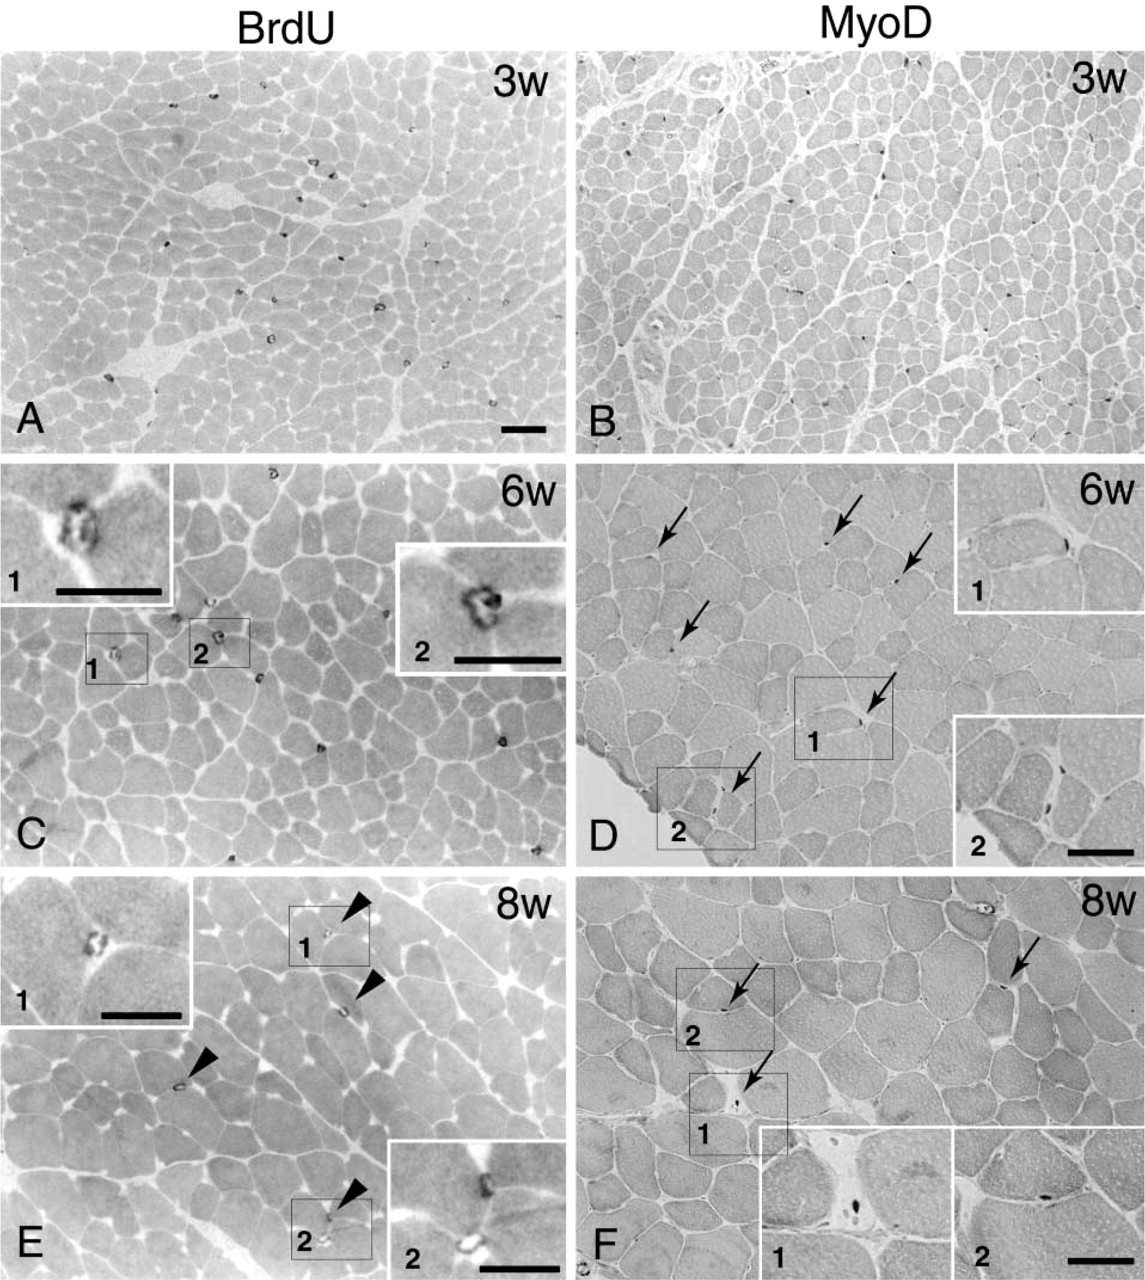
Typical immunostaining for BrdU (Figures 3A, 3C, and 3E) and MyoD (Figures 3B, 3D, and 3F) from 3-(Figures 3A and 3B), 6- (Figures 3C and 3D) and 8-(Figures 3E and 3F) week old rats is shown in Figure 3. All photographs were taken at the same magnification (X120) except for the insets (X230–365) and clearly show the increase in fiber size from 3 to 8 weeks of age. The number of BrdU-positive cells was consistently higher than the number of MyoD positive cells up to 8 weeks of age. The numbers of anti-BrdU-and MyoD-positive cells rapidly decreased from 3 to 8 weeks of age and were undetectable at 20 weeks of age (Figure 4). The pattern of decrease was similar to that observed for [3H]-thymidine uptake (Figure 2D).
Expression of MyoD mRNA
The expression of MyoD mRNA levels was consistent with the protein determinations (IHC), being highest at 3 weeks of age and then gradually reducing with age. The lowest levels were observed in 20-week-old rats (Figure 5).
Localization of MyoD- and Myogenin-positive Cells
Relative to all of the ages being studied, the plantaris muscle of 3-week-old rats had the highest mitotic activity, amino acid uptake, and MyoD mRNA expression when expressed per unit of tissue or protein. Therefore, we used the muscles from 3-week-old rats to investigate the distribution of myogenic cells. MyoD- and myogenin-positive cells were identified in cross-sections double labeled for laminin and MyoD or for laminin and myogenin (Figures 6A–6H). Approximately 70% of the MyoD-positive cells were located inside the basal lamina of the parent fiber, as shown in Figure 6D. The remaining 30% of the MyoD-positive cells were located in the interstitial spaces (Figures 6A–6C). A similar distribution pattern was observed for myogenin-positive cells (Figures 6E–6H), although the frequency of occurrence was somewhat lower than that for MyoD-positive cells (data not shown). Myogenin-positive cells also were observed inside the basal lamina of parent fibers (Figure 6E) and in the interstitial spaces (Figures 6F–6H). Very little cytoplasm was observed in MyoD-positive cells (insets in Figures 6B and 6C), while myogenin-positive cells had a small amount of cytoplasm (insets in Figures 6G and 6H).
Representative cross-sections of the plantaris muscle 3
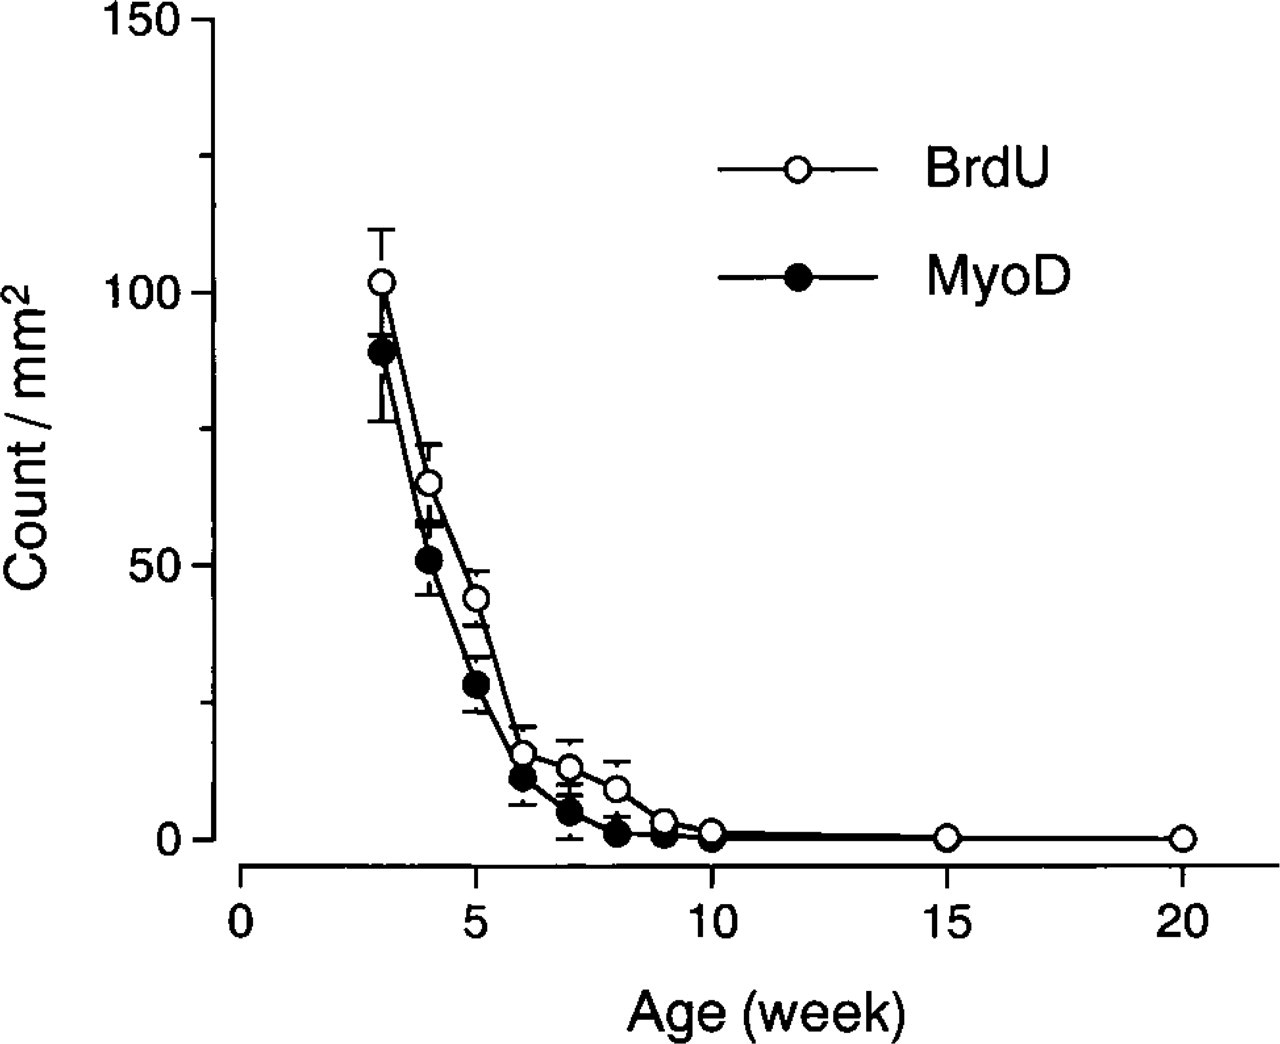
Changes in the number of BrdU- and MyoD-positive cells in the plantaris muscle during postnatal weeks 3–20. The numbers of BrdU- and MyoD-positive cells decreased from 3 to 8 weeks and then were consistently low thereafter. There were few (∼1–3/section) MyoD-positive cells between 10 and 20 weeks and BrdU-positive cells at 20 weeks. Values are mean count ± SE/mm2.
We also detected about 15–20 small fibers per cross-section that expressed developmental MHC (Figure 6I). A high-magnification photograph of a small fiber positive for developmental MHC is shown in Figure 6J. Serial sections show that this small fiber has myogenin-positive central nuclei and laminin-positive basal lamina (Figure 6K), and eosin-positive cytoplasm (Figure 6L). Myogenic cells also were identified clearly by electron microscopy (Figures 7A–7D). Small fibers containing myofilaments and surrounded by a basal lamina were evident in the interstitial spaces, usually near capillaries (Figures 7A, 7C, and insets). The location of these small fibers (Figure 7D) was consistent with the presence of small MyoD- and myogenin-positive cells identified by immunohistochemistry (Figures 6A, 6C, 6F–6H). Activated (mitotic) satellite cells were evident in the electron micrographs (Figure 7B) and corresponded to the immunostaining of satellite cells (Figures 6D and 6E).
Characterization of Myogenic Cells
A large number of M-cadherin-positive reactions were observed in the muscles of 3-week-old rats (Figure 8A, black arrowheads) and this was similar to the number of MyoD-positive cells per entire muscle cross-section at this time point (Figure 4). The number of M-cadherin-positive reactions gradually decreased with age (Figure 8B) and only 10–15 reaction products per cross-section were observed in the muscles of 8-week-old rats. Again, this was similar to the incidence of MyoD-positive cells at the same time point as shown in Figure 4. Double labeling with M-cadherin and laminin showed that M-cadherin-positive reactions were always located inside the basal lamina and stained most intensely on the side of the satellite cells facing the muscle fiber (Figures 8B, 8C, and 8E). No positive reactions were seen in the interstitial spaces. Some of the cells staining positive for M-cadherin also expressed MyoD (marked by black arrowheads and arrows in Figures 8C–8F), whereas others did not (marked by black arrowheads only in Figures 8C–8F). CD34-positive cells typically were located in the interstitial spaces outside the basal lamina (white arrowheads in Figure 8G and in insets 1 and 2). There were ∼30–40 CD34-positive cells per entire muscle cross-section of 3-week-old rats, a number similar to that of MyoD-positive cells per section in the interstitial spaces (see above). However, we did not find any cells that co-expressed CD34 and MyoD.
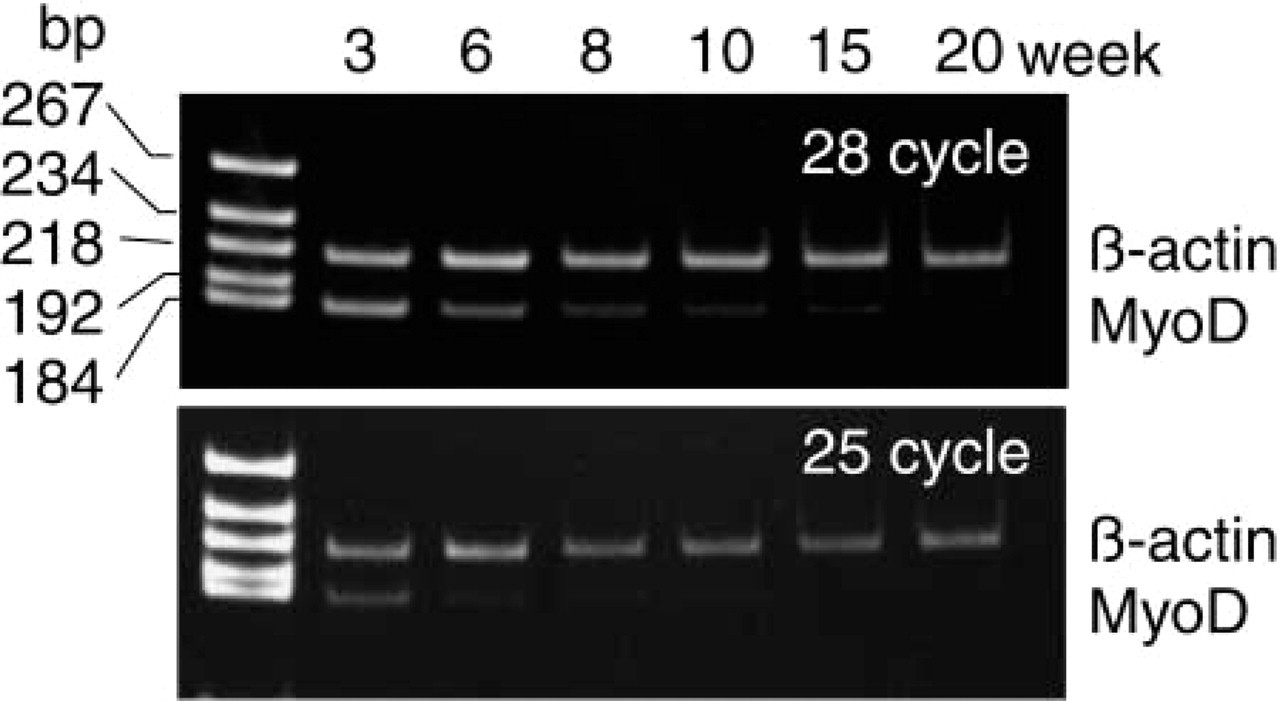
Levels of MyoD mRNA measured by RT-PCR in the plantaris muscle at postnatal weeks 3, 6, 8, 10, 15, and 20. The expression level of mRNA was confirmed using two RT-PCR cycles, i.e., 25 and 28. The highest level of MyoD mRNA was observed at 3 weeks and the lowest at 15 and 20 weeks. bp, base pair.
Discussion
Muscle Fiber Hyperplasia
The postnatal increase in the total number of fibers in the rat plantaris muscle from ∼8550 fibers at 3 weeks to ∼11,000 [consistent with that reported by Gollnick et al. (1981) for the adult rat plantaris] fibers at 10 weeks clearly indicates that hyperplasia and fiber hypertrophy occurred during this early rapid growth phase (Figure 2A). The total number of fibers was consistent between postnatal weeks 10 and 20, whereas volumetric parameters, such as muscle mass and fiber CSA, continued to increase, although at a slower rate (Figsures 1 and 2C). Combined, these results indicate that the contribution of an increase in fiber number to the increase in total plantaris mass is limited to the “rapid growing phase (3 to 10 weeks)” of postnatal growth in the rat. In contrast, the number of branched fibers was constant throughout postnatal weeks 3–20 (Figure 2B). It therefore appears that the myogenic responses described below were related to increases both in total fiber number and in the size of existing fibers.
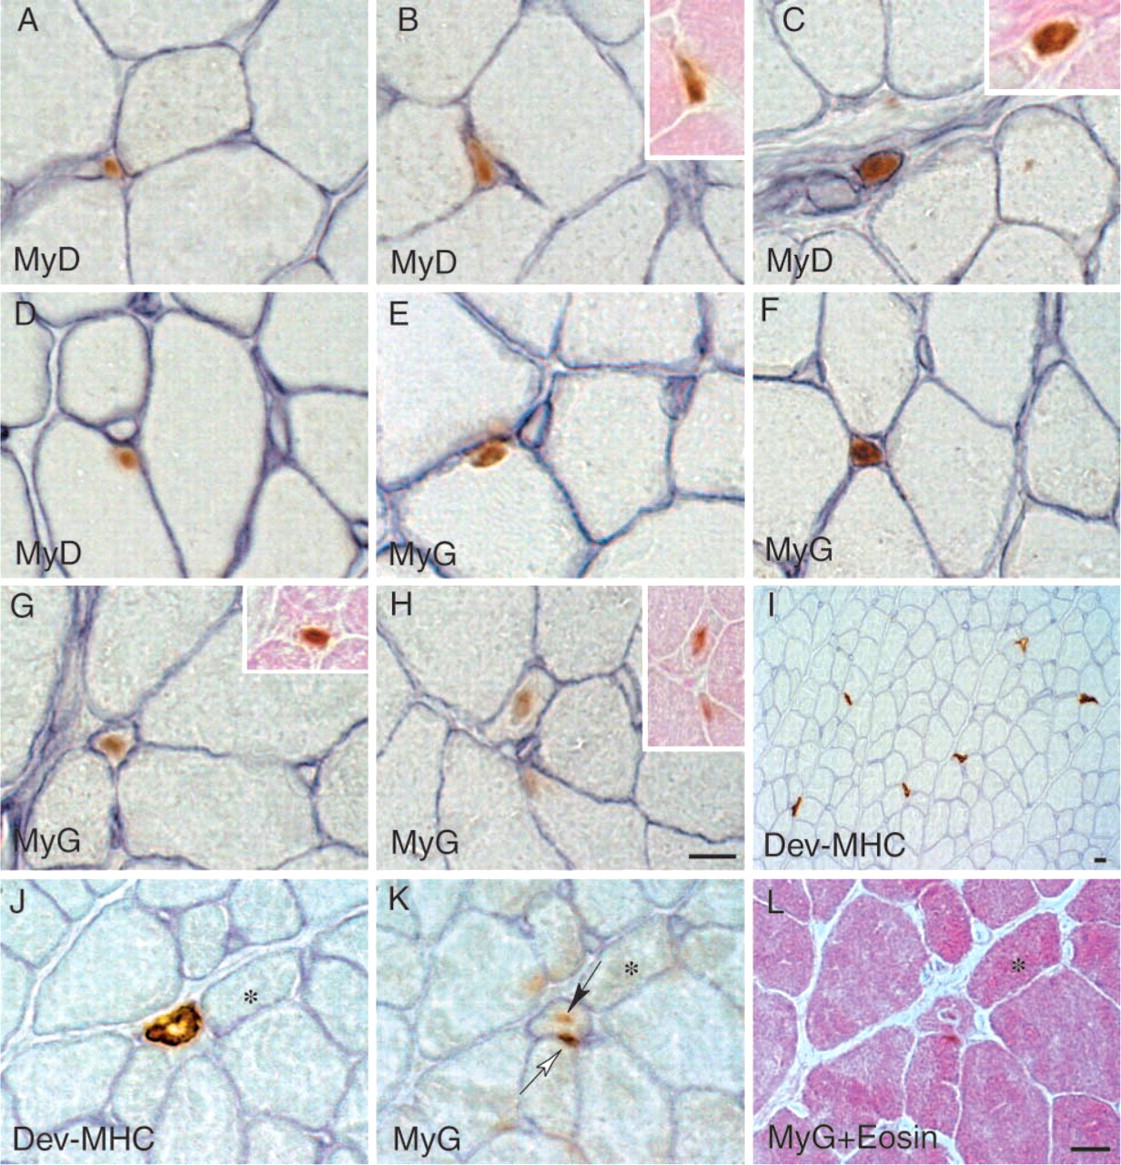
Localization of anti-MyoD-, myogenin-, and developmental MHC-positive cells in the plantaris at postnatal week 3.
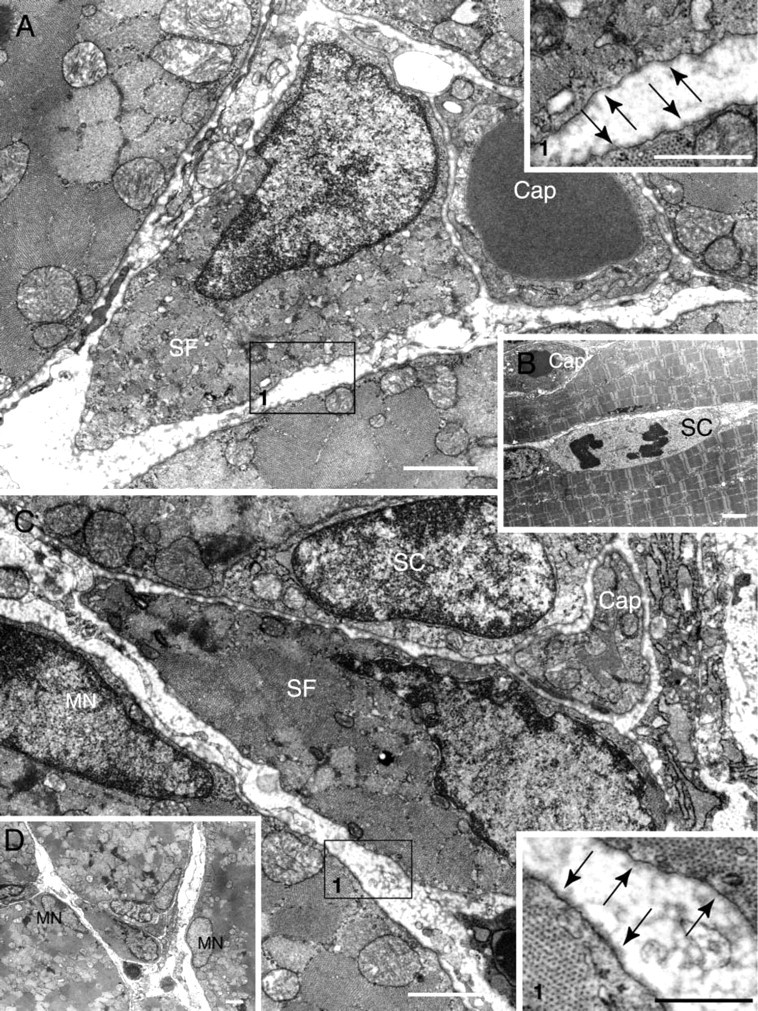
Electron micrographs of plantaris muscle obtained from 3-week-old rats. Small fibers having contractile filaments and covered with a basal lamina (arrows in insets) are evident in the interstitial spaces (
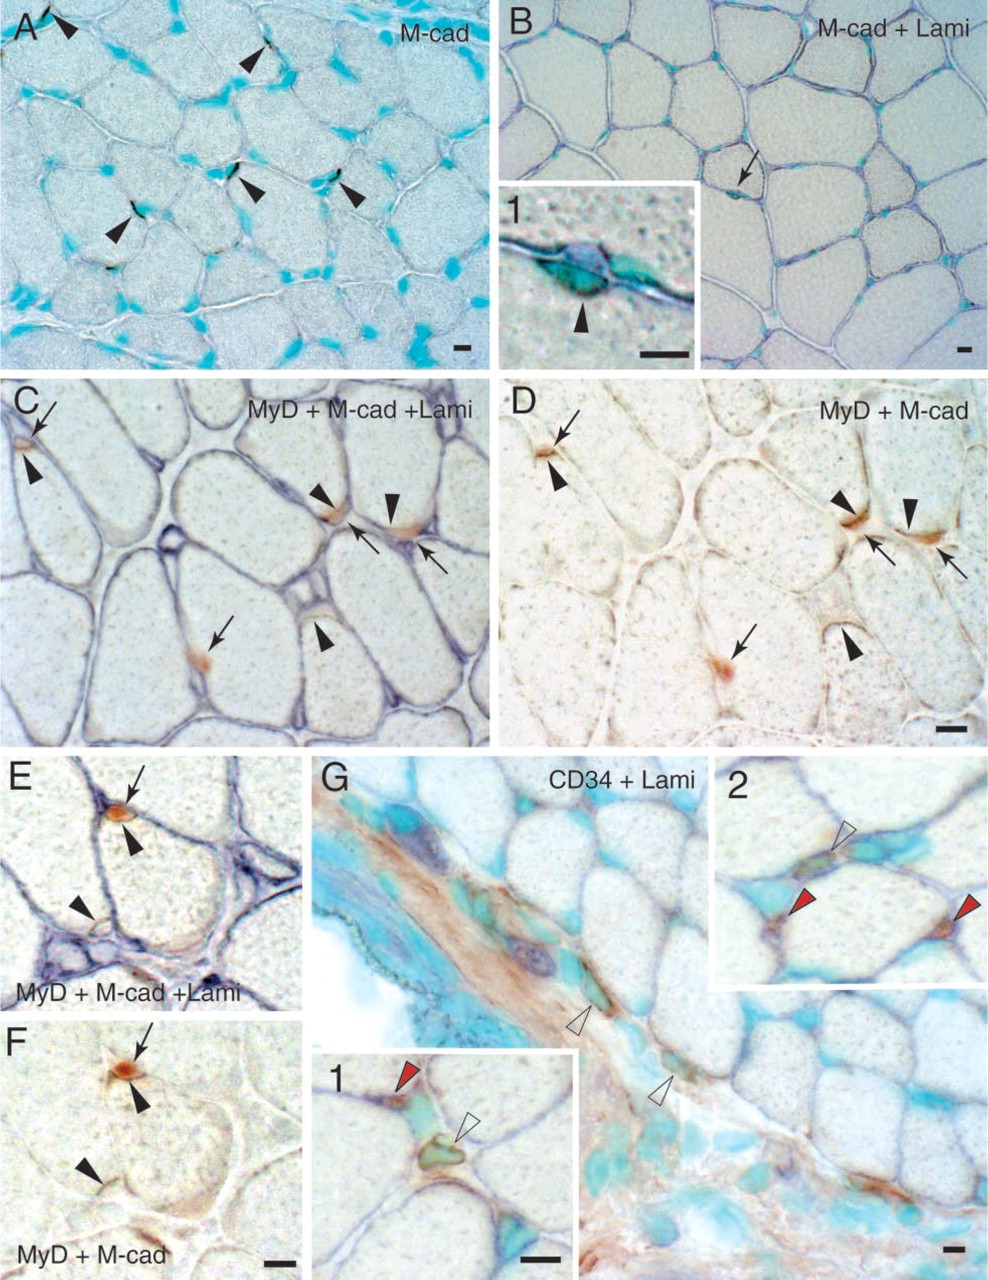
Characterization of myogenic cells using anti-M-cadherin and CD34 in combination with MyoD and laminin labeling.
Whole-muscle Mitotic and Myogenic Activity
During postnatal weeks 3–10, the decrease in plantaris muscle mitotic activity, as measured by [3H]-thymidine uptake, was inversely related to the increase in total fiber number (compare Figures 2A and 2D). In addition, the decrease in [3H]-thymidine uptake was paralleled by a decrease in the number of BrdU- and MyoD-positive cells per section (Figure 4) and a decrease in the levels of MyoD mRNA (RT-PCR; Figure 5), although the number of BrdU-positive cells was consistently higher than the number of MyoD-positive cells up to 8 weeks of age, most likely reflecting the proliferation of endothelial cells and/or fibroblasts that contribute to the formation of additional capillaries and connective tissues during these developmental stages (Figure 4). These data also suggest that the majority of mitotic activities during this period are related to the myogenic response.
The reduction of postnatal replication of myogenic precursor cells (mpc) in a range of species has been reviewed by Grounds and Yablonka-Reuveni (1993). In rat hindlimb muscles, a significant replication of mpc is seen at 2 weeks of age, and this decreases only slightly at 3 weeks of age. There is still significant replication at 4 weeks postnatally (Schultz et al. 1985), and the number of muscle nuclei appear to roughly double between 5 and 11 weeks of age (Enesco and Puddy 1964). Combined, these reports indicate that some mpc are proliferating between the 3–10-week period observed in the present study. Similarly, quantitation of decreasing MyoD and myogenin mRNA as measures of postnatal myogenesis after aging have been reported for mouse muscle, although the expression was more rapidly reduced to adult levels by 3 weeks of age (Beilharz et al. 1992). These adaptations in mitotic and myogenic activity were reflected in the changes in total amino acid uptake and the uptake of leucine for the contractile component fraction (Figures 2E and 2F), as well as fiber hypertrophy (Figure 2C). The relatively high levels of amino acid uptake are consistent with the high levels of protein synthesis required for the muscle hypertrophy and hyperplasia occurring during this rapid growth phase. Although protein synthesis (as reflected by the uptake levels of [14C]-leucine) decreased during the rapid growth phase, these levels were higher than those reached at the end of the rapid growth phase and were associated with an increase in mean fiber size. The increases in both total amino acid uptake and the uptake for the contractile component around postnatal weeks 10–15 most likely reflect fiber hypertrophy during the “maturation phase,” because fiber hyperplasia is complete at ∼10 weeks postnatally.
Formation of De Novo Fibers in the Interstitial Spaces
Based on the large number of MyoD-positive cells at postnatal week 3 (Figure 3), we investigated the possibility of the formation of “new” fibers during the rapid growth phase of the plantaris muscle. Double labeling with MyoD and laminin showed MyoD-positive cells within the basal lamina, i.e., satellite cells (Figure 6D), and these cells comprised ∼70% of the total number of MyoD-positive cells. The remainder of the MyoD-positive cells were located in the interstitial spaces (Figures 6A–6C). There was a tendency for myogenin positive cells to be distributed similarly (Figures 6E–6H), although the frequency was somewhat lower than for MyoD-positive cells. These observations indicate that myogenic cells located either inside or outside of the basal lamina may differentiate to the stage of myotube formation. Developmental (neonatal) MHC-positive cells with a small diameter also were observed at postnatal week 3 (Figure 6I) and were located between large-diameter fibers (parent fibers). This observation indicates that myogenin-positive cells located in the interstitial spaces must have differentiated from a myotube to a myofiber, since these myogenin-positive cells had a small amount of cytoplasm (insets of Figures 6G and 6H), stained for developmental MHC, and expressed myogenin (Figures 6J and 6K). Furthermore, electron microscopic analyses clearly demonstrated small fibers with a sparse amount of myofilaments that were surrounded by basal lamina in the interstitial spaces and often associated with a capillary (Figures 7A, 7C and insets). All of these observations are consistent with de novo fiber formation in the interstitial spaces in addition to the activation of satellite cells (mitosis) inside of the basal lamina sheath of parent fibers (Figure 7B) and probably reflect the addition of myonuclei associated with fiber hypertrophy of parent fibers.
Consideration must be given to the possibility that the small fibers observed in the interstitial spaces could be split and/or branched fibers (Tamaki et al. 1992a, b, 1993, 1996; Tamaki and Akatsuka 1994). Two mechanisms have been proposed for the formation of branched fibers. First, these fibers could be formed by incomplete fusion of newly formed fibers with one another or with mature fibers (James 1973; Schmalbruch 1976; Ontell et al. 1982; Snow and Chortkoff 1987). Second, these fibers could be the result of the longitudinal fragmentation of a mature fiber (Edgerton 1970; Hall-Craggs 1970, 1972; Ho et al. 1980). The number of branched fibers, however, was consistently low throughout the experimental period (Figure 2B), indicating that the observed myogenic responses were not associated with a change in branched fibers in the present study.
Possible Sources of Myogenic Cells in the Interstitial Spaces
There are two possible sources for the myogenic cells associated with the observed de novo fiber formation in the interstitial spaces. First, activated satellite cells could have migrated from their normal location within the basal lamina into the interstitial spaces, then proliferated, fused, and formed new fibers. Second, the de novo fibers could be derived from unidentified myogenic cells existing in the interstitial spaces. Migration of satellite cells has been demonstrated both in vitro (Konigsberg et al. 1975; Bischoff 1990) and in vivo (Lipton and Schultz 1979; Roth and Oron 1985; Schultz et al. 1985, 1986; Hughes and Blau 1990; Phillips et al. 1990). It appears that satellite cells can readily migrate and move to a large extent along the longitudinal axis of the muscle fibers in vivo (Roth and Oron 1985; Schultz et al. 1985), whereas their lateral motion is quite limited between muscles or muscle fibers with intact connective tissue sheaths (Grounds et al. 1980; Hughes and Blau 1990). In addition, the migration of satellite cells into the interstitial spaces, as reported above, has been observed after muscle damage and/or alterations in the basal lamina, or with direct injections of retroviruses into the muscle (Lipton and Schultz 1979; Roth and Oron 1985; Schultz et al. 1985, 1986; Hughes and Blau 1990; Phillips et al. 1990). In the present study, however, the muscles were obtained from normal, sedentary growing rats. Therefore, the possibility that activated satellite cells migrated into the interstitial spaces through an intact basal lamina and formed new fibers appears unlikely.
In the present study, we characterized the interstitial myogenic cells via MyoD, myogenin, M-cadherin and CD34 immunostaining, all reported possible markers for satellite cells. MyoD- and myogenin-positive cells were located both inside the basal lamina of the parent fiber and in the interstitial spaces in the plantaris muscle of 3-week-old rats. This staining indicates the presence of myogenic cells in both locations, with the former being satellite cells. M-cadherin is a specific marker for satellite cells and it has been reported that (a) the frequency of M-cadherin-labeled cells was higher in the soleus muscles of 2-week-old than of adult mice, (b) M-cadherin was expressed whether a satellite cell was quiescent, activated, or replicating, and (c) M-cadherin staining was more intense at the side of the satellite cells facing the muscle fiber (Irintchev et al. 1994). In the present study, many positive reactions for M-cadherin were seen within the basal lamina of parent fibers (Figures 8C and 8E). Some of these M-cadherin-positive cells co-expressed MyoD, but some did not (Figures 8C–8F), indicating that both activated and quiescent satellite cells expressed M-cadherin. The number of M-cadherin-positive reactions was relatively high in the muscles of 3-week-old and rare in 8-week-old rats (Figures 8A and 8B). These patterns of immunoreactivity for M-cadherin are consistent with the findings of Irintchev et al. (1994). However, no M-cadherin-positive cells were observed in the interstitial spaces. This may be good evidence that interstitial myogenic cells are not derived from M-cadherin-positive satellite cells that initially reside within the basal lamina. Combined, these observations clearly indicate that the myogenic cells located in the interstitial spaces are M-cadherin-negative and therefore are most likely different from satellite cells that express M-cadherin.
It has recently been reported that CD34, an established cell surface marker for hematopoietic stem cells, is a useful marker for quiescent mouse satellite cells and C2C12 mouse myoblast cells (Beauchamp et al. 2000; Lee et al. 2000). In the present study there were no CD34-positive cells within the basal lamina of parent fibers, but several (∼30–40 per muscle cross-section) CD34-positive cells were observed in the interstitial spaces (Figure 8G and insets 1 and 2). Capillaries (red arrowheads, insets 1 and 2 in Figure 8G), muscle spindle capsules, and axons (data not shown) also were CD34-positive, consistent with previous observations (Baumhueter et al. 1994). Although the CD34-positive cells in the interstitial spaces did not co-express MyoD (data not shown), a finding similar to that reported by Beauchamp et al. (2000) for cultured C2C12 cells, the location of the CD34-positive cells in the interstitial spaces (Figure 8G and insets 1 and 2) was similar to the location of myogenic cells as identified by MyoD and myogenin immunostaining (Figures 6A–6C and 6F–6H) and in electron micrographs (Figures 7A and 7C). Furthermore, the frequency of CD34-positive cells per section (30–40/section) was similar to the frequency of MyoD-positive cells per section in the interstitial spaces. Our observations indicate that only the interstitial cells are CD34-positive. However, satellite cells have been reported to be CD34-positive (Beauchamp et al. 2000; Lee et al. 2000). The reason for this discrepancy is unknown. However, satellite cells are believed to be highly committed myogenic precursor cells, whereas stem cells are pluri/multipotential. Therefore, we hypothesize that the CD34-positive cells in the interstitial spaces are primitive stem and/or progenitor cells and may become myogenic (i.e., MyoD and/or Myf5 expression) during the early growth phase of the rat plantaris muscle.
A Suggested Myogenic Cell Population Distinct from the Satellite Cell
Several lines of evidence suggest the possibility for myogenic cell populations distinct from satellite cells. For example, the progeny of a single human satellite cell generate both differentiated myotubes and quiescent cells that are undifferentiated, but still myogenic, under differentiation-inducing culture conditions (Baroffio et al. 1996). Another in vitro study demonstrated that myogenic cells derived from C2C12 cells differentiate not only into myotubes, but also into undifferentiated (quiescent) reserve cells by the downregulation of MyoD (Yoshida et al. 1998). Beauchamp et al. (1999) also suggested the existence of a subpopulation of myogenic cells with stem cell-like characteristics. When primary cultured myogenic precursor cells, prepared by enzymatic dissociation of leg muscles from 1-day-old male mice (C57B/10), were transplanted into immunodeficient irradiated mdx mice, the majority of the grafted cells quickly died and only a minority were responsible for new fiber formation. This minority was behaviorally distinct, slowly dividing in tissue culture but rapidly proliferating after grafting. Distinct populations of myogenic cells also have been suggested by in vivo studies. During fetal muscle development and growth, myonuclei migrate from the center of the fiber to the periphery after the maturation of the muscle fiber, since postnatal regenerated fibers derived from satellite cells permanently show central nuclei in the fibers of rodent muscles (Grounds et al. 1980; Pastoret and Sebille 1995). Combined, these observations suggest the possibility that myogenic cells in fetal muscle and satellite cells in postnatal muscle are different cell populations.
In the present study, we found an ∼28% increase in the mean total fiber number in the plantaris muscle between postnatal weeks 3 and 10. There were very few centrally nucleated fibers in the muscles from young adult (20-week-old) rats. Therefore, it is possible that the new fiber formation observed in the postnatal rapid growth phase was not induced by satellite cells but that myogenic cells similar to fetal myogenic cells remained in the interstitial spaces and formed new fibers. Furthermore, recent transplantation studies have identified a population of pluripotent stem cells, called side-population (SP) cells that are mostly CD34-negative, in adult mouse skeletal muscle whose nuclei can be incorporated into muscles of mdx mice and partially restore dystrophin expression in the affected muscle fibers (Gussoni et al. 1999; Jackson et al. 1999). Ferrari et al. (1998) further demonstrated that arterial delivery of bone marrow-derived myogenic progenitor cells contributed to muscle regeneration of immunodeficient scid/bg mice. In addition, Young et al. (1995) suggested that both lineage-committed progenitor and lineage uncommitted pluripotent mesenchymal stem cells are located within the connective tissue compartments of many tissues and organs in the chick embryo. All of these observations suggest that the satellite cell is not the only myogenic cell that can contribute to the maintenance of growth in postnatal skeletal muscle.
On the basis of results of the present and related previous studies, it appears that (a) myogenic precursor cells distinct from satellite cells exist in the interstitial spaces of the plantaris muscle during the rapid postnatal growth phase, (b) these cells could be main contributors to new fiber formation during this growth phase, (c) the number of these cells gradually decrease with age, but a few of these cells continuously remain in mature, adult muscles, and (d) these cells may contribute to muscle hyperplasia in adult muscles if they are stimulated by factors such as heavy weight-lifting (Tamaki et al. 1992b, 1997). Further work is needed to clarify whether the myogenic cells identified in the interstitial spaces in the present study are equivalent to SP cells, progenitors of satellite cells, derived from satellite cells, and/or an entirely independent cell population.
Footnotes
Acknowledgements
Supported in part by Tokai University School of Medicine Research Aid and by a research grant by Sankyo Corporation.
We thank K. Nakane (Facilities for Radioisotope Research, Tokai University School of Medicine) for helpful assistance in animal care and use.