
Abstract
The functionally important effects on the heart of ACh released from vagal nerves are principally mediated by the muscarinic K+ channel. The aim of this study was to determine the abundance and cellular location of the muscarinic K+ channel subunits Kir3.1 and Kir3.4 in different regions of heart. Western blotting showed a very low abundance of Kir3.1 in rat ventricle, although Kir3.1 was undetectable in guinea pig and ferret ventricle. Although immunofluorescence on tissue sections showed no labeling of Kir3.1 in rat, guinea pig, and ferret ventricle and Kir3.4 in rat ventricle, immunofluorescence on single ventricular cells from rat showed labeling in t-tubules of both Kir3.1 and Kir3.4. Kir3.1 was abundant in the atrium of the three species, as shown by Western blotting and immunofluorescence, and Kir3.4 was abundant in the atrium of rat, as shown by immunofluorescence. Immunofluorescence showed Kir3.1 expression in SA node from the three species and Kir3.4 expression in the SA node from rat. The muscarinic K+ channel is activated by ACh via the m2 muscarinic receptor and, in atrium and SA node from ferret, Kir3.1 labeling was co-localized with m2 muscarinic receptor labeling throughout the outer cell membrane.
A
Materials and Methods
Preparations
Tissue from different regions of the heart from rats, ferrets, and guinea pigs, isolated heart cells from rats, and Chinese hamster ovary (CHO) cells were used. Procedures were carried out under license and in accordance with the regulations of the UK Animals (Scientific Procedures) Act 1986. Rats and guinea pigs of either sex weighing 0.2–0.3 kg were sacrificed by stunning and cervical dislocation, and ferrets weighing ~1 kg were anesthetized with IP sodium pentobarbital (90 mg/kg). Left ventricular free wall tissue was taken for Western blotting and immunofluorescence labeling and right atrium (including the crista terminalis and right atrial appendage) was taken for Western blotting. Preparations of SA node with some surrounding atrial muscle (Figure 1A) were dissected as previously described (Dobrzynski et al. 2000). Preparations from rat, ferret, and guinea pig were approximately 10, 15, and 12 mm2, respectively. From such preparations, the thin intercaval region between the superior and inferior venae cavae (where the SA node is located; region shown by dashed line in Figure 1A) was taken for Western blotting. In addition, cryosections were cut from such preparations approximately at the level of the arrow in Figure 1A close to the main branch from the crista terminalis (where the center of the SA node is usually located) for immunolabeling of the atrial muscle of the crista terminalis as well as the SA node. Tissue was prepared for cryosectioning as previously described (Dobrzynski et al. 2000). Cryosections of ~20 μm were cut and mounted on poly-
Antibodies
Primary antibodies used included the following: (a) polyclonal antibody against the C-terminus of mouse Kir3.1 (amino acids 436–501) raised in rabbit (Alomone Labs; Jerusalem, Israel); (b) polyclonal antibody against the N-terminus of Kir3.4 (αCIR-N2, amino acids 19–32) raised in rabbit (gift from Dr. Grigory B. Krapivinsky; Harvard Medical School, Boston, MA); (c) monoclonal antibody against the i3 loop of the m2 muscarinic receptor (amino acids 225–359) raised in rat (Chemicon; Harrow, UK); (d) monoclonal antibody against rat cardiac connexin43 (amino acids 252–270; Cx43) raised in mouse (Chemicon). For immunofluorescence the anti-Kir3.1 primary antibody was used at 1:100, anti-Kir3.4 primary antibody was used at 1:100, anti-m2 muscarinic receptor primary antibody was used at 1:1000, and anti-Cx-43 primary antibody was used at 1:1000. Secondary antibodies used included the following: anti-rabbit or anti-rat conjugated to TRITC or FITC (used at 1:100), and anti-mouse conjugated to Cy5 (used at 1:500). All secondary antibodies were obtained from either Sigma or Chemicon. For Western blotting the anti-Kir3.1 primary antibody was used at 1:1000 and goat anti-rabbit horseradish peroxidase-conjugated secondary antibody (Dako; High Wycombe, UK) was used at 1:3000.
Western Blotting, Immunofluorescence Labeling, and Confocal Microscopy
Western blotting was carried out as previously described (Dobrzynski et al. 2000). Before immunofluorescence labeling, tissue sections and single heart cells were briefly washed in 0.01 M PBS and fixed by immersing the slides in 4% paraformaldehyde (PFA) in PBS at room temperature (RT) for 0.5 hr. PBS contained (in mM): Na2HPO4 7.7; NaH2PO4 2.3; NaCl 150; pH 7.4. The sections and cells were then washed three times with PBS over 0.5 hr. CHO cells were briefly washed in PBS, fixed in 4% PFA vapor overnight at RT, and washed in PBS several times over 1 hr. To permeabilize the cell membrane, tissue sections were treated with either 0.2% or 0.3% Triton X-100 in PBS, followed by 0.1 M lysine in PBS (Sigma). Single heart cells were treated with 0.2% Triton X-100 in PBS containing either 0.1 M lysine or glycine (Sigma); CHO cells were treated with 0.1% Triton X-100 in PBS for 0.5 hr. Tissue sections were blocked with either 10% normal donkey serum and 5% fat-free milk in PBS or 10% normal horse serum and 1% bovine serum albumin (BSA) in PBS for 1 hr at RT. Single heart cells were incubated with 10% normal donkey serum in PBS. CHO cells were incubated with 20% normal goat serum in PBS containing 0.1% Triton X-100. After blocking in a blocking solution containing fat-free milk, tissue sections were briefly washed in PBS. Tissue sections, single heart cells, and CHO cells were labeled with primary antibodies overnight (15–20 hr) at 4C. Tissue sections were single, double, or triple labeled with anti-Kir3.1, anti-Kir3.4, anti-m2 muscarinic receptor, and anti-Cx43 antibodies. Single heart cells were single or double labeled with anti-Kir3.1, anti-Kir3.4, and m2 muscarinic receptor antibodies. CHO cells were single labeled with anti-Kir3.1 antibody. For multiple labeling, tissue sections and single heart cells were incubated with the primary antibodies simultaneously. For labeling of tissue sections and single heart cells with the anti-Kir3.1, m2 muscarinic receptor and Cx43 primary antibodies, the antibodies were diluted in 0.25% saponin, 10% normal donkey serum, 1% BSA, and 0.1% Triton X-100 in PBS containing 6.15 mM NaN3. For labeling of tissue sections and single cells with the anti-Kir3.4 and/or Cx43 primary antibodies, the antibodies were diluted in 1% BSA and 10% normal horse serum in PBS containing 6.15 mM NaN3. For labeling of CHO cells with the anti-Kir3.1, the antibody was diluted in 0.2% Triton X-100 and 2% BSA in PBS containing 6.15 mM NaN3. Samples were incubated (appropriate to experiments) with secondary antibodies conjugated to fluorescent markers for 1 hr at RT. For tissue sections and single heart cells, anti-Kir3.1, anti-m2 muscarinic receptor, and anti-Cx43 primary antibodies were detected with anti-rabbit, anti-rat, and anti-mouse secondary antibodies conjugated to TRITC, FITC, and Cy5, respectively, diluted in PBS containing 1.5% normal donkey serum and 1% BSA. For tissue sections in which anti-Kir3.4 and/or anti-Cx43 primary antibodies were used, the primary antibodies were detected with anti-rabbit and anti-mouse secondary antibodies conjugated to FITC and TRITC, respectively, diluted in PBS containing 10% normal horse serum and 1% BSA. For CHO cells, anti-Kir3.1 primary antibody was detected with anti-rabbit secondary antibody conjugated to TRITC diluted in PBS containing 0.1% Triton X-100. After incubation in the primary and secondary antibodies, tissue sections and single heart cells were washed several times in PBS over 0.5–1 hr. CHO cells were washed in PBS containing 0.1% Triton X-100 several times. Samples were mounted with Vectashield mounting medium (H-1000; Vector Laboratories, Peterborough, UK) and coverslips were sealed with nailpolish.
Immunolabeled tissue sections and single heart cells were examined by a confocal laser scanning microscope (Leica TCS SP) equipped with argon, krypton, and helium–neon lasers, which allowed excitation at 488-, 568-, and 633-nm wavelengths for the detection of FITC, TRITC, and Cy5, respectively. The images recorded were single optical sections and in the case of double or triple labeling the images were recorded either simultaneously or sequentially. The images were processed using Corel Photo-Paint and Corel Draw software (Corel; Ottawa, ONT, Canada). Immunolabeled CHO cells were viewed using a Nikon epifluorescence microscope under 488-nm light for GFP and 514-nm light for TRITC.
Control Experiments
Various control experiments were conducted to check the validity of the data from the present study. The specificity of the anti-Kir3.1 antibody was tested by transfecting CHO cells with plasmid vectors for Kir3.1 as well as GFP (see above for full details). In CHO cells showing GFP fluorescence (presence indicates successful transfection), Kir3.1 labeling was detected, whereas in CHO cells not showing GFP fluorescence no Kir3.1 labeling was detected (not shown). This experiment shows that the anti-Kir3.1 antibody detects Kir3.1 protein.
In Western blotting experiments, when anti-Kir3.1 antibody was pre-incubated with the antigenic peptide (before application to tissue) no bands were detected in ventricle, atrium, and intercaval region from three rats and in ventricle and atrium from one ferret (not shown). Furthermore, in our laboratory, in Western blotting experiments, when the secondary antibody only is applied (i.e., primary antibody not applied) to various heart tissues (including SA node) from different species, no bands are detected.
In immunofluorescence experiments, when the anti-Kir3.1 antibody was pre-incubated with the antigenic peptide (before application to tissue) no labeling in tissue sections (from ventricle, atrium, and SA node from rat, ferret, and guinea pig) and single rat atrial and ventricular cells was detected (not shown).
The anti-Kir3.4 antibody was obtained from Dr. Grigory Krapivinsky and was previously characterized by Western blotting on Sf9 cells (Krapivinsky et al. 1995).
When a secondary antibody only was applied (i.e., primary antibody not applied), no labeling of tissue sections (from ventricle, atrium, and SA node from rat, ferret, and guinea pig), single rat atrial and ventricular cells, and CHO cells was again detected (not shown). This control experiment was carried out for all primary and secondary antibodies used.
No labeling of tissue sections (from ferret ventricle, atrium and SA node) was detected when the wrong secondary antibodies to detect the primary antibodies were applied (not shown). In most immunofluorescence experiments, tissue was double or triple labeled. With all primary antibodies, it was checked that the single labeling produced the same pattern of labeling. The labeling patterns in single and multiple labeling experiments were always identical (not shown).
Results
Detection of Kir3.1 Protein by Western Blotting in Different Regions of Heart
Western blotting was carried out on gel samples prepared from ventricle (left ventricular free wall used), atrium (crista terminalis and right atrial appendage used), and intercaval region of rat, ferret (with the exception of the intercaval region), and guinea pig heart. Figure 1A shows a preparation from rat (preparations from ferret and guinea pig similar) including the intercaval region (tissue between the entrances of the superior and inferior venae cavae into the right atrium), the crista terminalis (a thick band of atrial muscle that runs principally along the edge of the intercaval region), and part of the right atrial appendage. In Figure 1A the dashed line outlines the intercaval region, the tissue used for Western blotting. The SA node in the rat and guinea pig is located in the intercaval region alongside the crista terminalis. The tissue of the intercaval region from these species used for Western blotting therefore includes SA node tissue (however, it also includes atrium-like tissue that lies in the intercaval region towards the interatrial septum; SEP in Figure 1A). The SA node (as judged by no Cx43 immunolabeling; see below) in the ferret is located on the crista terminalis, and therefore the intercaval region from ferret was not used for Western blotting.
Figure 1B (Lanes 1–8) shows typical Western blots in which equal amounts of protein (determined by densitometry) from different tissues were loaded and the level of exposure of the enhanced chemiluminescence (ECL) film was the same for each. The anti-Kir3.1 antibody detected two major bands at the expected molecular weights of ~50 and 55 kD (corresponding to non-glycosylated and glycosylated forms of Kir3.1; Krapivinsky et al. 1995) in atrium from rat, ferret, and guinea pig (Figure 1B; Lanes 2, 5, and 7). The antibody also detected two major bands at the same molecular weights in the intercaval region from rat (Figure 1B; Lane 3) and one major band (corresponding to the glycosylated form of Kir3.1) in the intercaval region from guinea pig (Figure 1B; Lane 8). It is assumed that in the intercaval region from guinea pig all Kir3.1 protein was glycosylated. Densitometry of blots (e.g., Figure 1B) and parallel Coomassie blue-stained gels (to determine the total amount of protein in each tissue sample; not shown) were performed, and Kir3.1 immunoblotting was normalized for protein loading and expressed as a fraction of that seen in the intercaval region. Under the conditions used, mean results from four rat hearts showed that there was no detectable Kir3.1 protein in ventricle and that there were similar amounts (not significantly different; ANOVA) in atrium and the intercaval region (not shown). Although under the conditions used for Lanes 1–8 in Figure 1B there were no labeled bands in ventricle, in Western blotting on ventricle from three rats, in which the amount of protein from ventricle was increased, two bands at the molecular weights of ~50 and ~55 kD were detected; an example is shown in Figure 1B (Lane 9). This shows that there is a very low expression of Kir3.1 in ventricle from rat at least.
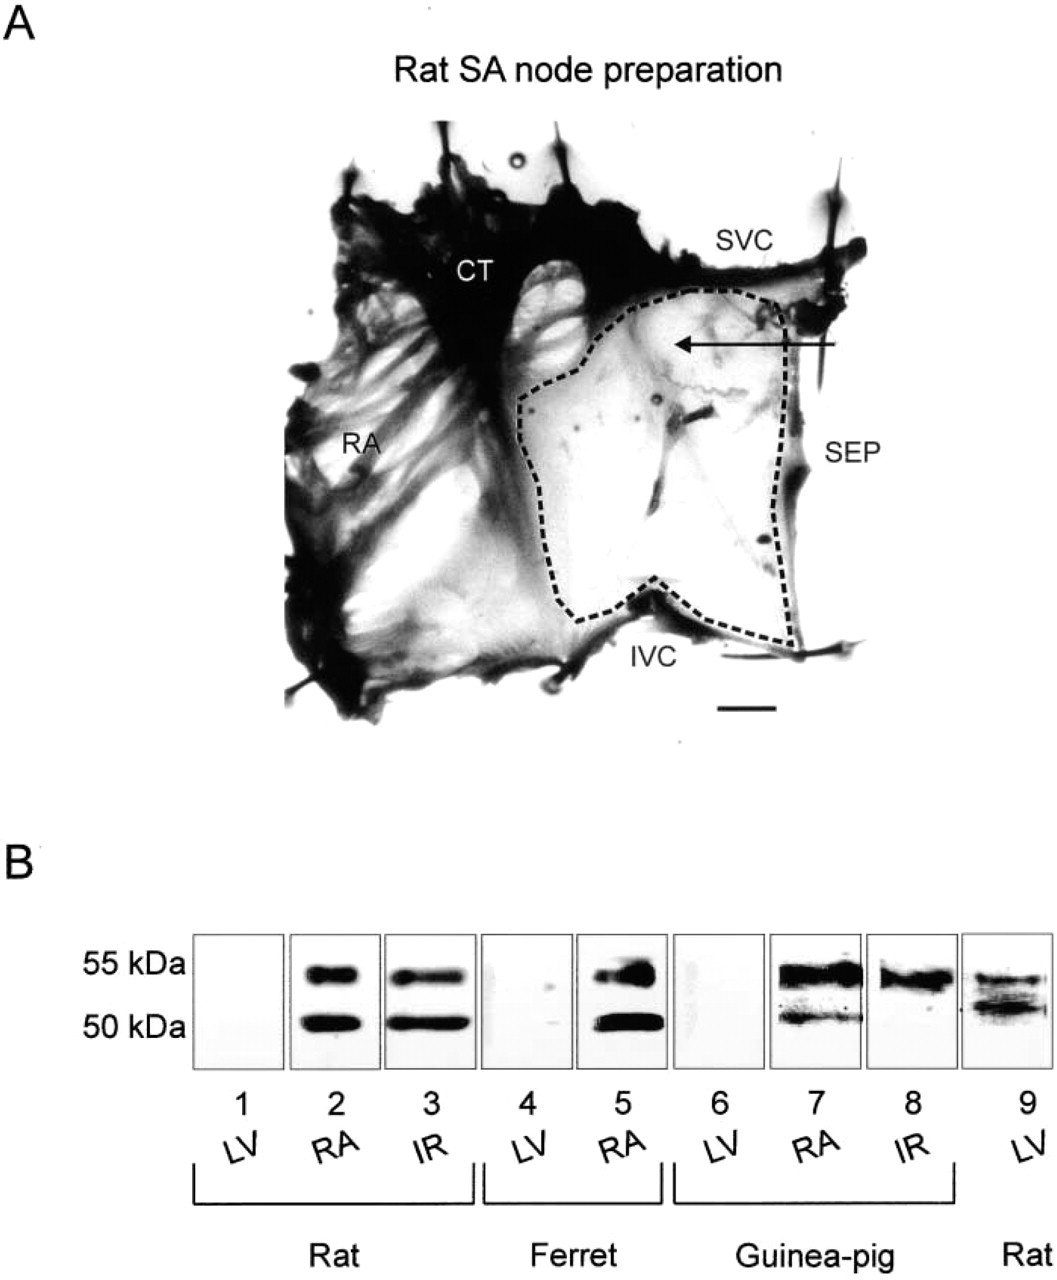
Western blotting of tissue samples prepared from different regions of rat, ferret, and guinea pig heart. (
Detection of Kir3.1 Protein by Immunofluorescence and Confocal Microscopy in Ventricle
The cellular distribution of Kir3.1 was determined by immunofluorescence and confocal microscopy. In some cases, tissues were labeled for the m2 muscarinic receptor as well as Kir3.1 (to investigate whether Kir3.1 and the m2 muscarinic receptor are co-localized) and connexin43 (a gap junction protein ubiquitously expressed in the heart apart from in nodal tissue). Figures 2A and 2B show a section of ferret ventricle triple labeled for Kir3.1, m2 muscarinic receptor, and Cx43. In ventricle from rat (not shown), ferret (Figure 2A), and guinea pig (not shown), Kir3.1 labeling was not detected. Figure 2B shows that m2 muscarinic receptor labeling was present in ventricle from ferret (rat and guinea pig ventricle not tested). The m2 muscarinic receptor labeling was present in the outer cell membrane. Ventricular cells have well-developed t-tubules but little or no labeling of the m2 muscarinic receptor was apparent in the t-tubules. Cx43 labeling was also detected in ventricle from rat (not shown), ferret (inset in Figure 2A), and guinea pig (not shown) and, as expected, was located at the intercalated disks. Similar results were obtained from two rats, two ferrets, and two guinea pigs. Figures 2C and 2D show ventricular cells isolated from rat hearts labeled for either Kir3.1 or the m2 muscarinic receptor. Kir3.1 labeling was either absent or very weak. In cells in which weak Kir3.1 labeling was present, Kir3.1 labeling was absent from the outer cell membrane but was present in the t-tubules (Figure 2C). On the other hand, m2 muscarinic receptor labeling was present in the outer cell membrane and, in general, there was weaker labeling of the m2 muscarinic receptor in the t-tubules (Figure 2D). Similar results were obtained from ten (Kir3.1) and five (m2 receptor) rat ventricular cells. In summary, the immunofluorescence data show low expression of Kir3.1 in ventricle.
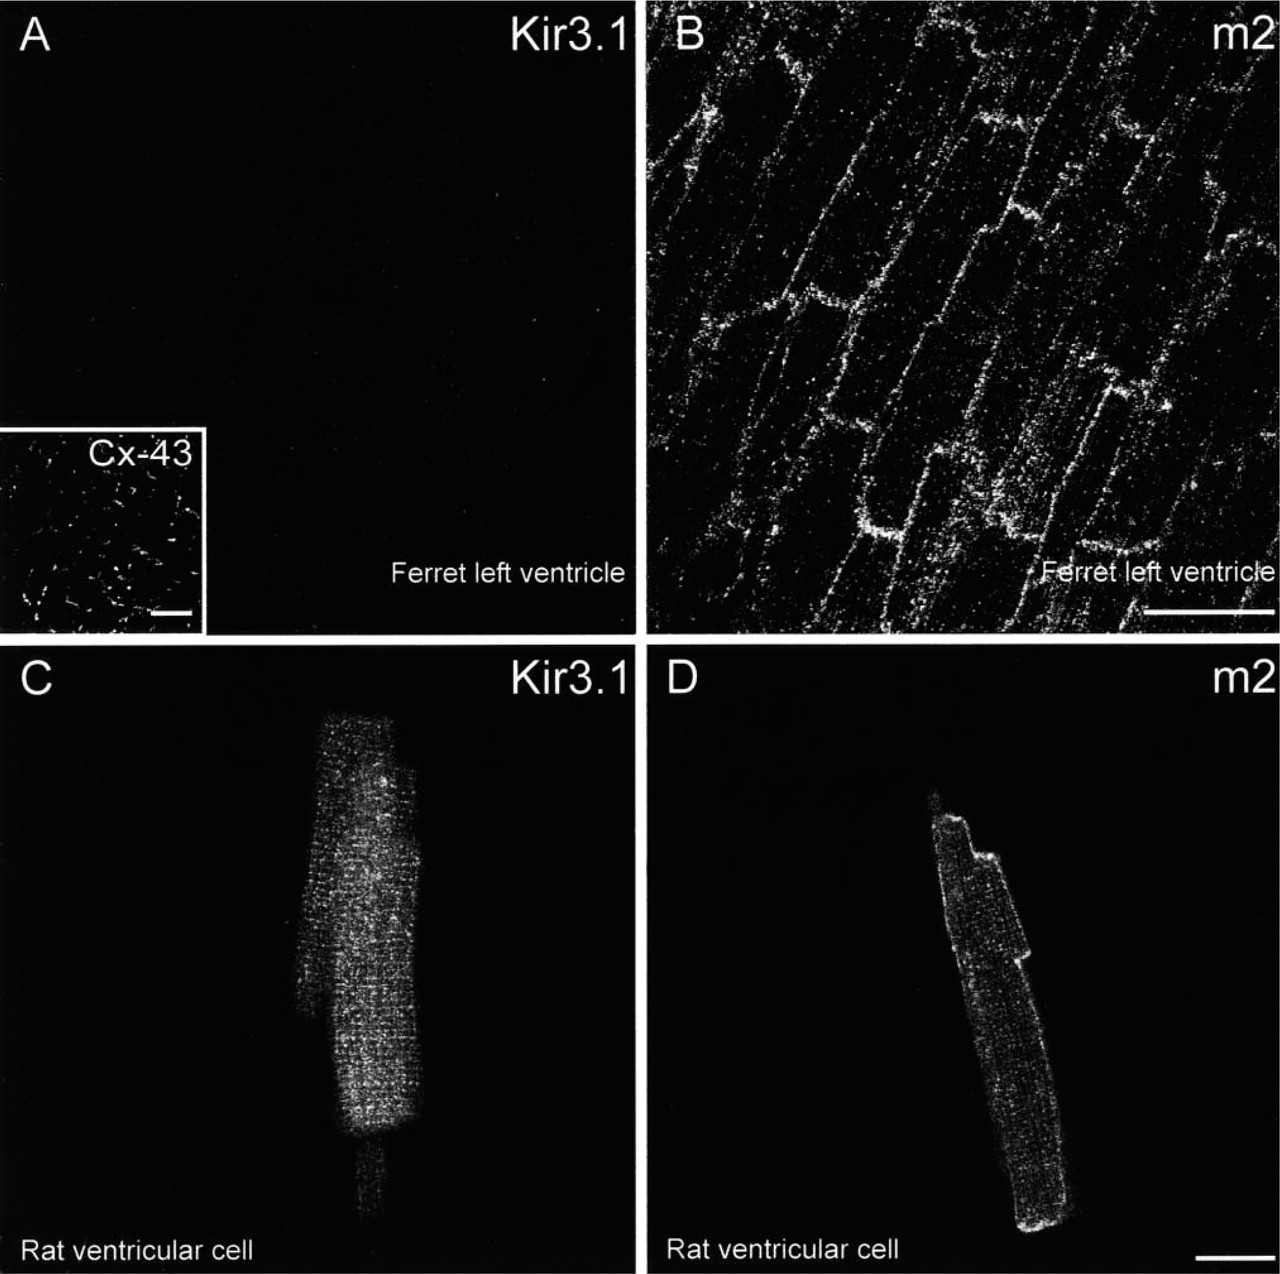
Confocal micrographs showing Kir3.1, m2 muscarinic receptor, and Cx43 labeling in ventricle. (
Detection of Kir3.1 Protein by Immunofluorescence and Confocal Microscopy in Atrium
Sections of atrium from rat, ferret, and guinea pig either double labeled for Kir3.1 and Cx43 (rat and guinea pig) or triple labeled for Kir3.1, m2 muscarinic receptor, and Cx43 (ferret) are shown in Figures 3A–3D. In atrium from all species, Kir3.1 labeling was present in the outer cell membrane (Figure 3A–3C). Figure 3D shows that m2 muscarinic receptor labeling was present in atrium from ferret (rat and guinea pig atrium not tested) in the outer cell membrane. Cx43 labeling was also present in atrium from all species and, as expected, was located at the intercalated disks (Figures 3A–3C, insets). Similar results were obtained from three rats, two ferrets, and two guinea pigs. Figures 3E and 3F show an atrial cell double labeled for Kir3.1 and the m2 muscarinic receptor. Both Kir3.1 (Figure 3E) and m2 muscarinic receptor (Figure 3F) labeling was present in the outer cell membrane, and it is clear that the labeling was co-localized. Similar results were obtained from eight rat atrial cells. In summary, the immunofluorescence data are in agreement with the Western blotting data in showing a high abundance of Kir3.1 in atrium.
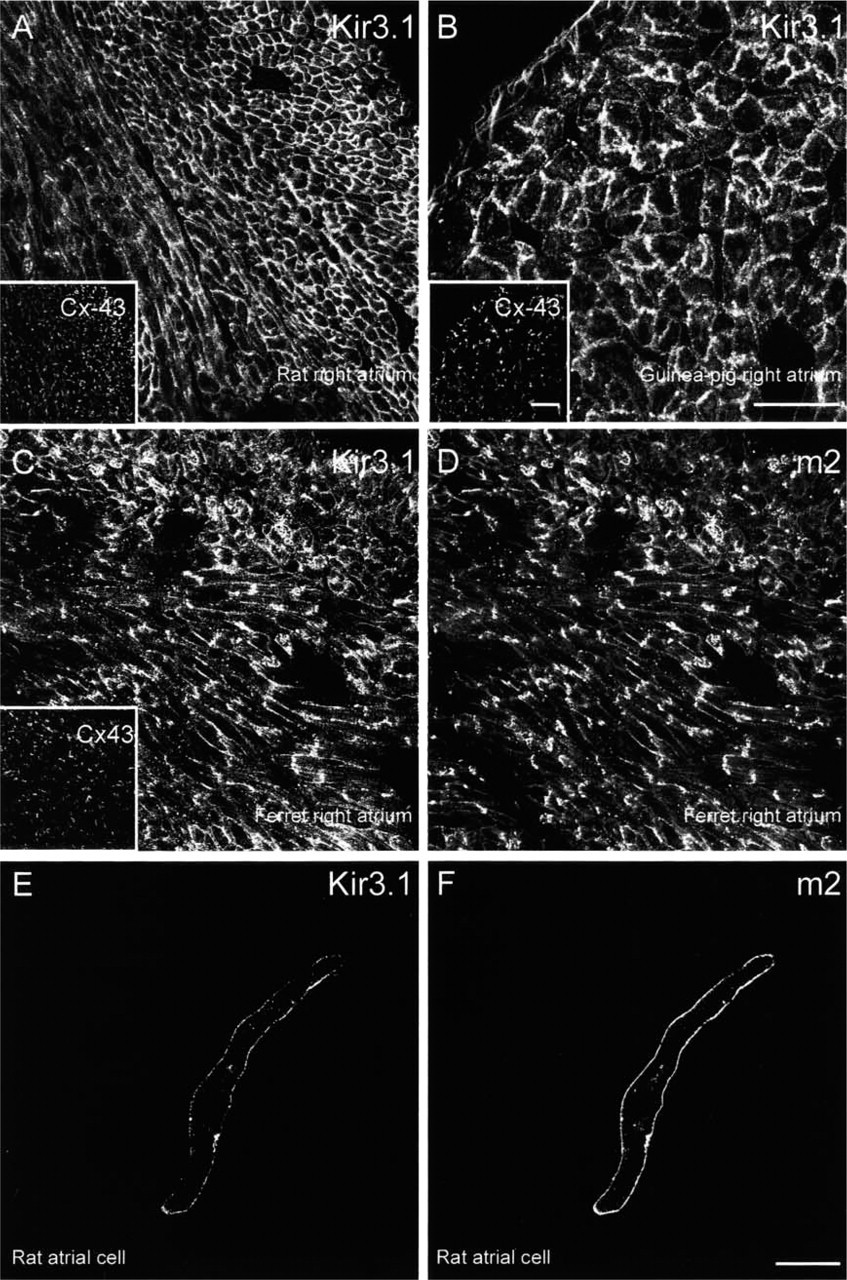
Confocal micrographs showing Kir3.1, m2 muscarinic receptor, and Cx43 labeling in atrium. (
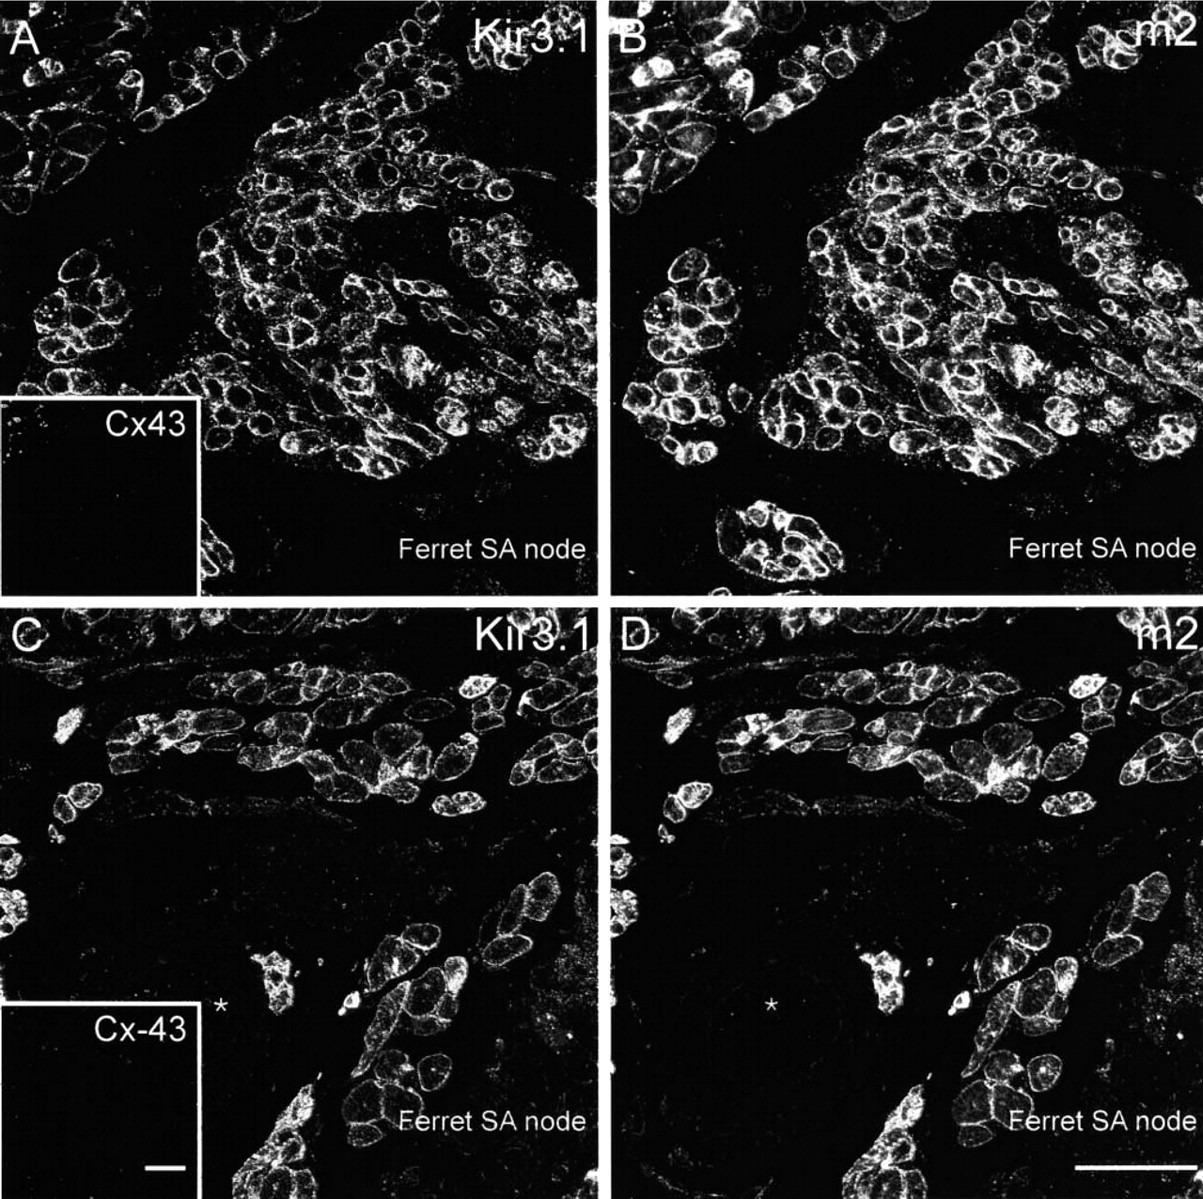
Detection of Kir3.1 Protein by Immunofluorescence and Confocal Microscopy in SA Node
Figure 4 shows sections of SA node double labeled for Kir3.1 and Cx43 (rat and guinea pig), and Figure 5 shows sections of SA node triple labeled for Kir3.1, m2 muscarinic receptor, and Cx43 (ferret). Cx43 is not expressed in the center of the SA node (e.g., Coppen et al. 1999; Dobrzynski et al. 2000) and Cx43 was used as a marker to distinguish the SA node from surrounding atrial muscle. In the tissue shown in Figures 4 and 5, Cx43 labeling was absent (no Cx43 label in insets in Figures 4A, 4B, 5A, and 5C). The absence of Cx43 labeling as well as the location of the tissue shows the tissue to be SA node. Kir3.1 labeling, although weak, was detected in rat (Figure 4A) and guinea pig (Figure 4B) SA node in the outer membrane of cells. Similar results were obtained from three rats and two guinea pigs. In ferret SA node, unlike in rat and guinea pig SA node, strong Kir3.1 labeling was detected in the outer cell membrane (Figure 5A and 5C). Figure 5C shows Kir3.1 labeling of SA node tissue around a prominent vessel. The SA node artery is often used as an anatomic marker of the SA node (Anderson and Ho 1998). Figures 5B and 5D show that m2 muscarinic receptor labeling was present in SA node from ferret (rat and guinea pig SA node not tested). The m2 muscarinic receptor labeling was located in the outer membrane of cells and Figure 6, in which the images of Kir3.1, m2 muscarinic receptor, and Cx43 labeling in Figure 5A and 5B have been superimposed, shows co-localization of Kir3.1 red labeling and m2 muscarinic receptor green labeling (yellow signal) (the absence of blue signal in Figure 6 shows the absence of Cx43 labeling). Similar results were obtained from two ferrets.
Detection of Kir3.4 Protein by Immunofluorescence and Confocal Microscopy in Rat Ventricle, Atrium, and SA Node
The cellular distribution of Kir3.4 in rat ventricle, atrium, and SA node was determined by immunofluorescence and confocal microscopy. Figure 7A shows a section of rat ventricle double labeled for Kir3.4 and Cx43 (Cx43 labeling not shown). In ventricle from rat, Kir3.4 labeling was not detected (Figure 7A). Similar results were obtained from three rats. Figure 7C shows a ventricular cell isolated from a rat heart single labeled for Kir3.4. Although Kir3.4 labeling was absent from the outer cell membrane, it was present in t-tubules. Similar results were obtained from 10 rat ventricular cells. Why Kir3.4 labeling should be present in single cells but absent in ventricular tissue sections is considered in the Discussion. In summary, the immunofluorescence data show a low abundance of Kir3.4 in ventricle. Figure 7B shows a section of rat atrium double labeled for Kir3.4 and Cx43 (Cx43 labeling not shown). In atrium from rat, Kir3.4 labeling was present in the outer cell membrane (Figure 7B). Similar results were obtained from three rats. Figure 7D shows an atrial cell single labeled for Kir3.4; labeling was present in the outer cell membrane (Figure 7D). Similar results were obtained from eight rat atrial cells. In summary, the immunofluorescence data show a high abundance of Kir3.4 in atrium. Figure 8 shows sections of rat SA node double labeled for Kir3.4 and Cx43. In the tissue shown in Figure 8A, Cx43 labeling was absent (no Cx43 label in inset in Figure 8A), showing the tissue to be SA node. In the tissue section shown in Figure 8B, Cx43 labeling was absent in the middle, but was present in the periphery of the section (inset in Figure 8B). In cells in which there was no Cx43 labeling (SA node cells), Kir3.4 labeling, although weak, was detected in the outer membrane of cells (Figure 8). Similar results were obtained from three rats.
Discussion
This study has shown the following: (a) little or no Kir3.1 protein expression in ventricle from rat, ferret, and guinea pig, as revealed by Western blotting, and little Kir3.1 and Kir3.4 protein expression in ventricle from rat, as revealed by immunofluorescence; (b) a high abundance of Kir3.1 protein in atrium from rat, ferret, and guinea pig, as revealed by Western blotting and immunofluorescence, and presence of Kir3.4 protein in atrium from rat, as revealed by immunofluorescence; (c) a high abundance of Kir3.1 protein in ferret SA node, but an apparently lower abundance in rat and guinea pig SA node, and presence of Kir3.4 protein in rat SA node as revealed by immunofluorescence; and (d) co-localization of Kir3.1 protein with the m2 muscarinic receptor protein in the outer cell membrane in ferret atrium and SA node, as revealed by immunofluorescence. The significance of the distribution of Kir3.1 and Kir3.4 for the vagal control of the heart via the muscarinic K+ channel is discussed below.
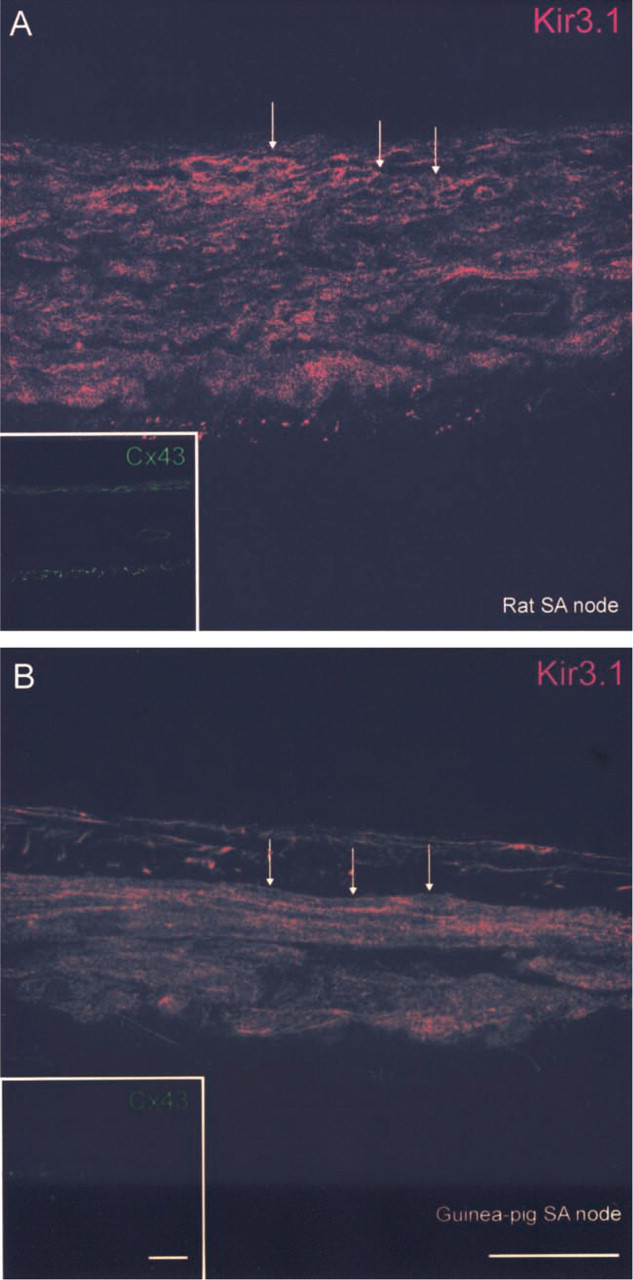
Confocal micrographs showing Kir3.1 but not Cx43 labeling in rat and guinea pig SA node. (
Confocal micrographs showing Kir3.1 and m2 muscarinic receptor but not Cx43 labeling in ferret SA node. (
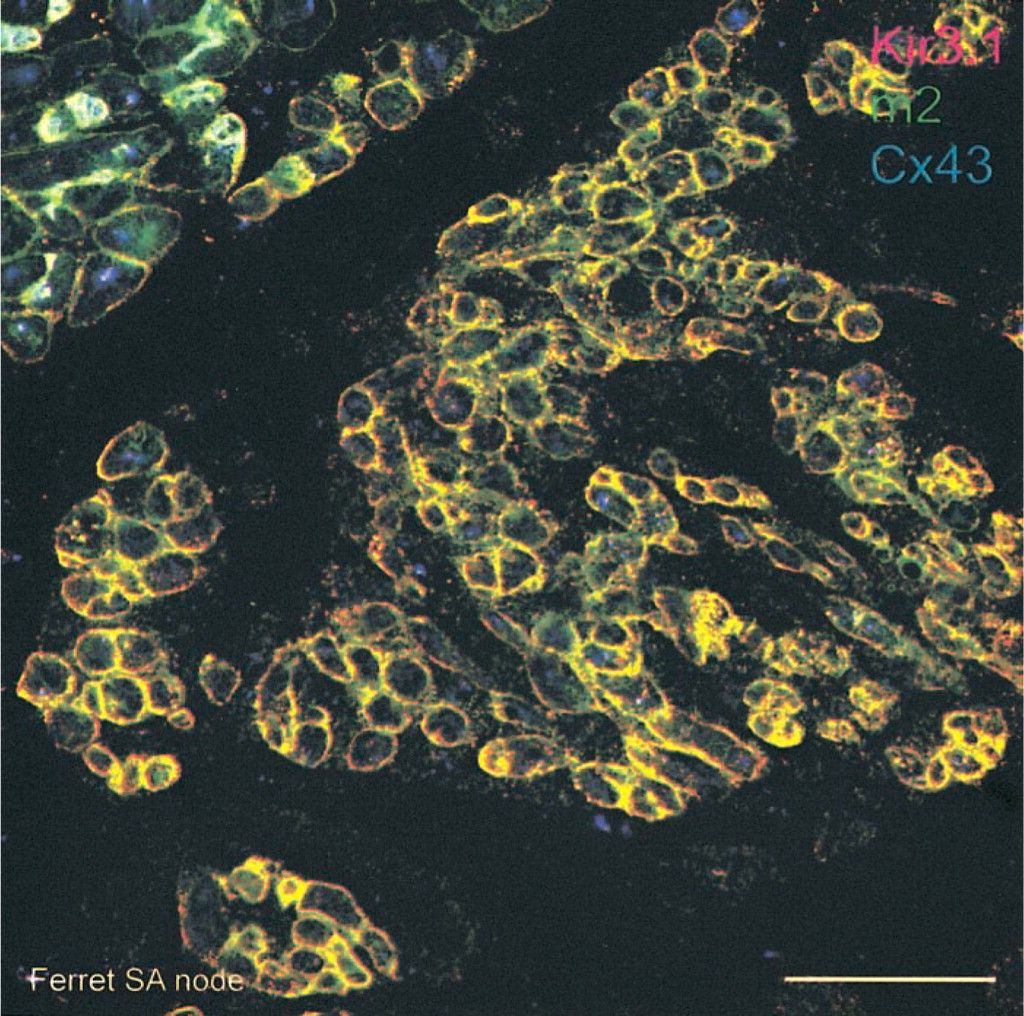
Co-localization of Kir3.1 and m2 muscarinic receptor labeling in SA node. The images of Kir3.1, m2 muscarinic receptor and Cx43 labeling in ferret SA node in Figures 5A and 5B have been superimposed. Red, Kir3.1 labeling; green, m2 receptor labeling; blue, Cx43 labeling; yellow, co-localization of Kir3.1 and m2 muscarinic receptor labeling; white, co-localization of Kir3.1, m2 muscarinic receptor, and Cx43 labeling. Bar = 50 μm.
Abundance of Kir3.1 and Kir3.4 Proteins in Ventricle
Our previous functional studies have shown that ACh has a negative inotropic effect on rat, ferret, and dog ventricle, and this was shown to be the result of the activation of the muscarinic K+ channel (Boyett et al. 1988; McMorn et al. 1993; Yang et al. 1996). The muscarinic K+ channel is a heterotetramer of Kir3.1 and Kir3.4. In the present study, the muscarinic K+ channel proteins Kir3.1 and Kir3.4 were not detected by immunofluorescence in tissue sections through rat ventricle (Figures 2 and 7). Kir3.1 was also not detected in tissue sections through ferret and guinea pig ventricle (Figure 2). Furthermore, in previous studies Kir3.1 mRNA was not detected in the ventricle from rat and guinea pig (Kubo et al. 1993) and Kir3.1 protein was not detected (by Western blotting) in cow ventricle (Krapivinsky et al. 1995). In a previous study, Kir3.4 mRNA was predominantly detected in the atria from rat (Krapivinsky et al. 1995). Our previous functional study on rat heart showed that the density of the muscarinic K+ current is approximately sixfold lower in ventricular cells than in atrial cells (McMorn et al. 1993). It is therefore possible that Kir3.1 and Kir3.4 proteins are present in the ventricle but that the amount of the proteins is low and evades detection. Consistent with this, in the present study in Western blotting experiments, Kir3.1 protein was detected in ventricle from rat, in which the amount of protein was increased (Figure 1B, Lane 9). In addition, in immunofluorescence experiments on rat ventricular cells, Kir3.1 and Kir3.4 proteins were detected in the t-tubules (Figure 2C and 7C). In this case, why was no labeling observed in tissue sections through rat ventricle? This discrepancy could be the result of better access of the anti-Kir3.4 antibody to the antigenic site in the case of single cells. In our laboratory Kir3.1 mRNA has been detected in ferret ventricle (unpublished observation) and Kir3.4 mRNA has been detected in rat ventricle, but at a lower level than in atrium (Krapivinsky et al. 1995). The presence of the muscarinic K+ channel in ventricle is supported by the presence of the m2 muscarinic receptor in ferret ventricle, as detected by immunofluorescence in the present study (Figure 2). The m2 receptor protein has previously been detected in ventricle from rat and human (Fu et al. 1994; Schulze et al. 1995).
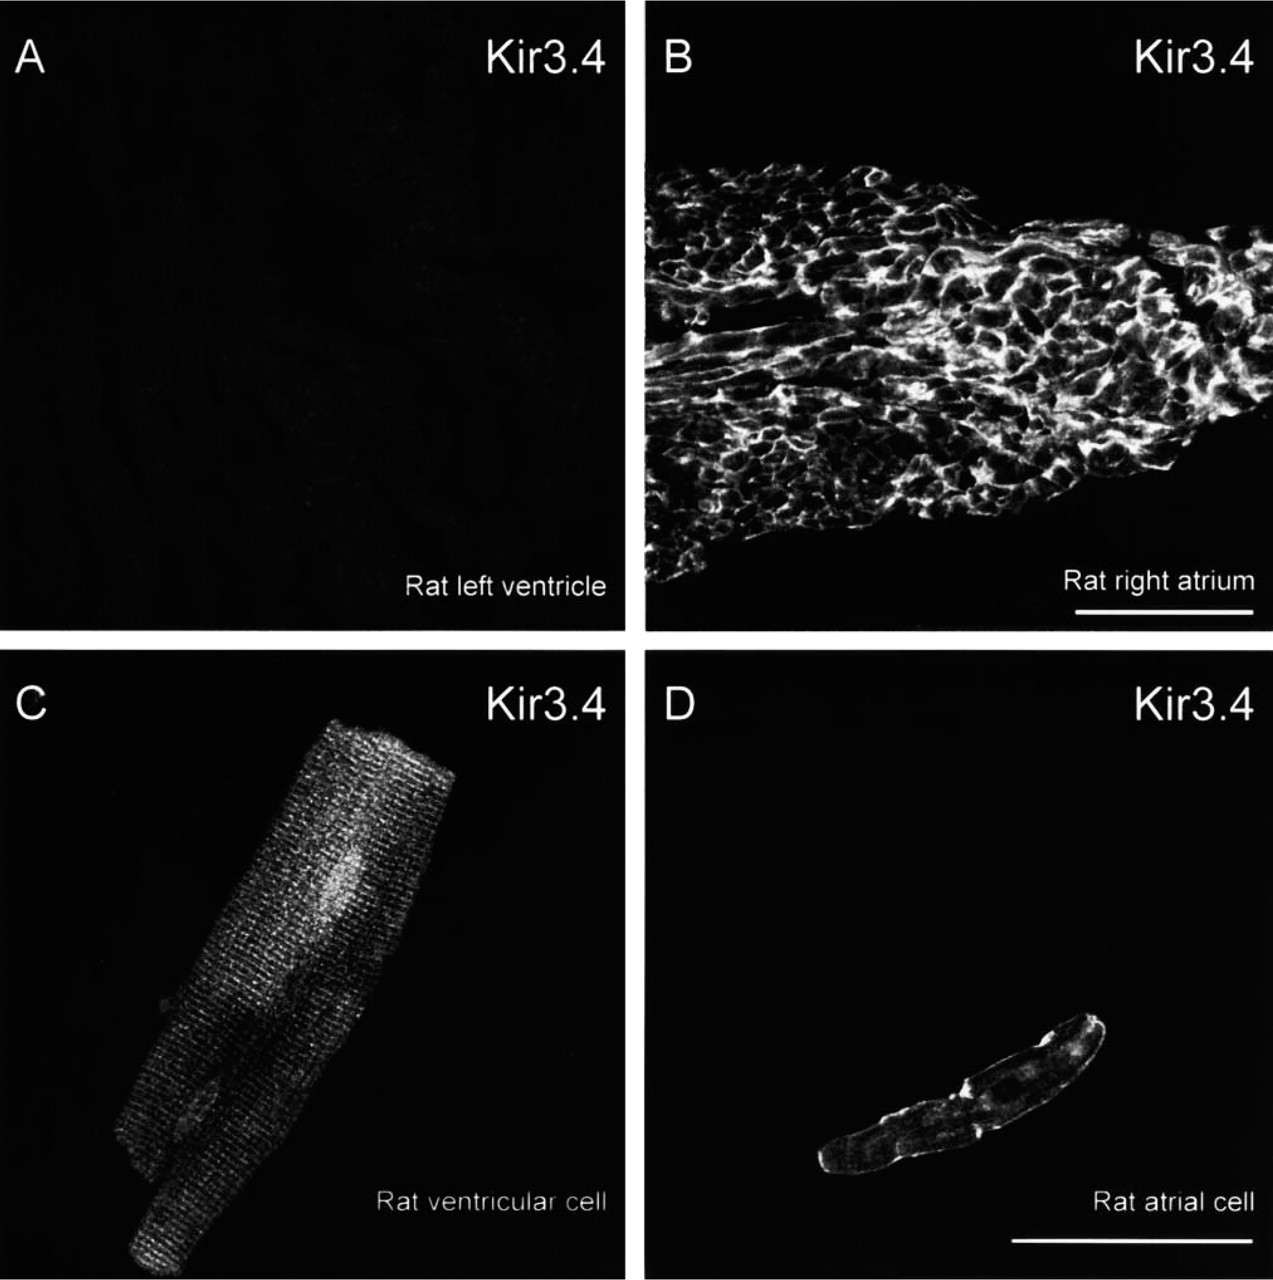
Confocal micrographs showing Kir3.4 labeling in rat ventricle and atrium. (
In summary, this study shows that, whereas the m2 muscarinic receptor is abundant in the ventricle, the muscarinic K+ channel is much less abundant. This is not unreasonable because it is known that the muscarinic receptor couples to other effectors, e.g., adenylate cyclase, that are known to be present in the ventricle.
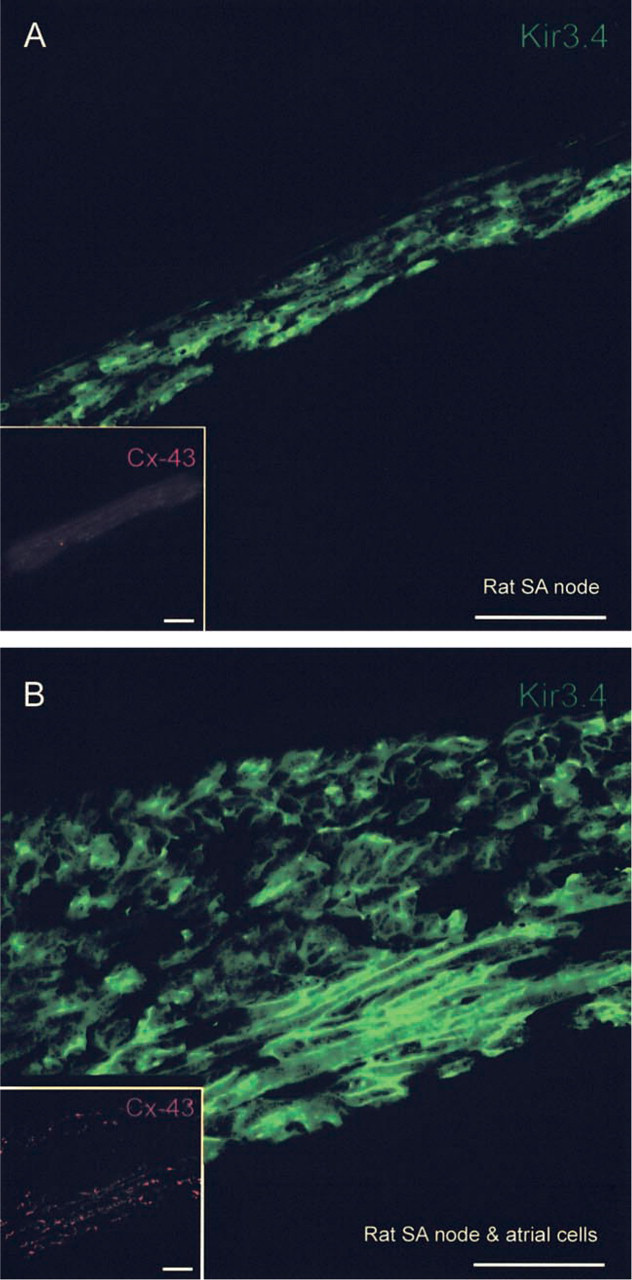
Confocal micrographs showing Kir3.4 but not Cx43 labeling in rat SA node. (
Abundance of Kir3.1 and Kir3.4 Proteins in Atrium
Functional studies have shown that ACh has a negative inotropic effect in atrium, and this may be the result of the activation of the muscarinic K+ current (Ten Eick et al. 1976). In the present study, Kir3.1 protein was present in high abundance in rat, ferret, and guinea pig atrium, as revealed by both Western blotting and immunofluorescence (Figures 1 and 3). In addition, Kir3.4 protein was present in high abundance in rat atrium, as revealed by immunofluorescence (Figure 7). Both Kir3.1 and Kir3.4 were located throughout the outer cell membrane. Kir3.1 mRNA has previously been detected in guinea pig atrium (Kubo et al. 1993), whereas Kir3.4 mRNA has previously been detected in rat atrium (Krapivinsky et al. 1995).
Abundance of Kir3.1 and Kir3.4 Proteins in SA Node
ACh slows the spontaneous activity of the SA node primarily by activating the muscarinic K+ channel (Boyett et al. 1995a; Wickman et al. 1998). In the present study, Kir3.1 protein was present in the inter-caval region, where the SA node is located, in rat and guinea pig, as revealed by Western blotting (Figure 1). However, in addition to the SA node, the intercaval region also includes atrial cells. More definitively, immunofluorescence showed Kir3.1 labeling in SA node (the precise location of which was defined by an absence of Cx43 labeling) from rat, ferret, and guinea pig (Figures 5 and 6). In addition, immunofluorescence showed Kir3.4 labeling in SA node from rat (Figure 8). Both proteins were again located throughout the outer cell membrane. In SA node from rat and guinea pig (Figure 4A and 4B), the labeling of Kir3.1 was weaker and not as well defined as that in ferret SA node (Figure 5A and 5C), and this suggests that the abundance of muscarinic K+ channel protein may be lower in the SA node from these species. Furthermore, in rat and guinea pig SA node the labeling of Kir3.1 was weaker than that in atrium from rat and guinea pig (compare Figure 4A with Figure 3A and Figure 4B with Figure 3B). Kir3.4 labeling in rat SA node was also weaker than that in atrium from rat (compare Figure 8A with Figure 7B). These latter finding are perhaps surprising when it can be argued that the most important action of ACh on the heart is the slowing of the spontaneous activity of the SA node. However, there are two reasons why the abundance of the muscarinic K+ channel does not need to be as high in the SA node (from these species) as in the atrium. First, we have shown that the density of many ion channels is low in the center of the SA node: Na+ channel, L-type Ca2+ channel, transient outward K+ channel, rapid delayed rectifier K+ channel, slow delayed rectifier K+ channel, and the hyperpolarization-activated channel (Boyett et al. 2000). It is possible that the abundance of the muscarinic K+ channel does not need to be high in the SA node for ACh to be able to control the spontaneous activity. Second, surrounding the SA node is atrial muscle (the atrium studied in the immunofluorescence experiments in the present study was the atrial muscle surrounding the SA node). Kodama et al. (1996) have suggested that the activation of the muscarinic K+ channel in the atrial muscle surrounding the SA node increases the conductance of the atrial muscle and that this, in turn, increases the suppressive effect of the atrial muscle on the SA node (caused by the resting potential of atrial muscle being more negative than the range of potentials during the pacemaker potential of the SA node), which indirectly slows the spontaneous activity of the SA node. Kodama et al. (1996) showed that cutting off the atrial muscle reduced the slowing of spontaneous activity of the SA node caused by vagal stimulation. Furthermore, in a simulation study, Boyett et al. (1995b) showed that ACh can theoretically slow the spontaneous activity of the SA node by this indirect route. In another study in which an SA node cell was coupled to a passive model of an atrial cell, increasing the conductance of the model atrial cell to mimic the activation of the muscarinic K+ channel by ACh led to a decrease in the spontaneous rate of the SA node cell (Watanabe et al. 1995).
If the reasons above are correct, it is unclear why the density of the muscarinic K+ channel should be higher in the SA node in ferret. This species difference may be the result of the species difference of the location of the SA node, in the crista terminalis in the case of the ferret and in the intercaval region in the case of the rat and guinea pig.
There is another possible reason for the apparent low abundance of Kir3.1 and Kir3.4 in rat and guinea pig SA node. It is not known whether the epitope recognized by the anti-Kir3.1 antibody is identical between the species. It is possible, therefore, that the antibody–antigen interaction may be the limiting factor rather than a lower abundance of the Kir.3.1 protein in rat and guinea pig SA node compared to that in ferret SA node. However, the similar labeling of Kir3.1 in atrial muscle of the three species (Figure 3) is not in accord with a species difference in the epitope.
It is interesting that the distribution of the Kir3.1–Kir3.4 K+ channel in atrium and SA node (present study) is different from the distribution of the Kv1.5 K+ channel in the two tissues (Dobrzynski et al. 2000). The former channel is distributed throughout the outer cell membrane, whereas the latter is present in the outer cell membrane but only at sites of intercellular coupling. This could be because different subcellular locations of K+ channels may dictate different physiological, functions as suggested by Jan and Jan (1997). The muscarinic K+ channel is activated by ACh via the m2 muscarinic receptor and in the present study, as would be expected, labeling of Kir3.1 and the m2 muscarinic receptor was co-localized in the outer cell membrane in both atrium and SA node (Figures 3, 5, and 7). In ventricle, the m2 muscarinic receptor was also located in the outer cell membrane and there was generally some labeling in the t-tubules. In rat ventricular cells, it is interesting that we detected Kir3.1 and Kir3.4 in the t-tubules but not in the outer cell membrane.
Footnotes
Acknowledgements
Supported by the British Heart Foundation, the Ministry of Education, Science and Culture of Japan, and the Japan Society for the Promotion of Science.
We wish to thank Dr Z. Shui, Dr C.F. Howarth, and Dr L. Davis for isolation of heart cells, and Dr I. Khan for transfection of CHO cells.