
Abstract
We used cationized colloidal gold (CCG) to investigate the distribution of anionic sites in different secretory granules of mouse pancreatic acinar cell regranulation. Localization of anionic sites with CCG was carried out on ultrathin sections of a mouse pancreas, fixed in Karnovsky's fixative and OsO4 and embedded in Araldite. After pilocarpinestimulated degranulation, there was a marked diminution in the anionic charge density of immature and mature granules of the 4-hr group (≈43.0 gold particles/μm2) compared to the 8-hr mature granules group (≈64.6 gold particles/μm2). Scattergram analysis to investigate the correlation between section profile size and cationized gold labeling density revealed a reverse correlation, the small granule profiles demonstrated a higher density compared to the larger profiles of the same group. On the basis of these observations, it appears that a post-translational processing of secretory content influences the granule anionic charge and thus may affect the intragranular buffer capacity.
P
We have recently introduced a novel cytochemical ultrastructural approach for postembedding localization of acidic proteoglycans in mast cell secretory granules (Skutelsky et al. 1995a). The method is based on the use of a polycationic histochemical probe, cationic colloidal gold (CCG) (Skutelsky and Roth 1986), which enables postembedding localization of anionic constituents on ultrathin sections (Vorbrodt 1987, 1989; Skutelsky et al. 1992). This probe was recently shown to efficiently label anionic constituents of cell membranes and extracellular matrix of various animal tissues in LR White and Lowicryl K4M sections (Vorbrodt 1989; Goode et al. 1991; Skutelsky et al. 1992, 1995b). This procedure enabled us to localize heparin and chondroitin sulfate in the mast cell secretory granules and to demonstrate that a direct correlation exists between accumulation of sulfated proteoglycans and maturation of the mast cell secretory granules. It was also indicated that most sulfation processes are accomplished within the secretory granules as a post-translational process (Skutelsky et al. 1995b).
In the present study we used a similar histochemical approach to investigate the distribution of sulfated proteoglycans in pancreatic acinar cells and to demonstrate the possible correlation between granule profile size and anionic site density. For the localization of proteoglycans in pancreas, CCG was applied directly on Araldite sections of mouse pancreatic acinar cells fixed with aldehydes and OsO4.
Materials and Methods
Isolation of Pancreas
Adult female ICR mice (9–10 weeks old, 20–25 g body weight) were maintained on a diet of standard rodent chow (Mabaroth, Israel) and tapwater ad libitum. The animal experiments were conducted in accordance with the Tel Aviv University Institutional Animal Care and Use Committee and with guidelines prepared by the Committee on the Care and Use of Laboratory Animals of the Institute of Laboratory Animal Resources, National Research Council (DHHS publication No. 86–23, revised 1985. Assurance number A5010–01, effective 1.10.1996 will expire on 30.9.2001). For these experiments, food was withheld overnight and then some of the mice were injected IP with pilocarpine (2.0 mg/mouse in 0.2 ml 0.9% NaCl; Sigma Chemical Company, St Louis, MO) to induce pancreatic acinar cell degranulation (Lew et al. 1994). The dose of pilocarpine and the intervals of sampling were selected on the basis of preliminary studies in which the extent of pancreatic acinar cell degranulation was assessed in light microscopic sections and resulted in more than 95% degranulation (Weintraub et al. 1992; Lew et al. 1994). Groups of five animals were sacrificed by cervical dislocation at 4 or 8 hr after injection with pilocarpine. Pancreatic glands were removed and 1-mm3 tissue blocks were prepared, washed once in PBS, pH 7.4, and fixed with Karnovsky's fixative (Karnovsky 1965) for 1 hr at room temperature (RT). Then they were washed twice with PBS and postfixed with 1% OsO4 in the same buffer. Dehydration was carried out with graded ethanols and propylene oxide, and tissues were embedded in Araldite.
Electron Microscopic Histochemistry
A monodispersed suspension of colloidal gold with an average diameter of 15 nm was prepared by reduction of HAuCl4 with Na citrate (Frens 1973). To prepare the cationic colloidal gold (CCG), 10 ml of the colloidal gold particles was stabilized with 100 μg/ml poly-
Ultrathin sections (0.075 ± 0.015 μm) were prepared by a LKB III Ultratome, using a diamond knife, and the sections were mounted on Formvar-coated 200-mesh nickel grids. The sections were incubated with 1% bovine serum albumin solution for 10 min and labeled with the CCG at 1:100 dilution in PBS, for physiological pH. After staining for 1 hr at RT, the sections were rinsed with double-distilled water and poststained for 15 min with saturated uranyl acetate in 50% ethanol. Examination of the sections was carried out using a JEOL-100B transmission electron microscope at 80 kV.
Similar labeling procedures, carried out after preincubation of the sections in 100 μg/ml PLL and in the presence of a similar concentration of free PLL in the CCG solutions, served as specific controls.
Quantitative Microscopy
Morphometry of granules was performed on randomly obtained electron micrographs (×15,000) of secretory granules as previously described (Hammel and Kalina 1989). Briefly, organelle cross-sectional areas were measured directly on the transmission electron micrographs. For each experiment, three to five ultrathin sections taken from the two blocks of each pancreas were placed on 200-mesh grids. The section that was technically the most adequate and most clearly stained was selected. In general, the grid pattern defined two or three complete section windows. The center of each window was photographed to provide prints for granule measurements. Mature granule area (ai) measurements were carried out on the prints using a graphic tablet (HP 9111A; Hewlett Packard, Palo Alto, CA) interfaced to a Power Macintosh 7100/66AV microcomputer for data transformation and analysis. For each granule we also counted the number of gold particles (Ni). Thus, gold particle mean density was calculated as = ΣNi/Σai (Hammel et al. 1989). In addition, granules were sorted by size, and for each bin size the gold particle mean density was calculated. The resultant data were analyzed using the moving bin method and presented as a scattergram (Hammel et al. 1987). All data were plotted on an HP LaserJet 4000N printer interfaced to the microcomputer. As a second approach we have projected a center-spaced grid of circles (ring radius = ri, i = 1,2,3….n) over circular granules. The number of gold particles within each ring was counted (ni). Thus, gold particle mean density was calculated as = ī/π(ri 2 +1 – ri 2). Statistical comparison analysis between the cumulative curves was performed by using the Kolmogorov–Smirnov test (Sokal and Rohlf 1969). Cellular compartment areas were determined with the point counting method using a square test grid with 4-mm spacing. Gold particles density was calculated from the ratio of the number of gold particles (gi) over the test area (Ai).
Results
Postembedding labeling of ultrathin Araldite sections with CCG at pH 7.4 resulted in binding of the CCG particles to all mouse pancreatic acinar cells (Figure 1). The CCG binding at pH 7.4 was mainly restricted to the cytoplasmic granules and, to a considerably lesser extent, to nuclear heterochomatin (data not shown) and to RER (Figure 1). In the 4-hr group, the RER labeling was 8.3 particles/μm2, and in the 8-hr group it was 21.5 particles/μm2. Most of the labeling was along the RER membrane. In the Golgi zone it was significantly less for both groups (3.5 particles/μm2). Incubation with PLL followed by CCG solution resulted in no labeling.
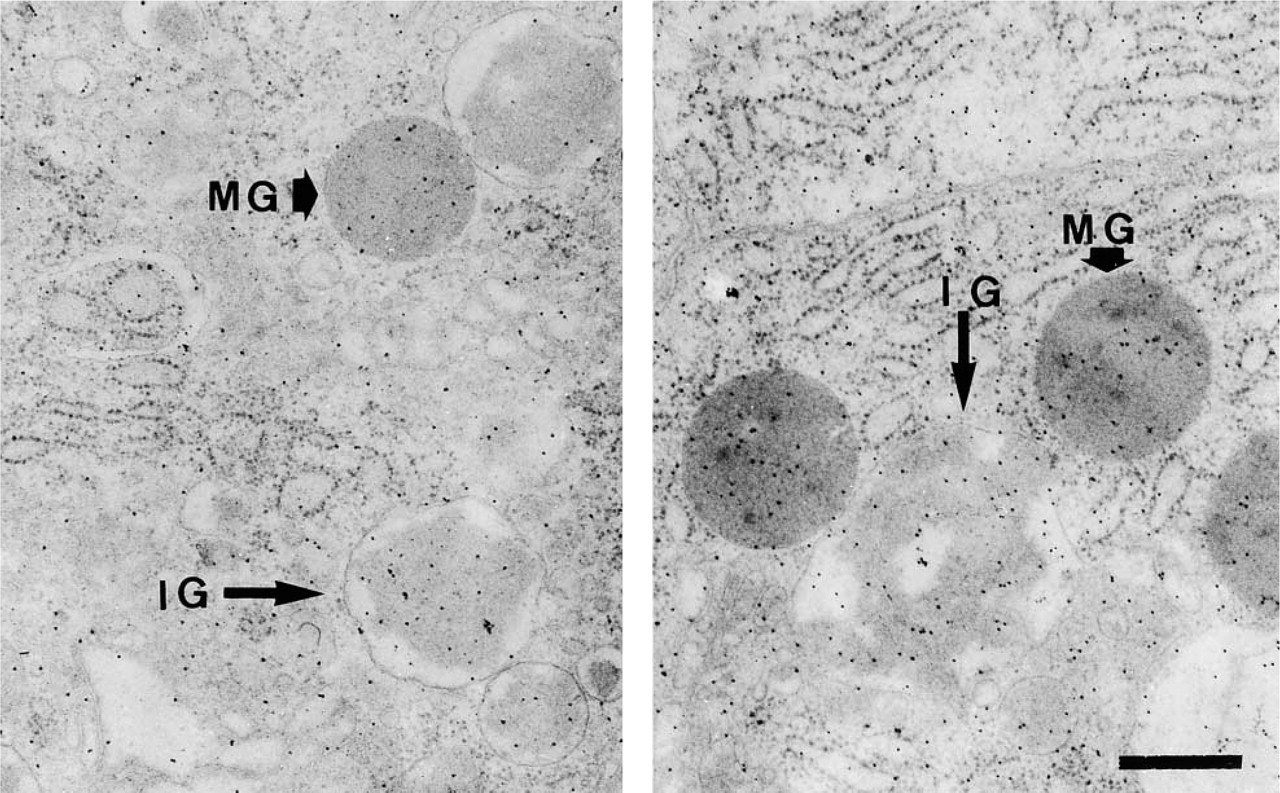
Araldite section of a mouse pancreatic acinar cell 4 hr (left) and 8 hr (right) after pilocarpine injection. Tissue fixed with aldehydes and OsO4 was post-labeled on the section with cationic colloidal gold. Note the differences in labeling densities between the early condensing immature granules (= immature granules) (IG) and the mature ones (MG). Bar = 0.5 μm.
The frequency histogram of the CCG binding density in secretory granules is shown in Figure 2. The labeling density in the secretory granules exhibited considerable variations. The lowest density in the immature granules, 4 hr after pilocarpine injection, was calculated and found to be 35.9 ± 21.3 particles/μm2 (mean ± SD, 89 immature granule profiles), while in the mature granules, 8 hr after pilocarpine injection, it was increased by about 50% to a value of 64.6 ± 26.7 particles/μm2 (408 mature granule profiles). In the mature granules 4 hr after pilocarpine injection, the density was 43.0 ± 18.6 particles/μm2 (78 immature granule profiles). All three histograms differed significantly. This was done by the Kolmogorov–Smirnov test, which compares two size distributions and is independent of any size distribution assumptions. The Kolmogorov–Smirnov test compares the curves of two cumulative distributions by calculation of a variable (Dmax), which equals the largest observed distance between the curves. It is a sensitive test to examine differences in location, dispersion, and skewness (Sokal and Rohlf 1969). The present results indicate that the labeling density differs from one cellular granule pro file “age” to another and that the range of variation varies from one cell population to another.
To check the labeling distribution within the granule profile, we have drawn a center-spaced grid of circles and projected it over circular granules from the 8-hr group. The granule profiles were divided by diameter size into four main groups, i.e., 196 granule profiles were selected from the 407 granule profiles because they were of a similar radius. The other granule profiles either deviated from the clear circular profile (maximal axial ratio 1:1.15) or were out of the rings' dimensions. The results (Figure 3) demonstrate that for each granule profile size group the gold particles were almost evenly distributed from the granule center. Small granule profiles (Figure 3 upper left panel; radius = 0.2 μm, 90 profiles) were evenly labeled with a mean density of 55–60 gold particles/μm2. A similar distribution was observed in the largest granules (Figure 3 lower right panel; radius = 0.45 μm, 9 profiles). However, the mean density was lower, about 45–50 gold particles/μm2. It should be noted that although the granule profiles are of equal size groups they result from granule sections of various diameters.
Scattergram analysis of correlation between CCG particles mean density and the corresponding granule mean size is shown in Figure 4. The mean density of CCG particles in the immature granule profiles, derived 4 hr after pilocarpine injection, was ≈35 gold particles/μm2. On the mature granule profiles it was ≈40 gold particles/μm2, while 8 hr after pilocarpine injection the mean density of CCG particles in the mature granule profiles was increased up to ≈65 gold particles/μm2 (Figure 4; the broken line data were calculated from Figure 2). These results may suggest that in the hours after granule formation “new” anionic sites are expressed and might be either due to intra-granule content redistribution or biogenesis of new anionic determinants, such as sulfated glycosaminoglycans. Our unpublished data in mast cells demonstrate similar behavior.
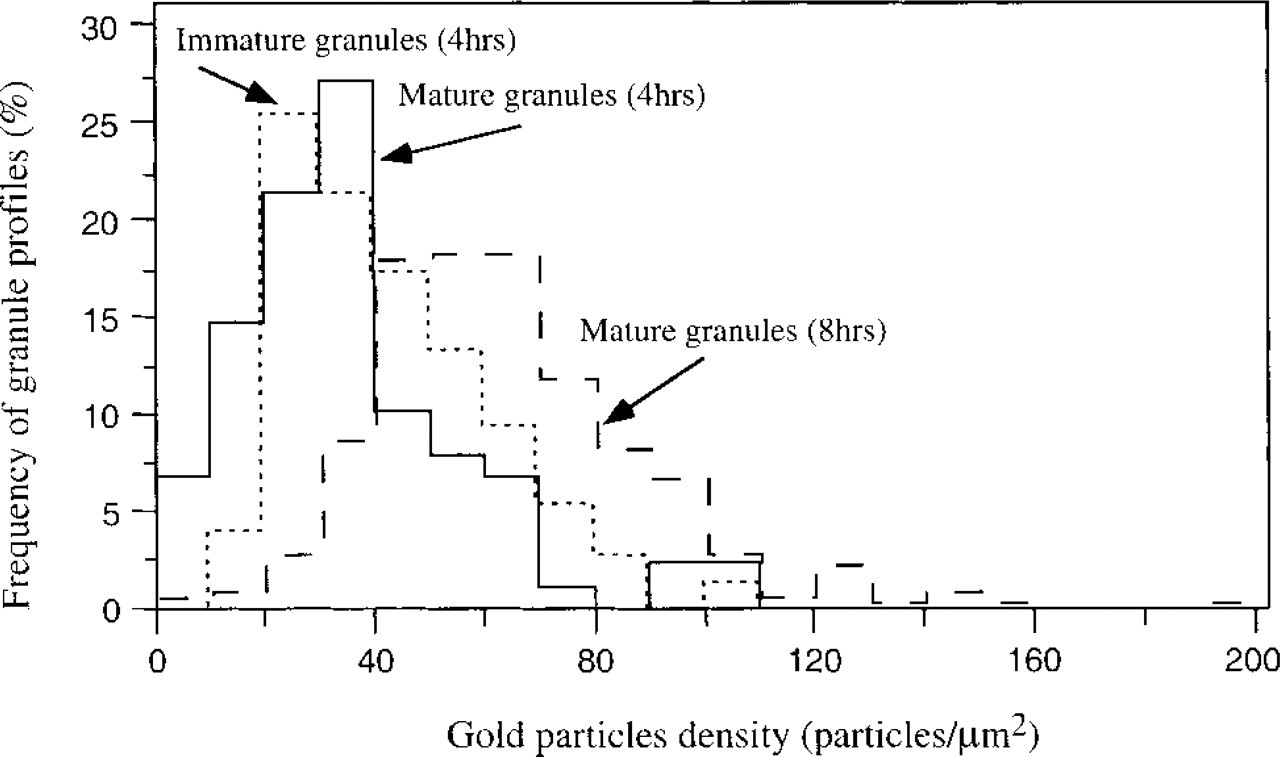
Frequency histogram of cationized gold particle density. Data are for mouse pancreatic acinar cells for both immature granules (dotted line, 89 immature granule profiles; 35.9 ± 21.3 particles/μm2) or mature granules (smooth line, 78 granule profiles; 43.0 ± 18.6 particles/μm2) 4 hr after pilocarpine activation and for mature granules (dashed line, 408 granule profiles; 64.6 ± 26.7 particles/μm2) 8 hr after pilocarpine activation.
Discussion
The classical model of secretory granule formation suggests that newly synthesized secretory proteins and sulfated proteoglycans are transported from the rough endoplasmic reticulum to the Golgi complex. Then they can undergo post-translational modification and are packaged for secretion by condensation within membrane-bound very small immature granules which fuse to form large immature granules (Palade 1975; Beaudoin and Grondin 1992; Lew et al. 1994). The contents of these vesicles are believed to then be processed and further concentrated, forming mature secretory granules. After acquiring their mature appearance, the secretory granules reside in the cytoplasm until they are secreted. Thus, carboxyl and sulfate anions constitute the two major sites of negative charge in secretory granules.
The binding of CCG to mouse pancreatic acinar cell secretory granules indicates that the granule content is negatively charged. The charge properties of these constituents are preserved throughout the embedding procedure, which includes glutaraldehyde and OsO4 fixation, dehydration, and Araldite infiltration. The density is increased from the immature granules (= progranules) to the mature granules. Eight hours after activation, the granule charge density is higher compared to the 4-hr group. Binding of CCG along the secretory pathway, i.e., the RER or Golgi compartment, was significantly less than in the granule compartment and probably reflects sulfated anionic domains in various proteins. Careful observation of many micrographs suggests that most of the labeling in the pancreas is associated with the RER, mainly along the membrane.
It was previously demonstrated in other tissues that, at pH >7.0, CCG binds primarily to sulfated proteoglycans (Vorbrodt 1989; Skutelsky et al. 1992) and, considerably less intensively, to anionic groups contributed by carboxylated substances such as sialic acid (Goode et al. 1991; Skutelsky et al. 1995b). Sulfate residues of proteoglycans, which serve as the storage matrix for the granule basic constituents, contribute mainly to the high negative charge of mast cell secretory granules (Uvnäs and Aborg 1970; Lagunoff 1972; Skutelsky et al. 1995a) as well as in pancreatic acinar cells (Palade 1975). We therefore suggested that the binding of CCG to mast cell granules at pH 7.4 may be attributed mainly to sulfate groups of proteoglycans (Skutelsky et al. 1995a). In the pancreas, the granules contain less sulfated proteoglycans compared to mast cells. Therefore, the carboxyl groups probably contribute more to the anionic charge density in the pancreatic acinar cells.
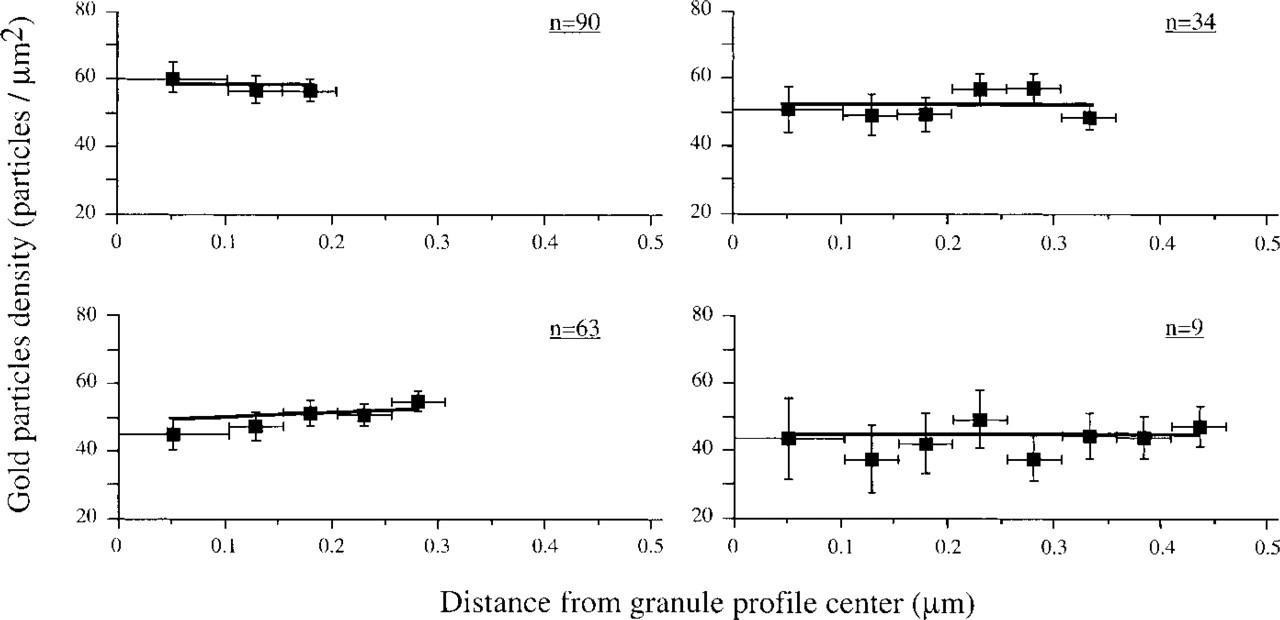
Gold particle density histograms in relation to granule diameter. Data are for mouse pancreatic acinar cells 8 hr after pilocarpine activation and are labeled at pH 7.4. The numbers in each histogram indicate the number of granule profiles measured.
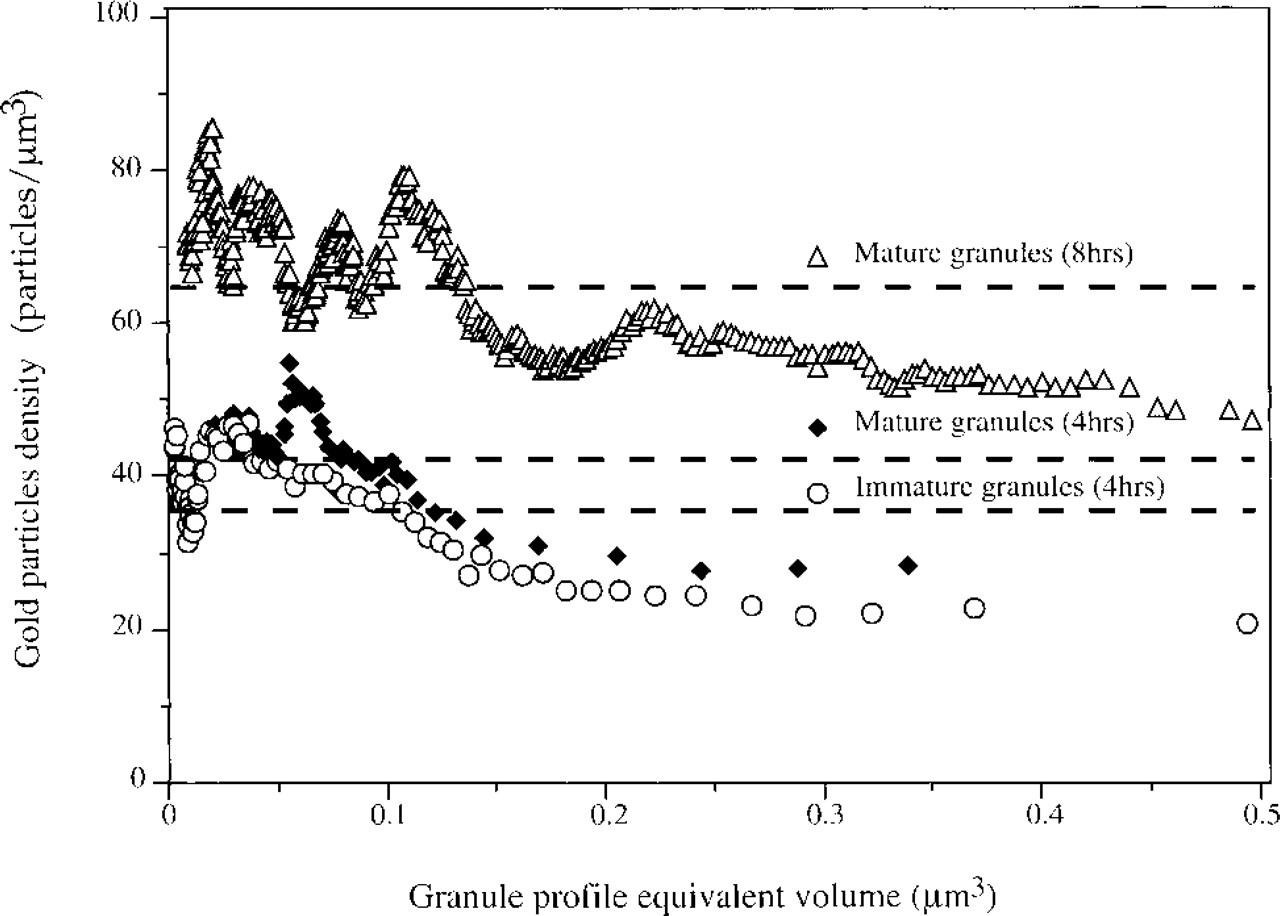
Scattergram analysis of the relation between cationized gold particle density and mean granule profile equivalent volume. Data are for mouse pancreatic acinar cells for both immature granules (○) and mature granules (♦) 4 hr and mature granules 8 hr (Δ) after pilocarpine activation. Broken line indicates the mean gold particle density as calculated from Figure 2.
The density of attached CCGs in the different granules exhibited extreme variations that were generally in correlation with the size and granule “age.” In general, the density of CCG exhibited a reverse correlation with the size of the granule profile, i.e., in each granule “age” group the CCG density was higher in the small profiles compared to the larger ones. These variations may be related to the differences in the relative density of sulfated proteoglycans and carboxyls in the granules. Rothman et al. (1989), using high-resolution X-ray electron microscopy, demonstrated that the proteins are distributed in multi-layers. Our results (Figure 3) demonstrate that in all granule size groups the anionic sites along the granule profile are evenly distributed. Granule profiles are a mixture of slices resulting from granules of mixed populations. Previously we have shown that in random sections of a population of spheres, the equatorial section will be the most probable (Elias 1954; Hammel et al. 1983). In addition, almost no caps will be generated. However, in later work we demonstrated that in the case of heterogeneous particles the resultant caps from larger particles will be added to the equatorial sections of the small particles. Therefore, the interpretation of our results might be that in large profiles (radius = 0.35–0.45 μm, which represent mainly near-equatorial sections) the anionic sites are almost evenly distributed. However, the smaller profiles represent a mixture of granule profiles generated from various granule sizes, thus representing different locations along the granule axis. Some or most of these profiles have a higher anionic density, almost equal to that of the larger groups. The smallest group size (less than 0.2 μm) is composed of 90 circular profiles selected from the 408 sampled granule sections (about 22%) and probably represents all of the near cap sections (Hammel et al. 1993). These profiles have a 30–50% increase in granule profile density compared to the larger profiles, suggesting that the granule peripheral region anionic sites might be different.
The density of CCG varies among different cell types. Yang et al. (1999), using a similar approach, studied the fine structural localization of sulfated glycoseaminoglycans in various maturational stages of guinea pig neutrophils. They found that in promyelocytes the density (168.6 ± 7.3 particles/μm2) was higher than in the more mature cell, the myelocyte (115.2 ± 13.9 particles/μm2). In rat peritoneal mast cells the density is the highest reported (Skutelsky et al. 1995a). In granule profiles above 0.6 μm2 it is mostly below 650 particles/μm2, whereas in smaller profiles (below 0.4 μm2) it is above that level. The non-granule-associated compartments in the mast cell model are less labeled than the pancreas.
The increase in anionic site density on maturation of the granules (immature granules, 4-hr vs 8-hr groups) may be explained either by a progressive accumulation of sulfated proteoglycans or by a passive increase in their concentration due to condensation of the granule contents. The fact that the pancreatic acinar mature secretory granules are composed of quantal sizes (Hammel et al. 1987; Lew et al. 1994) suggests that there is no constitutive material addition to the secretory granules. Intragranule biochemical modifications probably change the anionic charge. Support of such an assumption might be obtained from the rat parotid isoproterenol-induced regranulation model (Blair et al. 1991). The authors were able to analyze intragranule sulfation in relation to granule maturity. They found that sulfation is a granule-associated process, even though the magnitude is well below that observed in the Golgi compartment.
Footnotes
Acknowledgements
Support for this work was received from the Israel Ministry of Health Basic Science Foundation.