
Abstract
The subcellular distribution of carbonic anhydrase II, either throughout the cytosol or in the cytoplasm close to the apical plasma membrane or vesicular compartments, suggests that this enzyme may have different roles in the regulation of pH in intra- or extracellular compartments. To throw more light on the role of pancreatic carbonic anhydrase II, we examined its expression and subcellular distribution in Capan-1 cells. Immunocytochemical analysis by light, confocal, and electron microscopy, as well as immunoblotting of cell homogenates or purified plasma membranes, was performed. A carbonic anhydrase II of 29 kD associated by weak bonds to the inner leaflet of apical plasma membranes of polarized cells was detected. This enzyme was co-localized with markers of Golgi compartments. Moreover, the defect of its targeting to apical plasma membranes in cells treated with brefeldin A was indicative of its transport by the Golgi apparatus. We show here that a carbonic anhydrase II is associated with the inner leaflet of apical plasma membranes and with the cytosolic side of the endomembranes of human cancerous pancreatic duct cells (Capan-1). These observations point to a role for this enzyme in the regulation of intra- and extracellular pH. (J Histochem Cytochem 49:1045–1053, 2001)
Keywords
T
Materials and Methods
Cell Culture
Cells of the Capan-1 cell line, isolated (Fögh et al. 1977) from a hepatic metastasis in a patient with a pancreatic adenocarcinoma, were used. The cells were maintained in culture as described elsewhere (Mahieu et al. 1994; Mairal et al. 1996).
Detection of CA II
Cytoenzymological Detection of CA. The enzymatic activity of CA was demonstrated according to the Hansson's method by both light and electron microscopic examination of cells fixed in situ with 2.5% glutaraldehyde (15 min, 4C) (Mahieu et al. 1994).
Immunocytochemistry on Fixed Cells. CA II was detected by immunoperoxidase and immunofluorescence. Reactions were performed on 1- to 6-day-old cells cultivated on glass slides in Leighton tubes, fixed in situ with paraformaldehyde (PFA 3%), then permeabilized or not with ethanol. Cells were incubated successively with polyclonal sheep immunserum directed against human CA II (Serotec, Oxford, UK; 1:100, 1 hr) containing 0.1% bovine serum albumin (BSA) followed by a serum of rabbit anti-sheep IgGs coupled to peroxidase (Pierce, Rockford, IL; 1:400, Tris-BSA, pH 7.6, 45 min). Antigen-antibody complexes were revealed using 3′-amino-9-ethyl carbazole (AEC) (Sigma Chemical; St Louis, MO) in the presence of hydrogen peroxide. Some immunoperoxidase reactions were carried out on cells fixed with paraformaldehyde and embedded in paraplast. For immunofluorescence, antigen-antibody complexes were revealed using anti-sheep IgG coupled to fluorescein isothiocyanate (FITC) (Nordic Immunological Laboratories; Tilburg, The Netherlands). In this case, preparations were observed with a confocal laser scanning microscope (LSM410; Carl Zeiss, Oberkochen, Germany). Fluorescence excitation was produced by an argon laser at a wavelength of 488 nm.
Immunocytochemistry on Living Cells. To detect CA II on the surface of Capan-1 cells, immunofluorescence reactions were carried out on living cells. Under these conditions, the cells were not permeabilized and only the extracellular epitopes of CA are revealed. Briefly, after blocking of nonspecific sites, cells were incubated with anti-CA II antibodies (1:50 in culture medium with fetal calf serum 10%, 2 hr, 4C), then rinsed and incubated with anti-sheep IgG antibodies coupled to FITC (1:400, 4C, 2 hr), and fixed with a mixture of methanol (95%)-acetic acid (5%) (–20C, 7 min). Similar reactions were performed to compare the membrane distribution of CA II and CA IV. In this case, polyclonal antibodies directed against a peptide sequence (residues 1–18) of human GPI-anchored CA IV were used (Wistrand et al. 1999). Antigen-antibody complexes were revealed using rabbit anti-sheep IgG coupled to FITC (Nordic Immunological). The preparations were observed by confocal microscopy.
Controls were carried out on both living and fixed cells. Cells were incubated (a) with primary antibody previously fully bound to purified bovine CA II (10 μg/ml, 3 hr; Sigma), or (b) with only secondary antibody coupled to peroxidase or FITC.
Immunoblotting
Cell Homogenates. To estimate the expression of CA II during growth of Capan-1 cells, immunoblots were made on cell homogenates of 1–6-day-old cultures. Cells were rinsed in PBS, then scraped off. After centrifugation (5 min, 2000 × g), the pellet was solubilized for 20 min at 4C in 1 ml of lysis buffer [HEPES 20 mM, NaCl 150 mM, EDTA 1 mM, Nonidet P-40 1%, aprotinin 25 μg/ml, leupeptin 10 μg/ml, pepstatin 15 μg/ml, phenylmethylsulfone (PMSF) 1 mM, DNase 2 μg/ml]. The lysate was centrifuged (5 min, 14,000 × g) and the supernatant collected. The supernatant was stored at −80C or used directly for immunoblotting. Proteins were assayed according to Lowry et al. (1951). The cell homogenates equivalent to 50 μg of protein were loaded onto 10% SDS-PAGE, then electroblotted onto nitrocellulose membranes. After saturation [Tris buffer solution (TBS)-Tween 20 (0.1%)-skimmed milk (5%)], CA II was detected by incubating membranes successively with anti-CA II antibodies (Serotec) (1:2000 in TBS-Tween-milk overnight at 4C), then with anti-sheep IgG coupled with peroxidase (Pierce) (1:10,000). The antigen-antibody complexes were revealed by chemoluminescence (ECL; Amersham, Poole, UK). Immunoreactivity was quantified by densitometry (Biocom; Ulis, France).
Plasma Membranes. Plasma membranes were isolated on a continuous Percoll gradient according to the method of Record et al. (1982). Experiments were performed at different ionic strengths. Briefly, 8 × 10⁷ washed cells, placed in Tris buffer 25 mM, pH 9.6, KCl 100 mM, MgCl2 5 mM, ATP 1 mM, were sonicated and centrifuged (1000 × g, 10 min). Under conditions of low ionic strength, the supernatant was adjusted to pH 7.4 and taken up in 18 ml of a mixture of 11 ml Percoll, 2.2 ml H2O, 4.8 ml Tris (40 mM), pH 7.4, KCl (40 mM), MgCl2 (2 mM). The membrane fraction was recovered after centrifugation at 160,000 × g for 10 min (60Ti rotor; Beckman). The Percoll was eliminated by two successive centrifugations (130,000 × g, 30 min). Similar experiments under conditions of high ionic strength were also conducted. The pH of the supernatant was adjusted to 9.6. The Percoll was mixed with Tris buffer 100 mM, pH 9.6, KCl 400 mM, MgCl2 20 mM, and the pH of the mixture after addition of supernatant was adjusted to 9.6. All buffers contained leupeptin (10 μg/ml), aprotinin (25 μg/ml), pepstatin (15 μg/ml), and PMSF (1 mM). The membrane proteins (15 μg) were immunoblotted as described above for the cell homogenates.
Intracellular Traffic of CA II
Two types of experiments were carried out to analyze the intracellular traffic of CA II. First, immunocytochemical reactions for co-labeling CA II and Golgi compartments using anti-CA II antibodies (1:100) and anti-Golgi zone antibodies (1:80) (Valbiotech; Paris, France) were performed on fixed and permeabilized 3-day-old cells. Antigen-antibody complexes were revealed with anti-IgG coupled to FITC (1:400) for CA II and anti-IgG coupled with tetramethyl-rhodamine isothiocyanate (TRITC; Nordic Immunological) (1:200) for the Golgi marker. Preparations were observed by confocal microscopy. Second, CA II was examined on cells treated with brefeldin A (BFA). Six-day-old cells were treated for 2, 5, 9, 14, or 16 hr with BFA (5 μg/ml; Sigma) solubilized in ethanol. CA II was then detected by immunoperoxidase reactions. The percentage of CA II-immunoreactive cells was then determined. The following controls were carried out: (a) Immunocytochemical reactions were performed on the cultures to estimate the distribution and intensity of CA II immunolabeling before treatment with BFA or ethanol; (b) cells were cultured in the presence of ethanol (1 μl/ml), the solvent of BFA for each duration of treatment (2, 5, 9, 14, or 16 hr) followed by immunocytochemistry for detection of CA II; (c) check of reversibility of the action of BFA: cells treated with BFA for 2, 5, 9, 14, or 16 hr were then maintained in a complete medium without ethanol or BFA. At 48 hr later the cultures were fixed for immunoperoxidase staining.
Results
Expression of CA II in Capan-1 Cells
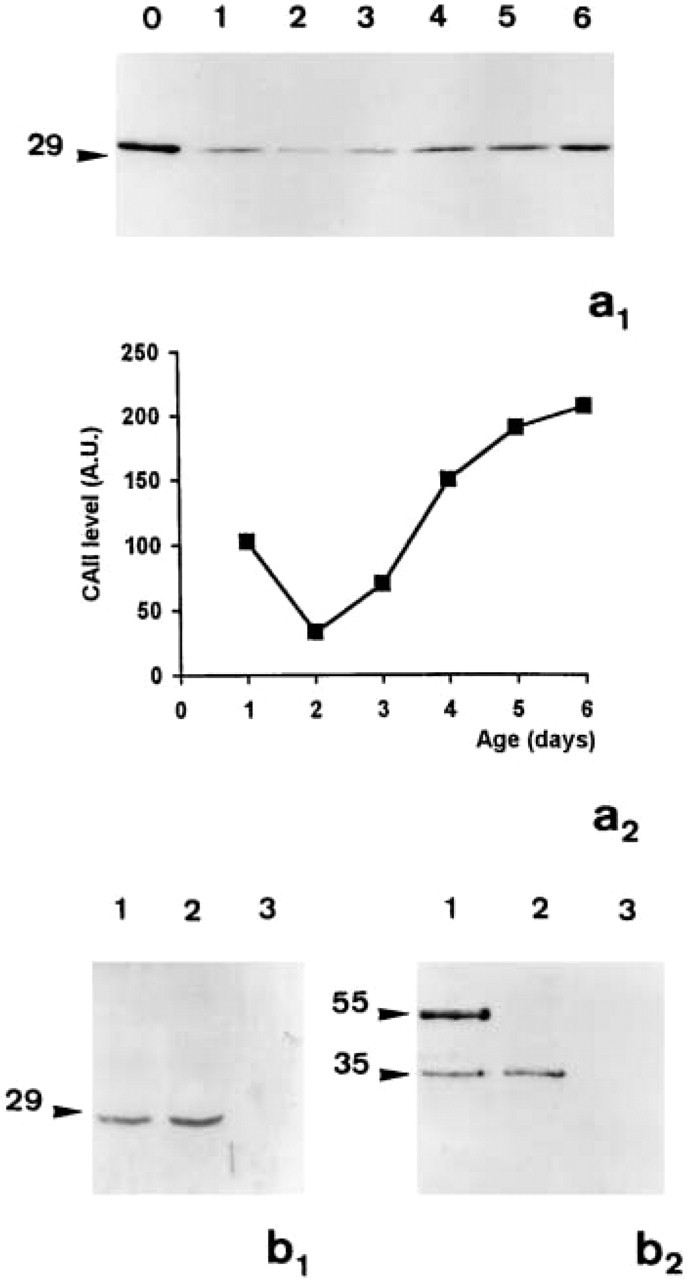
The immunoblots of the cell homogenates of 1–6-day-old Capan-1 cells revealed the presence of a single CA II-immunoreactive protein of 29 kD irrespective of the age of the culture (Figure 1a1, Lanes 1–6). Densitometric analysis showed that the expression of this protein increased gradually during growth in culture; it was threefold higher in post-confluent cells (Day 6) than in the cells at the start of growth (Day 2) (Figure 1a2). The co-migration with the purified bovine CA II (Figure 1a1, Lane 0) demonstrated that this protein was a CA II. The absence of crossreaction of the anti-CA II antibody with the human CA IV, another isoform of CA expressed in Capan-1 cells, was also verified by immunoblotting. In Figure 1b 1 it can be seen that the anti-CA II antibody that recognized the purified bovine CA II (Figure 1b 1, Lane 2) and the CA II expressed by Capan-1 cells (Figure 1b 1, Lane 1) did not recognize the purified human 35-kD CA IV (Figure 1b 1, Lane 3). Conversely, the anti-CA IV antibody did not recognize the 29-kD CA II expressed by Capan-1 cells nor the purified CA II (Figure 1b 2, Lanes 1 and 3). This antibody revealed the purified human 35-kD CA IV (Figure 1b 2, Lane 2) and two 35-kD and 55-kD proteins in the Capan-1 cell homogenates (Figure 1b 2, Lane 1).
Expression of CA II during growth of Capan-1 cells in culture. (
Distribution of CA II in Capan-1 Cells
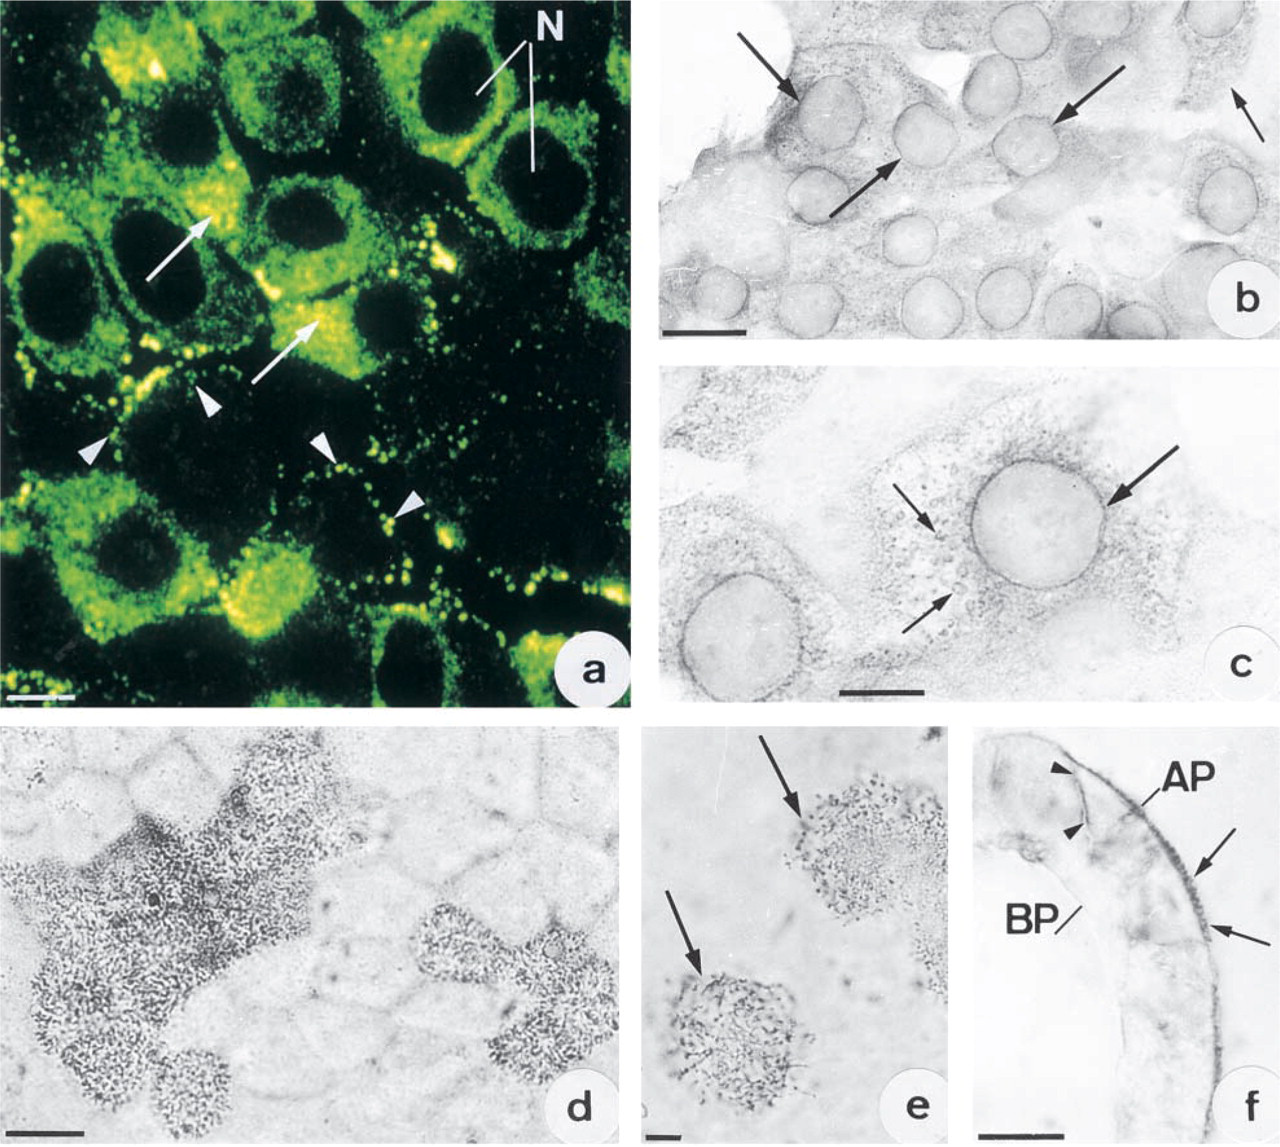
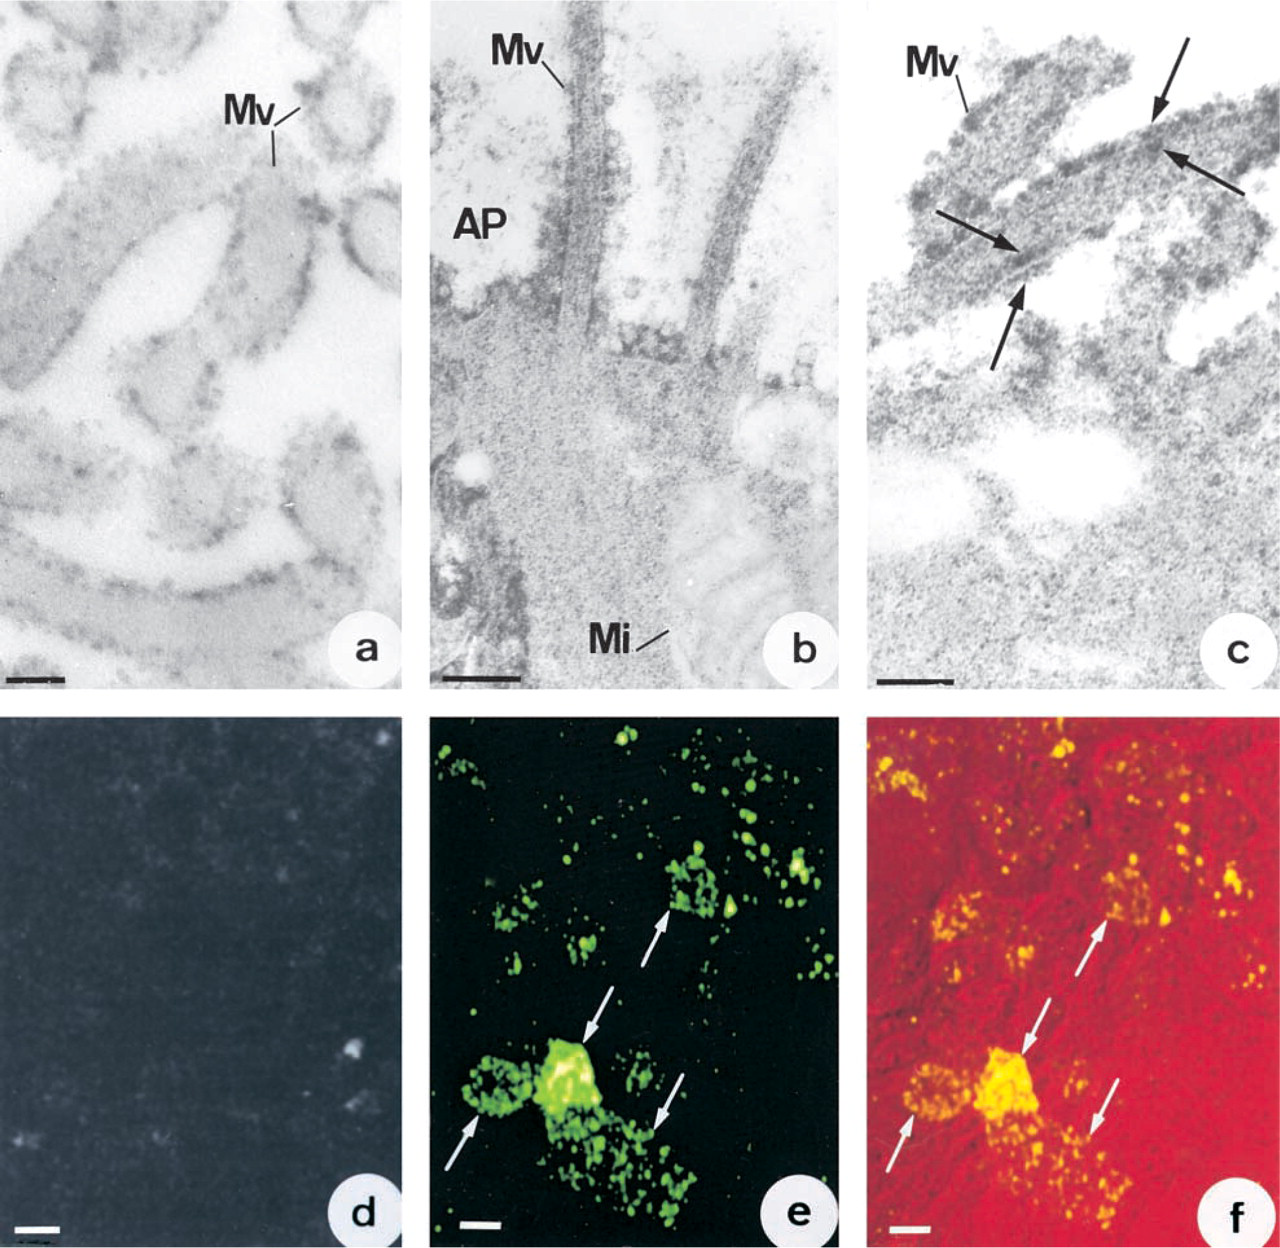
The localizations of CA II were determined from immunocytochemical reactions on fixed and permeabilized cells. At confluence, some cells exhibited strong intracytoplasmic immunoreactivity. This was mostly throughout the cytoplasm (Figure 2a) and especially in the neighborhood of the nucleus (Figure 2a, arrows). Other cells presented small immunofluorescent spots in their periphery (Figure 2a, arrowheads). In young cultures (1–3 days), most of the cells were non-polarized and exhibited intracytoplasmic immunoreactivity. This immunoreactivity was seen in the nuclear envelope (Figures 2b and 2c, arrows) and in the cytoplasm around the nuclei, either in a horseshoe or circular pattern (Figure 2c, small arrows) surrounded by many small CA II-immunoreactive granules. After Day 3, most of the cells were weakly labeled on the nuclear envelope but presented immunoreactivity in the form of granulations throughout the cytoplasm. On the other hand, in post-confluent cultures most cells had become polarized, in which the immunoreactivity was noted mainly in cytoplasmic digitations and microvilli (Figures 2d and 2e, arrows). In cross-sections of the cell layer, the immunoreactivity was seen at the apical poles of polarized cells (Figure 2f, arrows). In some cases, labeling was also observed along basolateral membranes (Figure 2f, arrowheads). Electron microscopic examination of immunoperoxidase reactions demonstrated strong immunoreactivity on the plasma membranes of the microvilli on polarized cells (Figure 3a). CA activity was also revealed on apical plasma membranes after the Hansson's reaction. Precipitates from the enzyme reaction were noted on both the outer and the inner leaflets of the plasma membrane (Figures 3b and 3c, arrows) as well as in the cytosol. Immunofluorescence studies were conducted on living cells in an attempt to determine whether the CA II lay on the inner or the outer side of the membrane. No CA II immunoreactivity was observed on the surface of Capan-1 cells (Figure 3d). On the other hand, strong CA IV immunoreactivity was detected at the cell surface (Figure 3e). Superimposition of the CA IV fluorescence image on the same field observed by interference microscopy (Figure 3f, small arrows) provided further support for this localization.
(
Distribution of CA II in plasma membranes of polarized cells. (
The controls designed to check the specificity of the immunocytochemical reactions were all negative.
Demonstration of the Association of CA II with Plasma Membranes
As further support for the presence of CA II associated with the plasma membranes of polarized cells, immunoblots were made on fractions of plasma membranes prepared under conditions of different ionic strength. Figure 4 shows the presence of a 29-kD CA II-immunoreactive protein from plasma membranes purified under conditions of low ionic strength (Figure 4, Lane 3). This protein migrated in the same way as the CA II found in the cell homogenates (Figure 4, Lane 1) or the purified bovine CA II (Figure 4, Lane 2). On the other hand, in fractions of plasma membranes purified under conditions of high ionic strength, no CA II-immunoreactive protein was detected (Figure 4, Lane 4).
CA II Traffic
Treatment of 6-day-old cultures with BFA led to a marked reduction in the number of cells showing membrane CA II immunoreactivity. In the untreated cultures (Figure 5a) or those treated with ethanol alone (1–14 hr) or in cells treated with BFA for short periods (1–4 hr), 48% of cells presented CA II immunoreactivity on their surface, whereas only 30% of cells presented such immunoreactivity after 9 hr of treatment with BFA (Figure 5b) and only 2.1% in cultures treated for 14 hr (Figure 5c). After 14 hr of treatment, immunoreactivity was observed in filamentous or elongated intracytoplasmic structures but not on plasma membranes (Figure 5c, arrows). Treatment at a concentration of 5 μg/ml BFA for more than 14 hr was found to be cytotoxic. To check the absence of toxicity of BFA, cells treated for 14 hr were maintained in a medium without ethanol and BFA. Immunocytochemistry showed the reappearance of CA II on apical plasma membranes.
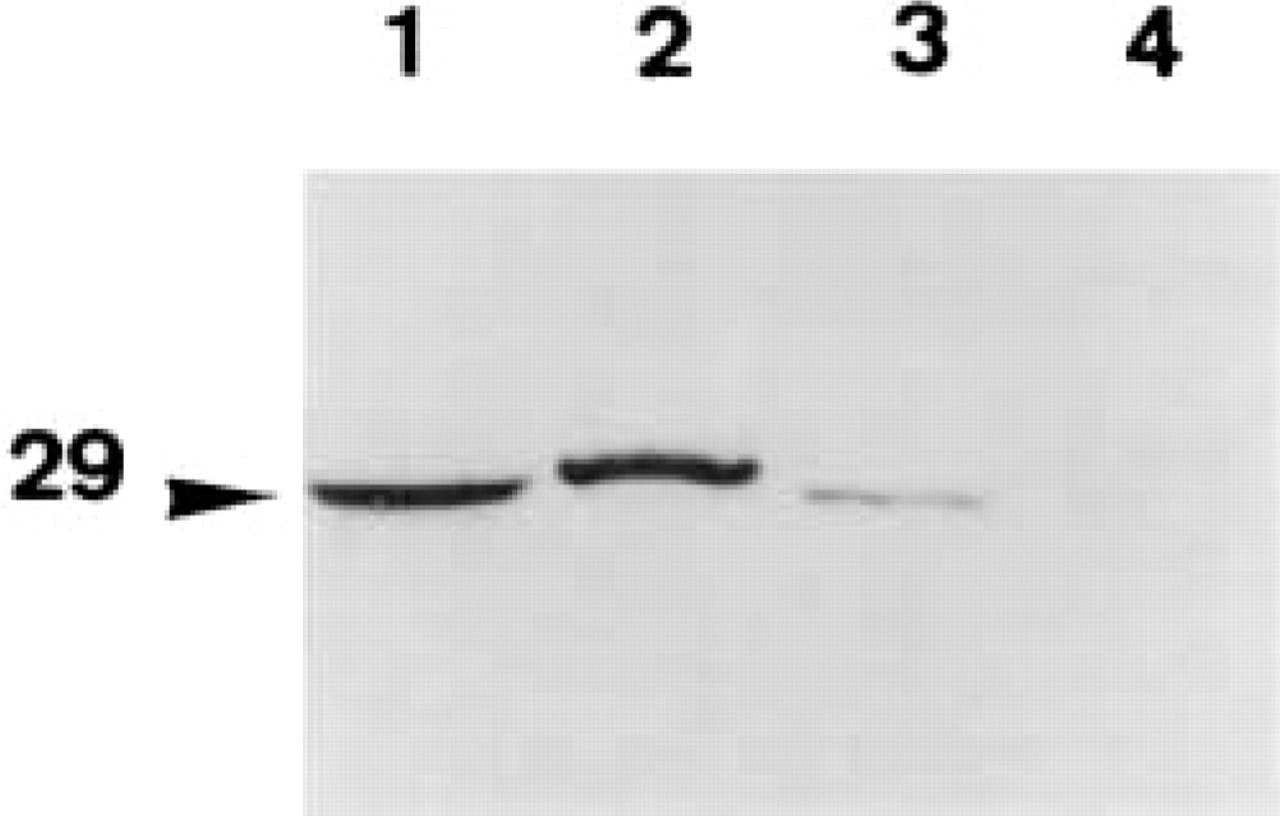
Demonstration of CA II associated with plasma membranes. Immunoblotting of plasma membranes purified on a Percoll gradient. Lane 1, purified bovine CA II; Lane 2, cell homogenate; Lanes 3 and 4, fraction of plasma membranes purified under conditions of low (Lane 3) and high ionic strength (Lane 4).
To find out whether CA II was associated with Golgi compartments, double-labeling experiments were conducted on 3-day-old cells using antibodies against CA II and Golgi compartments. Confocal microscopic study by merging the image of CA II immunofluorescence (Figure 6a, arrows) with that of the immunofluorescence from Golgi compartments (Figure 6b, arrows) showed that the two were largely co-localized (Figure 6c).
Discussion
In this study, we demonstrated an association of CA II with apical plasma membranes of polarized cells and with membranes of Golgi compartments in human cancerous pancreatic duct cells of the Capan-1 cell line.
Capan-1 cells expressed a CA II-immunoreactive protein whose molecular weight of 29 kD corresponds to that of the human CA II described in various cell types (Sly and Hu 1995). This CA II was expressed in a continuous manner, although its level of expression increased gradually during cell growth in culture. This increase was concomitant with the spontaneous and progressive acquisition of a differentiated cell stage. The existence of a relationship between the expression of CA II and differentiated cell status has also been demonstrated in other human pancreatic duct cell lines (Frazier et al. 1990) and for enzyme systems such as alkaline phosphatases (Fanjul et al. 1991) or CA IV (Mahieu et al. 1994; Mairal et al. 1996) in this same cell model. In the same way, CA II in vivo is considered to be a marker for the tissue differentiation of excretory ducts in the developing rat parotid gland (Peagler et al. 1998). In polarized Capan-1 cells, our immunocytochemical studies revealed CA II immunoreactivity on the microvilli. On electron microscopic analysis, this immunoreactivity was localized essentially in apical plasma membranes. CA IV has also been found to be confined to these membrane domains (Mahieu et al. 1994; Mairal et al. 1996). Western blotting confirmed the specificity of the immunocytochemical reactions and provided further support for the presence of CA II associated with apical plasma membranes. Immunocytochemical analysis on living cells also pointed out different distributions of CA II and CA IV on either side of the plasma membrane. Under our experimental conditions, no CA II labeling was observed, whereas the majority of cells exhibited CA IV immunoreactivity. These results suggest that the CA II associated with apical plasma membranes of Capan-1 cells is bound to the inner leaflet. CA IV has been shown to be situated on the outer leaflet in many cell types, in line with the description of this enzyme as a GPI-anchored protein (Zhu and Sly 1990; Ghandour et al. 1992; Okuyama et al. 1992; Mairal et al. 1996). On electron microscopic examination, the CA activity after the Hansson's reaction on both inner and outer leaflets of apical plasma membranes of Capan-1 cells was thought to indicate sites of activity of CA II and CA IV, respectively. In epithelial cells, CA II has been localized in apical cytoplasm underlying the plasma membranes (Wistrand et al. 1986; Holthöfer et al. 1987; Lönnerholm et al. 1988; Mahieu et al. 1994), but there is doubt about the presence of membrane CA II in cells of the surface epithelium of cecum (Lönnerholm et al. 1988) and pancreatic duct cells in primoculture (Githens et al. 1992), where the location has been described as basolateral. In erythrocytes, CA II has been demonstrated in plasma membranes associated with the carboxyl terminal of the Cl−/HCO3 − exchanger (band 3) (Vince and Reithmeier 1998). In Capan-1 cells, experiments on preparations of plasma membranes purified under conditions of high or low ionic strength showed that CA II was associated with the membrane by weak interactions. This association poses the problem of the intracellular traffic of this enzyme. Two possibilities can be suggested: (a) the cytosolic CA II underlying apical plasma membranes may associate directly with the inner leaflet under certain physiological conditions, or (b) CA II may be associated with membranes of the organelles involved in the transport of membrane proteins and may therefore be targeted to apical plasma membranes by transport vesicles. The cytoplasmic CA II immunoreactivity observed on the nuclear envelope or on granular structures distributed in perinuclear or supranuclear regions, depending on the stage of polarization of the cells, suggests that the CA II is associated early with endomembranes. The demonstration of a co-localization of CA II with a marker for the Golgi apparatus indicated that CA II was in fact associated with Golgi compartments. Furthermore, the disappearance of the CA II immunoreactivity on apical plasma membranes of cells treated with BFA, a drug that disrupts the Golgi apparatus (Fujiwara et al. 1988) and thereby blocks the traffic of membrane proteins or those secreted by the merocrine pathway, indicates that CA II in Capan-1 cells may be transported to apical plasma membranes by virtue of its association with Golgi apparatus membranes. These results differ from those found in the coagulating gland of the rat, in which the isoform CA II, although secreted, was not seen to be associated with endomembranes (Wilhem et al. 1998). In Capan-1 cells, we suggest that the CA II, which does not possess a peptide signal, is synthesized in free polyribosomes, then binds to the cytosolic leaflet of membranes of endoplasmic reticulum or Golgi compartments, which in turn become vesicles and so transport it to the apical plasma membrane. The physiological significance of a CA II linked to the endomembranes and the plasma membrane was assumed to involve synthesis of HCO3 − ions or protons regulating extra- and intracellular pH. In enterocytes, CA II is believed to be involved in the dissipation of intracellular pH gradients stemming from H+-coupled peptide transport, although the enzyme was not described to be associated with cell organelles (Stewart et al. 1999). In epididymal narrow cells, CA II was localized near vesicles and was believed to play a role in the acidification of the epididymal lumen by producing H+ ions that are expelled into the matrix of the vesicle by a vacuolar H+ ATPase (Hermo et al. 2000). In Capan-1 cells, CA II could well be associated with a transmembrane protein, as has been demonstrated in the erythrocyte (Kifor et al. 1993; Vince and Reithmeier 1998). This would enable transfer of HCO3 − ions or H+ either to the extracellular medium or to the matrix of membrane organelles. In conclusion, in Capan-1 cells, CA II associated with the cytosolic leaflets of membranes (of both the cells and their organelles) point to a role for this enzyme in the regulation of intra- and extracellular pH.
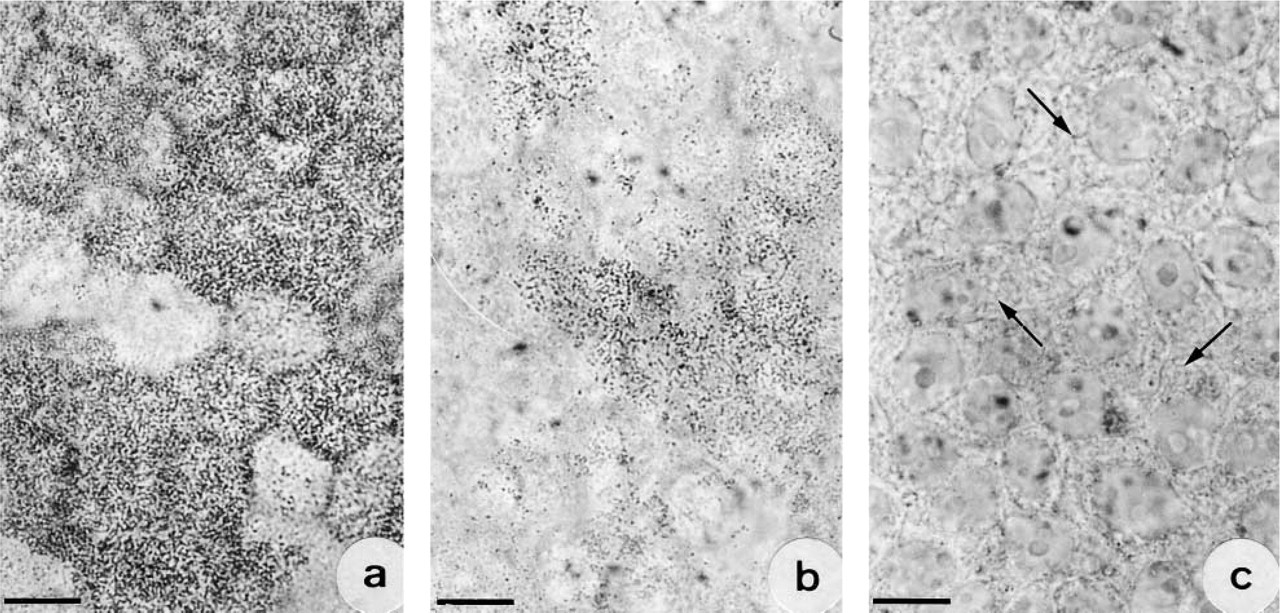
Progressive decrease in CA II immunoreactivity on the surface of polarized cells after treatment with BFA. (
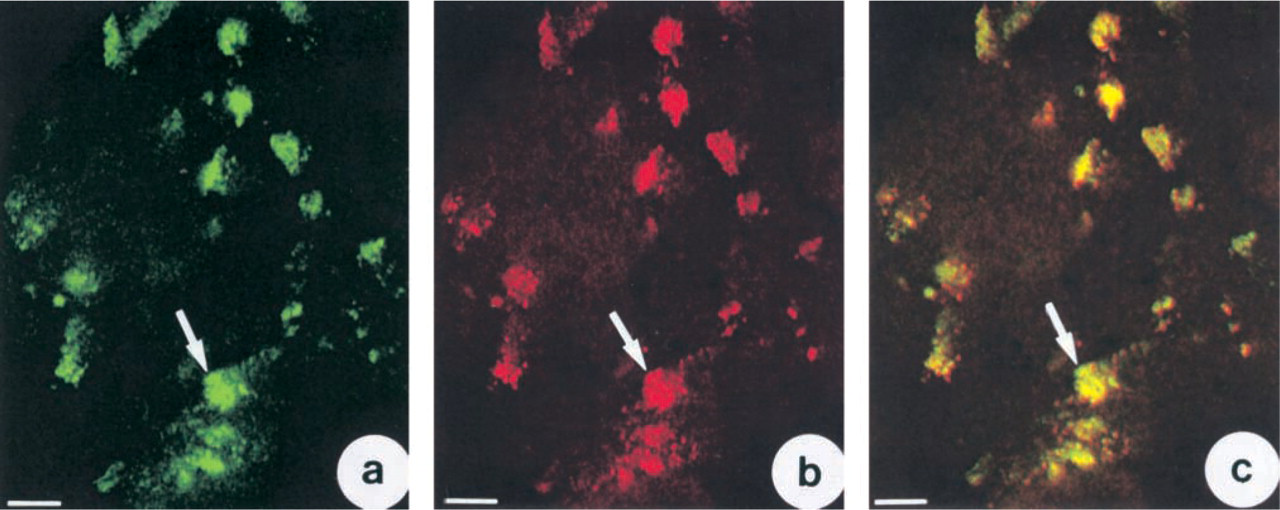
Demonstration by confocal microscopy of co-localization of CA II and Golgi compartments. (
Footnotes
Acknowledgments
Supported by the Association Française de Lutte contre la Mucoviscidose (AFLM) and by the Ministère de l'Enseignement Supérieur et de la Recherche (MESR).
We would like to thank Dr Esclassan for his fruitful discussion and assistance, and Mr F. Stefani and Mr C. Baritaud for their technical assistance.