
Abstract
High-resolution physical maps are indispensable for directed sequencing projects or the finishing stages of shotgun sequencing projects. These maps are also critical for the positional cloning of disease genes and genetic elements that regulate gene expression. Typically, physical maps are based on ordered sets of large insert DNA clones from cosmid, P1/PAC/BAC, or yeast artificial chromosome (YAC) libraries. Recent technical developments provide detailed information about overlaps or gaps between clones and precisely locate the position of sequence tagged sites or expressed sequences, and thus support efforts to determine the complete sequence of the human genome and model organisms. Assembly of physical maps is greatly facilitated by hybridization of non-isotopically labeled DNA probes onto DNA molecules that were released from interphase cell nuclei or recombinant DNA clones, stretched to some extent and then immobilized on a solid support. The bound DNA, collectively called “DNA fibers,” may consist of single DNA molecules in some experiments or bundles of chromatin fibers in others. Once released from the interphase nuclei, the DNA fibers become more accessible to probes and detection reagents. Hybridization efficiency is therefore increased, allowing the detection of DNA targets as small as a few hundred base pairs. This review summarizes different approaches to DNA fiber mapping and discusses the detection sensitivity and mapping accuracy as well as recent achievements in mapping expressed sequence tags and DNA replication sites. (J Histochem Cytochem 49:939–948, 2001)
H
High-resolution maps providing ordered sets of cloned DNA fragments at the 100-kb level of resolution are assembled with smaller, more manageable DNA fragments isolated from other libraries. Most groups prefer cloning of genomic DNA in vectors that maintain relatively large DNA fragments without rearrangements, are non-chimeric, and allow easy DNA purification. In general, high-resolution maps are composed of overlapping cosmids (Stallings et al. 1992; Tynan et al. 1992; Nizetic et al. 1994), P1/PAC clones (Pierce et al. 1992; Ioannou et al. 1994), or bacterial artificial chromosomes (BACs) (Shizuya et al. 1992). Assembly of the high-resolution maps requires identification of cloned DNA sequences that contain overlapping regions of the genome (Cheng and Weier 1997). To minimize the effort invested in assembling a contiguous set of clones, clone overlaps need to be determined quickly and accurately. This has been accomplished by various forms of clone fingerprinting [e.g., by identification of common restriction fragment or inter-Alu PCR patterns (Branscomb et al. 1990; Nelson 1991; Patil et al. 1994), by hybridization to bound filter clone arrays (Hoheisel and Lehrach 1993; Locke et al. 1996) or oligonucleotide arrays (Sapolsky and Lipshutz 1996), and by identification of overlapping sequence tagged sites (Green et al. 1991; Aburatani et al. 1996). The development of radiation hybrid mapping (Cox et al. 1990), the availability of large numbers of STS markers, and the construction of extensive bacterial clone resources provide additional means to accelerate the process of mapping a chromosome and preparing clone contigs ready for sequencing. These techniques, although effectively used by the genome community, are limited because they do not readily yield information about contig orientation, extent of deletions or rearrangements in clones, overlap of contig elements, or their chimerism status, nor do they provide information about the extent of gaps in the maps. The precise localization of cloned DNA fragments within much larger genomic fragments and knowledge about the extent of overlap between two clones is needed to assemble high-resolution physical maps. Techniques to rapidly identify minimally overlapping clones and to determine the extent and orientation of overlap expedite the construction of minimal tiling paths and facilitate the sequence assembly process. As demonstrated in this review, FISH can provide this critical information. Furthermore, FISH-based mapping is one of the few mapping procedures without requirements for different clones to overlap to be positioned and ordered (Horelli–Kuitunen et al. 1999).
In early applications of FISH-based clone ordering and assembly of physical maps, Brandriff and colleagues (1991a) took advantage of the high hybridization efficiency and enhanced spatial resolution obtained with decondensed human sperm DNA. In their approach, individual human sperm nuclei were fused with hamster eggs and probes were hybridized to the decondensed DNA of human pronuclei (Brandriff et al. 1991b). The example in Figure 1B demonstrates such decondensation in form of a cloud or network of green signals produced by a biotin-labeled probe directed towards the repeated satellite III DNA in the heterochromatic region of chromosome 9q11. The probe visualized with avidin–FITC fluoresced in green (Figure 1B), and the DNA was counterstained with DAPI emitting blue fluorescence (Figure 1A). The human sperm–hamster egg fusion technique was used successfully to order cosmid clones in preparing high-resolution physical maps for human chromosome 19 (Brandriff et al. 1992; Ashworth et al. 1995).
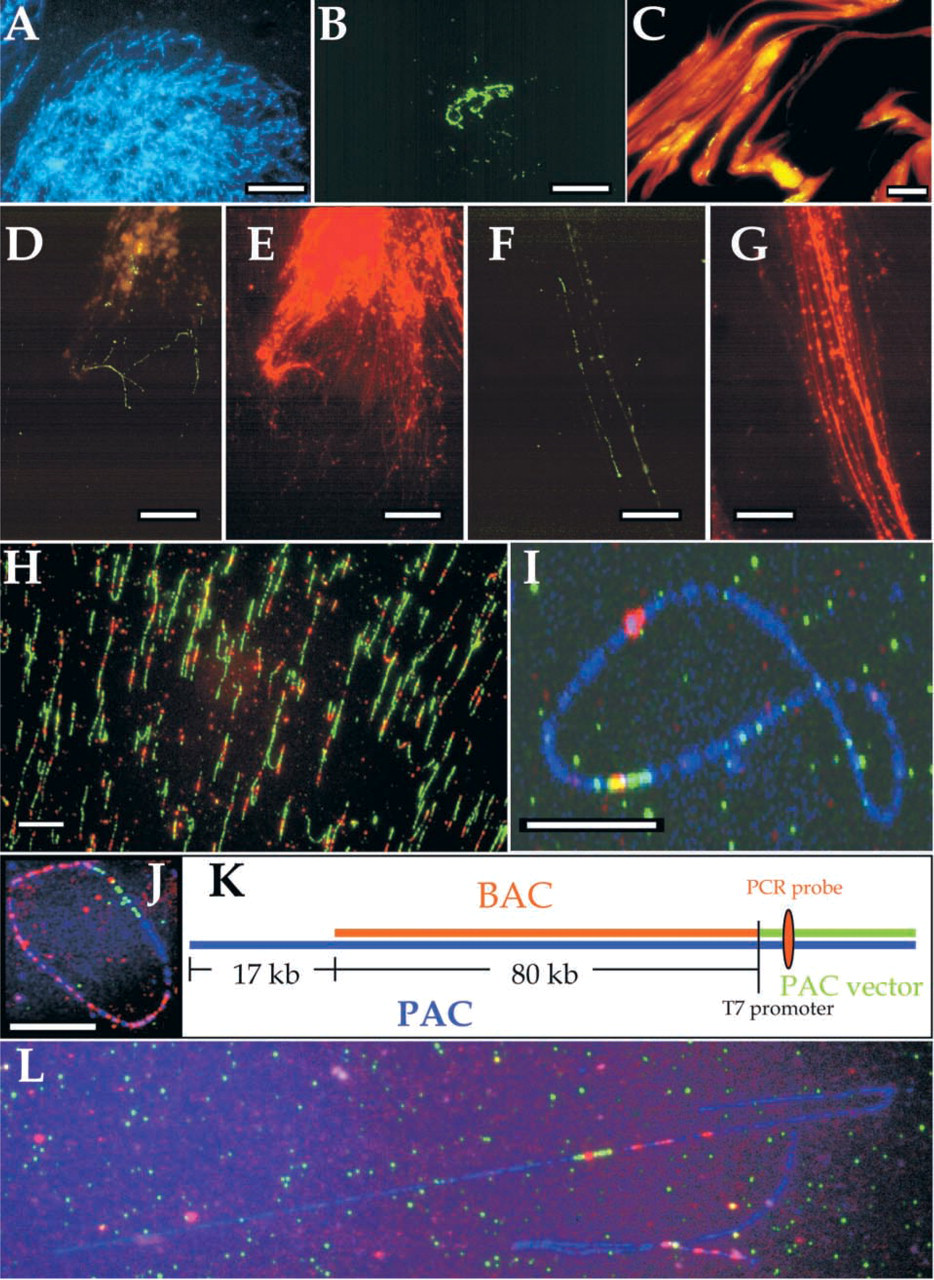
DNA fiber mapping. (
The procedure, however, had two obvious problems. Fusion of human sperm with hamster eggs and fixation of pronuclei is a time-consuming, laborious process and might not scale well enough to meet the high-throughput requirements of most genome projects. The second shortfall of the procedure was a complete lack of control over the extent of DNA decondensation and orientation of pronuclei. This spurred efforts in the 1990s to manipulate chromatin or purified DNA molecules that could serve as a template for high-resolution physical mapping of DNA probes. The optimal procedure would be inexpensive, rapid, reproducible, and deliver mapping data limited only by the resolution of the light microscope. A decade later, we find ourselves equipped with an arsenal of complementary FISH-based mapping procedures that cover a very broad range of mapping intervals. Furthermore, the simultaneous development of more sensitive fluorescence detection reagents has pushed the limits of detection down to a few hundred base-pairs (bp).
DNA Fiber Mapping
The expression “DNA fiber mapping” has become a collective name for quite different mapping techniques. As indicated in Figure 2, the diameter of DNA fibers increases as DNA molecules with a diameter of 2 nm are packed into chromatin ranging from 10 nm for histone-packed DNA molecules and 30 nm for chromatin fibers all the way to chromatids of 700 nm diameter. Chromatin can be released from interphase cell nuclei by various chemical or mechanical methods, and investigators tried to coin names that reflect their individual approach. Isolation of DNA from cell nuclei, extension, and preparation of chromatin or DNA fibers with diameters ranging in size from a few to several hundred nm (Figure 2) improves the accessibility of the DNA targets for both probes and detection reagents. Accordingly, the hybridization efficiencies increase, and DNA targets of less than 1 kb can be detected routinely using procedures normally applied in metaphase and interphase cell FISH.
In 1992, Heng et al. described the use of chemicals to release chromatin from interphase cell nuclei. The results look somewhat similar to the propidium iodide-stained free chromatin shown in Figure 1C. Heng et al. (1992) used the drug N-[4-(9-acridinylamino)-3-methoxyphenyl]-methanesulfonamide (m-AMSA) and an alkaline lysis procedure to release the DNA from interphase cells and demonstrated mapping of DNA sequences in distances ranging from 21 kb to 350 kb onto the extended chromatin. The authors speculated that, with multicolor FISH, free chromatin mapping would readily resolve gene sequences separated by as little as 10 kb (Heng et al. 1992). Soon thereafter, Senger et al. (1994) and Fidlerova et al. (1994) demonstrated the use of a sodium hydroxide/ethanol mixture or 70% formamide to prepare chromatin fibers which they called “free DNA.” Hybridization signals from cosmid probes appeared as extended lines and overlaps between clones were determined using the lengths of the probe signals and their known kilobase size as an internal standard. Typical experiments calculated averages from 30 or more signals (Senger et al. 1994).
Wiegant et al. (1992) and Lawrence et al. (1992) applied a different chemical method to release DNA from cells producing so-called “DNA halos.” The procedure was based on detergent and high salt extraction followed by intercalating dye/UV treatment (Cook et al. 1976; Vogelstein et al. 1980). Using multicolor hybridizations, these investigators were able to determine relative map positions and to detect 10-kb overlap between individual cosmid clones. Wiegant et al. (1992) noted cosmid-specific signals that appeared as linear beaded signals of about 10 μm (i.e., about 3.5–4 kb/μm), and the authors concluded that their DNA halo preparations produced “essentially linearized” DNA. The map configuration of α-satellite DNA arrays or single-copy DNA could typically be derived from analysis of only 5–10 cells. These findings were confirmed independently by the work of Lawrence et al. (1992). But as Gerdes et al. pointed out in their publication in 1994, “many procedures can be used to decondense DNA for in situ hybridization, however many of these result in highly variable and apparently random threads of DNA smeared erratically across the slide, with little if any retention of native morphology” (Gerdes et al. 1994). As the images in Figures 1D-1G illustrate, DNA halo preparations often show residual nuclei containing compact hybridization domains, while the direction, extent, and straightness of hybridization tracks on the extended chromatin appear to be highly variable.
If DNA molecules could be stretched uniformly in one direction, they might provide linear templates for visual FISH mapping. Parra and Windle (1993) described a procedure they termed “direct visual hybridization” (DIRVISH), in which 100–5000 cells in phosphate buffer were placed on a one end of a slide and air-dried. The slide was then immersed in a lysis solution containing detergent, removed after 5 min, and tilted to allow the drop of DNA to run down the slide. The procedure produced some linear arrangements of DNA but, on the basis of the extent of hybridization signals, the authors estimated that the DNA was extended to a length ranging from 40% to 200% of the length of relaxed duplex DNA, i.e., 3.4 nm/bp (Parra and Windle 1993).
In the following year, Heiskanen et al. (1994) published a protocol to stretch genomic DNA embedded in agarose. The DNA was melted on a microscope slide by heating the slide, then distributed and stretched manually using a coverslip. Major drawbacks of this manual procedure were heterogeneous stretching and a rather low abundance of informative signals on the slides.
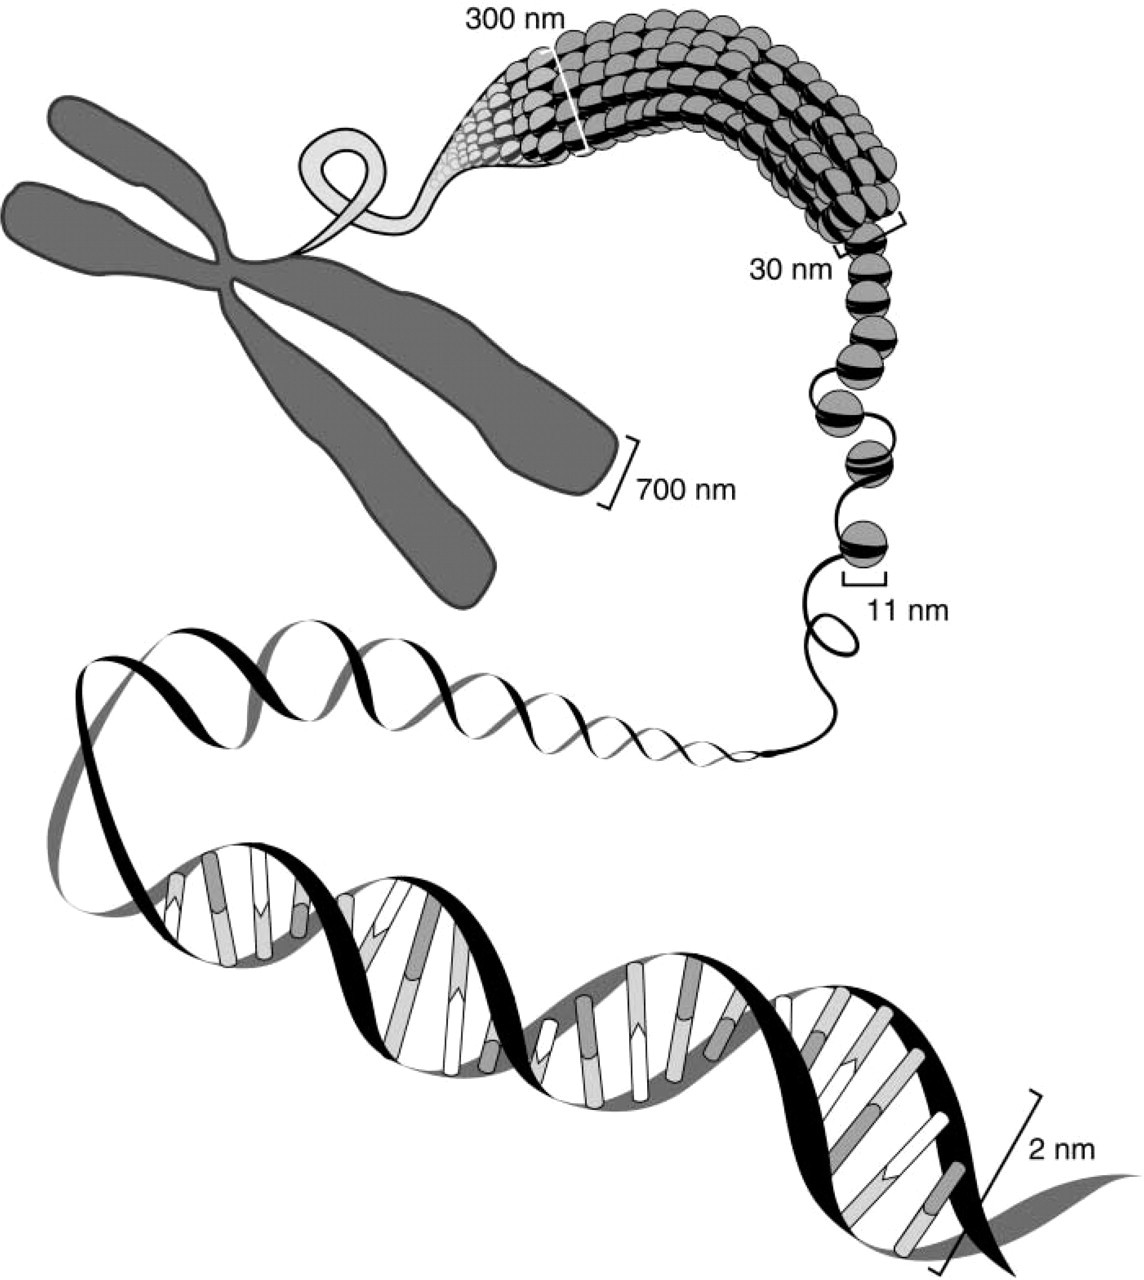
Packaging of DNA into chromatin and chromosomes. Several levels of packing of DNA can be discriminated. Two-nanometer-wide DNA molecules are folded into 11-nm chromatin segments which, when tightly packed with nucleosomes, appear as 30-nm chromatin fibers. Further packing leads to chromosomal sections with a diameter of about 300 nm and the 700-nm-thick chromatids of metaphase chromosomes.
Procedures published by 1995 allowed FISH for most preparations of decondensed nuclear or isolated cloned DNA and visualization of probe overlap to provide some information about the existence and size of gaps between clones (Parra and Windle 1993; Florijn et al. 1995; Heiskanen et al. 1995, 1996). However, none of these techniques provided sufficiently accurate information about the extent of clone overlap or the separation between elements in the map because the chromatin onto which clones were mapped was condensed to various degrees from site to site in these preparations (Rosenberg et al. 1995).
We demonstrated that cloned DNA fragments can readily be mapped by FISH onto DNA molecules straightened by the hydrodynamic action of a receding meniscus and, referring to its quantitative nature, we termed our technique “Quantitative DNA Fiber Mapping (QDFM)” (Weier et al. 1995). In QDFM, a solution of purified DNA molecules is placed on a flat surface prepared so that the DNA molecules slowly attach at one or both ends. The DNA solution is then spread over a larger area by placing a coverslip on top. DNA molecules are allowed to bind to the surface. During drying, the molecules are straightened and uniformly stretched by the hydrodynamic action of the receding meniscus. Molecules prepared in this manner are stretched with remarkable homogeneity. We estimated that a properly stretched molecule should extend about ∼2.3 kb/μm, i.e., approximately 30% over the length predicted for a double-stranded DNA molecule of the same size (Bensimon et al. 1994; Weier et al. 1995) (Figure 1H). We also showed that QDFM can be applied to linear or circular DNA molecules ranging in size from a few kb to more than 1 Mbp, which enabled us to determine clone overlaps or to map small probes with near-kilobase resolution onto entire yeast chromosomes and mega-YAC clones from the CEPH/Genethon library (Wang et al. 1996) (Figures 1J-1K).
The subsequent studies of Hu et al. (1996) and Yokota et al. (1997) presented rapid protocols to prepare DNA fibers on 3-aminopropyl-triethoxysilane-coated glass or mica slides. In their studies imaging λ DNA molecules by atomic force microscopy, Hu et al. (1996) let coverslipped DNA molecules bind to the surface for only a few minutes. When the coverslip was removed for imaging, the molecules were straightened by the moving meniscus. Yokota et al. (1997) developed a protocol in which the meniscus motion was controlled mechanically, which provided advantages in speed and uniformity of the straightened molecules.
Overcoming Challenges in Mapping Tandemly Repeated DNA Sequences
Most mammalian genomes contain very large blocks of heterochromatin. Certain regions such as the (near)-centromeric heterochromatin seem to be involved in karyokinesis and chromosome association during meiosis (Dozortsev et al. 2000), but the overall role of these clusters of “junk DNA” remains largely unknown (Epplen et al. 1998). Physical map assembly in heterochromatic regions by more conventional methods, i.e., clone fingerprinting or STS content mapping, has proved less efficient, and initial releases of maps of the human, Drosophila, and other complex genomes might suffer from the presence of major gaps.
Several groups applied DNA fiber mapping techniques to investigate the interface between euchromatic and heterochromatic regions as well as the organization of tandem DNA repeats in humans (Wiegant et al. 1992; Haaf and Ward 1994b; Shiels et al. 1997), animals (Sjöberg et al. 1997; Li et al. 2000), and plants (Fransz et al. 1996; Jackson et al 1998, 1999; Zhong et al. 1998). The methods applied by these researchers ranged from DNA halo preparations and extended chromatin to highly purified DNA molecules. Published results showed very specific beads-on-a-string patterns and presented convincing cases that DNA fiber mapping is a powerful tool to decipher the organization and extent of centromeric and telomeric DNA repeats.
Mapping of Single-copy DNA
Physical Map Assembly
The assembly of high-resolution physical maps has been a major application of DNA fiber mapping. Successful efforts to construct local maps for delineation of disease genes were mentioned above, but the success of additional investigators deserves proper recognition.
Klockars et al. (1996) used fiber-FISH to construct a physical map of the CLN5 region on 13q22. Duell et al. (1997, 1998) constructed high-resolution physical maps based on QDFM for the immunoglobulin-β region on chromosome 22 and a large region including the 5′ end of the human apolipoprotein B gene on chromosome 2. Theuns et al. (1999) determined the genomic organization of the human presenilin 1 gene, which was localized on chromosome 14q24.3, by fiber-FISH. Although applying different techniques to prepare the DNA fibers, these recent applications of DNA fiber mapping were able to support ongoing mapping efforts by providing physical maps with near-kilobase resolution.
Direct Visualization of Gene Amplifications and Deletions
Linearly extended chromatin or DNA molecules are ideal substrates to study gene amplification or deletions. Parra and Windle (1993) applied the DIRVISH technique to resolve low level amplifications of the dihydrofolate reductase (DHFR) gene in a hamster cell line. All DNA fiber mapping procedures are single DNA molecule investigations, which permit study of cell-to-cell variations. Parra and Windle (1993) presented evidence that DIRVISH can resolve the diversity in structure and complexity found in the amplified DHFR array, which would normally escape detection and proper characterization.
Michalet et al. (1997) extended human genomic DNA on silanized glass surfaces using a receding meniscus and found that a precise measurement of hybridized DNA probes can be achieved without normalization. Stretching yeast genomic DNA amounts representing hundreds of eukaryotic genomes, the authors performed the high-resolution mapping of cosmid contigs on a yeast artificial chromosome (YAC). Furthermore, stretching of human genomic DNA allowed measurement of gaps between contigs and determination of microdeletions in the tuberous sclerosis 2 gene of patients' DNA.
Mapping of Expressed Sequences
Applications of DNA fiber mapping extend beyond map assembly and can provide valuable information for clone validation, definition of a minimal tiling path, and quality control in the sequence assembly process. Even more exciting, its high hybridization efficiency makes DNA fiber mapping the method of choice for visual mapping of expressed sequences.
Several approaches exist to map expressed sequences or to study the organization of larger genes. Gene fragments or entire cDNAs cloned in plasmid vectors can be amplified by in vitro DNA amplification using the polymerase chain reaction (PCR), labeled with reporter molecules, and used as hybridization probes (Wang et al. 1996). Figure 1 shows two examples of this application. A cloned cDNA fragment containing exon 2 of the human protein 4.1 gene (Peters et al. 1998) (Figure 1I) was positioned accurately on a closed circular, co-linear BAC DNA molecule. Counterstaining the BAC vector part with a combination of FITC- and digoxigenin-labeled probes that were detected in green and red, respectively, the position of gene 4.1 exon 2 within the BAC insert (the red signal on top of blue counterstain) can be determined with near-kilobase resolution.
The organization of genes in transcribed sequences interrupted by intronic sequences can be easily demonstrated by DNA fiber–FISH. We used QDFM in an attempt to resolve the structure of a gene from chromosome 20 frequently found amplified in human tumors (Tanner et al. 1994). As Figure 1L shows, a cDNA clone of about 5 kb maps to three distinct positions on a co-linear BAC clone. This result should be considered a rough estimate because exons smaller than 500 bp may not be detectable with this simple method (Weier et al. 1995). On the other hand, QDFM mapping turned out to be a highly reproducible method, so that was sufficient to analyze no more than five to eight BAC molecules (Weier 2001).
Technical developments in recent years have opened the doors to mapping of even smaller exons. In 1996, Florijn et al. demonstrated the use of DNA halo preps for mapping of exons ranging in size from 202 to 778 bp. Co-hybridization of co-linear cosmid clones enabled this group to reproducibly locate exon fragments of about 200 bp on extended genomic DNA in the context of the cognate cosmid signal. Detection efficiencies of 70–90% were found with probes larger than 400 bp, but the detection efficiency decreased to about 30% when fragments of about 200–250 bp were mapped.
More recently, Aaltonen and co-workers (1997; Horelli–Kuitunen et al. 1999) used a tyramide-based method (Raap et al. 1995) for detection of small hybridization targets. By applying this sensitive detection scheme to create a visual transcript map of six genes on chromosome 21q22.3, Horelli–Kuitunen et al. (1999) were able to detect targets ranging from 316 to 956 bp on 25–44% of the fibers. Independent experiments confirmed that an average of 89% of the EST hybridization signals were specific signals. These results suggested that a mere increase in detection sensitivity may not be sufficient to significantly increase the success rates of DNA fiber mapping experiments, i.e., the overall efficiency of hybridization and detection.
In the experiments conducted by Horelli–Kuitunen et al. (1999), the DNA fibers were prepared from agarose-embedded human genomic lymphocyte chromatin according to the protocol of Heiskanen et al. (1994, 1995), which may have limited the access of probes and detection reagents to the target DNA. As van der Rijke et al. (2000) proposed, the loss of target DNA and limited accessibility due to in situ renaturation and attachment might have a negative impact on the detection efficiency. In the author's opinion, DNA fiber-FISH sensitivity is determined by hybridization efficiency, rather than the ability to generate sufficient signal from small probes (van der Rijke et al. 2000).
High-resolution Studies of DNA Replication
Despite intense efforts, the orderly activation of replication sites in genomes of higher organisms remains largely unexplained. The main reason for this may be the complexity of a process orchestrating the partly parallel activation of an estimated 104 to 106 replication sites.
DNA fiber mapping, with its high resolution and sensitivity, might provide important mapping information about the location and spacing of replication sites. Several groups used fiber mapping techniques to demonstrate replication forks in yeast (Rosenberg et al. 1995), in Xenopus laevis (Herrick et al. 2000), and in humans (Gerdes et al. 1994; Haaf 1996). The approach chosen by Rosenberg et al. (1995) was based on the previously described DIRVISH and DNA halo techniques (Wiegant et al. 1992; Parra and Windle 1993). Hybridizing differentially labeled cosmid probes to yeast and YAC DNA fibers, the authors could provide convincing visual evidence of DNA replication “forks” and “eyes” in YACs containing human DNA (Rosenberg et al. 1995). A rather limited number of experiments enabled the authors to identify two origins of replication in a 400-kb region containing the human dystrophin gene, to present evidence for bi-directional replication and to demonstrate that human DNA cloned in yeast is capable of initiating its own replication.
Studies described by Gerdes et al. (1994), Haaf (1996), and Herrick et al. (2000) used incorporation of non-isotopically labeled nucleotides as markers for replicated DNA. The results of Gerdes et al. (1994) showed pulse-incorporated bromodeoxyuridine (BrdU) representing nascent replicating DNA localized with the base of the chromatin loops in halo preparations. At increasing chase times, the replicated DNA was consistently found farther out on the extended region of the halo (Gerdes et al. 1994). Haaf (1996) investigated the timing of replication of α-satellite DNA arrays by incorporation of BrdU into newly synthesized DNA, followed by hybridization of biotinylated chromosome-specific alphoid probes to DNA released from fibroblast or lymphoblast cell nuclei. Using the DNA halo preparations, he was able to demonstrate many independent replication sites within the large clusters of tandemly repeated alphoid DNA and partially hemizygous hybridization patterns in support of the hypothesis that replication of α-satellite DNA on homologous chromosomes is highly asynchronous.
The recent work of Herrick et al. (2000) extended previous applications of DNA fibers produced by the hydrodynamic action of a receding meniscus (Bensimon et al. 1994; Weier et al. 1995). Xenopus sperm nuclei were labeled by incorporation of biotin-dUTP in newly synthesized DNA followed by pulse-labeling with digoxigenin-dUTP at fixed time intervals. Because triphosphate deoxynucleosides do not efficiently traverse the intact cell membrane, all experiments had to be carried out with de-membranated sperm nuclei and activated egg extracts (Hyrien and Mechali 1992). Using red and green fluorescent antibodies directed against biotin and digoxigenin, respectively, the authors were able to discriminate early from late replicating sequences and to obtain estimates of the formation of new replication forks.
Conclusions
Recent research has lead to major improvements in hybridization-based physical mapping procedures. Developments in DNA fiber mapping have reached the point of immediate practical utility: DNA probes as small as 500 bp can be mapped routinely onto immobilized templates composed of linear or circular DNA molecules that range in size from less than 10 kb to more than one Mbp. Uniform stretching facilitates the conversion of measured physical distances into genomic distances. The highly reproducible stretching procedures require analysis of only a few DNA molecules for accurate determination of map positions by multicolor fluorescence microscopy and digital image analysis. A mapping accuracy in the kb range coupled to efficient signal amplification procedures to visualize signals from small targets allows rapid assembly of high-resolution physical maps for large-scale sequencing and map closure as well as high-resolution maps of expressed sequences.
DNA fiber mapping technologies will enhance performance of virtually all mapping and sequencing projects, including ongoing and future sequencing of model organisms and bacterial genomes. Implementation of these technologies will expedite sequencing by increasing parallelism, will lower the overall cost by reducing template redundancies, and will expedite map closure. Furthermore, the techniques will benefit the positional cloning of disease genes and characterization of genomic elements controlling their expression.
Footnotes
Acknowledgments
Supported by a grant from the Director, Office of Science, Office of Biological and Environmental Research, US Department of Energy, under Contract DE-AC03–76SF00098, by the “Training Program in Genome Research” sponsored by the University of California System-wide Biotechnology Research and Education Program (#S96–03), and by a grant from the Breast Cancer Research Program, US Army Medical Research and Materiel Command, United States, Department of the Army (BC98–0937).