
Abstract
We developed an ELISA-based method for rapid optimization of various tissue processing parameters in immunogold labeling for electron microscopy. The effects of aldehyde fixation, tannic acid, postfixation, dehydration, temperature, and antigen retrieval on antibody binding activity of Vitreoscilla hemoglobin (VHb) expressed in E. coli cells were assayed by ELISA and the results confirmed by quantitative immunogold labeling transmission electron microscopy (TEM). Our results demonstrated that low concentrations (0.2%) of glutaraldehyde fixation caused minimal loss in total binding compared to higher concentrations. Dehydration in up to 70% ethanol resulted in some distortion of cellular ultrastructure but better antibody binding activity compared to dehydration up to 100%. Postfixation or incorporation of tannic acid in the primary fixative caused almost total loss of activity, whereas antigen retrieval of osmium-postfixed material resulted in approximately 90–100% recovery. The sensitivity of detection of proteins by immunogold labeling electron microscopy depends on the retention of antibody binding activity during tissue processing steps, e.g., fixation and dehydration. Our study indicated that an ELISA-based screening method of various tissue processing procedures could help in rapid selection and optimization of a suitable protocol for immunogold localization and quantification of antigen by TEM.
Keywords
C
Materials and Methods
VHb Antigen and Anti-VHb Antibody
E. coli DH5α cells harboring the plasmid PUC8:15 expressing VHb protein (Dikshit and Webster 1988) were used as a source of antigen. Cells from stationary phase were harvested, washed with Dulbecco's PBS, and either processed for electron microscopy or sonicated in PBS to prepare the lysate for ELISA. The cell lysate was centrifuged at 12,000 × g and the clear supernatant was used for ELISA. A polyclonal antiserum against VHb protein (anti-VHb) was raised in rabbit as described previously (Joshi et al. 1998). Before use, the serum was pre-adsorbed with the antigen -ve cell extract (lysate of cells not expressing VHb, i.e., containing only the vector and lacking the gene coding for VHb) of E. coli. The pre-adsorption step was performed to remove antibody molecules in serum that crossreact nonspecifically with other cell proteins.
ELISA of VHb Antigen
Fifty μl of lysate containing 2.5 μg of protein (Bradford 1976) was coated on the first seven wells of 8-well E.I.A. strip plates (Costar; Cambridge, MA) overnight at 4C. Antigen containing lysate adsorbed onto the plastic well represented an artificial immunospecimen. To the last well of each strip was added 50 μl PBS, which served as a control for each set. The wells were then washed three times with PBS containing 0.05% Tween-20 (polyoxyethylenesorbitan monolaurate; Sigma Chemicals, St Louis, MO) (PBST) and exposed to various treatments before being processed for antigen activity. Each well was treated with 50 μl of 50 mM glycine in PBS for 1 hr. This was followed by blocking with 3% skim milk, 0.01% Tween-20 made up in PBS for 2 hr at room temperature (RT). Wells were incubated overnight at 4C with rabbit anti-VHb diluted 1:1000 in PBS containing 0.3% skim milk, 0.001% Tween-20. In a parallel set of experiments, instead of rabbit anti-VHb, normal rabbit serum (NRS), diluted to the same protein concentration as the test antibody, was added to the wells. After three washes with PBST, 50 μl of goat anti-rabbit IgG HRP conjugate (Sigma) diluted 1:40,000 in PBS containing 0.3% skim milk, 0.01% Tween-20 was added as second antibody to each well and allowed to bind for 1 hr at RT. The reaction product was developed with 3,3′ 5,5′-Tetramethylbenzidine Liquid Substrate System for ELISA (Sigma), for 30 min and terminated by addition of 50 μl of 0.1 M H2SO4 to each well. The resultant yellow color, which was in linear range, was read at 450 nm in an ELISA reader (Bos et al. 1981). The absorbance of a set of eight wells that had not undergone any tissue processing treatment except for similar washing and handling during the course of the assay was taken to represent 100% antigen binding activity. The results of all treatment sets was expressed as a percentage of this value and represented the residual antibody binding activity (RA). Residual antibody binding activity in test samples was computed after subtracting the absorbance of the control well for each set.
Fixation Treatment
Fifty μl of different fixatives, constituted in either PBS or 0.1 M sodium cacodylate buffer (CB), was added to each well and allowed to act for 30 min at 4C. The different fixatives evaluated were as follows: (a) 0.2% glutaraldehyde (EM Sciences; Ft Washington, PA) +4% paraformaldehyde (Polysciences; Warrington, PA); (b) 0.5% glutaraldehyde + 4% paraformaldehyde; (c) 1% glutaraldehyde + 4% paraformaldehyde; (d) 2.5% glutaraldehyde + 2.5% paraformaldehyde; (e) 0.2% glutaraldehyde + 4% paraformaldehyde supplemented with 0.1, 0.2, 0.5, 1, or 2% tannic acid (s.d. Fine-Chem Ltd; Boisar, India); (f) 0.2% glutaraldehyde + 4% paraformaldehyde followed by 1% OsO4 (EM Sciences). Wells to which OSO4 was added were sealed with parafilm.
Treatment with Alcohol
Coated antigen in each well was exposed to either 30%, 70%, or 100% ethanol for 30 min at 4C before being assayed for binding to antibody.
Heat Treatment
A set of eight wells was exposed to 37C or 60C for 24 hr before being processed for ELISA.
Simulation of Cell Processing with an Artificial Immunospecimen
Antigen in wells was exposed to a combination of sequential treatments. Adsorbed protein was fixed with various concentrations of glutaraldehyde (0.2%, 1%, or 2.5%) along with 4% paraformaldehyde (2.5% in the case of 2.5% glutaraldehyde) made up separately in PBS as well as CB. Then the adsorbed protein was dehydrated up to 70% or 100% alcohol. Separate sets of similarly processed antigen-coated wells were exposed to 60C for 24 hr in a polymerization oven. Dehydration in all cases was carried out by sequentially adding 30%, 50%, 70%, 90%, and 100% ethanol (50 μl/well). After each step the alcohol was flicked off and the next grade of alcohol added (30 min each step and performed at 4C). Separate sets of wells were also processed, in which a 1-hr step of postfixation with 1% OsO4 was included. Finally, a set of aldehyde-fixed, osmium postfixed samples was subjected to antigen retrieval before being assayed by ELISA.
Antigen Retrieval Treatment
Adsorbed antigen that had been fixed with aldehydes and subsequently postfixed with OsO4 was subjected to antigen retrieval by sodium metaperiodate, followed by heating in citrate buffer (Stirling and Graffe 1995). To each well was added 50 μl of saturated aqueous sodium metaperiodate and after 1 hr the wells were boiled while completely immersed in 500 ml of 0.01 M citrate buffer (adjusted to pH 6.0 with HCl) for 15 min. During boiling, care was taken to see that no air bubbles remain trapped in the wells.
Processing of Cells for TEM
Cells were fixed and processed for embedding in LR White resin as follows:
Fixation with 0.2% glutaraldehyde + 4% paraformaldehyde in PBS followed by dehydration up to (a) 70% ethanol (PBS70) and (b) 100% ethanol (PBS100).
Fixation with 1% glutaraldehyde + 4% paraformaldehyde in CB followed by dehydration up to (a) 70% ethanol (CB70) and (b) 100% ethanol (CB100)
Fixation with 0.2% glutaraldehyde + 4% paraformaldehyde in PBS, post fixation with 1% OsO4 for 1 hr, and dehydration up to 100% ethanol (PBS OsO4).
Fixation with 1% glutaraldehyde + 4% paraformaldehyde in CB, post fixation with 1% OsO4 for 1 hr, followed by dehydration up to 100% ethanol (CBOsO4).
After infiltration with three changes of resin, polymerization was carried out at 60C for 24 hr. Ultrathin sections were cut, flattened with xylene vapor, collected on nickel grids, processed for immunogold labeling, stained with 2% aqueous uranyl acetate, and observed in a JEOL 1200 EX II transmission electron microscope.
Antigen Retrieval (Unmasking) Procedure
Sections of samples PBS OsO4 and CBOsO4 were subjected to antigen unmasking. Sections on grids were incubated in a humid chamber on large drops of fresh saturated sodium metaperiodate for 1 hr at RT. Grids were then floated, sections down, in a beaker containing 0.01 M sodium citrate buffer maintained at 95–100C for 15 min.
Immunogold Labeling Method
Sections on grids were first blocked for 30 min, by floating on drops of PBS containing 3% skim milk, 0.01% Tween-20, followed by washing on drops of PBST (five changes, 5 min each). Sections were then incubated overnight (16–18 hr) at 4C with rabbit anti-VHb antibody diluted 1:500 in PBS containing 0.3% skim milk and 0.001% Tween-20. Then the grids were washed by floating on drops of PBST. Bound antibodies were visualized by incubating the sections for 1 hr on goat anti-rabbit gold conjugate (10 nm; Sigma) diluted 1:20 in PBS containing 0.3% skim milk and 0.001% Tween-20. Finally, grids were washed on drops of water (five changes, 5 min each) before being stained with 2% aqueous uranyl acetate. All incubations, except for the primary antibody step, were carried out at RT.
Controls
The specificity of the primary antibody reaction was tested by substituting the rabbit anti-VHb antiserum with NRS. The specificity of the primary antibody reaction within tests was also judged by comparing the probe density on the cells with that on the adjacent plastic resin.
Quantitation of Probe Density
The resultant probe density using test and control serum was quantified as follows.
Photography. For each test and normal rabbit immunoglobulin control, the probe density was calculated from random micrographs of cell sections.
Probe Counting. Prints of negatives were made and overlaid with transparencies. Cell outlines were traced, cut out, and weighed (Pearse 1972; James 1996). The gold particles in each cell and the surrounding clear plastic were counted manually by point counting. The area of each cell was computed by comparison with the weight of an area corresponding to 100 μm2 cut out from the same transparency sheet. To calculate the probe density, 41 (minimum) to 109 (maximum) individual cells were counted for each test and control sample. Total clear plastic area was computed (usually larger than the total area occupied by cells) and the number of gold particles bound therein were also counted.
Analysis
The total probe density on cells and clear plastic was calculated for the test and control of each sample processed. Densities were expressed as the number of gold particles/μm2. Comparisons between test and control samples was done by two-tailed t test.
Results
Determination of Residual Antigen Binding Activity by ELISA
The effect of various tissue processing steps, independently as well as in combination, for antigen detection by immunogold labeling TEM was studied by an ELISA-based method. Direct protein determination in ELISA wells (Sorensen and Brodbeck 1986) showed that various tissue processing steps caused negligible loss of adsorbed protein (data not shown). The analysis of RA of cell lysate antigen, in response to various processing treatments, is presented in Tables 1 and 2.
Single Treatments. Fixation with 0.2% glutaraldehyde and 4% paraformaldehyde did not result in any loss in the antibody binding activity of the antigen. When the glutaraldehyde concentration was increased to 0.5% and 1% in this mixture, the RA declined to ~85% and ~60%, respectively. A further increase in the glutaraldehyde concentration to 2.5%, along with 2.5% paraformaldehyde, did not result in any additional alterations in the RA.
Effect of processing (single treatment) on antibody binding activity of antigen by ELISA a
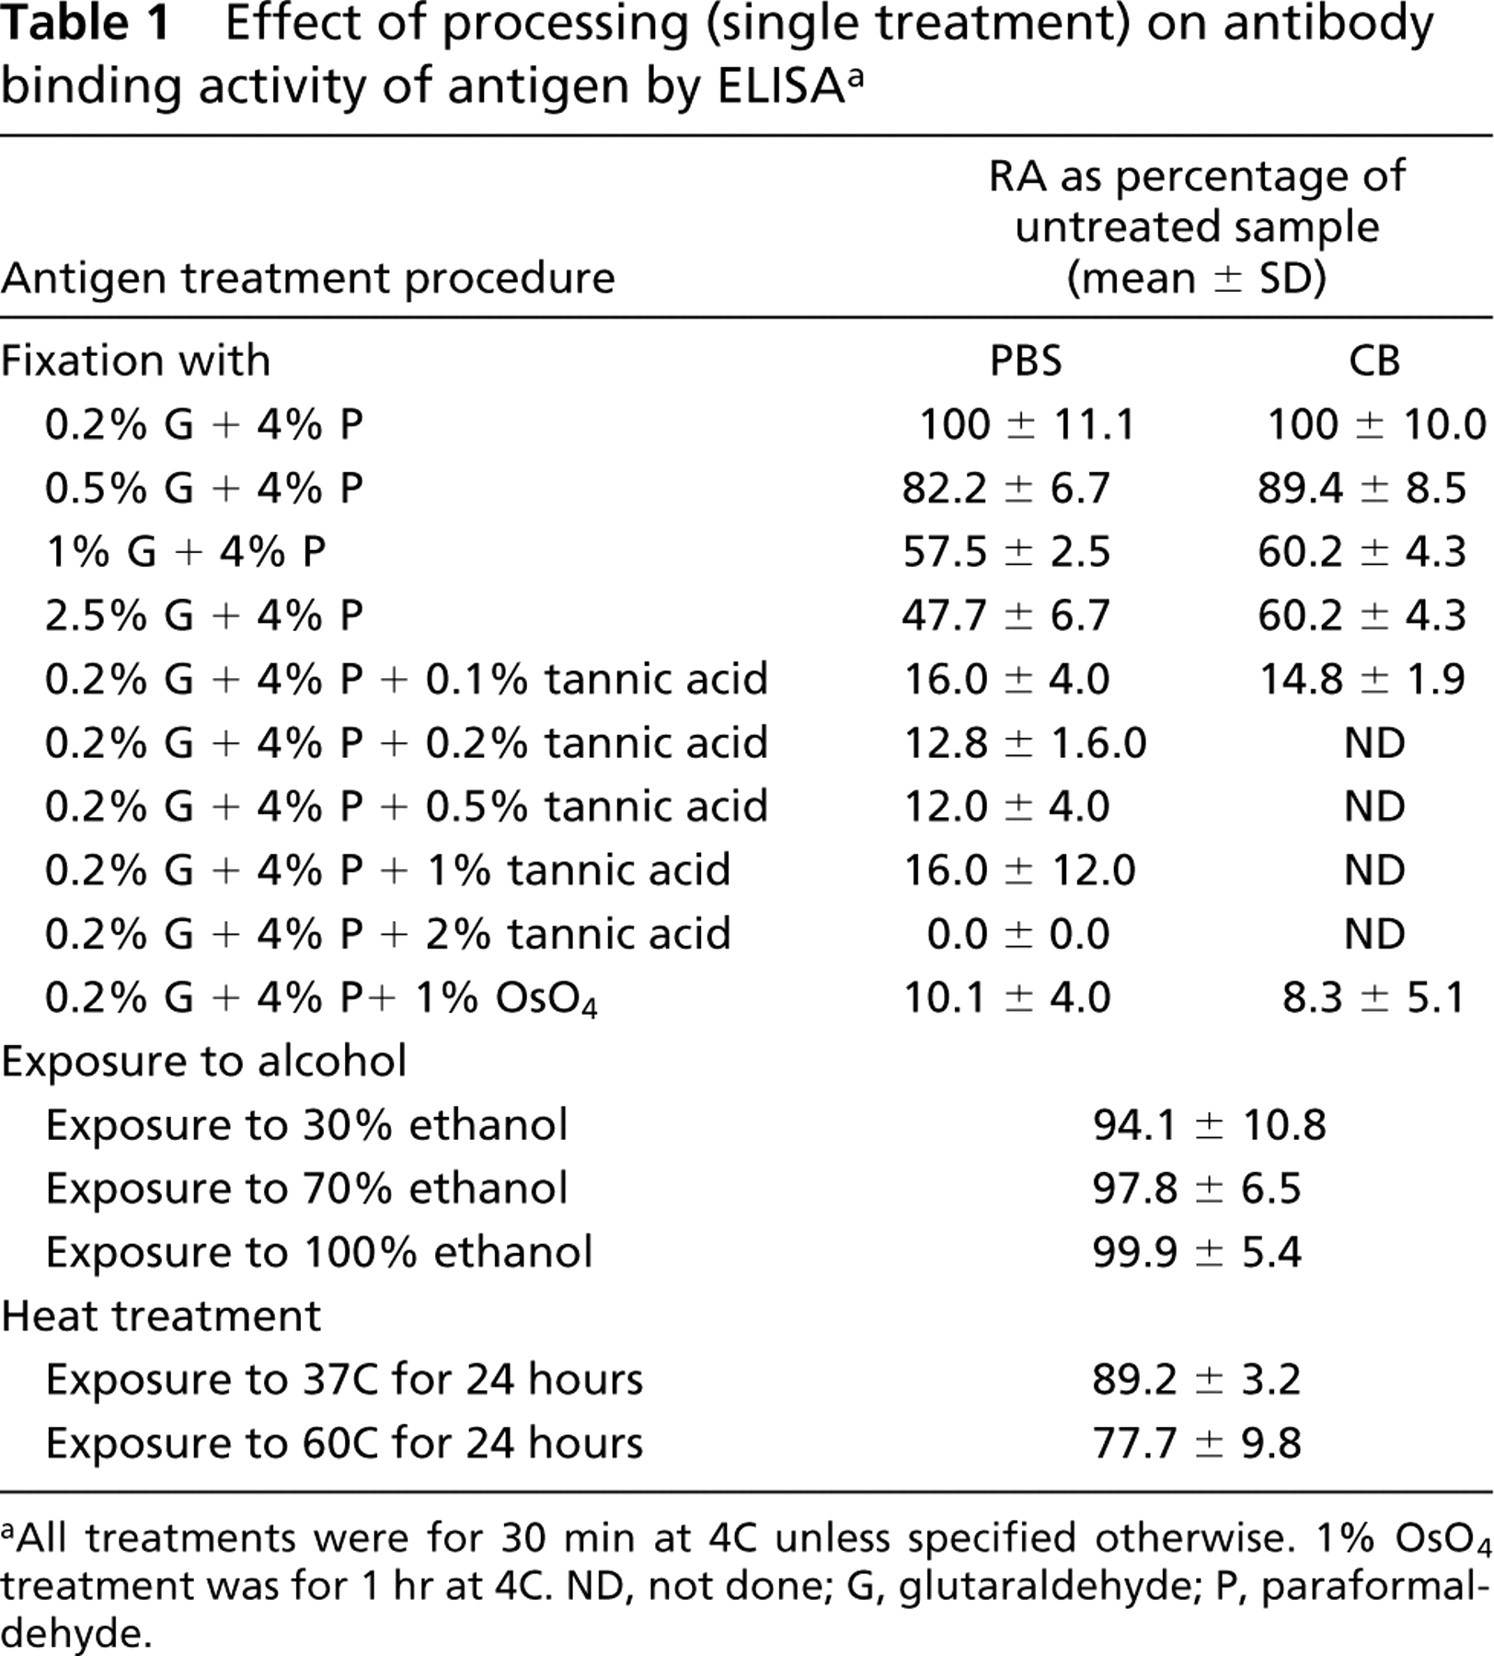
aAll treatments were for 30 min at 4C unless specified otherwise. 1% OsO4 treatment was for 1 hr at 4C. ND, not done; G, glutaraldehyde; P, paraformaldehyde.
When 0.1% tannic acid was included in the primary fixative, the activity dropped to 16% and was undetectable beyond 1% tannic acid. Postfixation with OsO4 after fixation in 0.2% glutaraldehyde and 4% paraformaldehyde resulted in a substantial decrease in RA to approximately 10%.
There was no observable effect of only 30%, 70% and 100% ethanol on antibody binding (Table 1). A drop in the binding activity of samples exposed for 24 hr to 37C (~90% RA) and 60C (~75% RA) was noted.
Combination Treatments. Fixation with 0.2% glutaraldehyde and 4% paraformaldehyde followed by dehydration up to 70% (with or without exposure to 60C) retained the RA at 100%. On the other hand, dehydration up to 100% (with and without heat treatment) in the same fixative resulted in a decline of RA to ~85%. A major loss in activity (~10% RA) was observed when the sample was postfixed with osmium. When samples were subjected to antigen retrieval after postfixation, 100% RA was regained.
Fixation in 1% glutaraldehyde and 4% paraformaldehyde and dehydration up to 70% (with or without exposure to 60C) showed the same activity as in the case of single treatment with the same concentration of fixative. Further dehydration up to 100% with heat treatment resulted in a marginal decline of activity when CB was used as vehicle buffer. When the osmium step was included, the RA declined to ~5%. Here, recovery in RA was only up to 90% when the sample was subjected to retrieval procedure.
Fixation in 2.5% glutaraldehyde and 2.5% paraformaldehyde and dehydration up to 70% and 100%, with and without exposure to 60C, resulted in similar binding activities (~49%).
Nonspecific binding to wells without antigen was negligible in all cases except where post fixation treatment was given. In a set of parallel experiments using control sera, no significant signal was observed in any single or combination of treatments used (data not shown).
Probe Density
The number of gold particles/μm2 of total cell or plastic area are shown in Table 3. The representative areas are shown in Figures 1–4. On cell sections labeled with anti-VHb antibody, the probe density was always greater than the level of nonspecific binding in adjacent plastic (Figures 1A, 1C, 2A, 2C, 3A, 3C, 4A, and 4C). It was also significantly higher (p < 0.001) than the probe density on cell sections similarly treated with normal rabbit serum. (Figures 1B, 1D, 2B, 2D, 3B, 3D, 4B, and 4D).
Effect of Combination Treatments to Simulate Tissue Processing by ELISA a
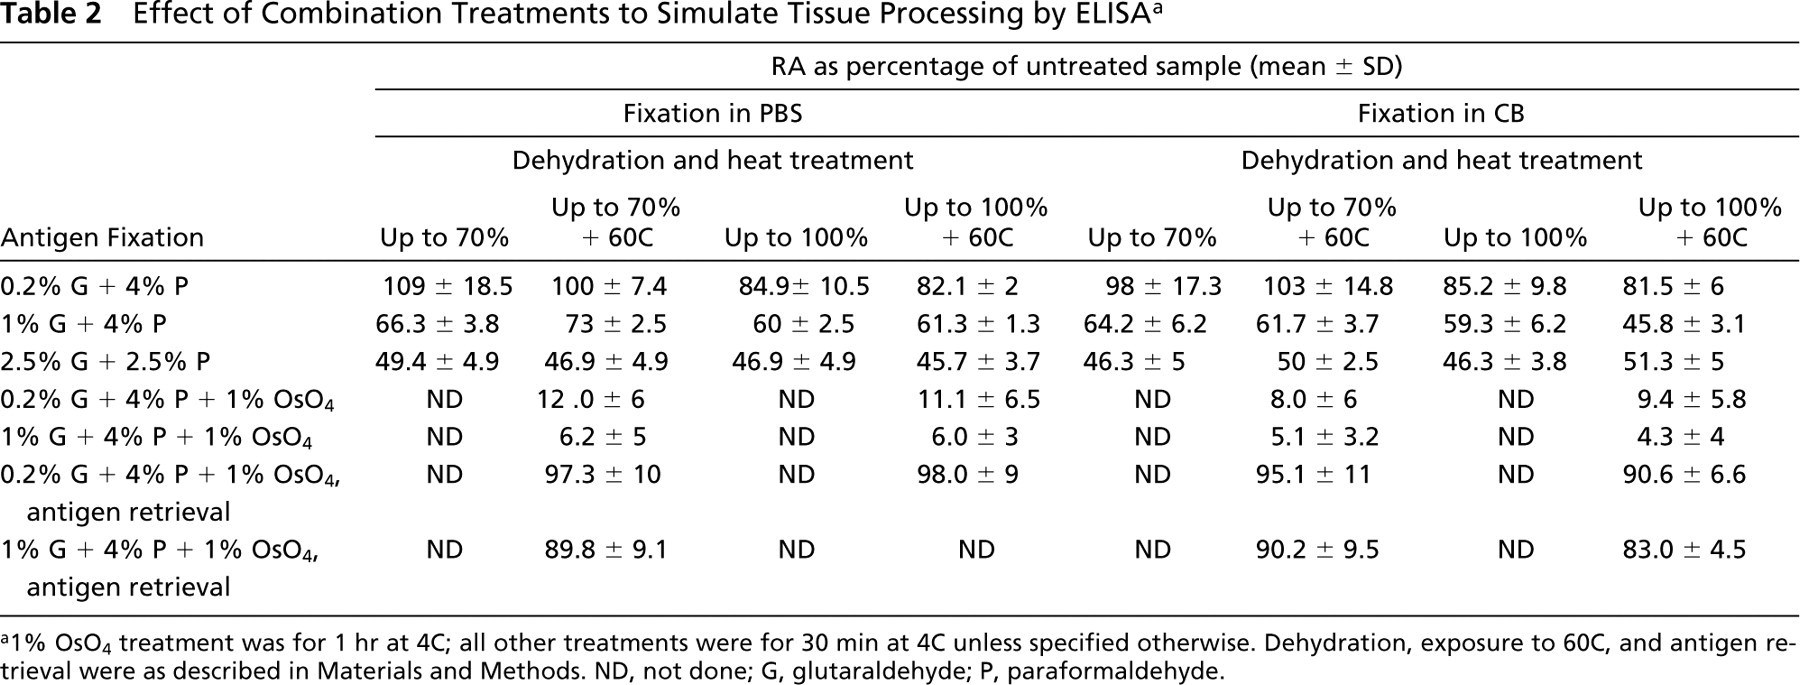
a1% OsO4 treatment was for 1 hr at 4C; all other treatments were for 30 min at 4C unless specified otherwise. Dehydration, exposure to 60C, and antigen retrieval were as described in Materials and Methods. ND, not done; G, glutaraldehyde; P, paraformaldehyde.
Number of gold particles/μm2 on tests and controls using various processing methods a
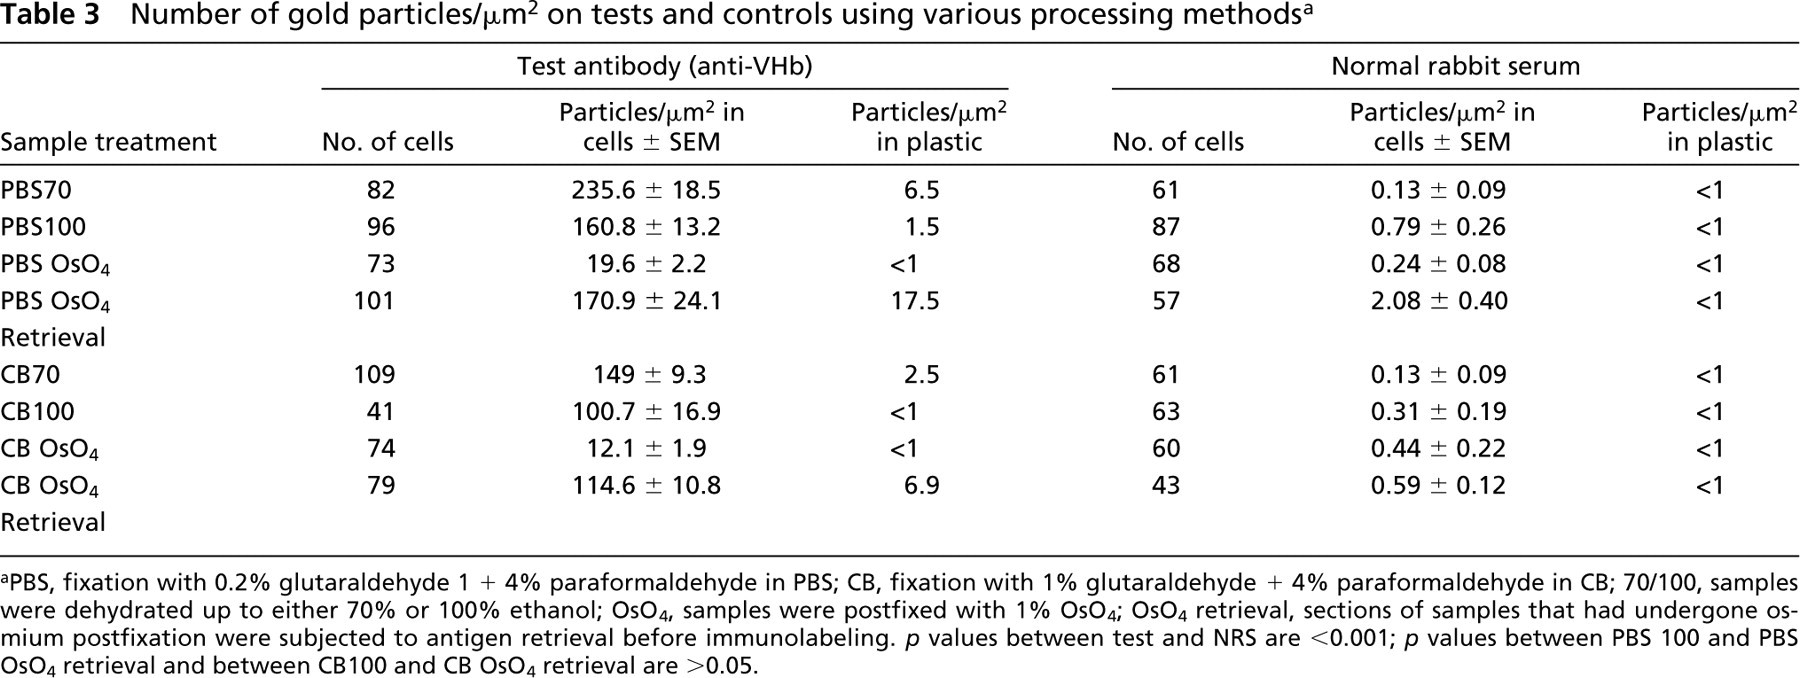
aPBS, fixation with 0.2% glutaraldehyde 1 + 4% paraformaldehyde in PBS; CB, fixation with 1% glutaraldehyde + 4% paraformaldehyde in CB; 70/100, samples were dehydrated up to either 70% or 100% ethanol; OsO4, samples were postfixed with 1% OsO4; OsO4 retrieval, sections of samples that had undergone osmium postfixation were subjected to antigen retrieval before immunolabeling. p values between test and NRS are <0.001; p values between PBS 100 and PBS OsO4 retrieval and between CB100 and CB OsO4 retrieval are >0.05.
Calculation of probe density suggested that immunogold labeling patterns were in agreement with ELISA results regarding retention of antibody binding activity. As observed in ELISA, cells fixed with 1% glutaraldehyde coupled with OSO4 postfixation and dehydration up to 100% ethanol (CBOsO4) demonstrated the lowest probe density of 12.01 particles/μm2. Probe levels marginally improved to 19.63 particles/μm2 when the primary fixative was replaced with 0.2% glutaraldehyde (PBS OsO4). In cells in which osmium post fixation had been omitted, the probe densities were consistently much higher. As observed in ELISA, lower glutaraldehyde concentrations resulted in higher labeling. Accordingly, the highest probe densities were found in samples that had been fixed with 0.2% glutaraldehyde + 4% paraformaldehyde and in which exposure to ethanol had been limited up to 70% alcohol (PBS70). In this case the probe density was 235.6 particles/μm2. On extending the dehydration up to 100% alcohol (PBS100), the mean probe density dropped significantly (p < 0.001) to 160.8 particles/μm2 (~30% reduction compared to PBS70). Treatment with 1% glutaraldehyde + 4% paraformaldehyde followed by dehydration up to 70% and 100% alcohol (CB70 and CB100) yielded relatively lower (p < 0.001) probe densities of 149.5 and 100.7 particles/μm2, respectively.
Antigen retrieval in osmium-treated samples resulted in a marked regain of probe density to the same levels as obtained with comparable aldehyde fixation and dehydration. In 0.2% glutaraldehyde-fixed cells (PBSOsO4 retrieval), the probe density reverted to 170.9 particles/μm2, and in 1% glutaraldehyde fixation (CBOsO4 retrieval) it increased to 114.6 particles/μm2. In addition, in sections of cells that had been subjected to antigen retrieval, the nonspecific labeling due to NRS increased marginally from 0.24 to 2.08 particles/μm2 for PBS OsO4 retrieval and from 0.44 to 0.59 particles/μm2 for CBOsO4 retrieval. This increase was not significant (p > 0.05). In the same sections, the background labeling on plastic also increased slightly. At the dilution used, the gold conjugate by itself did not result in any detectable background labeling on either cells or clear plastic (data not shown).
Cell Structure
Cells fixed with 0.2% or 1% glutaraldehyde in PBS or CB, respectively followed by OSO4 fixation and dehydration up to 100% ethanol, retained clear, well-defined cell structure, with no observable membrane damage. The cytoplasm revealed well-preserved granular and fibrillar structures (Figures 1A–1D). When OsO4 postfixation was omitted, the cells showed similar preservation of cytoplasmic structure. However, the membranes were observed to have more folds. Periplasmic spaces also appeared to be more dilated (Figures 2B and 2D). When similarly fixed cells were dehydrated only up to 70% ethanol, significant distortion of morphology was noted. Although the membranes appeared distinct, they were present in a highly wavy form; periplasmic spaces were also seen to be affected. Cytoplasmic fibrillary structures were not so well preserved (Figures 3A–3D). Sections that had undergone the retrieval process showed a marginal increase in staining density, with occasional signs of section damage. A slight increase in contamination with particulate debris was also observed in these samples (Figures 4A–4D).
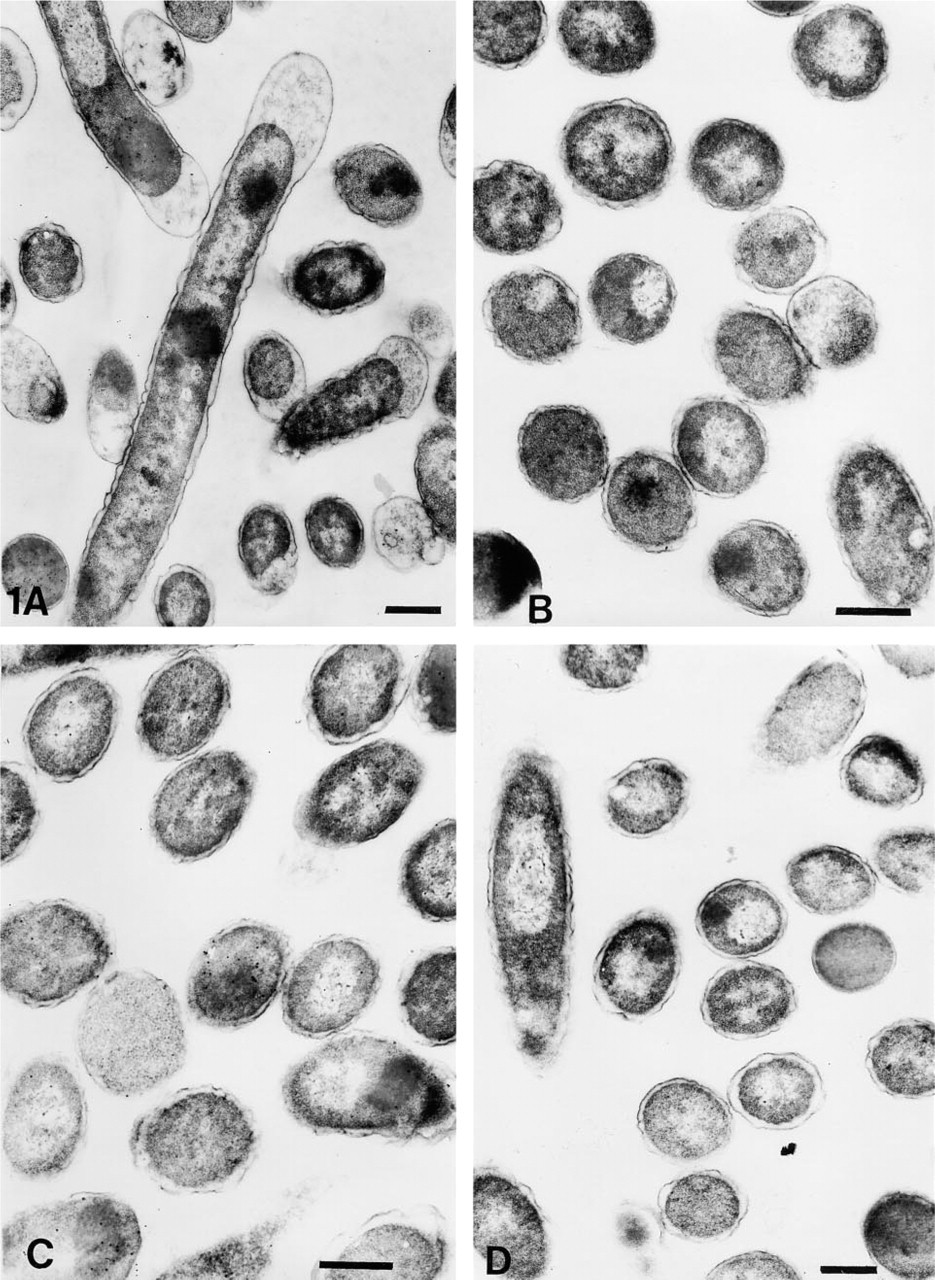
Electron micrographs of OsO4 postfixed immunogold-labeled E. coli cells dehydrated up to 100% ethanol. (
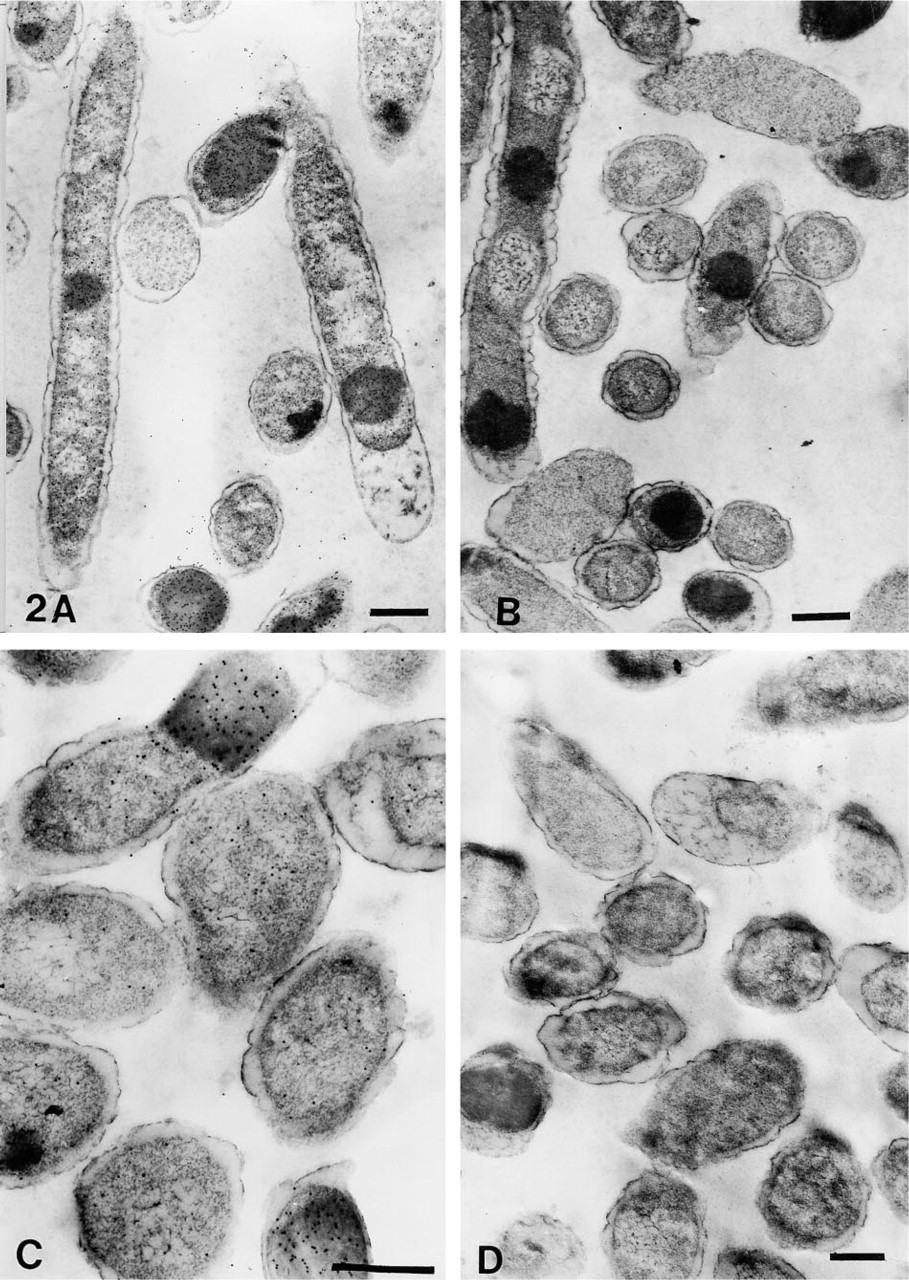
Electron micrographs of immunogold-labeled E. coli cells dehydrated up to 100% ethanol. (
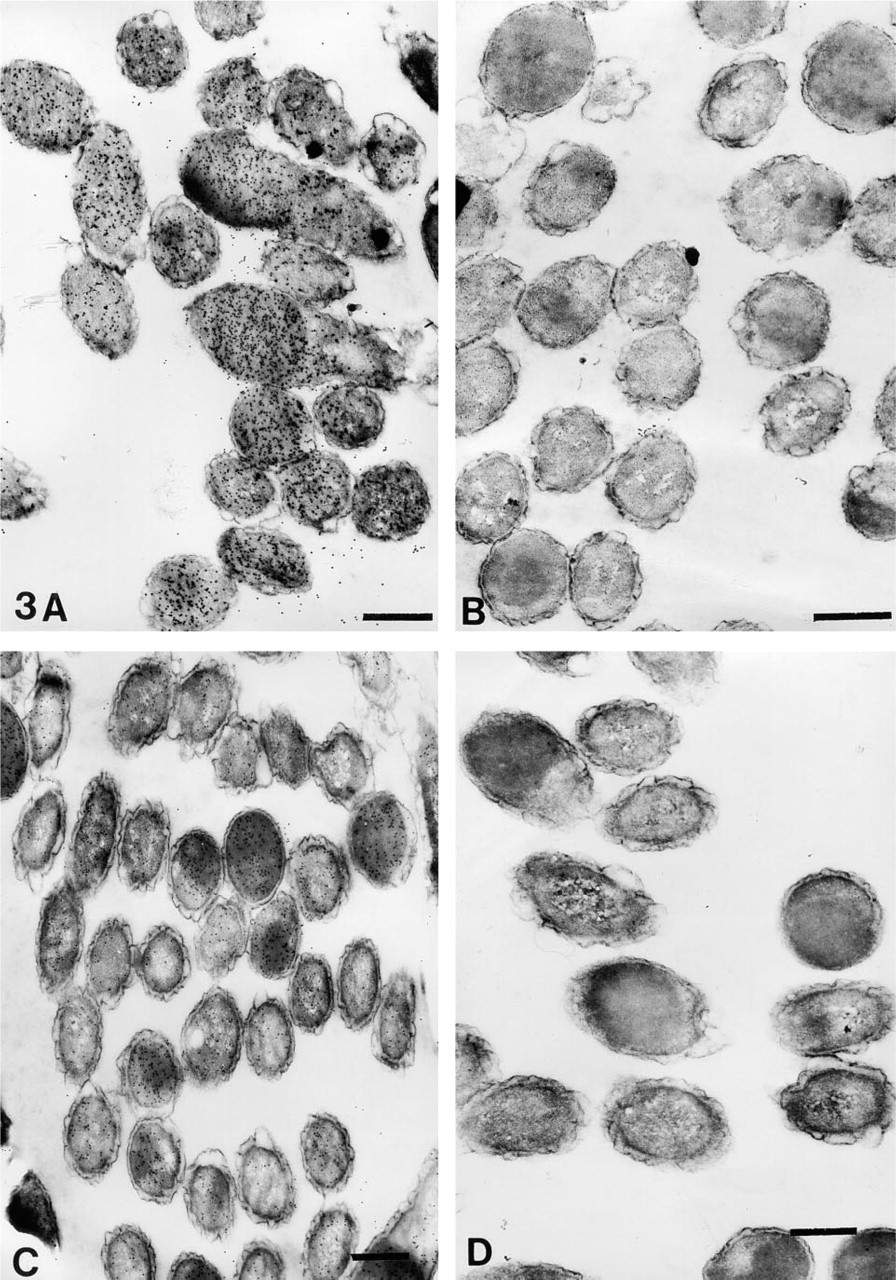
Electron micrographs of immunogold-labeled E. coli cells dehydrated up to 70% ethanol. (
Discussion
In this study we have demonstrated the use of ELISA as a convenient method for rapid optimization of antigen detection and quantitation in immunogold labeling electron microscopy. The effects of fixation, by various agents, dehydration, etc. have been extensively studied for their roles in preserving cell structure, as well as their limitation in quantitation of antigen by immunocytochemistry (Brandtzaeg 1982; Roth 1982; Waele et al. 1983; Clements and Beitz 1985; Leenen et al. 1985).
We have tested low (0.2%) to high (2.5%) glutaraldehyde concentrations in two commonly used vehicle buffers (PBS and cacodylate) for preliminary screening of residual antigen–antibody binding activity by ELISA. It is common practice to use paraformaldehyde along with glutaraldehyde for immunolabeling studies. Therefore, this was also included at 4% concentration in all fixatives, except when the glutaraldehyde concentration was 2.5%. In this case, the concentration of paraformaldehyde was restricted to 2.5% to maintain the total osmotic pressure (~1500 mOs). On the basis of the results obtained in ELISA, two concentrations (0.2 and 1%) of glutaraldehyde were selected for final confirmation by immunogold TEM. ELISA results indicated that fixation in a low (0.2%) glutaraldehyde concentration and dehydration up to 70% alcohol, along with exposure to 60C for 24 hr, had practically no effect on the antigen. Presumably, the low levels of fixative stabilize the antigen and prevent its destruction by exposure to 60C. Electron microscopy of the samples processed similarly demonstrated the highest probe density, in agreement with the simulation experiments in ELISA using an artificial immunospecimen. However, TEM revealed distortion of cell morphology in these samples.
The results of ELISA revealed that there was enhanced antigen destruction on combining low glutaraldehyde fixation with exposure to 100% ethanol. However, further heat treatment did not cause any additional loss. On increasing the glutaraldehyde concentration to 1% and 2.5%, antibody binding decreased further. Limiting the dehydration up to 70% ethanol resulted in better retention of antigen than dehydration at a higher gradient. However, when ELISA was carried out with an artificial immunospecimen exposed only to 100% alcohol, the result was no different from exposure to only 70% alcohol (single treatments). This suggests that the additional deleterious effect of 100% alcohol is seen only when combined with prior fixation with 1% (or more) glutaraldehyde. Similarly, as in the case of the ELISA results, quantitative immunogold labeling EM demonstrated that a higher sensitivity of antigen detection was maintained in cells fixed with low glutaraldehyde concentrations. This was also affected by the concentration of alcohol used in dehydration. By increasing the dehydration up to 100% ethanol, it was possible to maintain a high signal and also preserve the cell morphology at a satisfactory level.
Our observations showed that exposure to 100% ethanol resulted in reduction of RA only when this was preceded by a suboptimal fixation with a low concentration (0.2%) of glutaraldehyde. Presumably, the resultant residual aldehyde groups on proteins would fix any non-crosslinked antigen as it undergoes change in conformation upon exposure to a higher gradient of ethanol. In proteins, alcohol-induced conformational changes are known to occur (Herkovits and Jaillet 1969; Hirota et al. 1998; Dwyer 1999). The reason why a similar additive effect of 100% alcohol was not observed with 1% and 2.5% glutaraldehyde fixation might be that, at these higher concentrations the fixation is to a greater extent with extensive crosslinking between proteins in the immunospecimen which are now no longer susceptible to alcohol-induced conformational changes.
When antigen in wells was subjected to only 60C, a 20–25% loss of antigen activity was observed, but when similar treatment was given after fixation with 1% glutaraldehyde and dehydration, no additional loss was noted. This may be because the fraction of antigen lost only because of temperature overlaps with the fraction sensitive to 1% or more glutaraldehyde.
Most samples processed for immunolabeling electron microscopy compromise on fixation. The resulting ultrastructure is generally poor compared to tissues processed with conventional methods. This may cause problems in accurate quantitation of label in different cell compartments, in which adequate preservation of cell ultrastructure is important. In this study we have included tannic acid and osmium tetroxide to determine if their effects on immunogold labeling can also be evaluated by ELISA. Because, only a few antigens have been shown to resist exposure to osmium treatment (Nakane 1971; Erlandsen et al. 1979), its use for immunolabeling electron microscopy is severely restricted. However, this limitation can be partially overcome by retrieval techniques (Bendayan and Zollinger 1983). It should be noted that the results of antigen unmasking may not be uniform for all antigens and all samples (Brandtzaeg 1982). In the present study, the ELISA results demonstrated that tannic acid, when used along with aldehyde fixatives, caused a severe drop in antigen-antibody interaction. At 0.1% tannic acid concentration, the RA declined to 16% and at 2% tannic acid the RA was reduced to undetectable levels. Substantial losses in antigen, as quantitated by immunogold TEM using comparable concentrations of tannic acid, have been reported. However, the extent of loss was variable, depending on the type of antigen studied (Berryman et al. 1992).
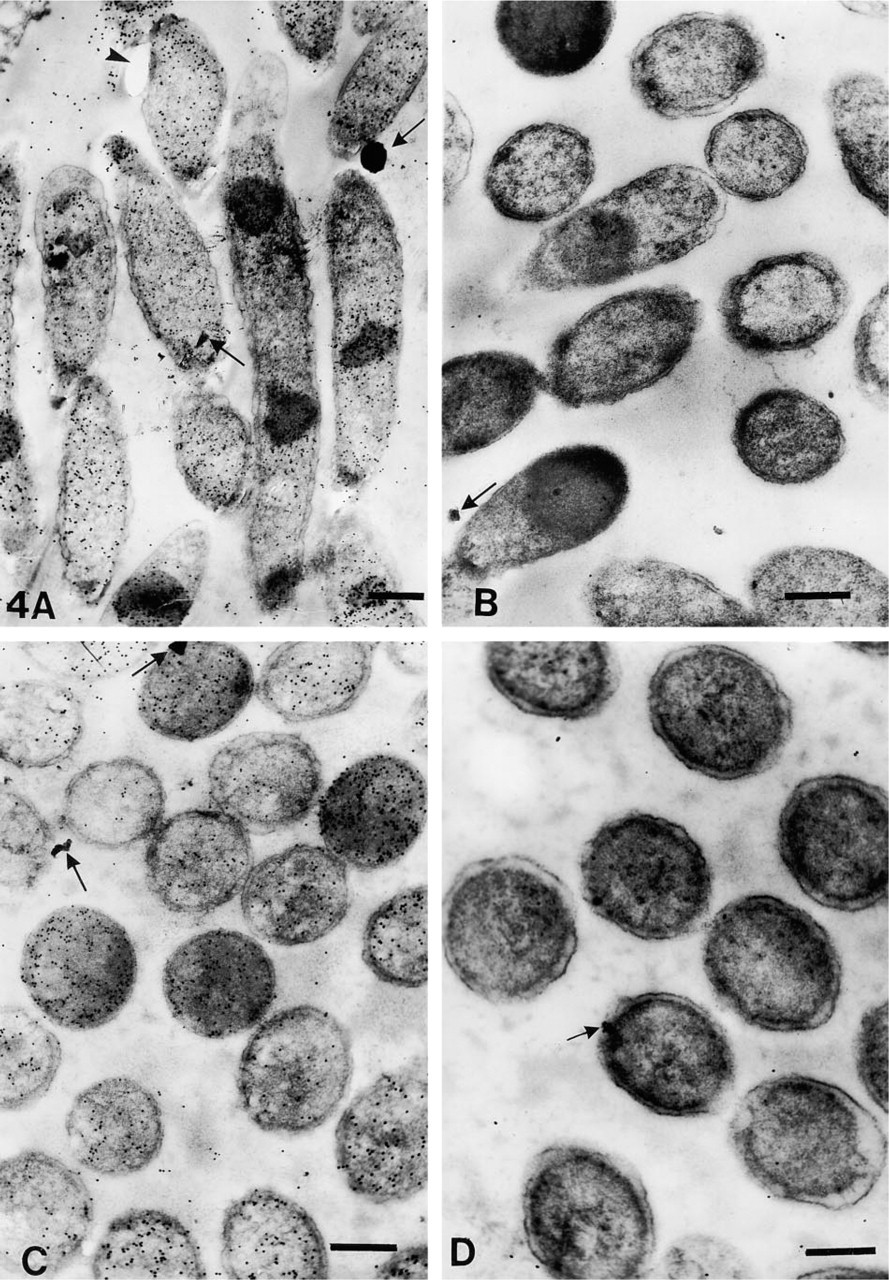
Electron micrographs of OsO4-postfixed immunogold-labeled E. coli cells; sections subjected to antigen retrieval. (
The use of 1% OsO4 for postfixation in ELISA caused an approximately 90–95% loss in antibody binding. The effect was compounded by use of a higher glutaraldehyde concentration. Unmasking of the fixed antigen resulted in 90–100% recovery of activity (when 0.2% glutaraldehyde was used) and 85–90% (when 1% glutaraldehyde was used). Electron microscopy showed that the best preservation of structure was obtained when cells were postfixed with osmium, but this resulted in very low levels of labeling. In these cases, subjecting the sections to retrieval resulted in elevation of the total labeling densities on cells to the same level as that of cells fixed with the same concentration of aldehydes and subjected to dehydration up to 100% in alcohol (p > 0.05), thus demonstrating a total recovery of antigen lost during osmium postfixation, similar to our ELISA findings. This was accompanied by an increase in background labeling on the plastic which, however, did not pose a problem for quantification of the cellular antigen because the ratio of number of particles/μm2 on cells and the number of particles/μm2 on plastic was >10. Nonspecific labeling by NRS on cells increased very slightly and was also significantly lower than test samples (p < 0.001).
Although the techniques of fixation, the nature of the fixative solutions, and the embedding procedure can interfere with the cytochemical demonstration of tissue components, not all components are altered, and the effect varies according to the nature of the target binding site. In general, the use of low concentrations of fixatives has resulted in good cytochemical labeling (Bendayan et al. 1987; Gagne and Miller 1987).
Our results have shown that the trend of residual antibody binding activity of antigen, adsorbed in ELISA wells (artificial immunospecimen), after a simulated processing for electron microscopy, is similar to that obtained by immunogold labeling electron microscopy. Therefore, it can provide information regarding antigen loss through simulation of various EM tissue processing steps. This method offers significant advantages over the existing method using nitrocellulose membranes. Apart from the fact that ELISA-based methods are inherently more sensitive for quantitation (instead of merely detection) of antigen, it also offers the following benefits: (a) It is possible to study the effect of organic solvents such as alcohol. (b) The effect of osmium postfixation and retrieval techniques can be easily assayed in a quantitative manner. (c) Our method utilizes antigens in their native conformation as opposed to antigens that have been denatured by boiling with sodium dodecyl sulfate before electrophoretic transfer to the membrane (Paiement and Roy 1988). (d) Many combination treatments can be simultaneously tested (11 combinations using one 96-well plate). (e) Multiple sets of the same sample (in this case seven at a time using 8-well strips) can be handled conveniently and quantitated spectrophotometrically, as opposed to Western blotting in which densitometry must be carried out for quantitation. (f) Finally, the volume of reagents required is very limited.
Our assay system utilizes a cell lysate that can be prepared more easily instead of the purified antigen that has been suggested for dot-blot assays. Moreover, when pure antigen is used the effect of crosslinking fixative is not truly mimicked because the antigen is not surrounded by other proteins present in the original sample (Van de Plas 1997). The method is also fairly rapid. We have presented data for studies in which the primary antibody incubations have been extended overnight. However, it is also fairly common to carry out this step for 1 hr at room temperature. Other processing steps can also be shortened.
Although we have worked with a soluble intracellular antigen, in principle the ELISA technique can also be applied to other proteins, including membrane-bound antigens (Noteboom et al. 1984; Schmutz et al. 1994). For membrane antigens, care must be taken in interpretation of the results because certain antigens and extraction procedures are known to affect the sensitivity of ELISA (Livingston et al. 1997). The isolated cell membranes and some organelles can also be coated directly on the ELISA wells to quantitate membrane antigens (Howard et al. 1980). Methods that deal with either purified antigen or antigen present in the extracted cell lysate may not truly mimic the interactions that take place during fixation and processing in vivo. This may be especially true for antigens that are sequestered in certain cell compartments, such as membranes. Nevertheless, it should be emphasized that there exists a strong correlation between the retention of antigenicity using cell lysates and direct immunogold labeling TEM. For membrane antigens exposed on the cell surface, whole-cell ELISA can be considered (Straus et al. 1993). Although the sensitivity of antigen detection to fixation and dehydration varies tremendously from one protein to another, the technique used and the protocol proposed can certainly be applied to any antigen.
In carrying out immunogold quantitation of antigens via electron microscopy, crucial decisions about the exact processing method must be made. This is especially so when the sample is available in limited quantity. Screening by ELISA would therefore assist in making a logical decision about the antigen losses due to processing steps and thereby aid in the selection of an optimal protocol for immunogold labeling electron microscopy.
Footnotes
Acknowledgements
We wish to thank Drs A. Mondal, R. Kishore, G.C. Varshney, and A. Mukhopadhyay for critical reading and correction of the manuscript. The skillful technical assistance of Mr Anil Theophilus is gratefully acknowledged. This is IMTech Communication no. 019/2000.