
Abstract
We describe staining protocols for serial semithin sections of Drosophila central ganglia that allow visualization of gene expression in particular neurons with counter-staining to display the ganglion architecture. Green fluorescent protein (GFP), expressed in a subset of sensory neurons from a selected enhancer trap line, is visualized by conventional immunohistochemistry with a peroxidase-linked antibody, and neural architecture is revealed by reduced silver staining. This makes visible in histological sections the same GFP-labeled cells seen with confocal microscopy, but with the especial advantage that neuropil structures are also revealed at the level of individual cells and neuron processes. Not only does this allow the physical relationships among intracellularly labeled neurons to be determined by reference to specific features in the neuropil but it also enables a function to be ascribed provisionally to particular regions of neuropil. These methods have particular utility for mapping morphological information on specific neurons in the context of central nervous system architecture, both in adult Drosophila and during development.
Keywords
M
The next crucial analytical step is to relate such images of individual neurons to the detailed architecture of the central ganglia, to define their precise spatial relationships with each other and with features such as fiber tracts and commissures. When neurons are universally stained to reveal ganglion architecture, it is necessary to cut sections. Confocal microscopy is less successful when many features are stained, and only histological sections are accessible to the necessary staining techniques. The strategy currently favored for matching histological datasets from physical sectioning with optical datasets from confocal microscopy is to create a database of anatomic information such as the one provided by “Flybrain” (Armstrong et al. 1995). A particular goal is to include a virtual “standard brain” (Heisenberg and Kaiser 1995) that can be rotated and resectioned in any orientation to match the histological and expression data and thus act as a link to relate information from the two methodologies.
There are three particular difficulties with this strategy. First, there are few features in central ganglia universally revealed by both methodologies that could act as suitable landmarks for matching datasets. Features such as ganglion contours, cell body positions, and neuropil boundaries are too approximate, and too inherently variable, to supply accurate reference points. Second, there are separate and different problems with 3D reconstruction from both methodologies that make image matching difficult. In confocal microscopy, image quality deteriorates at greater depths in the tissue, which introduces artifacts into the final reconstruction. Different artifacts from reconstruction from histological sections arise because alignment is less accurate than that of confocal sections, because of the physical distortions microtomy produces. Third, a “standard” ganglion ignores individual variations in size, shape and proportion of CNS structures. This can arise from experience (Heisenberg et al. 1995; Barth et al. 1997), genotype (Fischbach et al. 1989), or tissue processing (Meinertzhagen et al. 1998), all of which make comparison of preparations with the standard problematic.
All these difficulties could be resolved by a method that reveals a molecular genetic label in the same preparation as ganglion architecture staining. If individually labeled neurons could actually be visualized in the context of their cellular environment, it would resolve doubts and ambiguities in reconciling images from each methodology. Here we describe just such a method. We have devised staining protocols for serial semithin sections (Tyrer 1999) that allow antibody labeling of green fluorescent protein (GFP) expressed in small subsets of neurons from selected GAL4 lines, with counterstaining with reduced silver to reveal ganglion structure. Not only does this make the same GFP-labeled cells seen by confocal microscopy visible in physical sections but it also enables their exact relationships to be visualized relative to other ganglion structures, defined down to the level of individual cells and neuron processes.
Materials and Methods
The thoraco-abdominal ganglion complex was dissected from adult fruit flies, Drosophila melanogaster. The GAL4-enhancer trap line C42 was identified from a large screen of GAL4 lines performed in the Southampton laboratory. C42 was selected for reporter gene expression in a subset of sensory neurons from chordotonal organs in the femur, the wings, the halteres, and a multiscolophorous organ in the abdomen (Smith and Shepherd 1996). This is a line well characterized from many hundreds of preparations examined by light and confocal microscopy. Twenty-two preparations were chosen for sectioning because the afferent projections were clear, intense, and typical in appearance in whole mount after antibody staining. All chemicals used were supplied by Sigma–Aldrich; Dorset UK unless otherwise stated.
Immunolabeling
The GAL4 lines selected had been crossed to a UAS–GFP-tau reporter line using standard genetics. Staining in whole ganglia was done with an antibody to GFP and DAB staining, in a similar manner for making permanent preparations of Lucifer Yellow-labeled neurons (Brandon and Criswell 1991; Pu and Berson 1992). Ganglia were fixed in 4% paraformaldehyde overnight at 4C (30 min in the case of confocal preparations), washed with PBT (PBS containing 0.4% Triton X-100), and their permeability increased by immersing in 2 N HCl in PBT for 30 min. After washing in PBT, they were transferred to anti-GFP antibody [mixed monoclonal mouse antiserum (Boehringer Mannheim; Sussex, UK]) at a concentration of 1:200 overnight at 4C. The primary antibody was revealed using a Vectastain ABC kit (Vector; Peterborough, UK) as described by Smith and Shepherd (1996).
Sectioning
The ganglia were dehydrated in an ethanol series, infiltrated with celloidin (Fisher Scientific; Leicester, UK) in ether–ethanol, and embedded according to the celloidin-wax sandwich technique (Tyrer 1999). Serial 2-μm sections were cut in the transverse plane, floated on distilled water on subbed slides, and flattened and dried at 60C.
Reduced Silver Staining
After dewaxing sections in xylol, slides were first washed in a 1:1 mixture of 100% ethanol and chloroform instead of the usual 100% ethanol, because the celloidin embedding medium is soluble in pure ethanol. They were then progressively hydrated in 95%, 70%, and 50% ethanol and then to distilled water.
The basic procedure followed was the silver staining method described by Rowell (1963) but with times and pH optimized for this material. From distilled water, the slides were first soaked in silver nitrate, impregnated in a buffered silver nitrate–lutidine solution, and then developed with hydroquinone in silver nitrate and sodium sulfite. Sections were toned in gold chloride, the silver/gold salts reduced with oxalic acid, and finally fixed in sodium thiosulfate.
For all preparations, the following protocol was used. The soak was for 3 hr in 20% silver nitrate in the dark. The impregnating solution was made as follows: 150 ml distilled water, 12 ml borax buffer at pH 7.0, 12 ml 1% silver nitrate, 6 ml lutidine. Slides were incubated in this for 24 hr at 50C, after which they were rinsed, first in distilled water for 5 min, then in 2% sodium sulfite for 2 min before returning to distilled water.
The developer solution was made as follows: 170 ml 9% sodium sulfite, 5 ml 5% silver nitrate, 11.25 ml 0.5% hydroquinone. The slides were developed in the dark, stirring continuously. Development time was the only variable changed and was determined precisely by a stopwatch. Initially, 22 preparations were developed at five different times: 4 min, 4.5 min, 5 min, 5.5 min, and 6 min. The shorter development times produced lighter staining of a reddish color, whereas longer times produced more intense staining of a blue-black color, although both color and intensity of staining varied slightly even with the same development time. Although developing for 5.5 min gave good definition of neuropil features, in some regions the immunolabel became less distinct. The heavier staining in six preparations that were developed for 6 min tended to obscure much of the immunolabel and were therefore excluded, leaving 16 preparations in the final analysis.
After developing, the slides were rinsed in distilled water (5 min), running tapwater to remove all traces of developer (5 min), and distilled water again (5 min). They were then immersed for 5 min each in (a) 0.2% gold chloride (acidified with a few drops of glacial acetic acid), (b) 2% oxalic acid, and (c) 5% sodium thiosulfate, each solution interspersed with a 5- min wash in distilled water. After the sodium thiosulfate, the slides were washed for 20 min in running tapwater, dehydrated in an ethanol series, transferred to xylol, and coverslipped with Canada balsam.
Microscopy and Photography
Confocal Microscopy. Labeled neurons were imaged with a Biorad MRC600 confocal microscope The ganglion was imaged with a ×40 objective (NA 0.75) at an emission wavelength of 488 nm, and the fluorophore was imaged using a 560-nm dichroic and 522-nm emission filter. Optical sections were cut at consecutive intervals of 2 μm and saved as a Z-series. To obtain a 2D image of the labeled neurons, the Z-series was merged using the confocal software.
Light Microscopy. Stained sections were examined on a Leitz Dialux microscope and photographed with Kodak Elitochrome T and Kodak Gold 200 film using ×63 (NA 1.25) and ×100 (NA 1.32) oil immersion objectives.
Results
GFP Expression in the C42 Line
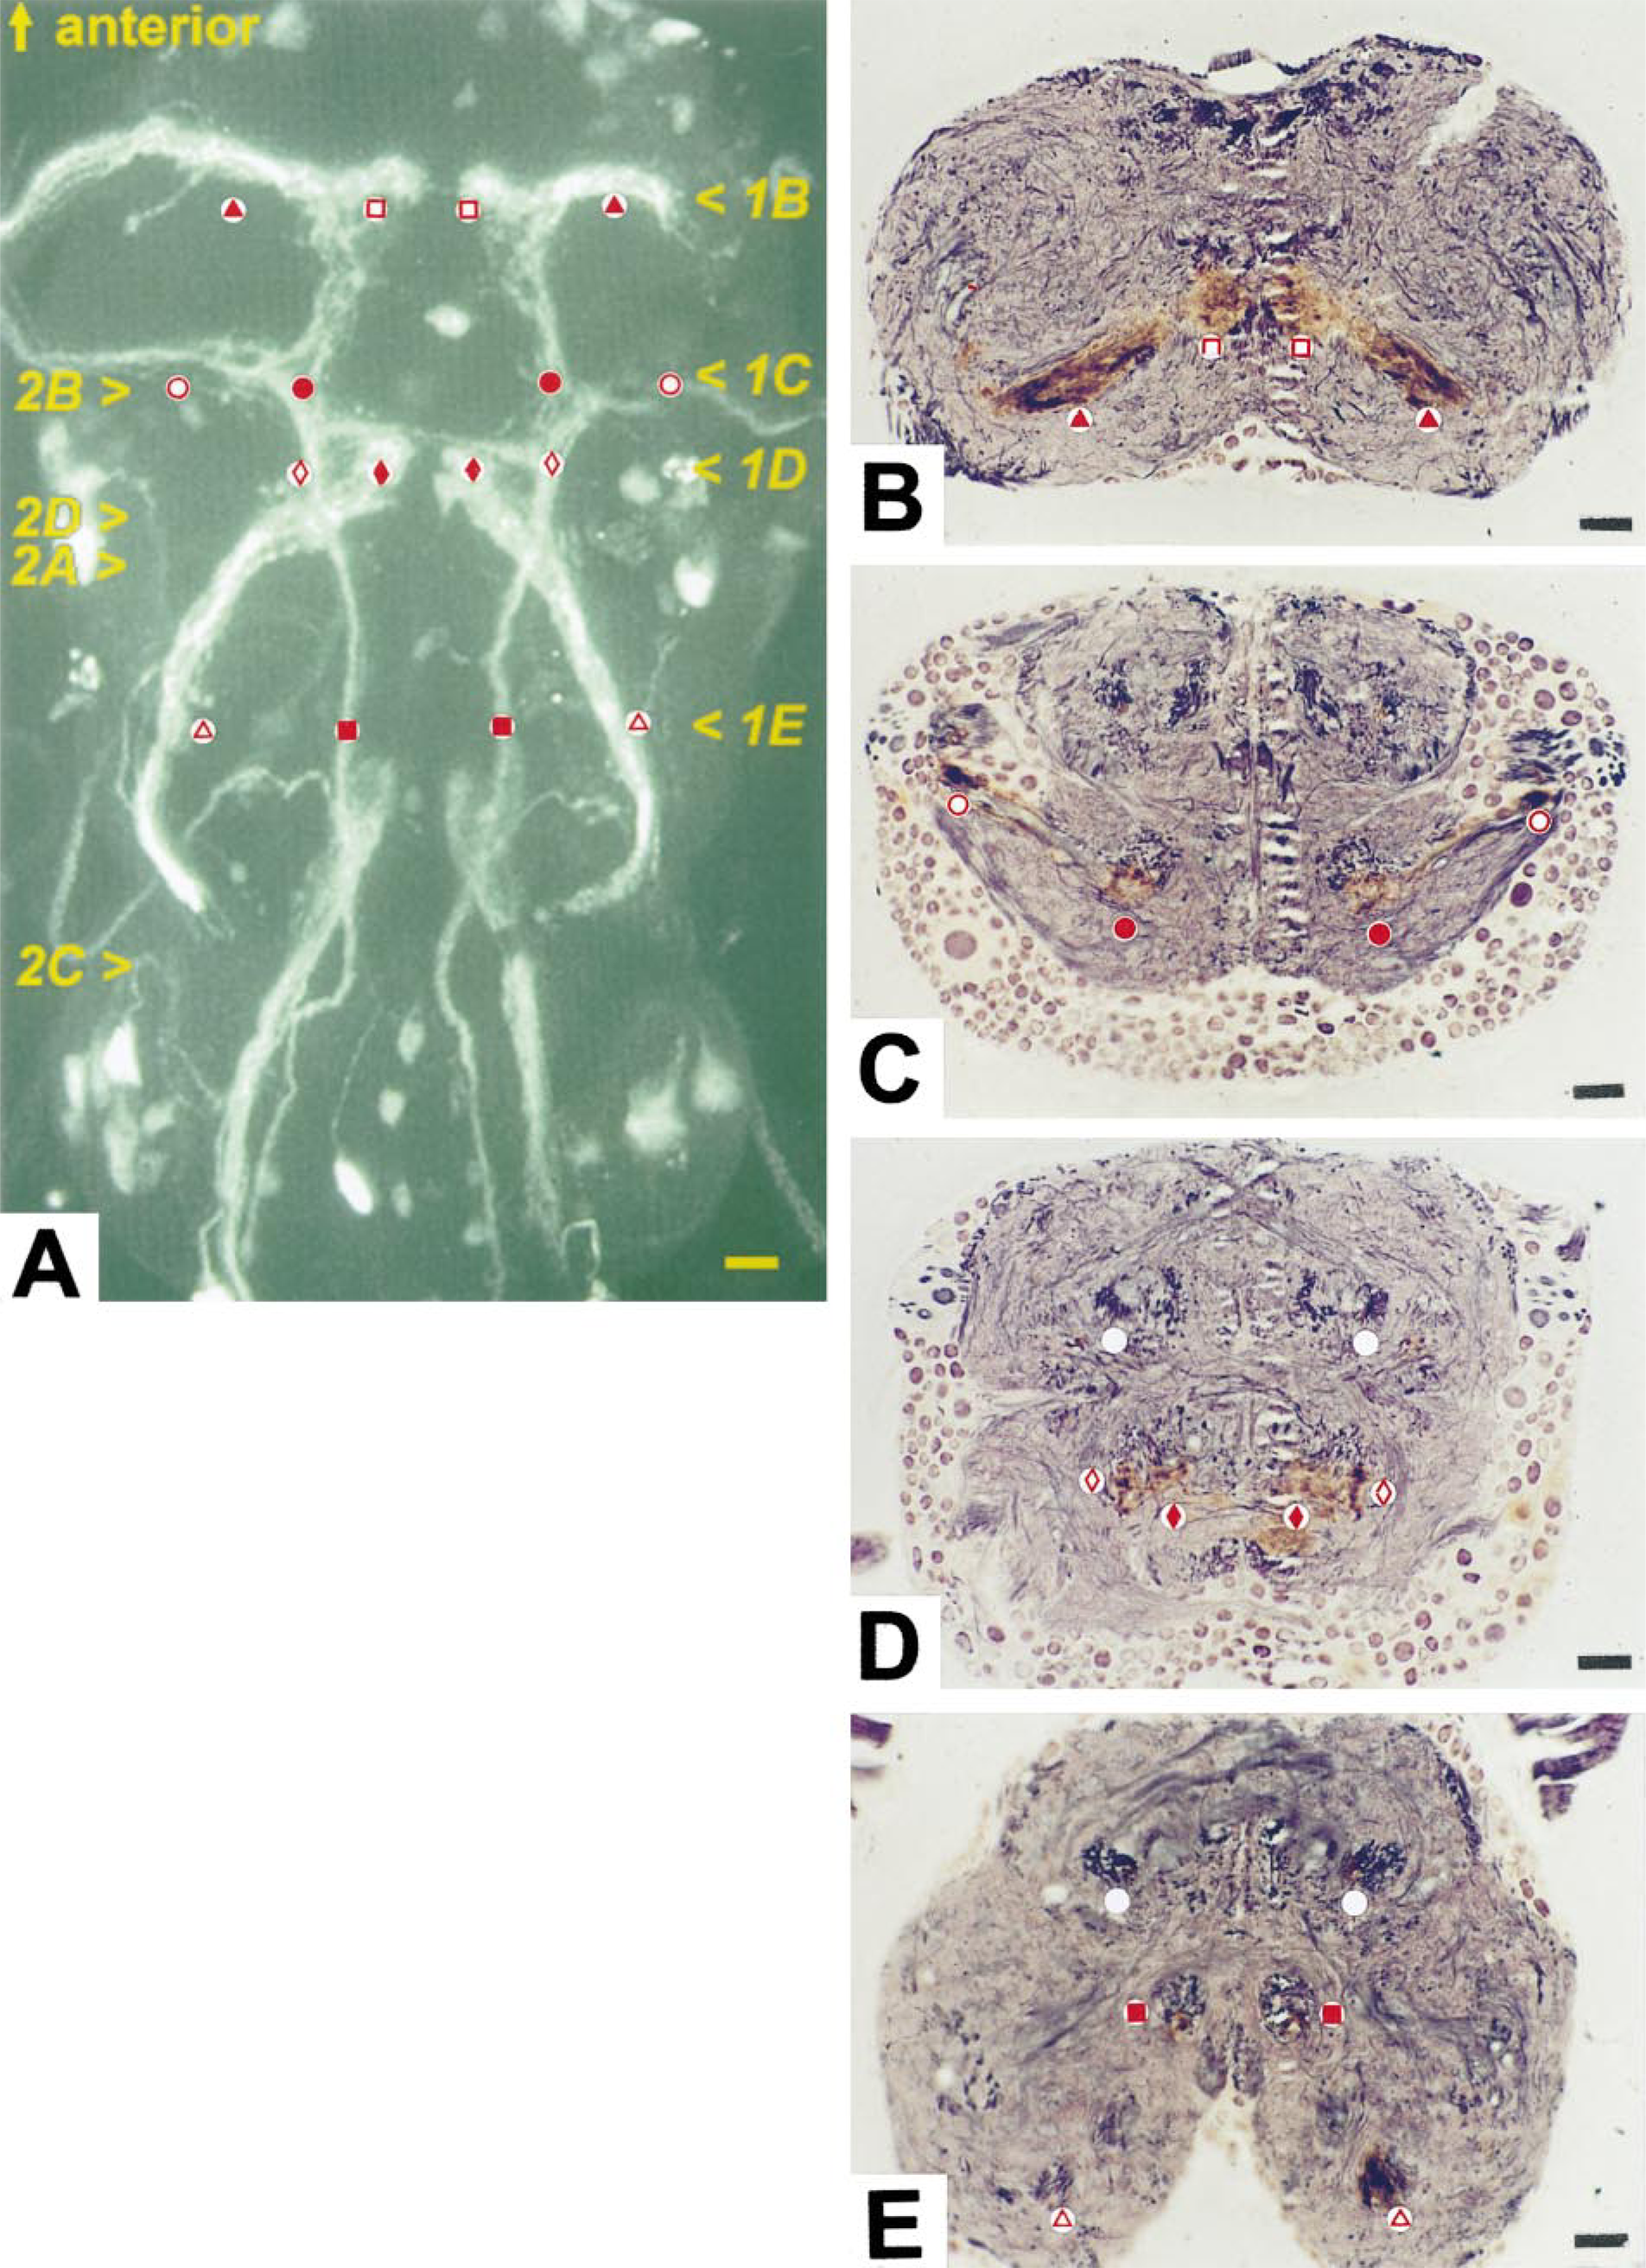
The reporter gene expression in enhancer trap line C42 reveals a subset of chordotonal sensory neurons. Axons from these neurons enter the thoracic ganglion through each of the three pairs of leg nerves, forming a club-like projection with a “shaft” in each nerve root and a knob-like cluster of endings close to the midline. Smaller components enter from the wings through the anterior dorsal mesothoracic nerves and from the halteres through the haltere nerves (Figure 1A). A prominent bundle of axons from the abdominal multscolophorous organ enters by the first abdominal nerve and runs forward to contribute to the clusters of endings close to the midline (Figure 1A). A small population of motor neuron cell bodies is also labeled but the label does not extend to the branches of these neurons and so they do not interfere with the analysis of the sensory projections.
Double Staining with Antibody and Reduced Silver
Reduced silver staining techniques are the traditional methods used for neuropil staining [Bodian 1936; Holmes 1943; Samuel 1953; Gros-Bielschowski (see Kiernan 1998)]. Such staining reveals a proportion of neurofilaments in every neuron (Kiernan 1998), the proportion increasing with the time in impregnator and developer (Rowell 1963). The neurofilaments tend to clump to each other and to the cell membrane, which increases contrast and thus helps define individual neurons.
In our hands, with this type of semithin section, the Rowell method (1963) normally produces a predominantly red-purple color, with some large axon profiles having a gray color. The slightly red tinge after gold toning is apparently caused when the gold/silver particles are small compared with the wavelength of light. Lengthening development time shifts the color more to blue-black, which enhances contrast between neuropil staining and the orange-brown color of the peroxidase-labeled neuron profiles. However, the intensity of the silver staining also increases and, because the immunoreactive profiles also have argyrophilic elements, this can obscure the immunolabel. Preparations developed for 5–5.5 min showed best the basic architecture of tracts and commissures identified by other workers (e.g. Power 1948 in Drosophila: Strausfeld 1976 in Musca; Merritt and Murphey 1992 in Phormia). The orange-brown color of the reaction product in many regions is clearly distinct (Figures 1B, 1C, and medioventral regions in 1D). However, in these preparations with longer development times, the intensity of silver stain in some regions, such as the haltere tract, (Figure 1D and 1E), tends to conceal the antibody stain so that it becomes difficult to follow immunoreactive branches. Here, the less intense silver staining in preparations developed for the shorter times was better for defining the spatial relationships of labeled afferents (Figure 2). It is particularly interesting that the technique reveals branches of immunoreactive neurons in the haltere tract, closely associated with large, pale-staining profiles whose location suggests that they are components of motor neurons (Figure 2D). This accords well with the physiological evidence for monosynaptic connections between haltere afferents and flight motor neurons (Trimarchi and Murphey 1997).
More problematic is the interpretation in regions lightly labeled by antibody staining, which have a pale orange color. In some cases this orange label is located in well-defined structures, such as cell bodies (Figure 1E), and it is plain that these are cell components showing weak expression of the gene product. In other areas, however, the orange color appears less confined (e.g., in the endings in the “club”—the sensory terminal clusters in central regions of neuropil seen in Figure 1B and 1D). In these cases it is difficult to decide if the reaction product is located in profiles below the resolution of the microscope or if it has diffused from more heavily stained regions. This is a question that must be resolved by electron microscopy. Even so, definition at this level of resolution is clearly sufficient to map neuronal projections accurately to within at least a few micrometers in the context of neuropil structure.
Discussion
We present here a technique that is easy, inexpensive, and which we believe has far-reaching implications for integrating neuroanatomic data for Drosophila, both in the adult CNS and at different developmental stages. First, it is versatile. The methodology is not confined simply to the definition of neuron relationships. It can be used with any antibody, whether to a reporter gene, a transmitter, a receptor, or to a substance such as intracellularly injected Lucifer Yellow. Consequently, it will be possible to plot the precise positions of, e.g., glial cells, to assign chemical identity to particular neurons, and to relate intracellular recordings to their anatomic context.
Second, the method offers the prospect of assignment of function to neuropil features with names that hitherto have had to be confined to their position or appearance. This promise has been implicit from the beginning of the neuroanatomic use of gene expression patterns (Meinertzhagen et al. 1998), but without the means we provide here of uniting molecular genetic and traditional histological data, this promise has remained largely unfulfilled.
Finally, the method provides a solution to the profound problem of integrating gene expression data with 3-D information on the anatomy of pathways and identified neurons in a database such as Flybrain. The combination of techniques we describe here provides a strategy that will allow, for the first time, the visualization of individual molecularly labeled neurons in the context of well-defined neuropil staining. Using neuropil features as landmarks for reference, it then becomes possible to relate specific neurons labeled in different preparations to each other with a precision that cannot be achieved by techniques based on the averaging of virtual images (Heisenberg and Kaiser 1995; Galizia et al. 1999). Our methodology provides concrete information on those cellular entities that are in close proximity to the labeled neuron, thus providing meaningful reference information that permits variation in individual ganglia to be taken into account. Therefore, it should be possible to realize the ultimate objective of an anatomic database for Drosophila CNS, i.e., the provision of 3D maps that define precisely the physical relationships of the component neurons.
Such a map is an important step not only for developmental studies of individual neurons and their interactions but also for determining how neurons are connected to each other. Of course, neuronal connectivity cannot be decided from a database of information collected from light microscopy alone, but studies at the light microscopic level have a vital role. Establishing proximity of identified neurons is the logical first step in determining connectivity, and then this knowledge can be used to direct higher resolution and functional studies. As ultrastructural information and data from physiological and pharmacological experiments become available, they can be integrated with the database assembled from light microscopic techniques such as those we describe here.
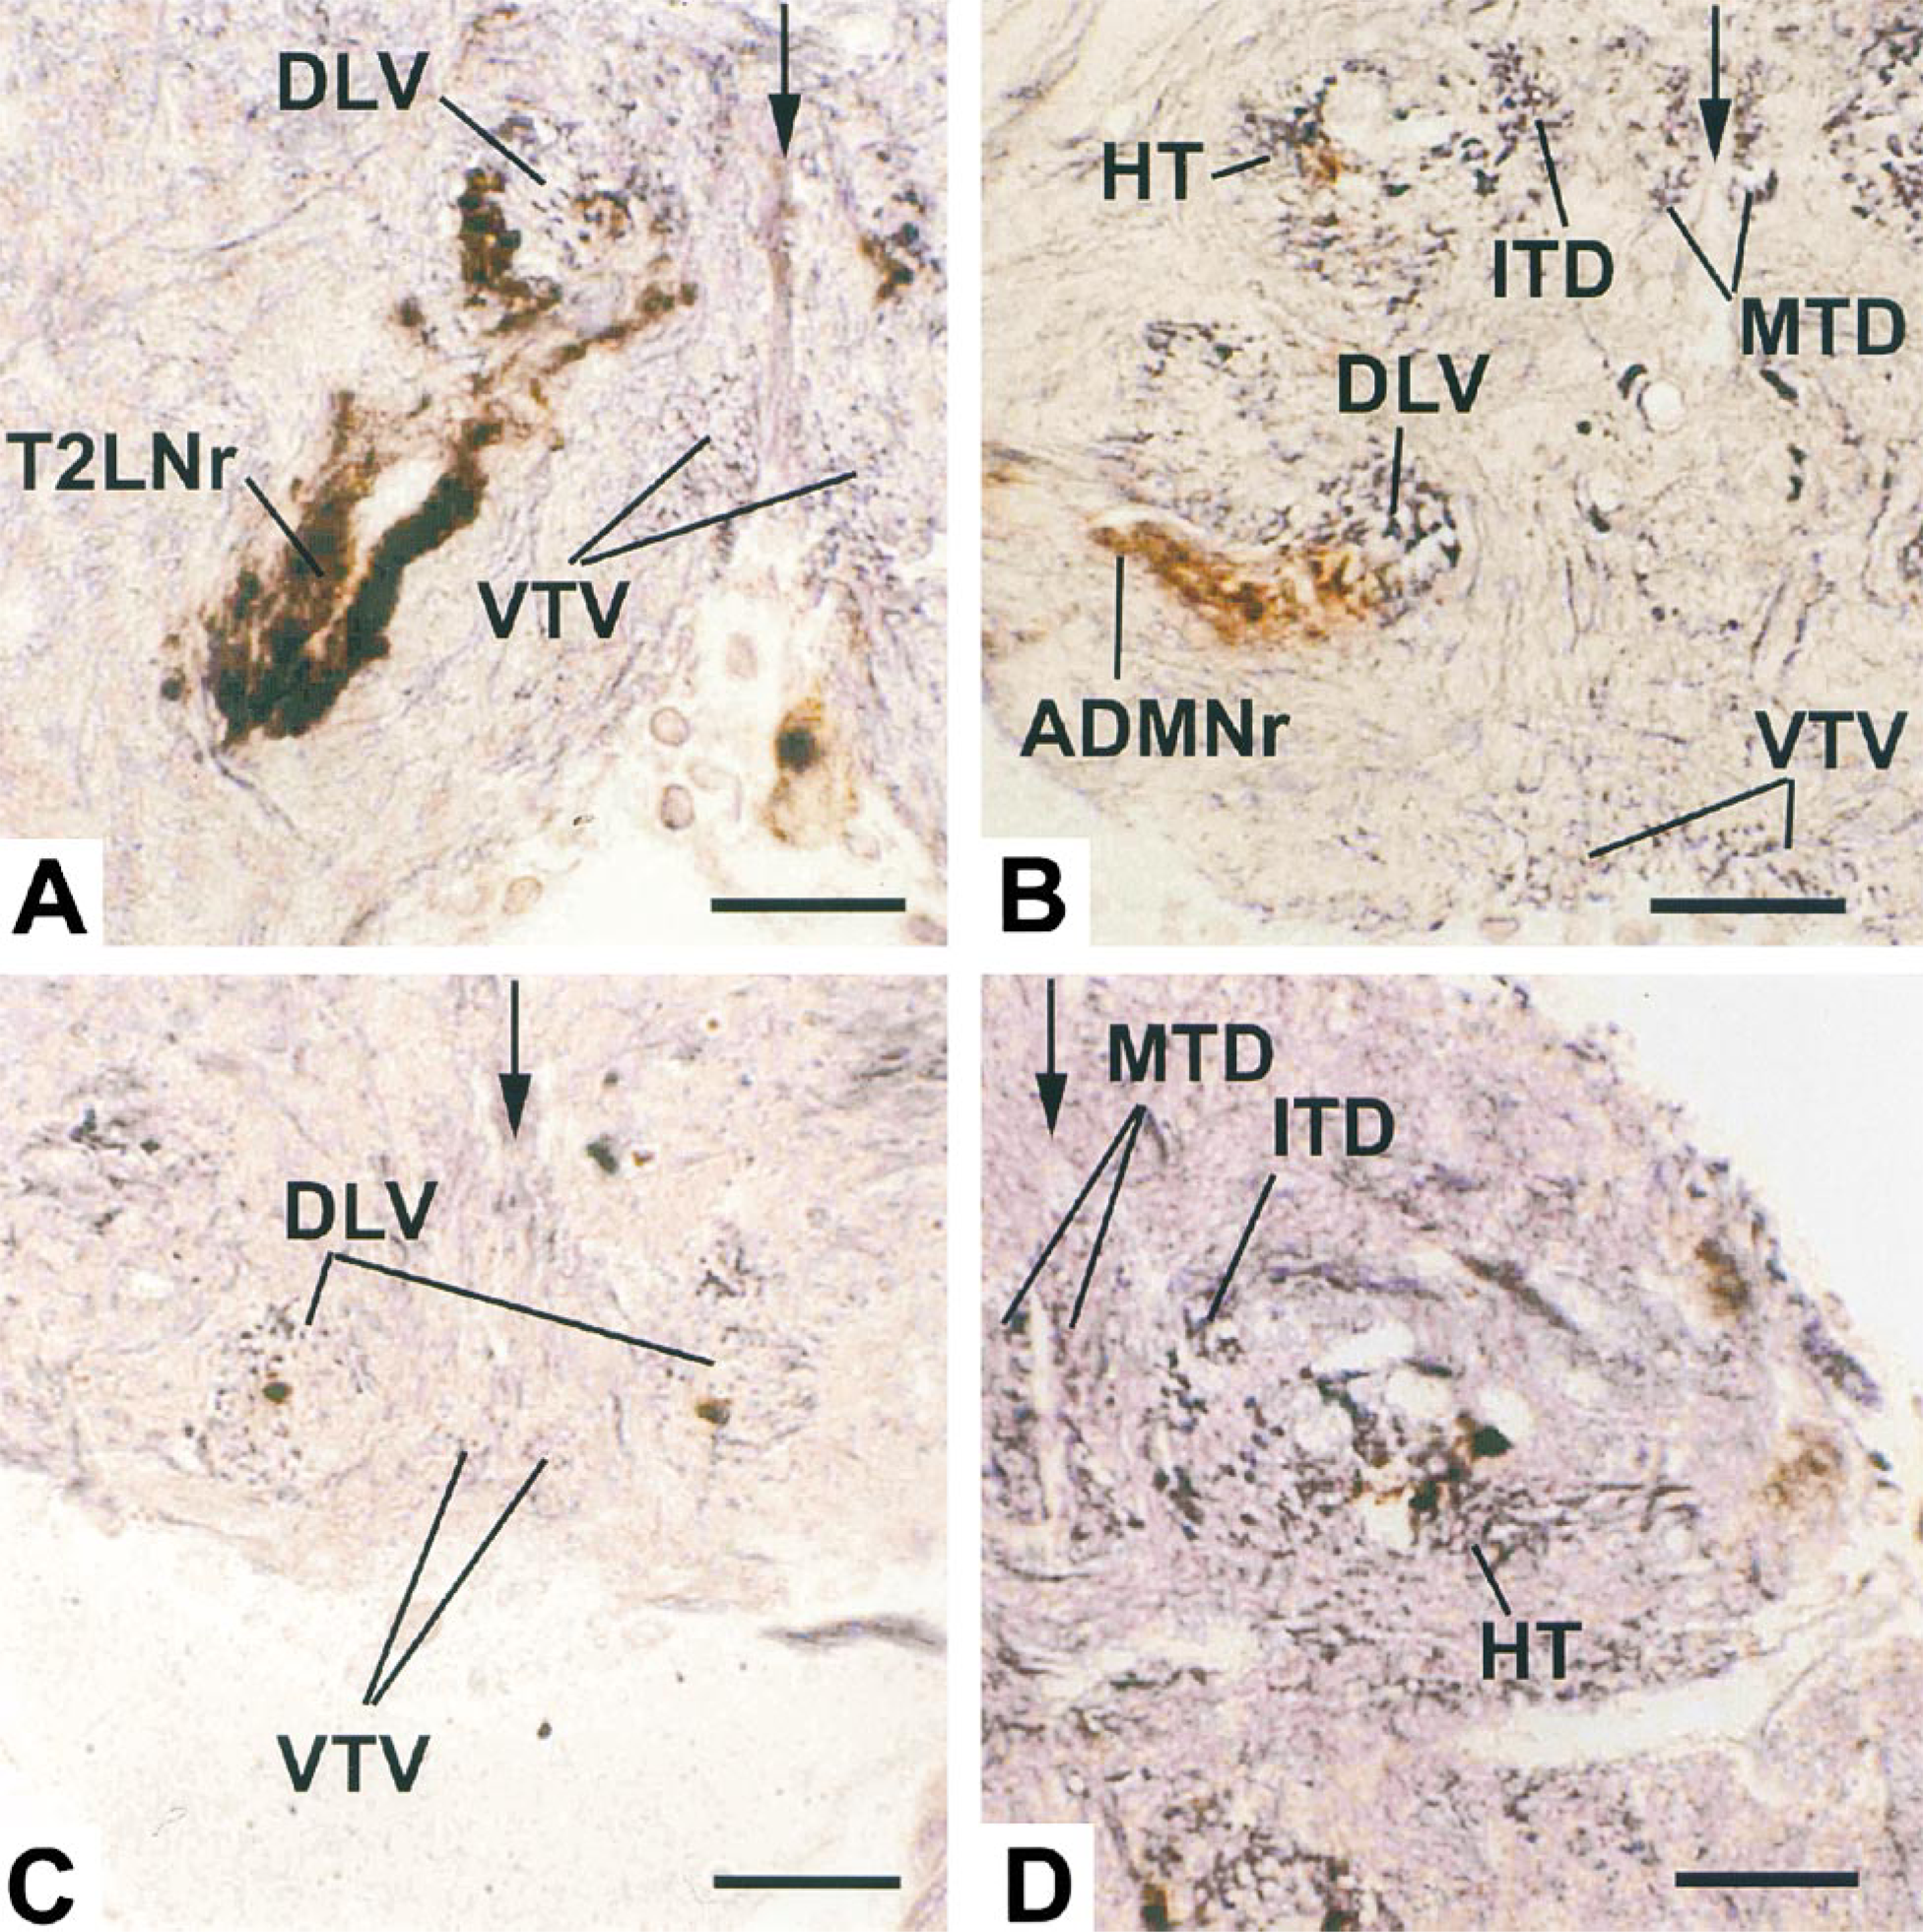
Transverse 2-μm sections from double stained preparations in which the reduced silver has been developed for shorter times than that shown in Figure 1. The sections in