
Abstract
Because G-protein-coupled receptors (GPCRs) constitute excellent putative therapeutic targets, functional characterization of orphan GPCRs through identification of their endogenous ligands has great potential for drug discovery. We propose here a novel single cell-based assay for identification of these ligands. This assay involves (a) fluorescent tagging of the GPCR, (b) expression of the tagged receptor in a heterologous expression system, (c) incubation of the transfected cells with fractions purified from tissue extracts, and (d) imaging of ligand-induced receptor internalization by confocal microscopy coupled to digital image quantification. We tested this approach in CHO cells stably expressing the NT1 neurotensin receptor fused to EGFP (enhanced green fluorescent protein), in which neurotensin promoted internalization of the NT1–EGFP receptor in a dose-dependent fashion (EC50 = 0.98 nM). Similarly, four of 120 consecutive reversed-phase HPLC fractions of frog brain extracts promoted internalization of the NT1–EGFP receptor. The same four fractions selectively contained neurotensin, an endogenous ligand of the NT1 receptor, as detected by radioimmunoassay and inositol phosphate production. The present internalization assay provides a highly specific quantitative cytosensor technique with sensitivity in the nanomolar range that should prove useful for the identification of putative natural and synthetic ligands for GPCRs.
R
Until now, research strategies for the identification of GPCR endogenous ligands have mainly resorted to G-protein-mediated signaling as an indicator of receptor activation. Thus, the endogenous ligand for the orphan opioid-like receptor ORL1 was isolated from rat (Meunier et al. 1995) and porcine (Reinscheid et al. 1995) brain extracts using an adenylate cyclase inhibition assay in transfected cell lines. Similarly, Sakurai et al. (1998), Cox et al. (1997), Saito et al. (1999), and Ames et al. (1999) identified endogenous ligands for mammalian orexin, Lymnea leucokinin, melanin-concentrating hormone, and human urotensin-II receptors, respectively, on the basis of their ability to increase intracellular calcium mobilization in cells transfected with the corresponding orphan receptors. Recently, a prolactin-releasing peptide (Hinuma et al. 1998) was also isolated from mammalian tissues by using the production of arachidonic acid as reporter signal. Finally, the cytosensor microphysiometer (McConnell et al. 1992), which detects metabolic activation of the cell by measuring acidification of the extracellular milieu, was used to identify apelin, an endogenous ligand for the human APJ receptor (Tatemoto et al. 1998).
Although clearly successful in these specific instances, signal transduction-based approaches have the disadvantage of being highly dependent on the successful prediction of the transduction pathways used by the orphan GPCR. In addition, the orphan receptor may have to be expressed in a variety of cell lines before one is found to exhibit viable coupling (Stadel et al. 1997). Finally, both signal transduction-based approaches and the more generic cytosensor microphysiometer assay are impeded by the presence of many endogenous GPCRs in the host cell line, which may interfere with the recorded signal. To circumvent these shortcomings, we devised a novel assay for endogenous ligand-induced GPCR activation based on ligand-induced internalization of fluorescently tagged receptors.
A major characteristic of GPCRs is their property of internalizing into their parent cells on ligand exposure. This phenomenon, which is also referred to as receptor–mediated endocytosis, is time- and temperature-dependent and involves clustering and sequestration of receptor-ligand complexes into clathrin-coated pits. Internalization is clearly dissociated from G-protein signaling (Hermans and Maloteaux 1998) and is believed to play a critical role for both receptor desensitization, through depletion from the cell surface (Yu et al 1993; Beaumont et al. 1998), and resensitization, through dephosphorylation (Ferguson et al. 1998). The development of confocal microscopic imaging techniques, using either fluorescent ligands or epitope-tagged receptors, has made it possible to directly visualize the fate of internalized receptor–ligand complexes and to demonstrate that these are all endocytosed via the endosomal pathway in the form of intensely fluorescent puncta (von Zastrow and Kobilka 1992; Ashworth et al. 1995; Faure et al. 1995; Grady et al. 1995; Roettger et al. 1995). This is usually, although not always, accompanied by a marked decrease in cell surface receptors (von Zastrow and Kobilka 1992; Ashworth et al. 1995; Grady et al. 1995).
Our proposed assay consists of confocal microscopic monitoring of the fate of green fluorescent protein-tagged GPCRs in transfected cells after exposure to HPLC fractions of pre-purified tissue extracts. This approach is based on findings from several recent studies that reported successful C-terminal tagging of GPCRs with autofluorescent proteins without substantially altering pharmacological and internalization properties of the tagged GPCRs (Barak et al. 1997a,b; Awaji et al. 1998). We used here as a prototypical system the internalization of the NT1 neurotensin receptor fused to the enhanced green fluorescent protein (EGFP), a GPCR for which the time course and intracellular patterning had been extensively characterized in both transfected and naturally expressing cells (Faure et al. 1995; Vandelbucke et al. 1998). Binding of neurotensin (NT) to the NT1 receptor leads to phopholipase C activation and subsequent inositol phosphate (IP) production (Hermans and Maloteaux 1998), so that the monitoring of IP production provided a convenient system to appraise the efficacy of our internalization-based method. We demonstrate here that this method provides a highly selective and sensitive approach for identification of ligands that act on GPCRs.
Materials and Methods
Plasmid Construction of the NT1–EGFP Fusion Protein
To construct NT1-EGFP, the rat NT1 cDNA (a gift from Dr S. Nakanishi; Institute for Immunology, Kyoto University Faculty of Medicine, Japan) was first amplified from plasmid pcDNA I by polymerase chain reaction using as 5′-oligonucleotide primer 5′-CTT AAG CTT ATG CAC CTC AAC AGC TCC GTG-3′ [containing the nucleotides CTT, the Hind III restriction site sequence and nucleotides 1–21 of the rat NT1 cDNA (Tanaka et al. 1990)] and as 3′-primer 5′-TTT GGA TCC GCG TAC AGG GTC TCC CGG GT-3′ [corresponding to nucleotides 1255–1272 of the NT1 receptor cDNA, the sequence of the amino acid alanine followed by that of the restriction site Bam HI, and three additional nucleotides AAA). The PCR product (1292 bp) was gel-purified and digested using Hind III and Bam HI restriction enzymes and directly inserted between the Hind III and Bam HI sites of plasmid pEFGP-N1 (Clontech; Palo Alto, CA) before the 5′ end of the EGFP cDNA (Figure 1A). The construct was verified by sequencing.
Preparation of Frog Brain Extracts
Adult male frogs (Rana ridibunda) were obtained from a commercial source (Couétard; St-Hilaire de Riez, France). The brains of 2500 animals (215 g wet weight) were collected and kept frozen. The tissue was boiled for 15 min in 0.5 M acetic acid and homogenized in a Waring blendor. After centrifugation (4000 × g for 30 min at 4C), the supernatant was pumped at a flow rate of 2 ml/min through 10 Sep-Pak C18 cartridges (Waters Associates; Milford, MA) connected in series. Bound material was eluted with 70% (v/v) acetonitrile in water. The eluted material was then partially evaporated in a rotavapor (Büchi; Flavil, Switzerland) and centrifuged at 13,000 × g for 5 min at 4C. The supernatant was pumped at a flow rate of 2 ml/min onto a 1 × 25-cm Vydac 218TP1010 C18 reversed-phase HPLC column (Separations Group; Hesperia, CA) equilibrated with 0.12% trifluoroacetic acid. The concentration of acetonitrile in the eluting solvent was raised from 14 to 42% over 40 min at a flow rate of 2 ml/min and then raised again to 56% over 60 min at a flow rate of 1 ml/min. One-minute fractions were collected and the absorbance was measured at 215 and 280 nm.
Stable Transfection of CHO Cells
CHO-K1 (American Type Culture Collection; Rockville, MD) were maintained in Ham's F12 medium supplemented with 7.5% fetal calf serum, 1 mM glutamine, 100 U/ml penicillin, and 100 μg/ml streptomycin (all from Boehringer Mannheim; Mannheim, Germany). To establish pure cell lines expressing the NT1-EGFP receptor, 2.6 × 10⁶ CHO-K1 cells were trasnfected with 8 μg of the plasmid, using a liposomal transfection reagent (DOSPER Liposomal Transfection Reagent, Cat. No. 1781995; Boehringer Mannheim). Transfected cells were grown in a humidified atmosphere of 5% CO2/95% air and selected during 1 week for their resistance to 750 μg/ml geneticin G418 (Gibco; Cergy-Pontoise, France).
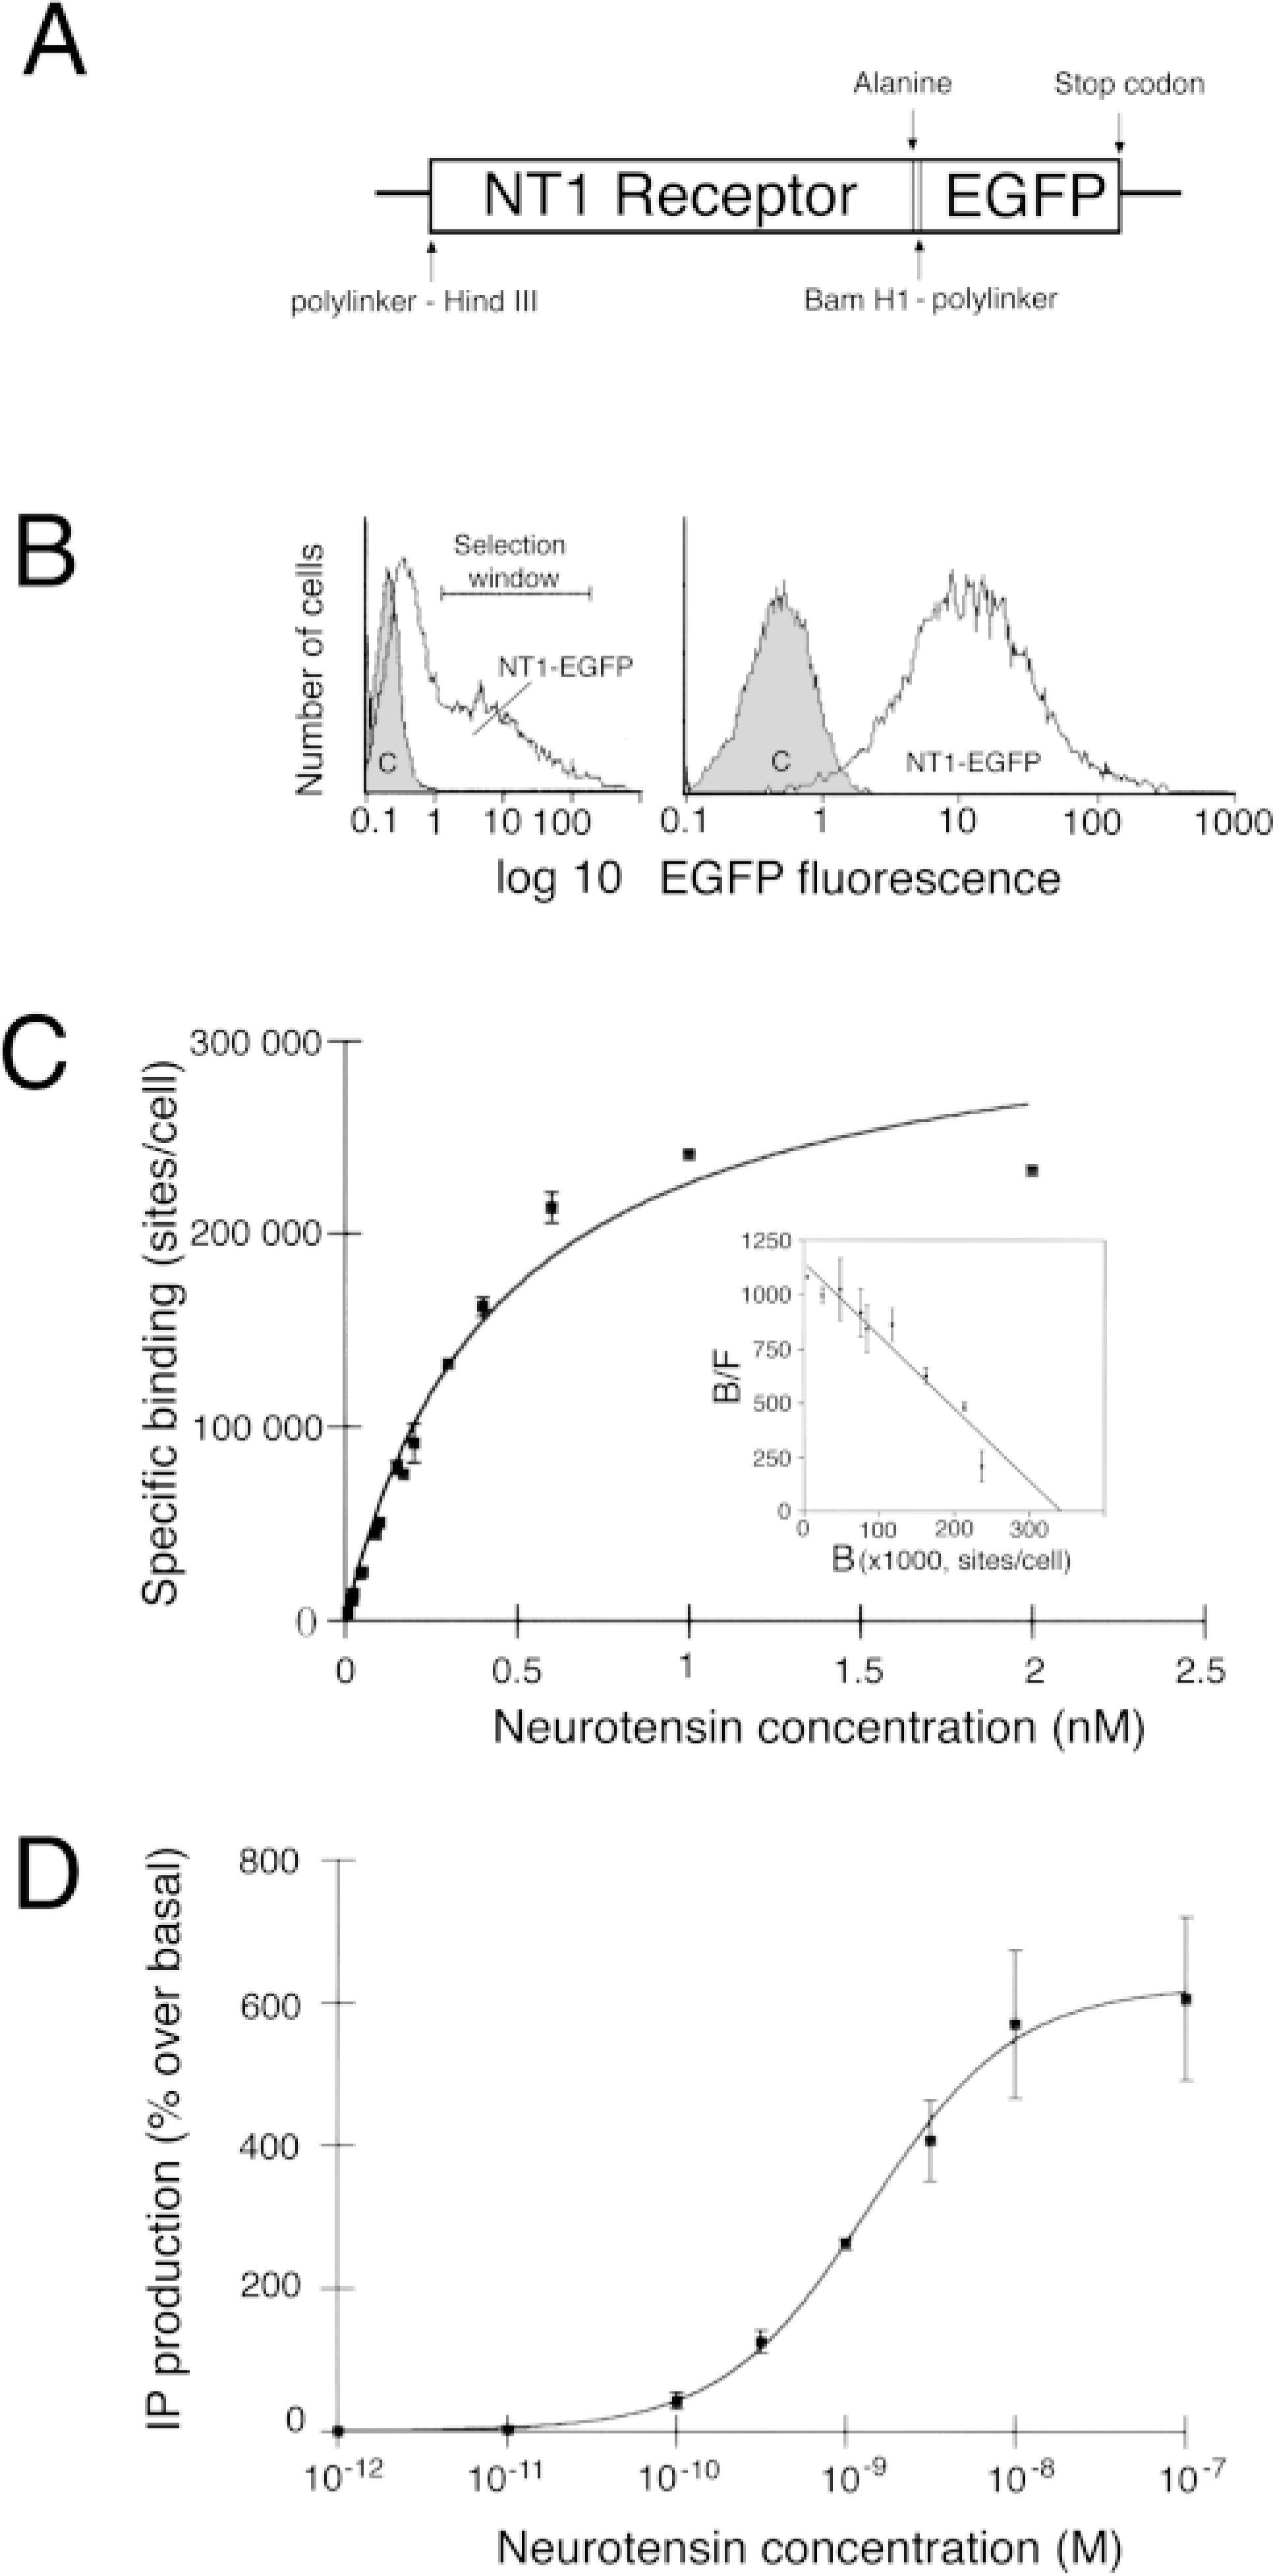
Construction and pharmacological characterization of the NT1–EGFP receptor stably transfected in CHO cells. (
Radioligand Binding Assay
Stable transfected CHO cells expressing the NT1–EGFP receptor were seeded onto 48-well plates at a density of 5 × 10⁴ cells per well. After 1 night in culture, medium was discarded and cells were washed once with 250 μl of PBS and incubated with increasing concentrations (10 to 2000 pM) of 125I-labeled Tyr3-neurotensin (2000 Ci/mmole; Amer-sham, Les Ulis, France) at 4C overnight in 100 μl of 50 mM Tris-HCl buffer, pH 7.5, containing 2 mM MgCl2, 20 mM HEPES, 0.1% BSA, and 0.8 mM 1–10 phenanthroline. Nonspecific binding was determined by adding 1 μM nonradioactive neurotensin (NT). At the end of the incubation, cells were washed twice with 500 μl of the same buffer, lysed in 250 μl of 1 N NaOH, and bound radioactivity was measured with a gamma counter. Scatchard analysis of the binding data was performed using the GraphPad Prism program (GraphPad Software; San Diego, CA).
Inositol Phosphate Production
The production of total IPs by stably transfected CHO cells expressing the NT1–EGFP receptor was determined as previously described (Torrens et al. 1989), with slight modifications. Briefly, NT1–EGFP-transfected or untransfected CHO cells were seeded into 24-well plates at a density of 105 cells per well. After 1 night in culture, 1 μCi myo-[3H]-inositol (18 Ci/mmole; Amersham) was added to each well and the plates were incubated for a further 24 hr. Cells were then incubated for 10 min with Krebs buffer (NaCl 120 mM, KCl 4.8 mM, MgSO4 1.2 mM, NaH2PO4 15.6 mM, CaCl2 1.2 mM, glucose 0.6%, BSA 0.04%, bacitracin 0.003%) containing 10 mM LiCl, followed by 30 min at 37C with increasing concentrations of NT or individual HPLC fractions in a final volume of 200 μl of the same buffer. Total [3H]-IPs were extracted, separated on a Dowex AG1-X8 anion exchange resin (Bio-Rad; Hercules, CA) column, eluted with 1 M ammonium formate, 0.1 M formic acid, and quantified by measuring the radioactivity.
Internalization Assay
Trypsinized NT1–EGFP-transfected CHO cells were diluted to obtain 105 cells/ml in Ham's F12 medium, seeded (300 μl/well) on polyallylamine-hydrochloride-coated (Aldrich, Madison, WI; 0.1 mg/ml for 30 min) 16-well glass slides (Lab-Tek Chamber Slides, Nalge Nunc; Rochester, NY), and grown overnight in a humidified atmosphere of 5% CO2/95% air. The volume of incubations (except for the pulse period) and washings was 250 μl per well. Ninety minutes before the beginning of the experiment, the medium was supplemented with cycloheximide to a final concentration of 70 μM (Sigma–Aldrich; St Quentin, France). Cells were then preincubated in ice-cold Earles’ buffer, pH 7.4 (140 mM NaCl, 5mM KCl, 1.8 mM CaCl2, 3.6 mM MgCl2), complemented with 0.1% bovine serum albumin, 0.01% glucose, and 0.8 mM 1–10 phenanthroline for 10 min. Cells were then incubated for 30 min at 4C (pulse period) with either (a) known concentrations of NT, (b) 20 nM fluorescent NT (Nα-Bodipy-NT(2–13), Fluo-NT (a generous gift of J.-P. Vincent; Nice, France), or (c) individual HPLC fractions of frog brain extracts diluted in complemented Earle's buffer to a final volume of 50 μl. At this point, some cells were subjected to a hypertonic acid buffer wash (0.2 M acetic acid solution containing 0.5 M NaCl in Earle's buffer, pH 4, for 2 min) to dissociate surface-bound ligand. Internalization was promoted by replacing the incubation medium with complemented Earle's buffer at 37C and placing the cells at 37C for 20–30 min (chase period). At the end of the chase period, cells were rinsed in cold Earle's buffer, fixed for 10 min with 4% paraformaldehyde dissolved in 0.1 M PBS, pH 7.4, rinsed again in cold Earle's buffer, and coverslipped using Vectashield (Vector Laboratories; Burlingame, CA) for confocal microscopic examination. In some experiments, cell nuclei were labeled by adding 1.5‰ propidium iodide (Sigma–Aldrich) to the mounting medium.
Confocal Microscopy
Cells were examined with a Leica TCS SP (Leica Microsystems; Heidelberg, Germany) confocal laser scanning microscope mounted on a Leica DM IRBE inverted microscope equipped with an argon–krypton laser. EGFP fluorescence was detected with 100% excitation at 488 nm, using an RSP 500 (dichroic) mirror and the spectrophotometer set to acquire emission between 530 and 560 nm. Fluo-NT was detected with 100% excitation at 568 nm, using a DD 488/568 dichroic mirror and the spectrophotometer set to acquire emission between 590 and 660 nm. PI was detected with excitation at 568 nm, using a DD 488/568 dichroic mirror and the spectrophotometer set to acquire emission between 580 and 700 nm. Optical sections (1024 × 1024) of individual cells were taken at the equatorial level (level of the nucleus; Figure 3), using a ×63 1.32 NA oil-immersion objective. Acquisition settings were kept constant for all cells.
Quantification of EGFP Fluorescence Internalization
Digital image analysis was performed on a Macintosh computer using the NIH Image program (developed at the US National Institutes of Health and available on the Internet at http://rsb.info.nih.gov/nih-image/) Microsoft Excel 5.0 (Microsoft; Redmond, Washington) and in-house-developed macro programs (submitted to the NIH Image Internet server and available at ftp://codon.nih.gov/pub/nih-image/user-macros/internalization_macros.txt). For each cell, after gray-scale conversion and median filtering, gray-scale density of pixels was measured along 12 radial axes (Figure 4A) and plot data were transferred into Excel. To better assess the amount of cell surface vs intracellular fluorescence, the gray-scale value of each pixel was multiplied by its radial distance from the measurement center, because the probability for a pixel of being sampled by this radial axis method is inversely proportional to its distance from the measurement center, and this probability is a simple function of the radius. Subsequently, Excel calculated the mean pixel density of membrane (M, corresponding to the mean gray-scale density of the most distal 30 pixels = 1 μm) and intracellular (I, mean gray-scale density for the remaining intracellular pixels) EGFP fluorescence for each cell (Figure 4B). M/I and I/M ratios were then derived for each cell from the mean of the 12 M and 12 I values.
Radioimmunoassay for Neurotensin on Pre-purified Frog Brain Fractions
Neurotensin-like immunoreactivity was measured using an antiserum (kindly supplied by Dr. G. Tramu; University of Bordeaux 1, Talence, France) raised against the C-terminal fragment of pig NT and 3-[125I]-iodotyrosyl-NT as a radioligand (Amersham; Poole, UK). The IC50 of the assay was 187 pg/tube and the minimal detectable amount of peptide was 30 pg/tube.
Results
Pharmacological Characterization of the NT1–EGFP Receptor
Stable transfection of CHO cells with an expression vector containing the rat NT1–EGFP cDNA conferred to these cells the ability to bind 125I-labeled Tyr3-NT in a saturable and displaceable manner (Figure 1C). Scatchard analysis of the binding data (inset in Figure 1C) indicated that the radioligand interacted with a single class of binding sites with an apparent affinity (Kd) of 299 ± 50 pM and a high binding capacity (Bmax) of 342,700 ± 3500 sites/cell.
Effect of Neurotensin on Inositol Phosphate Production in NT1–EGFP Cells
Incubation of NT1–EGFP-transfected CHO cells with increasing concentrations of rat NT (10−-11–10−-6 M) resulted in a dose-dependent increase in IP formation in CHO NT1–EGFP cells (Figure 1D). The concentration of rat NT eliciting a half-maximal increase in total IP production (EC50) was 1.3 ± 0.5 nM. The maximal stimulation (626% over basal level) was observed at 30 nM. Frog NT also induced an increase in IP production with an EC50 similar to that of rat NT, whereas no stimulation was observed in non-transfected CHO cells (data not shown).
Internalization of the NT1–EGFP Receptor in the Presence of Rat and Frog Neurotensin
In the confocal microscope, cells incubated either with buffer alone or with buffer containing low concentrations (<0.1 nM) of rat or frog NT showed an intense concentration of NT1–EGFP fluorescence at the level of the plasma membrane (Figures 2A and 3a–3h). Incubation of NT1–EGFP-transfected cells with 1 nM–1 mM rat or frog NT resulted in a marked decrease of surface-associated fluorescent label and the appearance of many fluorescent intracytoplasmic vesicles, 0.6 μm in mean diameter (Figures 2B and 3i–3p). This change in labeling pattern was no longer apparent when the cells were subjected to acid wash at the end of the pulse period (Figure 2C), demonstrating that it was induced by the binding of NT to NT1–EGFP receptors during the pulse period. Dual labeling experiments using Fluo-NT as a ligand showed that the newly formed intracytoplasmic NT1–EGFP-containing vesicles (Figure 2D) also contained Fluo-NT (Figure 2E; merged image in Figure 2F), indicating that the observed vesiculization of NT1–EGFP was due to ligand-induced internalization of receptor–ligand complexes. Quantification of membrane/intracellular fluorescent ratios (M/I) indicated that this internalization was dose-dependent, with an EC50 = 0.98 nM (Figure 4C).
Internalization of NT1–EGFP Receptors Induced in the Presence of HPLC Fractions from Frog Brain Extracts
In a first set of experiments, 0.5-μl aliquots from each of 10 consecutive fractions were pooled (total number of fractions 120, yielding 12 pools of 10 fractions) and each pool was completed to 50 μl with Earle's buffer. Of these 12 pools, only the second one, containing fractions 11–20, promoted internalization of NT1–EGFP (data not shown). In a second set of experiments, fractions of Pool 2 and Pool 3 (used as negative controls) were tested individually (0.5 μl of each fraction completed to 50 μl with Earle's buffer). Of these, only fractions 15, 16, 17 and 18 promoted internalization of NT1–EGFP (Figure 5A). This internalization was not detected when the cells were subjected to an acid wash at the end of the pulse period (data not shown), indicating that the internalization was ligand-induced.
Stimulation of IP Production by HPLC Fractions From Frog Brain Extracts on NT1–EGFP Cells
In a first set of experiments, 5-μl aliquots from each fraction (total number of fractions 120) were pooled in pairs and completed to 50 μl with distilled water. Five microliters from each of these 60 pools was diluted in a final volume of 200 μl and checked for the capacity to stimulate IP production. Only Pools 8 and 9, containing fractions 15, 16 and 17, 18, respectively, induced an increase in IP production comparable to that observed with a maximal dose of rat or frog NT (10−-7 M) (data not shown). In a second set of experiments, 5 μl each of HPLC fractions 14–19 and 24–28 (used as negative controls) was checked individually. Only fractions 15, 16, 17, and 18 stimulated IP production (Figure 5B).
RIA Measurement of Neurotensin in HPLC Fractions From Frog Brain Extracts
Characterization of NT-like immunoreactivity contained in Sep-Pak-pre-purified frog brain extracts was carried out by combining HPLC analysis and RIA detection (Figure 5C). The immunoreactive material eluted from fractions 15–18, with a major peak detected in fraction 16. The amounts of NT-like immunoreactivity measured in the whole fractions 15, 16, 17, and 18 were 141 ng, 350 ng, 285 ng, and 118 ng, respectively.
Discussion
We describe here a novel single cell-based assay that should be applicable to the identification of endogenous ligands of orphan receptors. In contrast to currently used signal transduction-based screening methods, which monitor changes in the generation of second messengers (Meunier et al. 1995; Reinscheid et al. 1995; Cox et al. 1997; Hinuma et al. 1998; Sakurai et al. 1998; Ames et al. 1999; Saito et al. 1999), the present approach is based on the direct observation of ligand-induced internalization of fluorescently tagged receptors expressed in eukaryotic cells after incubation with prepurified tissue extracts. Ligand-induced internalization is a cellular phenomenon that is under-gone by the majority of GPCRs and which gives rise to an intracellular trafficking pattern that can be easily monitored by confocal microscopy. We demonstrate here the feasibility of harnessing this physiological process for ligand detection by showing that it can be successfully used for the recovery of neurotensin (NT), an endogenous ligand of the NT1 receptor, from reversed-phase HPLC fractions of frog brain extracts, a rich source of neuropeptides (Chartrel et al. 1998).
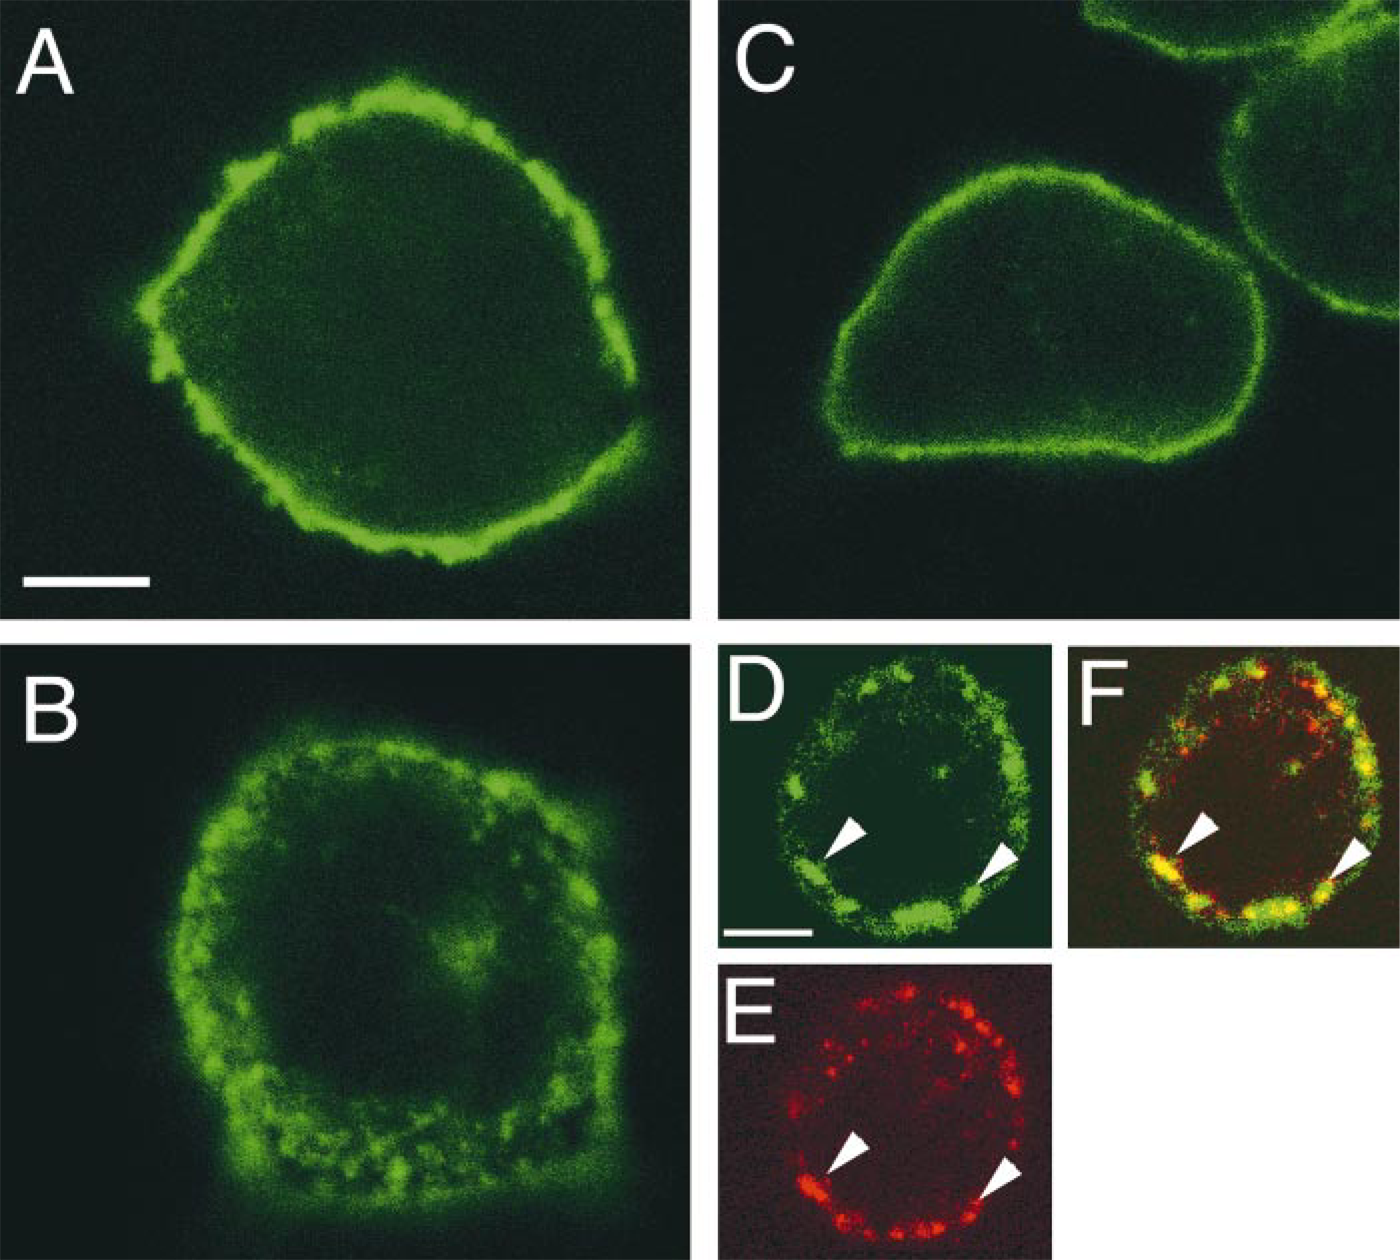
Confocal images of cycloheximide-treated CHO cells stably expressing the NT1–EGFP receptor. (
For this purpose, we established a stable CHO cell line expressing the NT1 receptor fused with EGFP. The pharmacological properties of this NT1–EGFP receptor were similar to those of the wild-type NT1 receptor. Accordingly, incubation of NT1–EGFP-expressing CHO cells or transiently transfected COS-7 cells (unpublished results) with exogenous NT resulted in a dose-dependent internalization of the tagged NT1 receptor. By confocal microscopy, this internalization was characterized by a progressive depletion of cell surface receptors and by the formation of small intracellular fluorescent clusters. This internalization pattern was similar to that previously observed in these as well as in other cell types that express the NT1 receptor (Chabry et al. 1995; Beaudet et al. 1998; Vandenbulcke et al. 1998) or other GPCRs (von Zastrow and Kobilka 1992; Ashworth et al. 1995; Grady et al. 1995; Roettger et al. 1995; Barak et al. 1997a,b). Double-labeling experiments using Fluo-NT as ligand showed that receptor and ligand were co-localized within the same intracytoplasmic organelles throughout the time frame studied (20–30 min), in keeping with earlier observations in other cell systems, which demonstrated that NT1 receptor internalization involved receptor–ligand complexes (Beaudet et al. 1998; Vandenbucke et al. 1998).
Four of the 120 frog brain fractions tested on NT1–EGFP-expressing CHO cells induced receptor internalization as monitored by confocal microscopy. The same four fractions, and only these four, were found to stimulate the production of IP in our heterologous transfection system. This finding confirmed that the internalization-promoting fractions were the only ones to contain an NT1-activating factor. Because NT was the endogenous ligand most likely to be present in these fractions, we tested individual fractions using a radioimmunoassay for frog NT and did indeed find the peptide to be present within each of the active ones. Although we cannot exclude the possibility that other peptides documented to act at the NT1 site, such as neuromedin N or xenopsin (Kitabgi et al. 1985), may also be present within the active fractions, the present data demonstrate that our internalization assay can be applied to the detection of minute quantities of a GPCR ligand in a biological sample potentially containing several hundreds of different peptides. By using successive HPLC purification and evaluation steps, it should therefore be possible to isolate a fraction that induces receptor internalization and contains a single peptide. Subsequent identification of this peptide could then be achieved by sequencing, as previously reported for the opioid-like ORL1 receptor (Meunier et al. 1995) and the APJ receptor (Tatemoto et al. 1998).

Confocal z-series of cycloheximide-treated CHO cells stably expressing the NT1–EGFP receptor, showing a non-stimulated cell (
The method devised here to quantitate the amount of ligand-induced internalized EGFP–NT1 receptor proved highly sensitive because it enabled us to detect nanomolar concentrations of ligand in the incubation medium. Given that the Kd for NT binding to the NT1 receptor is in the same concentration range, it appears that the affinity of the ligand for its receptor is the major determinant for the sensitivity of the proposed technique. Thus, in the present assay we detected femtomolar quantities of neurotensin from 0.5 μl of the initial HPLC fractions. Furthermore, because the observation of a single cell is theoretically sufficient for testing a single HPLC fraction from brain extracts, further miniaturization of the procedure should be possible to help economize precious starting material. To our knowledge, this method represents the first quantitative approach for assessing GPCR activation using such a minimal assay system as a single transfected cell.
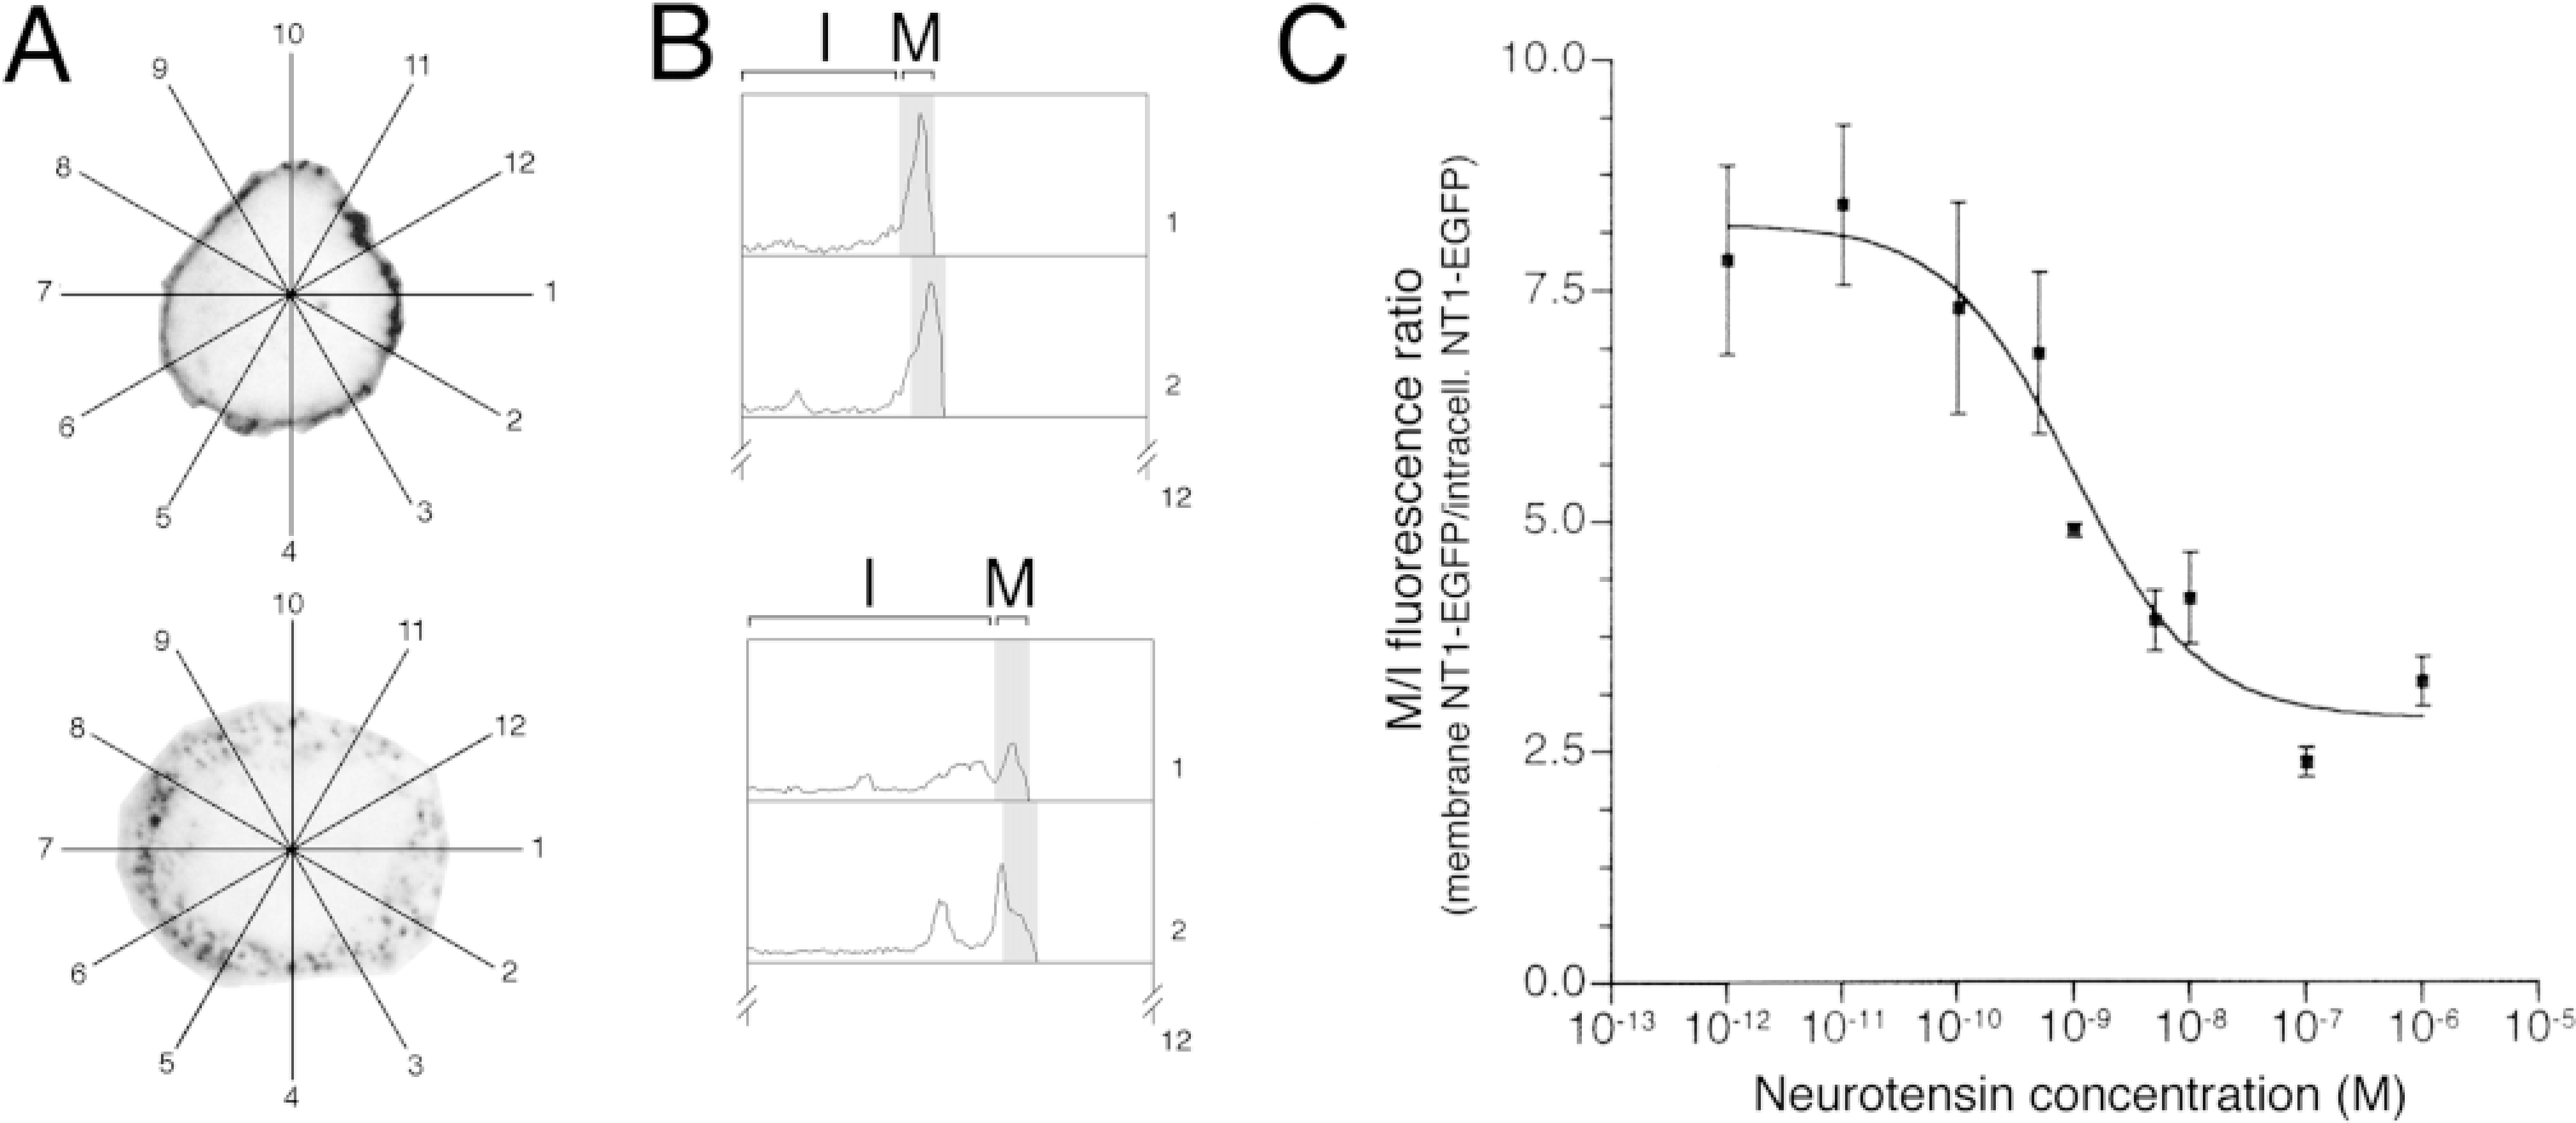
Quantitation of internalization, as described in Materials and Methods. (
The present method offers several advantages over the activation-based methods previously devised for the same purpose. First, it is completely independent of signaling mechanisms downstream of the receptor and therefore does not rely on a search for the appropriate transduction pathway, specific coupling of individual GPCRs being notoriously difficult to predict from their primary sequence. In addition, in the absence of knowledge of the effector molecules downstream of the orphan GPCR, transduction-based methods often require expression of the receptor in different cell lines before viable coupling can be established.
Second, internalization of G-protein-coupled receptors is triggered only by their specific ligands. This latter property is particularly important for the screening of biological samples such as brain extracts, which may contain several hundreds or thousands of different peptides. Therefore, simultaneously activated (and perhaps also internalized) but non-tagged endogenous receptors will remain invisible and will not interfere with the detection of tagged receptor internalization. By contrast, generation of second messengers in transduction-based assay systems, acidification of the extracellular milieu in the cytosensor microphysiometer system (McConnell et al. 1992), and mobilization of β-arrestins in the cell sensor system proposed by Barak et al. (1997a,b) may all be triggered by endogenous receptors. The elimination of the resulting falsepositive responses usually requires extra time and consumes valuable biological samples.
Third, ligand-induced internalization appears to be an almost universal property of GPCRs. Hence, the advantage of the present approach over systems based on downstream events is demonstrated such as the translocation of fluorescently tagged β-arrestin-2 after GPCR activation (Barak et al. 1997a,b). Indeed, several GPCRs, such as the angiotensin AT1 receptor (Hunyady 1999), the GnRH receptor (Vrecl et al. 1998), and several subtypes of muscarinic cholinergic receptors (Lee et al. 1998) were recently shown to internalize in an arrestin-independent fashion. Admittedly, a number of GPCRs may either undergo only limited ligand-induced internalization [e.g., the somatostatin type-1 (Roth et al. 1997) or the β3-adrenergic receptor (Liggett et al. 1993)] or internalize according to a pattern that can be less readily monitored than that of NT1 by confocal microscopy (e.g. the sst5 somatostatin receptor subtype; Stroh et al. 2000). Nevertheless, the internalization-based method described here should be useful to identify endogenous ligands for the vast majority of GPCRs.
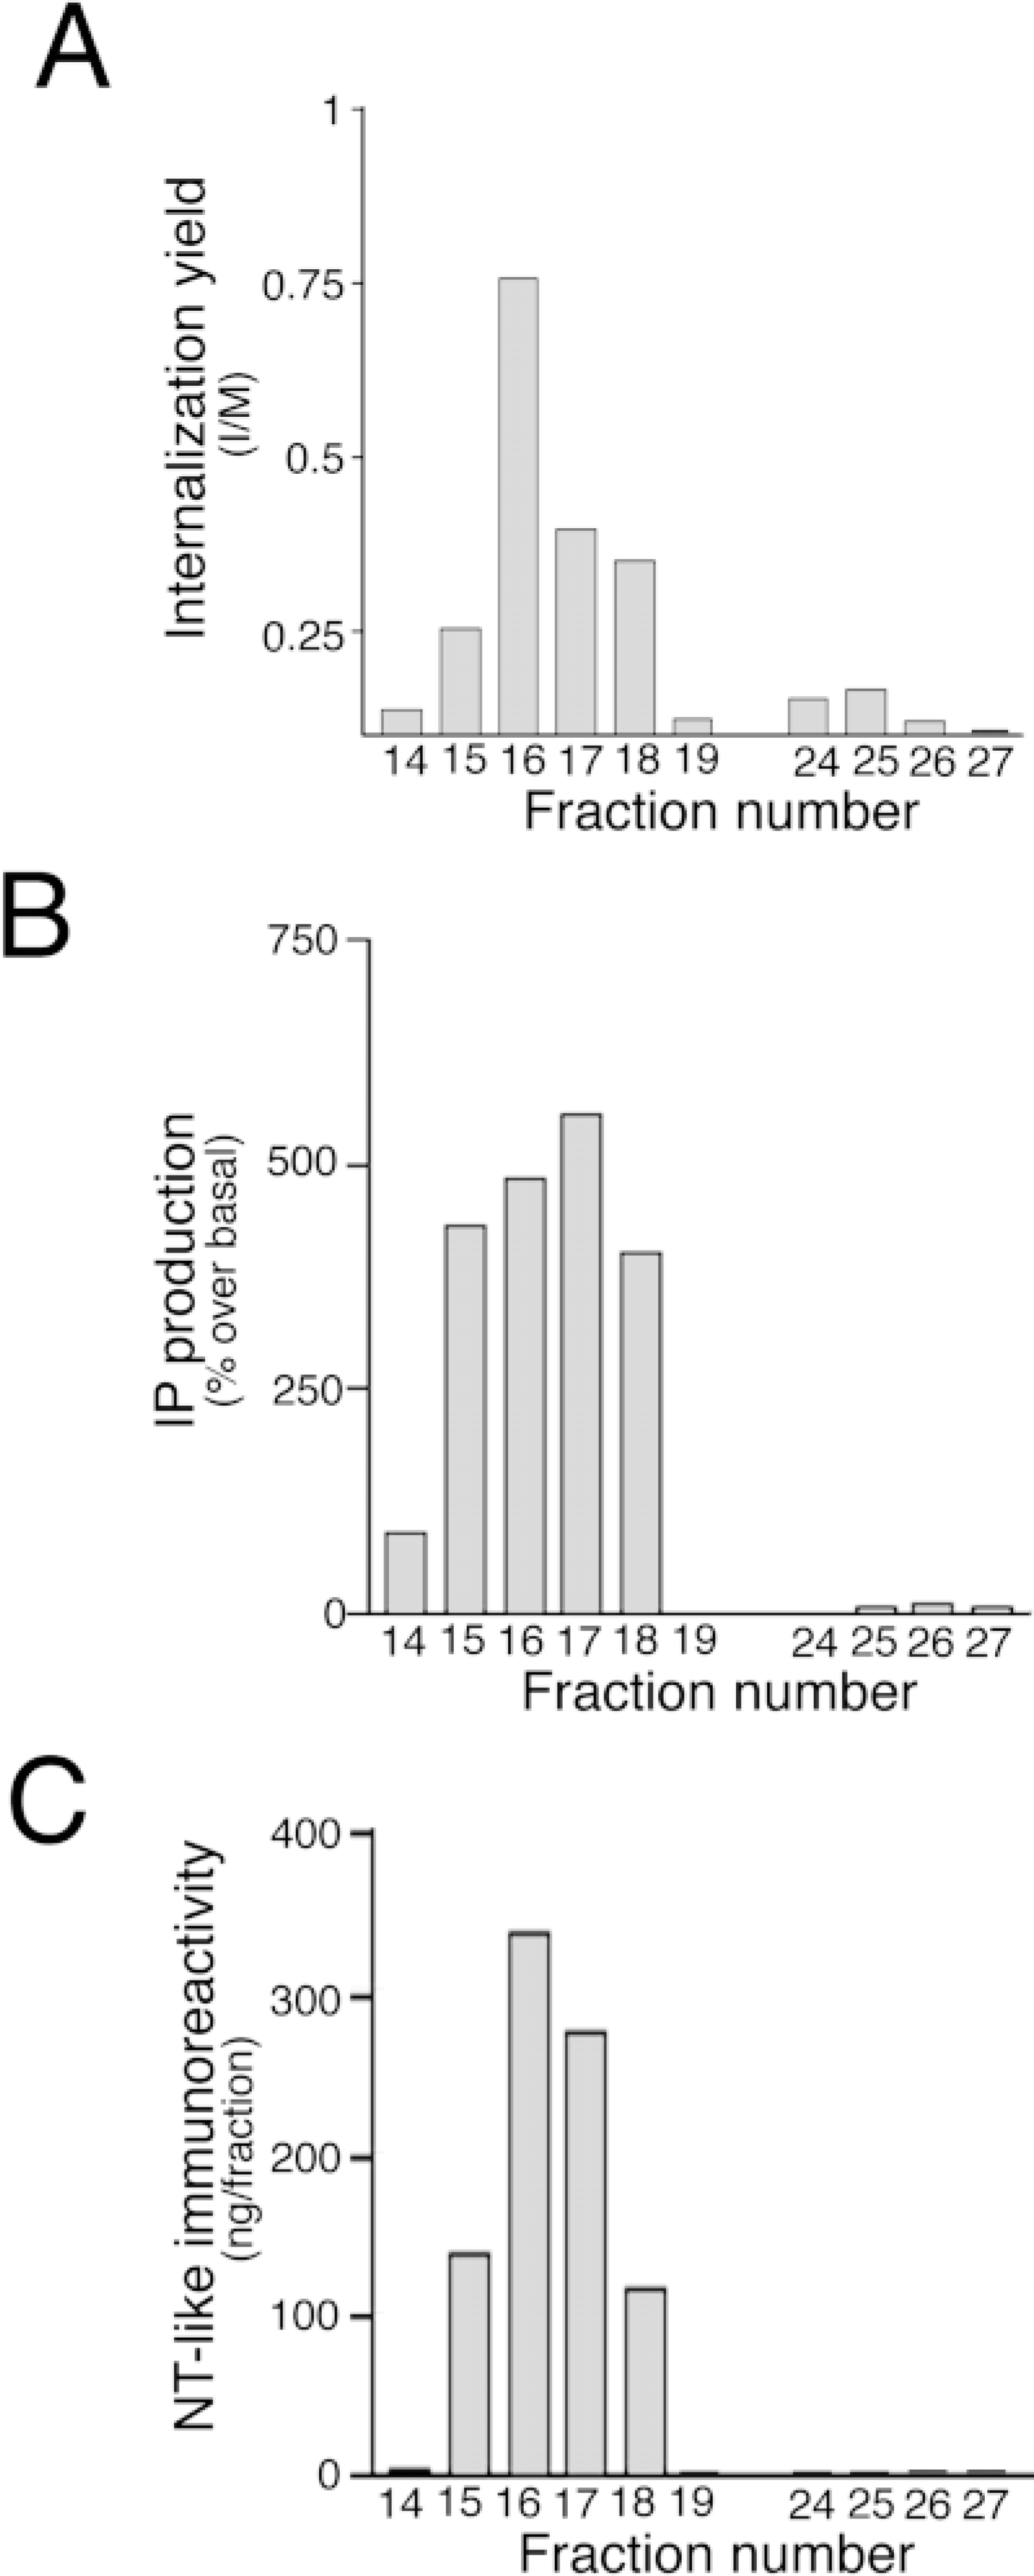
Internalization of the NT1–EGFP receptor (
Autofluorescent proteins are not the only molecular tags suited to visualize receptor internalization. For example, it is possible to engineer a receptor presenting an epitope that is detectable by subsequent immunohistochemistry. However, the direct fluorescent label of the orphan GPCR confers some additional advantages to the method. First, the success of cell transfection and the correct plasma membrane expression of the labeled orphan GPCR can easily be verified, because mutant versions of the green fluorescent protein (GFP) are easily detectable using standard fluorescence microscopic equipment. Second, establishment of stable cell lines is largely facilitated by the expression of a marker that is easily detectable in living cells (Lybarger et al. 1996), as shown in the present study in which it allowed rapid selection of highly expressing clone founder cells. Finally, a presently unexplored possibility of our technique is the simultaneous expression of several different GPCRs fused to different spectral variants of GFP in the same cell line, which would allow the simultaneous evaluation of the same fraction for the activation of different receptors.
In conclusion, the present internalization-based assay system offers a simple, selective, and highly sensitive quantifiable method for the detection of ligands acting on GPCRs. Therefore, this technique should allow reliable detection of an endogenous ligand for an orphan GPCR in a biological sample and consequently, by using successive purification and evaluation steps, should enable pure peptide to be obtained, which could be subsequently identified by sequencing. Other possible applications include screening of potential agonists and antagonists of GPCRs or detection of femtomolar quantities of known ligands dissolved in microvolumes of biological or non-biological solutions. This approach should not be limited to GPCRs, because a large group (Class II) of receptor tyrosine kinases, such as the epidermal growth factor (EGF) receptor, undergo similar ligand-induced internalization (Haigler et al. 1978), which is maintained after EGFP tagging (Carter and Sorkin 1998). The present method should therefore be also applicable to the identification of new polypeptide growth factors. In fact, it should be useful for the detection of any other bioactive molecules (e.g., toxins, lectins, serum transport proteins, antibodies, or even viruses) that induce internalization of specific cell membrane receptors.
Footnotes
Acknowledgements
Supported by grants from the Institut National de La Santé et de la Recherche Médicale (APEX no. 4×011E to C.L–C) and from the Conseil Regional de Haute Normandie to C.N., B.B., H.V., from the Medical research Council of Canada to A.B., and from the Ministère de l'Education du Quebec to Z.L.
We thank Mariette Houle for expert technical assistance and Charles Parnot for the help on Excel macros.