
Abstract
We developed a simple and rapid technique to synthesize single-stranded DNA (ssDNA) probes for fluorescent in situ hybridization (ISH) to human immunodeficiency virus 1 (HIV-1) RNA. The target HIV-1 regions were amplified by the polymerase chain reaction (PCR) and were simultaneously labeled with dUTP. This product served as template for an optimized asymmetric PCR (one-primer PCR) that incorporated digoxigenin (dig)-labeled dUTP. The input DNA was subsequently digested by uracil DNA glycosylase, leaving intact, single-stranded, digoxigenin-labeled DNA probe. A cocktail of ssDNA probes representing 55% of the HIV-1 genome was hybridized to HIV-1-infected 8E5 T-cells and uninfected H9 T-cells. For comparison, parallel hybridizations were done with a plasmid-derived RNA probe mix covering 85% of the genome and a PCR-derived RNA probe mix covering 63% of the genome. All three probe types produced bright signals, but the best signal-to-noise ratios and the highest sensitivities were obtained with the ssDNA probe. In addition, the ssDNA probe syntheses generated large amounts of probe (0.5 to 1 μg ssDNA probe per synthesis) and were easier to perform than the RNA probe syntheses. These results suggest that ssDNA probes may be preferable to RNA probes for fluorescent ISH.
H
In situ hybridization (ISH) is useful for determining the phenotypes of HIV-bearing cells and for visualizing the infection in the context of surrounding tissue. However, disadvantages of ISH include the limited amount of cells or tissue that can be tested and the limited sensitivity of the method. The type of probe and the detection system are primary determinants of ISH sensitivity. One of the best HIV-1 ISH methods employs fragmented plasmid-derived RNA probes (Hahn et al. 1984). Although denatured double-stranded DNA probes have also been used (Rigby et al. 1977; Celeda et al. 1992), better results were often achieved with RNA probes (Cox et al. 1984). Improved detection with RNA probes probably stems from their high specific activity, strong RNA/DNA hybrid stability, and the lack of complementary probe that can compete with the target. However, these probes have an intrinsic susceptibility to RNase-mediated degradation, which can be especially problematic in hybridization to tissues. PCR-derived probes have an advantage in that the probe length and sequence can be precisely defined, whereas long probes generated by subcloning must be hydrolyzed before use, which results in probes of variable length and affinity (Cone and Schlaepfer 1997).
The most sensitive HIV-1 ISH detection systems to date have usually involved radioactively labeled probes (De Jong et al. 1985; Haase et al. 1996). Enzymatically catalyzed colorimetric detection with nitroblue tetrazolium salt (NBT) has been used as an alternative to radioactive detection but is generally less sensitive (Straus 1982; Scopsi and Larsson 1986). A new signal amplification method, termed catalyzed reporter deposition (CARD), was introduced by Bobrow et al. (1989) to enhance the efficiency of biotin-avidin detection systems in solid-phase assays (Petrusz et al. 1980; Bobrow et al. 1991). This method has further been developed for ISH and immunocytochemistry techniques in which a 10- to 100-fold increase in staining efficiency was achieved, depending on the antibody used (Hunyady et al. 1996). CARD uses peroxidase to induce covalent binding of tyramide to neighboring aromatic rings. By labeling the tyramide molecules with haptens or fluorophores, a second step of detection can then be applied (Van Heusden et al. 1997).
We have developed a new method to generate single-stranded (ss) digoxigenin-labeled DNA probes with good yields and high specific activity. These probes were detected in situ using a peroxidase-anti-digoxigenin antibody followed by tyramide signal amplification to generate an exceptionally robust and sensitive fluorescent signal. This report describes the characterization of these methods using HIV-infected and uninfected cell lines.
Materials and Methods
Cell Preparation
The 8E5 cell line harbors one HIV-1LAI provirus per cell (Folks et al. 1986) and constitutively expresses virions independently of activation. The uninfected H9 T-cell line was used as negative control (Popovic et al. 1984). Cells were maintained in C-RPMI [RPMI 1640 (Life Technologies; Basel, Switzerland), 2 mM
Generation of Single-stranded (ss) DNA Probes
Stocks of dUTP-labeled PCR products were prepared by amplifying 20 ng of the pBH10 plasmid (AIDS Research and Reference Reagent Program; Rockville, MD) (Hahn et al. 1984) with 1 μM of primer pairs 1D through 7D (Table 1) in independent 100-μl PCR reactions (PCR Core Kit Plus; Boehringer Mannheim, Mannheim, Germany). Cycling conditions were five cycles at 96C for 30 sec, 45C for 1.5 min, 72C for 30 sec, followed by 30 cycles at 96C for 30 sec, 52C for 30 sec, 72C for 30 sec, and ending with 5 min at 72C. The seven resulting dUTP-labeled PCR products, representing 5085 bases of HIV-1 sequence (55% of the HIV-1 genome), were individually purified on columns (PCR Product Purification Kit; Boehringer Mannheim). DNA in the eluate was precipitated with 3 M Na-acetate and 0.7 volumes isopropanol and resuspended in 50 μl deionized water. The dUTP-labeled products were evaluated for size by gel electrophoresis and quantified by SYBR Gold (Molecular Probes; Leiden, The Netherlands) band intensity using computerized densitometry (Intelligent Quantifier; Biolmage, Ann Arbor, MI).
An aliquot (150 ng) of each dUTP-labeled product was then used in an asymmetric PCR optimized to produce single-stranded, digoxigenin-labeled antisense products. Amplification reactions (100 μl) contained 3 μM (1.8 times; 1014 molecules) of the lower primer, 1 times; PCR buffer with 2.5 mM Mg (Perkin Elmer; Norwalk, CT), 0.2 mM dATP/dCTP/dGTP (Pharmacia Biotech; Piscataway, NJ), 0.05 mM dig-11-dUTP (Boehringer Mannheim), 0.15 mM dTTP (Pharmacia; Uppsala, Sweden), and 2.5 U AmpliTaq polymerase (Perkin Elmer). The cycling conditions were 35 cycles at 96C for 30 sec, 55C for 30 sec, 72C for 1 min, ending with 5 min at 72C. The seven asymmetrically amplified products were then precipitated (0.1 volume of 3 M Na-acetate + 2.5 volumes ethanol) and resuspended in 20 μl deionized water. The PCR reaction products, which still contained the input dUTP-dsDNA, were digested with uracil-DNA glycosylase (0.7 U per 100 ng dUTP DNA) (New England BioLabs; Schwalbach, Germany), which cleaves dUTP but not dig-dUTP, according to the manufacturer's instructions. The reaction was stopped by incubation for 10 min at 95C and by adding 0.7 U uracil glycosylase inhibitor per 100 ng dUTP DNA (BioLabs). The resulting digoxigenin-labeled ssDNA probe (ssDNA) was purified with the QIAquick PCR purification kit (Qiagen; Hilden, Germany) and resuspended in TE buffer. The final product was controlled for size and purity by electrophoresis on 6% nondenaturing polyacrylamide gels or 2% agarose gels, in which each incorporated dig-11-dUTP retards migration as if it were two unlabeled nucleotides (Klein et al. 1995).
Generation of RNA Probes
Single-stranded, digoxigenin-labeled RNA probes (PCR-RNA) were generated using a two-step PCR amplification method followed by in vitro RNA transcription (Cone and Schlaepfer 1997). The first step amplified 22 products from the HIV-1 pBH10 plasmid using 5 times; 1013 molecules (83 pmoles) of primer pairs 1R through 22R (Table 1). The reactions (100 μl) included 20 ng (106 molecules) plasmid, 1 times; Dynazyme buffer (BioConcept; Allschwil, Switzerland), 2.5 U Dynazyme DNA polymerase, and 200 μM of each dNTP (Pharmacia Biotech). The cycling conditions were five cycles at 96C for 30 sec, 45C for 1.5 min, 72C for 30 sec, followed by 35 cycles at 96C for 30 sec, 50C for 30 sec, and 72C for 30 sec, ending with 72C for 5 min (T3 thermocycler; Biometra, Chatel St Denis, Switzerland). The PCR products were purified on a 3% Nusieve agarose gel (FMC Bioproducts; Rockland, ME), from which the specific bands were excised and the DNA dissolved in 1 ml prewarmed TE buffer. The second PCR used 1 μ l of the first reaction and incorporated a 30-base T7 universal recognition sequence, 5′TAAGCTTTAATACGACTCACTATAGGGAGA3′, using the upper primer and a T7 universal primer, respectively. The reaction mix and the cycling conditions were the same as described above. The products were then purified using the PCR Product Purification Kit (Boehringer Mannheim) and quantified by ethidium bromide fluorescence intensity in a 2% agarose gel. Two hundred ng of each of these PCR products served as template for RNA transcription using the AmpliScribe T7 Transcription Kit (Epicentre Technologies; Madison, WI) together with the DIG RNA labeling Mix (Boehringer Mannheim) according to the manufacturer's instructions.
PCR primers
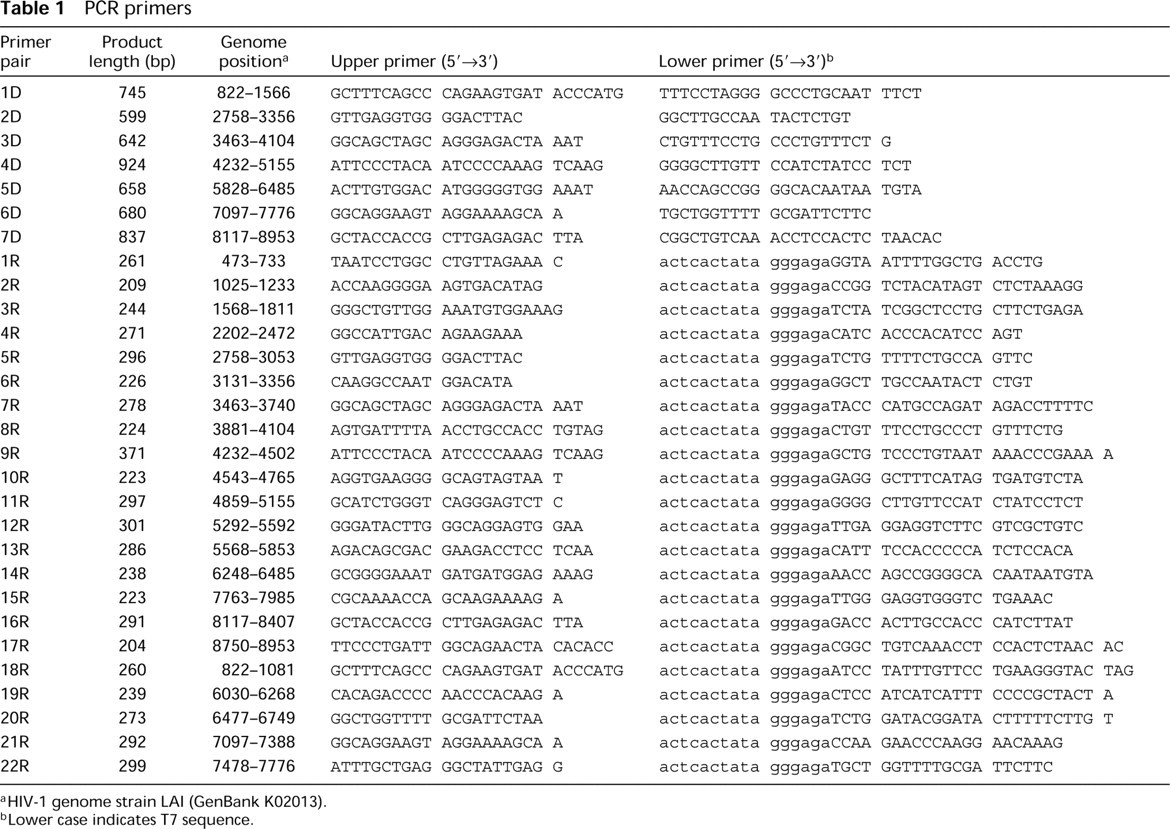
HIV-1 genome strain LAI (GenBank K02013
Lower case indicates T7 sequence.
The RNA products (20 μl) were next incubated with 2 U DNase I (Boehringer Mannheim), precipitated with 1/10 volume 4 M LiCl/3 volumes EtOH, and resuspended in DEPC water. To determine specific activity, purified RNA products were electrophoresed in a 1.5% agarose formaldehyde gel, transferred to a nylon membrane, and bound digoxigenin was detected using anti-digoxigenin alkaline phosphatase followed by NBT/BCIP precipitation (all Boehringer). The blots were digitally imaged and bands were quantified using image analysis software (Intelligent Quantifier).
Plasmid-derived RNA Probe
Digoxigenin-labeled RNA probes (Lofstrand Labs; Gaithersburg, MD) were synthesized by in vitro transcription of plasmids F (2.7 kb), H (1.4 kb), I (2.6 kb), and J (1.1 kb) and carbonate-sheared to 350 nts average length (Hahn et al. 1984). The final probe mix (plasmid-RNA), representing 7.8 kb (85%) of the HIV-1 genome, was prepared by mixing equimolar amounts of labeled RNA from each of the four plasmids. This plasmid-RNA probe mix has been used extensively in our laboratory for fluorescent ISH to HIV-1-infected cells and tissues (unpublished data).
In Situ Hybridization and Signal Amplification
Frozen slides with dried cells were thawed, fixed in 4% paraformaldehyde for 10 min, washed in PBS, and incubated for 10 min at 37C in 1 μg/ml proteinase K. Slides with H9 cells were used throughout as controls and were hybridized with the same procedures as used for the 8E5 cells. The cells were then washed and acetylated for 15 min using 0.1 M TEA with two additions of acetanhydride. The slides were then rinsed in PBS and 2 times; SSC, dehydrated in graded ethanols, and air-dried. Hybridization solution (20 μl final volume containing 4 times; SSC, 2 times; Denhardt's solution, 600 μg/ml herring testis DNA, 45% formamide, 1 U/μl RNasin, 5 mM DTT) including 1-200 ng probe mix was applied to each half of a slide, coverslipped, and incubated overnight at 50C. After hybridization, the slides were washed for 5 min at 45C in 2 times; SSC with 45% formamide, 15 min at 45C in 2 times; SSC, and 10 min at room temperature (RT) in 2 times; SSC. Nonspecifically bound RNA probes were digested with RNase (12 mg/ml for 30 min) and the slides were washed in 2 times; SSC again for 5 min at 37C, 10 min at 45C, and 5 min at RT. Endogenous peroxidases were inactivated using PBS containing 3% H2O2 for 10 min before rinsing the slides in TNT (150 mM Tris, 150 mM NaCl, 0.05% Tween-20, pH 7.5).
To detect the digoxigenin-labeled probes, slides were first blocked for 30 min in TNB [150 mM Tris, 150 mM NaCl, 0.5% blocking reagent (NEN Life Science; Boston, MA)] and an anti-digoxigenin-peroxidase antibody (Boehringer Mannheim) diluted 1:250 in TNB was then applied for 30 min. Amplification of the signal was achieved using the TSA-direct Cyanine 3 FISH kit (NEN), whereby the signal was developed by an incubation of 1:50 Cy3 tyramide in amplification buffer for 30 min. The cells were finally counterstained with 0.5 μM DAPI (Sigma; Buchs, Switzerland), washed, dehydrated, and mounted using ProLong Antifade kit (Molecular Probes).
Quantitation of Fluorescent ISH
Fluorescence was detected using a DM/RXA microscope (Leica; Wetzlar, Germany) fitted with a black-and-white cooled CCD digital camera (Micromax RTE/CCD 1317-K1; Princeton Instruments, Trenton, NJ) connected to an Intel 586-based desktop computer running MetaMorph Image Analysis software (version 3.5; Universal Imaging, West Chester, PA) in a Windows 95 environment. Using a Plan Fluotar 40X/0.7 objective (Leica), each microscopic field was imaged twice, applying a different filter set each time, to independently detect Cy3 and DAPI (filter sets HQ 41007a and TR-1, respectively; Chroma, Brattleboro, VT). The DAPI staining was used to visualize nuclei. The dark current (between-cell) fluorescence was subtracted from the respective images before a mask was generated from the Cy3 fluorescence. The creation of a mask permitted the measurement of individual cells and defined the fluorescent intensity of the signal in each cell, which is expressed as gray value units (GV) in the image analysis software. Because the signals on H9 cells were very low, the exposure time to generate an image was increased from 100 msec, used for 8E5 cells, to 1 sec. For comparisons among images, GVs from 1-sec exposures were divided by 10 to derive equivalent 100 msec GVs. This correction was empirically validated in separate experiments. All images were similarly scaled so that intensities among different images could be directly compared.
Statistics
The capacity of each probe to differentiate between true positive and negative values was evaluated. Using mean and standard deviation of GVs of uninfected H9 cells, we calculated for each time point the probability (cumulative density of the normal distribution) of the lowest measured GV value of infected 8E5 cells to be falsely classified as negative.
Results
ssDNA Probe Synthesis
In efforts to improve the ISH method, we tested whether ssDNA probes would result in increased sensitivity as compared to PCR-amplified, T7-transcribed RNA probes (PCR-RNA). For this, we generated digoxigenin-labeled single-stranded RNA (PCR-RNA) and digoxigenin-labeled ssDNA probes (Figure 1). The mix of 22 PCR-RNA probes covered 63% of the HIV-1 genome and had an average length of 294 nts (range 204-301 nts) (Table 1). Seven ssDNA probes averaging 725 nts in length (range 641-923 nts) and covering 55% of the genome were also synthesized (Table 1). Each synthesis resulted in 0.5-1 μg purified ssDNA probe. To ensure that the generated products were truly single stranded and of the expected size, double-stranded as well as single-stranded products were analyzed by gel electrophoresis (Figure 2). The purified ssDNA probes migrated more slowly than predicted by size alone because of digoxigenin incorporation. Similar results were obtained using 6% non-denaturing polyacrylamide gels followed by membrane transfer and digoxigenin detection.
Maximal yields and purity of the probes were achieved by optimizing the purification steps. To prevent incorporation of dUTP and digestion of the ssDNA probes by uracil-DNA glycosylase, dUTP from the first amplification had to be eliminated before the second asymmetric PCR. The dUTP-labeled products were therefore purified through a DNA purification column followed by NaAc/isopropanol precipitation. Two purification columns (Boehringer Mannheim and Qiagen) were evaluated for yields and purity of the product. In preliminary experiments, shorter ssDNA probes of 200-300 nts were synthesized but neither purification column produced adequate or reproducible ssDNA recovery (not shown). By increasing the size of the probes to 641-923 nts, ssDNA yields increased to 80-90% for both columns. The second purification step, the NaAc/isopropanol precipitation, was chosen because isopropanol preferentially precipitates longer DNA pieces. We anticipated that unwanted dUTP would thereby be eliminated. NaAc/isopropanol precipitation resulted in 50-75% recovery, depending on the size of the ssDNA pieces, and the final product was free of primers, as documented by gel electrophoresis. After asymmetric PCR amplification, it was necessary to precipitate the DNA to change buffer for the enzymatic digestion with uracil-DNA glycosylase. To this end, the most efficient precipitation method was chosen (NaAc/ethanol). The DNA recovery of this method reaches almost 100%. However, it also precipitates primers and other short DNA pieces. After digestion, the digoxigenin-labeled ssDNA probes were separated from primers and digested DNA pieces using the QIAquick PCR purification kit, resulting in high yields of purified ssDNA probes.
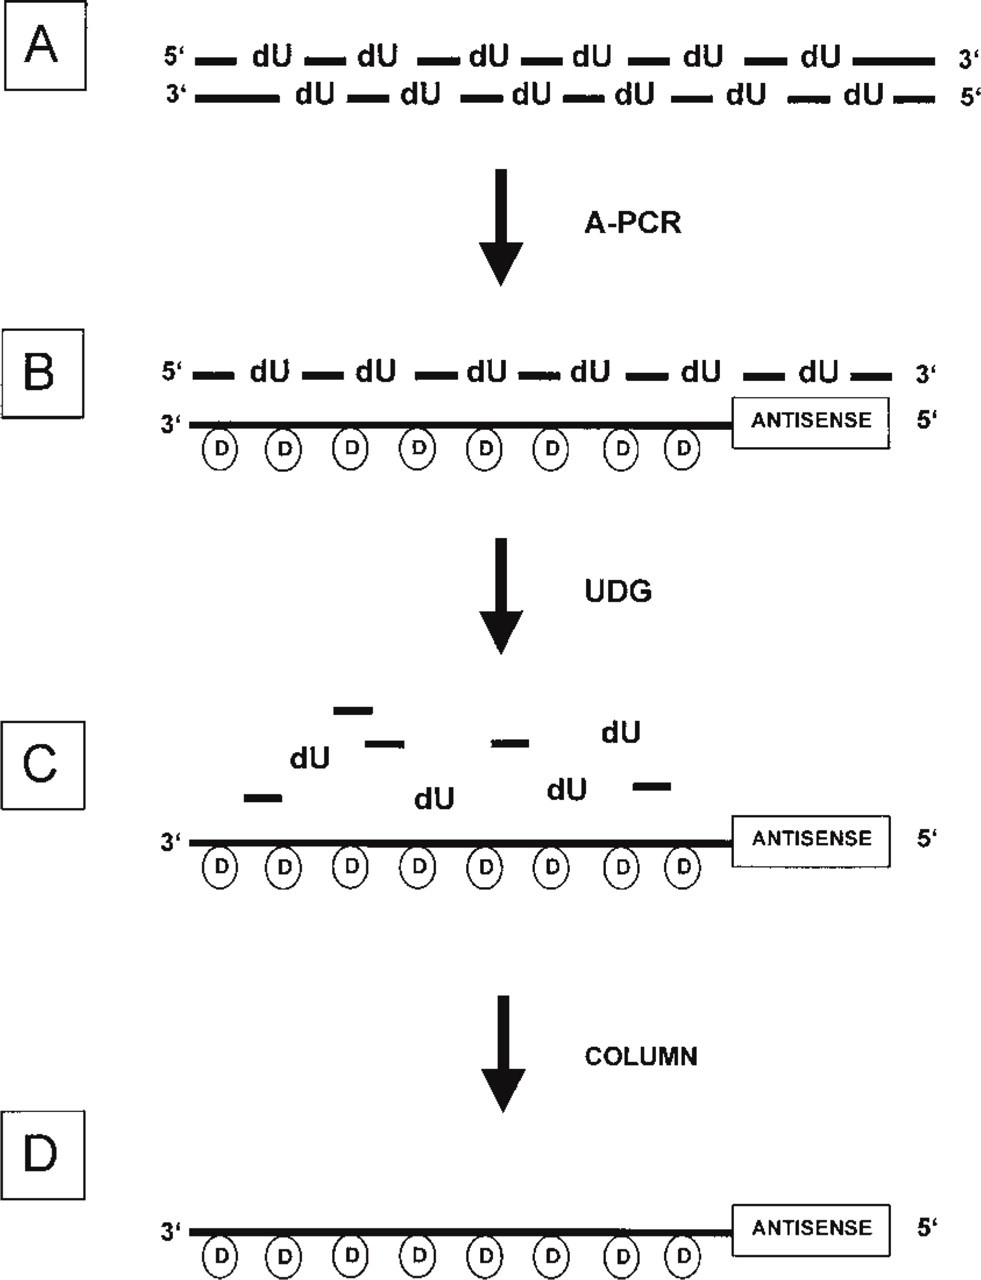
Flow chart of probe synthesis. PCR-generated, column-purified, and precipitated dU-containing dsDNA (
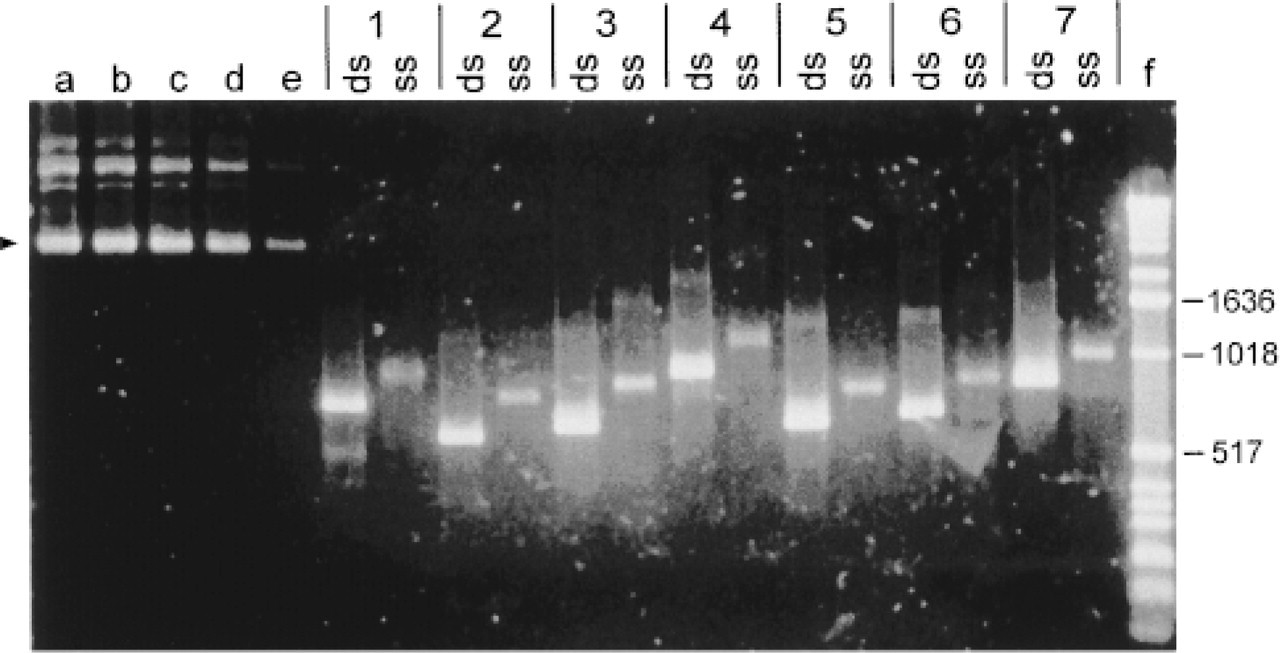
Analysis of amplification products from first (dUTP incorporation) and second (asymmetric digoxigenin incorporation) probe synthesis PCRs (SYBR Gold-stained 2% agarose gel). Lanes a-e, concentration standards (arrowhead) with 300, 150, 100, 50, and 10 ng/lane pUC19, respectively; Lanes 1-7, first synthesis (ds) and second synthesis (ss) PCR products amplified with primer pairs 1D-7D (Table 1), respectively; Lane f, 1-kb dsDNA ladder. Relevant markers labeled with length in bp.
Hybridization Characteristics of ssRNA and ssDNA Probes
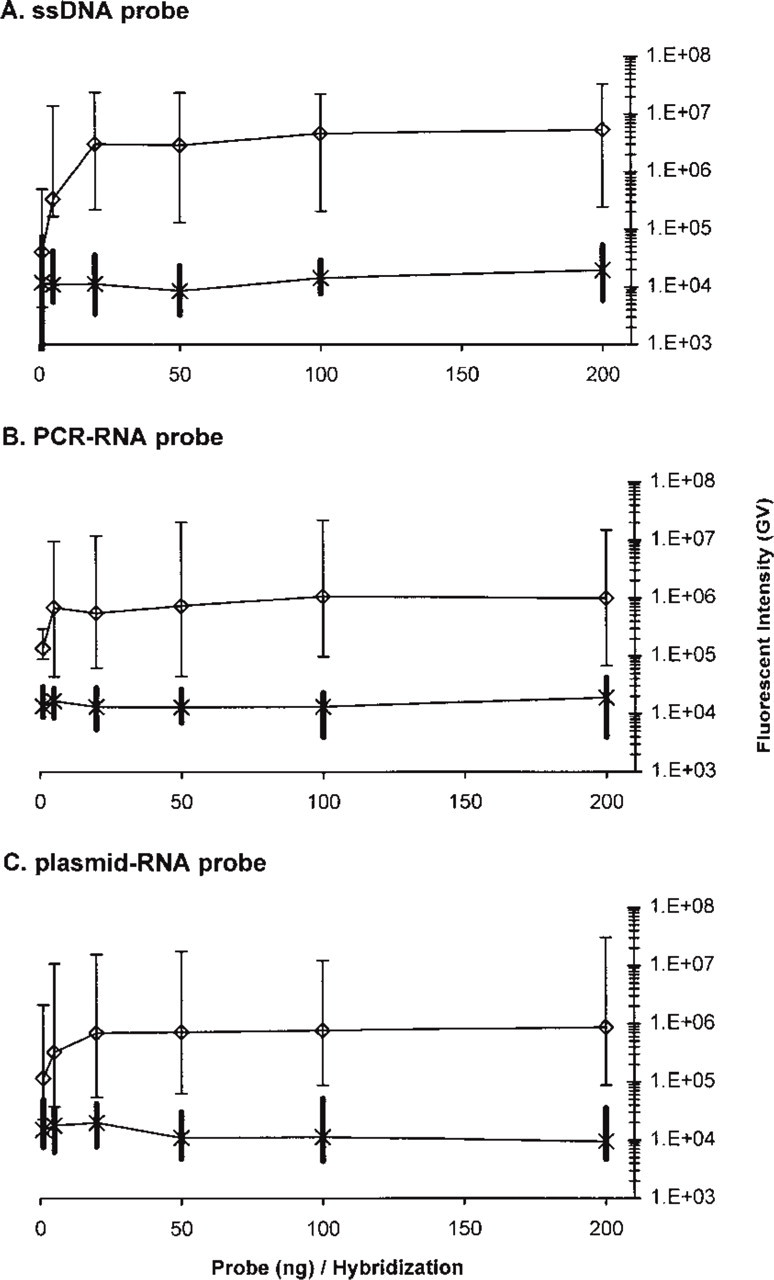
The 8E5 cell line, which constitutively expresses HIV-1, and the uninfected H9 cells were used to test ISH with the digoxigenin-labeled ssDNA, PCR-RNA, and plasmid-RNA probes (Figures 3–5). Each probe was tested at concentrations of 1, 5, 20, 50, 100, and 200 ng per hybridization. Hybridized probes were visualized using Cy3 TSA amplification and imaged in two colors; DAPI and Cy3. An average of 200 representative cells (range 160-253) from each hybridization was analyzed using image analysis software.
The fluorescent intensity (gray value units, GV) differences among the probe mixes were evident when hybridized 8E5 and H9 cells were viewed. A representative example of hybridization of these cells with 100 ng of probe mix is shown in Figure 3. Infected cells hybridized with ssDNA were frequently filled with strong Cy3 fluorescence (Figures 3A and 3B), whereas the RNA probe mixes typically produced smaller areas of Cy3 positivity (Figures 3D, 3E, 3G, and 3H). Furthermore, the ssDNA probe produced higher fluorescent intensities than either RNA probe (compare Figure 3B with Figures 3E and 3H). The uninfected H9 cell controls showed low levels of nonspecific Cy3 fluorescence that could be differentiated from the stronger, true-positive signals by visual examination and by digital image analysis (Figures 3C, 3F, and 3I).
Titrations of the probe mixes revealed that all three probe types reached maximal signal intensities with ≥20 ng probe per hybridization (Figure 4). At very low concentrations, such as 5 ng/hybridization, the ssDNA probe did not differentiate infected from uninfected cells as effectively as the PCR-RNA and plasmid-RNA probes. However, when 20 ng or more probe was used, no overlaps between 8E5 GV/cell and H9 GV/cell were observed for any of the probe types in these experiments. The ssDNA probe produced brighter signals overall. The 8E5 GV/cell medians with 20 ng probe were 3.03 times; 106 (ssDNA), 5.48 times; 105 (PCR-RNA), and 6.92 times; 105 (plasmid-RNA). The sensitivity of the probes was also demonstrated by analyzing digital images to define the percentage of 8E5 cells with measurable HIV-1 RNA by ISH. Starting with 20 ng, all of the probes recognized 100% of the 8E5 cells as being HIV-1-positive (Figure 4). Nonspecific fluorescence from hybridized H9 cells was less dependent on probe concentration, ranging from 8565 to 19,850 median GV/cell across all probe concentrations and probe types (Figure 4).
Differentiation of negative from weakly positive cells was substantially more robust with the ssDNA probe. This is indicated by the separation between the minimal true-positive 8E5 cell intensity and the maximal true-negative H9 cell intensity, as shown in Figure 4. The power of distinguishing true-negative from true-positive cells was quantified by calculating the probability that the lowest intensity true-positive cell is a member of the set of true-negative intensity values for each probe type and probe concentration (Figure 5). None of the probe types effectively separated low-positive 8E5 cells from the normal distribution of true-negative H9 cells when only 1 ng probe/hybridization was used (p>0.09 for all three probe types). However, with 20 ng/hybridization or more, the ssDNA probe was three to four orders of magnitude more effective at minimizing the probability of overlap between the lowest positive and true-negative cell intensities (Figure 5).
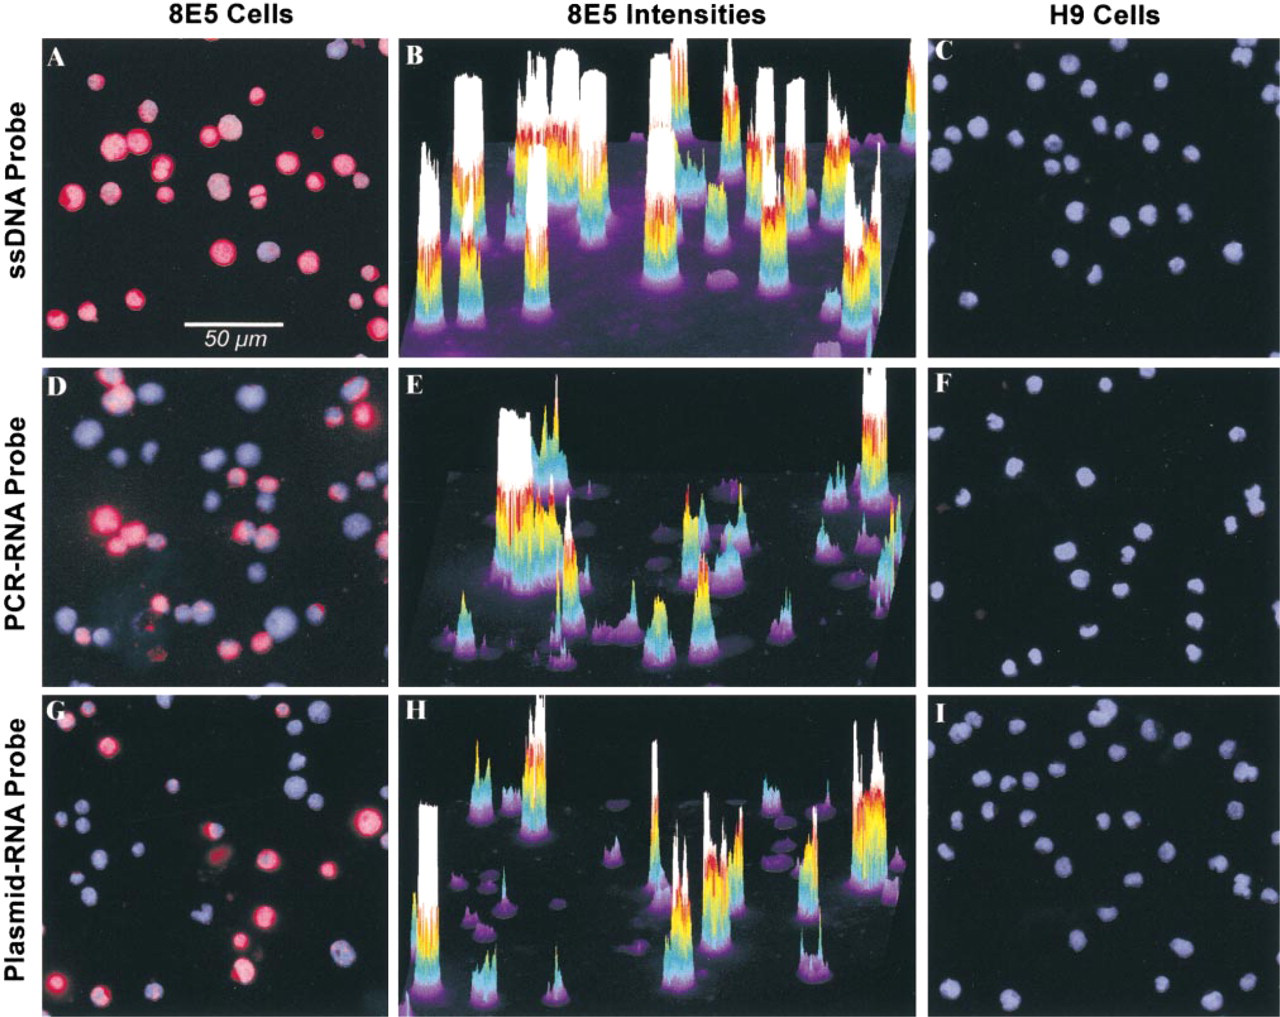
Digital images of fluorescence after hybridization with 100 ng ssDNA (top row;
Discussion
This report describes a novel, convenient method for generating single-stranded, digoxigenin-labeled DNA probes. This method is easy to perform, reproducible, and generates up to 1 μg ssDNA per amplification. ISH with ssDNA probes resulted in strong fluorescent intensities and excellent discrimination between infected and uninfected cells. These ssDNA probes demonstrated better sensitivity and specificity than equivalent RNA probes derived from plasmids or PCR products at probe concentrations >20 ng/hybridization.
Previous reports of ssDNA probes demonstrated a trend for these probes to be more sensitive than denatured dsDNA probes (An et al. 1992; Hannon et al. 1993). Hannon et al. (1993) developed ssDNA probes using lambda exonuclease digestion. This method resulted in relatively small yields of ssDNA, and remaining dsDNA concentrations correlated with the degree of primer phosphorylation (Michel et al. 1997). Several studies have employed single-stranded, internally labeled DNA probes synthesized by reverse transcription of RNA (Romano et al. 1989) or by primer extension techniques (Akam 1983; Berger 1986). Although these probes are very sensitive, the technical complexity of producing them by these methods has limited their application.
Hybridization of ssDNA (
The method reported here for synthesis of digoxigenin-labeled ssDNA is, to our knowledge, the only one that eliminates any double-stranded input DNA, resulting in a high purity of ssDNA probes. Although we have used these probes only for ISH, they may also be useful for other techniques involving hybrid detection. Major advantages of this ssDNA synthesis method include streamlined laboratory methods, high yields of up to 1 μg per synthesis, generation of well-defined probes without subcloning, and relatively low cost per hybridization. In addition, the ssDNA synthesis protocol ensures relatively high purity and specific activity, which may contribute to the improved performance of these probes.
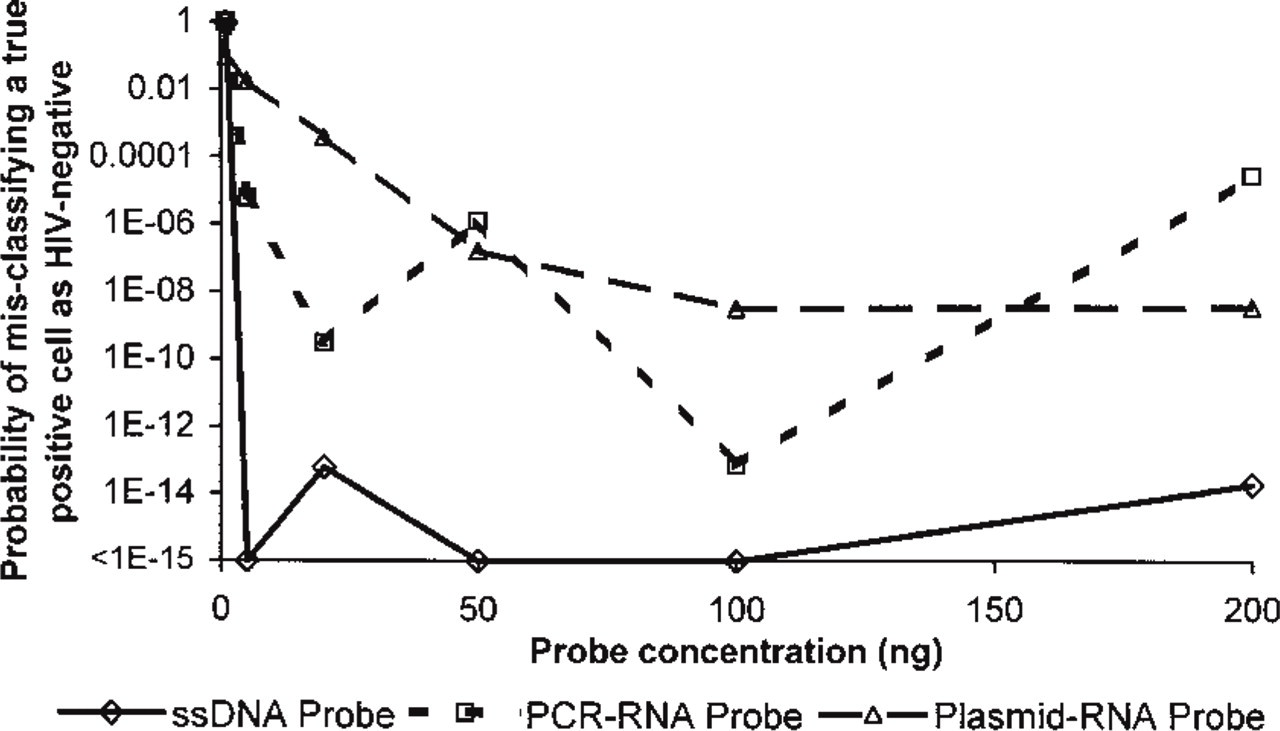
Probability (vertical axis) that an infected 8E5 cell could be misclassified by ISH as an uninfected cell for the three probe types (ssDNA, diamonds, heavy dashed line; PCR-RNA, squares, solid line; plasmid RNA, triangles, light dashed line) at six probe concentrations (1, 5, 20, 50, 100, and 200 ng, horizontal axis). Probabilities reflect the likelihood that, for each probe type and concentration, the 8E5 cell with the lowest fluorescent intensity falls within the normal distribution of the negative (H9) fluorescent intensities. The lowest probability value (<1 times; 10-15) corresponds to the best separation between true-negative and true-positive cells, and the highest value (1.0) represents no significant difference between the negative values and the lowest positive value.
Long ssDNA probes offer theoretical and practical advantages compared with probes composed of dsDNA, ssRNA, or oligonucleotides. The efficacy of denatured double-stranded probes suffers from hybrid competition between the complementary probe strand and the target, which is eliminated with single-stranded probes (An et al. 1992). This principle was experimentally reaffirmed in our laboratory, showing dramatic signal increases with ssDNA probes compared with equivalent double-stranded probes (not shown). Furthermore, RNA probes can be problematic because of susceptibility to RNases, whereas DNA probes are relatively stable in most in vitro environments. This point may be especially important during hybridization to frozen tissue sections, which are likely to have substantial RNase activity.
A possible explanation for better performance of the ssDNA probe mix could relate to probe length, because the average length of the ssDNA probes (725 nts) was greater than the PCR-RNA (294 nts) and plasmid-RNA (350 nts) probes. We therefore compared 24 ssDNA probes with a mean length of 286 nts covering 66% of the HIV-1 genome with our seven ssDNA probe mix and hybridized 8E5 and H9 cells, respectively. These probes generated results similar to those achieved with seven long ssDNA probes covering 55% of the genome, and no differences in dynamics or hybridization level were observed (not shown). Similar observations have been made previously, comparing probes between 151 nts and 749 nts (An et al. 1992). In these experiments, the longer probes also resulted in better signals than shorter ones. However, the accumulation of these 749 nts probes with shorter probes did not result in increased signals.
All three probe types tested were capable of separating all true-positive 8E5 cells from all true-negative H9 cells when at least 20 ng probe/hybridization was used. However, the ssDNA probe produced larger separations between negative and positive cells, effectively reducing the chance of misclassifying low-positive cells as HIV-negative. Because 8E5 cell cultures include individual cells with very low and very high HIV-1 RNA expression (unpublished data), weakly positive 8E5 cells represent low-level expression, a condition that might be encountered in vivo. We previously reported that radioactively-labeled, PCR-derived RNA probes covering 20% of the HIV-1 genome produced brighter signals and less background than plasmid-derived RNA probes covering 34% of the genome (Cone and Schlaepfer 1997). The PCR-RNA and plasmid-derived probes reported here were improved, covering 63% and 85% of the viral genome, respectively. These fluorescent ISH studies support the previous observation that PCR-RNA probes perform better than randomly sheared plasmid-RNA probes. In addition, the newly developed ssDNA probe mix outperformed both of the other types. Although radioactively labeled probes are generally recognized as providing the most sensitive ISH detection of mRNA (Dallman et al. 1991), recently developed fluorescent signal amplification systems for hapten-labeled nucleic acid probes now make nonradioactive methods viable alternatives for ultrasensitive ISH (Hunyady et al. 1996; Van Heusden et al. 1997). In our hands, the fluorescent system for probe detection was more sensitive than was observed in previous experiments with radioactively labeled probes. In conclusion, we have demonstrated that this method for generating ssDNA probes is highly efficient and leads to increased sensitivity compared to RNA probes or plasmid-derived probes. This technique allows the design and production of custom-made ssDNA probes for multiple target sequences and can therefore be used to detect subsets of mRNA.
Footnotes
Acknowledgments
Supported by grants from the Swiss National Science Foundation (32-43654) and the EMDO Stiftung Zurich.