
Abstract
The turnover of the epithelium of the gastrointestinal tract is regulated by a balance between cell multiplication and cell loss. We examined the effects of starvation on apoptosis in endocrine and other epithelial cells of rat antropyloric mucosa. Apoptosis was determined by the TUNEL reaction combined with immunocytochemical staining for gastrin and somatostatin. Apoptotic cell morphology was determined by bisbenzimide staining for DNA. Both gastrin and somatostatin cells showed a significantly lower apoptotic index than the general epithelium. This agrees with the longer turnover kinetics of gastric endocrine cells. On starvation, the apoptotic index of the general epithelium and of the gastrin but not of the somatostatin, cells increased significantly. This was prevented by the nitric oxide synthase (NOS) inhibitor L-NAME but not by its inactive stereoisomer D-NAME. Immunoreactive neuronal NOS was present in somatostatin cells, in nonendocrine cells predominating in the surface and pit epithelium, and in rare nerve fibers. Endothelial cell NOS was present in vessels, whereas the inducible isoform was barely detectable. Thus, endogenous NOS isoforms participate in regulating antropyloric epithelial apoptosis during starvation. The close paracrine relation between somatostatin cells and gastrin cells suggests that the former regulates apoptosis of the latter through release of NO.
T
In this study we developed a method for studying the apoptotic index in immunocytochemically identified endocrine cells, assessed the apoptotic index of endocrine gastrin and somatostatin cells and of the general epithelium in freely fed and starved rats, studied the distribution and expression of different NOS isoforms in antropyloric mucosa, and investigated the role of NO formation in apoptosis of gastrin and somatostatin cells and of the general epithelium.
Materials and Methods
Tissue Material
Groups of six adult female Wistar rats each (body weight 200 g) were fasted for 18 hr in wire-bottomed cages and were then left untreated or given either L- or D-NAME (1.125 mg/kg) (Sigma; St Louis, MO) by gavage, and were decapitated 3 hr later. A fourth group of six female rats were freely fed. Preliminary experiments established that administration of L-NAME by gavage to freely fed rats produced unacceptably large variations in results that were ascribed to the widely variable amounts of food remaining in the stomachs of freely fed rats. The rats were fasted overnight because earlier studies have established that this period of fasting results in significant decreases in gastrin cell numbers (Larsson 1978; Larsson and Hougaard 1993a,b) while being compatible with the local regulations for animal welfare. The antropyloric region of the stomach was quickly cut open and fixed in 10% formalin (Merck; Darmstadt, Germany) in 0.1 M sodium phosphate buffer, pH 7.4, and routinely embedded in paraffin. For immunocytochemistry, six additional rats were sacrificed, stomachs fixed in 4% paraformaldehyde and paraffin-embedded, or prepared for cryostat sectioning (Larsson 1988). For RT-PCR, antropyloric mucosa was scraped off, frozen in liquid nitrogen, and stored at −80C.
Immunocytochemistry
Three-μm paraformaldehyde-fixed paraffin sections were microwaved (Polar Patent PP-780; Axlab, Copenhagen, Denmark) three times for 5 min at 780 W in 10 mM citrate buffer, pH 6.0. Cryostat sections were hydrated in Tris-buffered saline (TBS). All sections were reacted overnight with rabbit antisera to synthetic human gastrin I and synthetic somatostatin-14 (Dako; Glostrup, Denmark) or to synthetic peptides derived from the middle [728-743] region (Chemicon International; Temecula, CA) or C-terminal [1411-1433] region of the human nNOS sequence (Research & Diagnostic Antibodies; Berkeley, CA). The two regions of nNOS are highly conserved. Therefore, the human nNOS [728-743] region is identical to the [724-739] region of rat nNOS and the human [1411-1433] region differs from the rat [1407-1429] region by only a single amino acid substitution (Ala/Thr) (Bredt et al. 1991; Nakane et al. 1993). In addition, guinea pig antiserum to synthetic human gastrin I (Milab, Malmö, Sweden), as well as monoclonal mouse antibodies to somatostatin (NovoClone; Bagsværd, Denmark) and to biosynthetic fragments of mouse iNOS (region [961-1144]), human ecNOS (region [1030-1209]), and human nNOS (region [1095-1289]) (Transduction Labs; Lexington, KY) were used. The site of antigen-antibody reaction was revealed either with indirect immunofluorescence using fluorescein isothiocyanate (FITC)-conjugated goat anti-mouse IgG Fab fragments (Jackson Immunoresearch Labs; West Grove, PA) or 7-amino-4-methyl-coumarine-3-acetic acid (AMCA)-conjugated goat anti-guinea pig IgG, or with biotin-labeled goat anti-rabbit IgG (Dako) followed by Texas red-conjugated streptavidin (Vector Labs; Burlingame, Ca), or by alkaline phosphatase-conjugated streptavidin (Dako). Alkaline phosphatase activity was revealed by development in bromochloroindolyl phosphate-nitroblue tetrazolium (BCIP-NBT) medium fortified with 1 mM levamisole (Larsson and Hougaard 1993a,b). Controls included conventional staining controls (Larsson 1988) as well as absorptions of the antisera with synthetic gastrin I, synthetic somatostatin (Peninsula Labs; Merseyside, UK), the synthetic nNOS peptides, or with 1.6 mg/ml poly-L-lysine (Mr 3700; Sigma) (Scopsi et al. 1986; Larsson 1988). Monoclonal antibodies were substituted with type-matched control antibodies. For double and triple stainings, combinations of primary antibodies from different species with different fluorochrome-conjugated species-specific secondary antibodies were used.
Detection and Quantitation of Apoptosis In Situ
Terminal deoxynucleotidyl transferase (TdT)-mediated dUTP-digoxigenin nick end-labeling (TUNEL) was performed essentially as described (Gavrieli et al. 1992). Sections were washed in distilled water three times for 5 min, digested in 20 μg/ml proteinase K (Sigma) in 0.1 M Tris-HCl buffer with 0.05 M EDTA, pH 8.0, for 30 min at room temperature (RT), and postfixed in 4% paraformaldehyde for 5 min. To inactivate endogenous nucleases, the proteinase K solution was fortified with EDTA and autodigested for 30 min before use. Terminal deoxynucleotidyl transferase (TdT) buffer (0.2 M sodium cacodylate, 2.5 mM cobalt chloride, 0.1 mM dithiothreitol, pH 6.6), containing 200 U/ml TdT (Boehringer-Mannheim; Mannheim, Germany) and 1 mM digoxigenin-dUTP (Boehringer-Mannheim) were applied for 30 min at 37C. The reaction was stopped with 0.3 M sodium chloride, 0.03 M sodium citrate for 5 min at RT, followed by washing in PBS. Endogenous intestinal alkaline phosphatase activity was blocked by immersion in 0.2 M HCl for 30 min at RT (Kiyama and Emson 1991). The sections were then incubated with AP-conjugated sheep anti-digoxigenin Fab fragments (Boehringer-Mannheim) and developed in BCIP-NBT medium as above. Negative controls were obtained by omitting TdT or digoxigenin-dUTP. Additional sections were instead reacted with FITC-labeled sheep anti-digoxigenin Fab fragment (Boehringer-Mannheim) and were subsequently stained for gastrin or somatostatin immunofluorescence using Texas red-labeled anti-rabbit or anti-mouse Ig for detection, and finally exposed to 0.5 μg/ml bisbenzimide (Hoechst 33258; Sigma) for 5 min.
For quantitations, alkaline phosphatase-stained TUNEL sections were immunocytochemically stained with rabbit anti-gastrin or rabbit anti-somatostatin antisera, followed by peroxidase-labeled swine anti-rabbit Ig (Dako) and development in 3-amino-9-ethylcarbazole-H2O2 medium (Graham et al. 1965). The apoptotic index (AI) was determined by counting the percentage of TUNEL-positive gastrin, somatostatin, and general epithelial cells at X400 magnification. More than 10,000 gastrin cells, 5000 somatostatin, and 18,000 general epithelial cells were counted per rat. The results were expressed as the mean percent apoptotic cells ± standard deviation (apoptotic index ± SD) and evaluated by the Mann-Whitney U-test.
Reverse Transcriptase Polymerase Chain Reaction (RT-PCR)
Oligonucleotide primers were synthesized on an Applied Biosystems 392 DNA/RNA synthesizer (Applied BioSystems; Foster City, CA). A sense (5' -CCGGAATTCGAATACCAGCCTGATCCATGGAA) and antisense (5 '-GCCGGATCCTCCAGGAGGGTGTCCACCGCATG) primer set was used to detect nNOS mRNA. Total RNA was isolated from scraped antropyloric mucosa by the TRizol reagent (Life Technologies; Grand Island, NY). Reverse transcription was carried out using the GeneAmp RNA PCR kit (Perkin-Elmer; Roche Molecular Systems, Branchburg, NJ). The cDNA obtained was amplified using optimized buffers containing 1.5 mM MgCl2. All reactions used 2.5 U/100 μl AmpliTaq DNA polymerase. PCR was carried out with the GeneAmp PCR System 2400 (Perkin-Elmer) using 40 cycles (94C for 45 sec, 59C for 60 sec, and 72C for 90 sec). Controls were made by omitting template cDNA and by amplifying rat β-actin using primers placed in different exons of the gene. With genomic DNA, the amplicon size using this primer set would be 713 bp instead of the 503 bp generated from cDNA. In addition, reverse transcriptase was deleted in some experiments. Amplicon size was checked by 2% agarose gel electrophoresis.
Results
Distribution and Quantitation of Apoptotic Cells
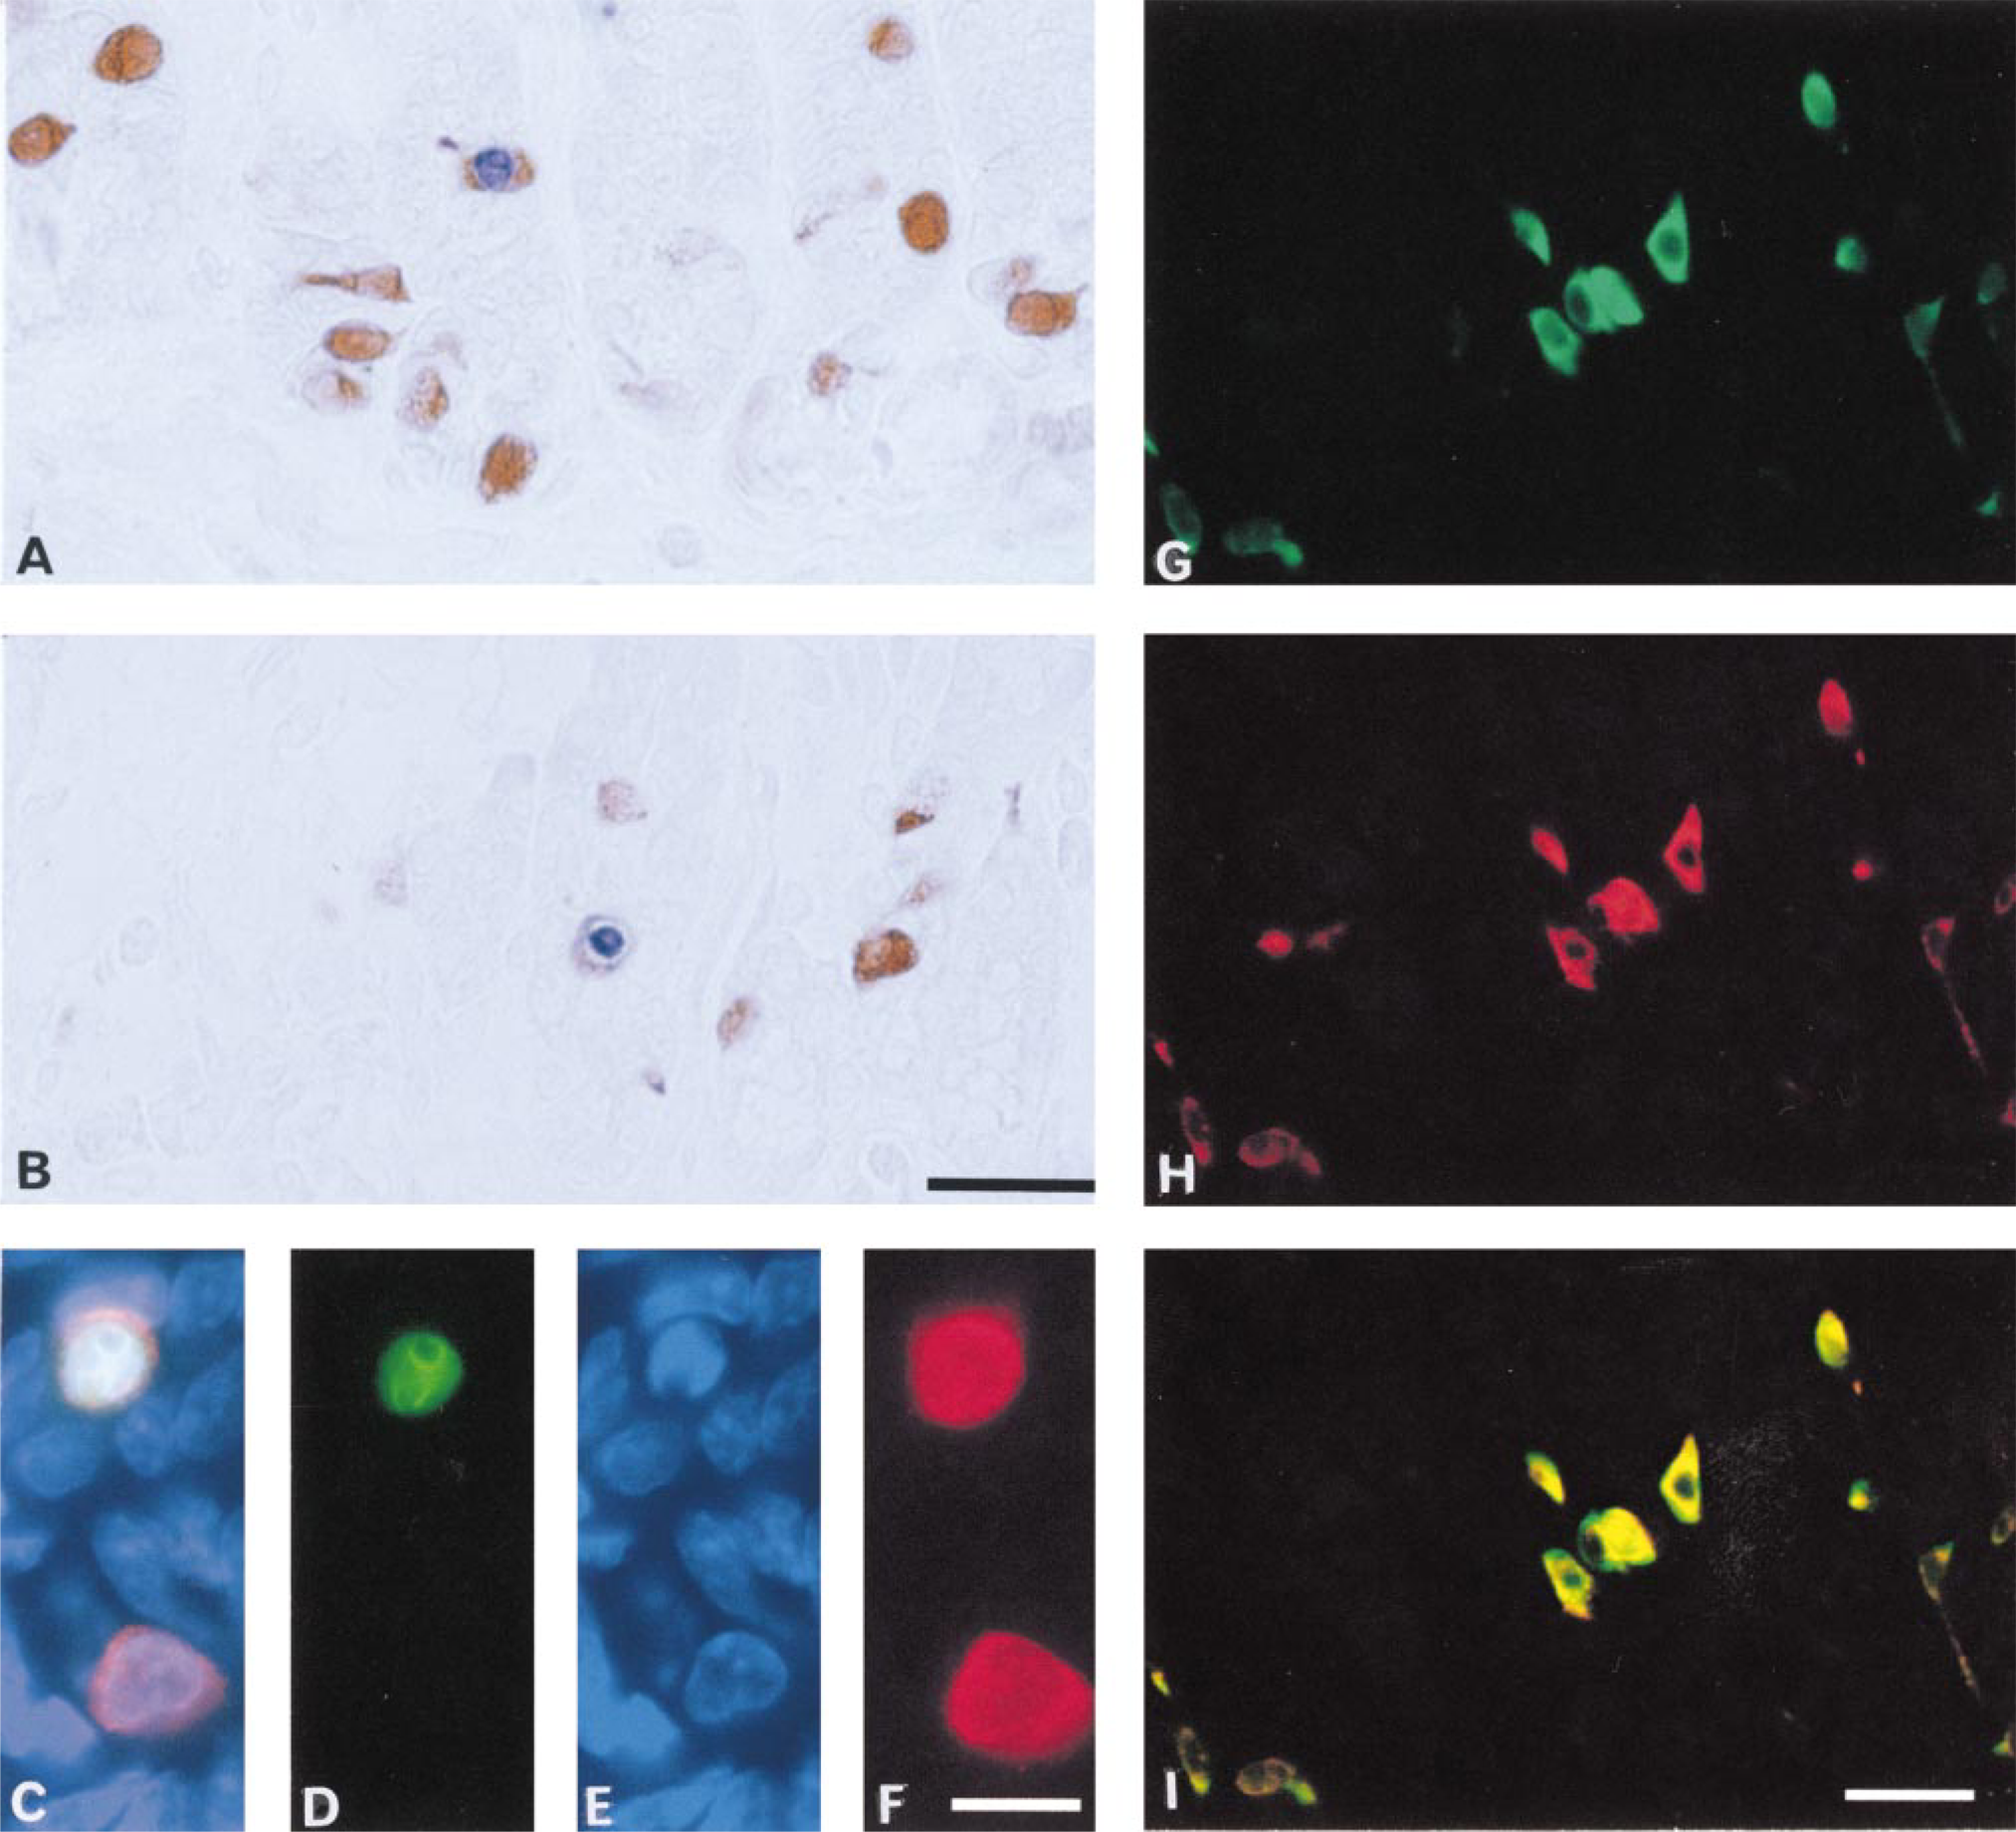
By the TUNEL method, apoptotic cells were detected in the surface epithelium, the pits, and the glands. In freely fed rats, 0.35 ± 0.02% (n = 6) of all epithelial cells were apoptotic (Figure 1). The frequencies of apoptotic G- and D-cells were determined by first reacting sections using the TUNEL method, and then restaining them for gastrin and somatostatin, respectively (Figure 2). Apoptotic G- and D-cells predominated in the bottom half of the glands. In freely fed rats, 0.23 ± 0.06% (n = 6) of all G-cells and 0.13 ± 0.05% (n = 6) of all D-cells were apoptotic. This difference was significant (p = 0.02). In addition, the AI of the general epithelium (0.35 ± 0.02%) was significantly higher than that of the G- (p<0.01) and the D-cells (p<0.01) (Figure 1). After fasting for 18 hr, the AI of G-cells increased to 0.34 ± 0.06% (n = 6) (p<0.02 compared to freely fed animals) and the AI of the general epithelium increased to 0.61 ± 0.08% (n = 6) (p<0.02 compared to freely fed animals). The AI of the D-cells did not change significantly on fasting [0.16 ± 0.06 (n = 6); p=0.4].
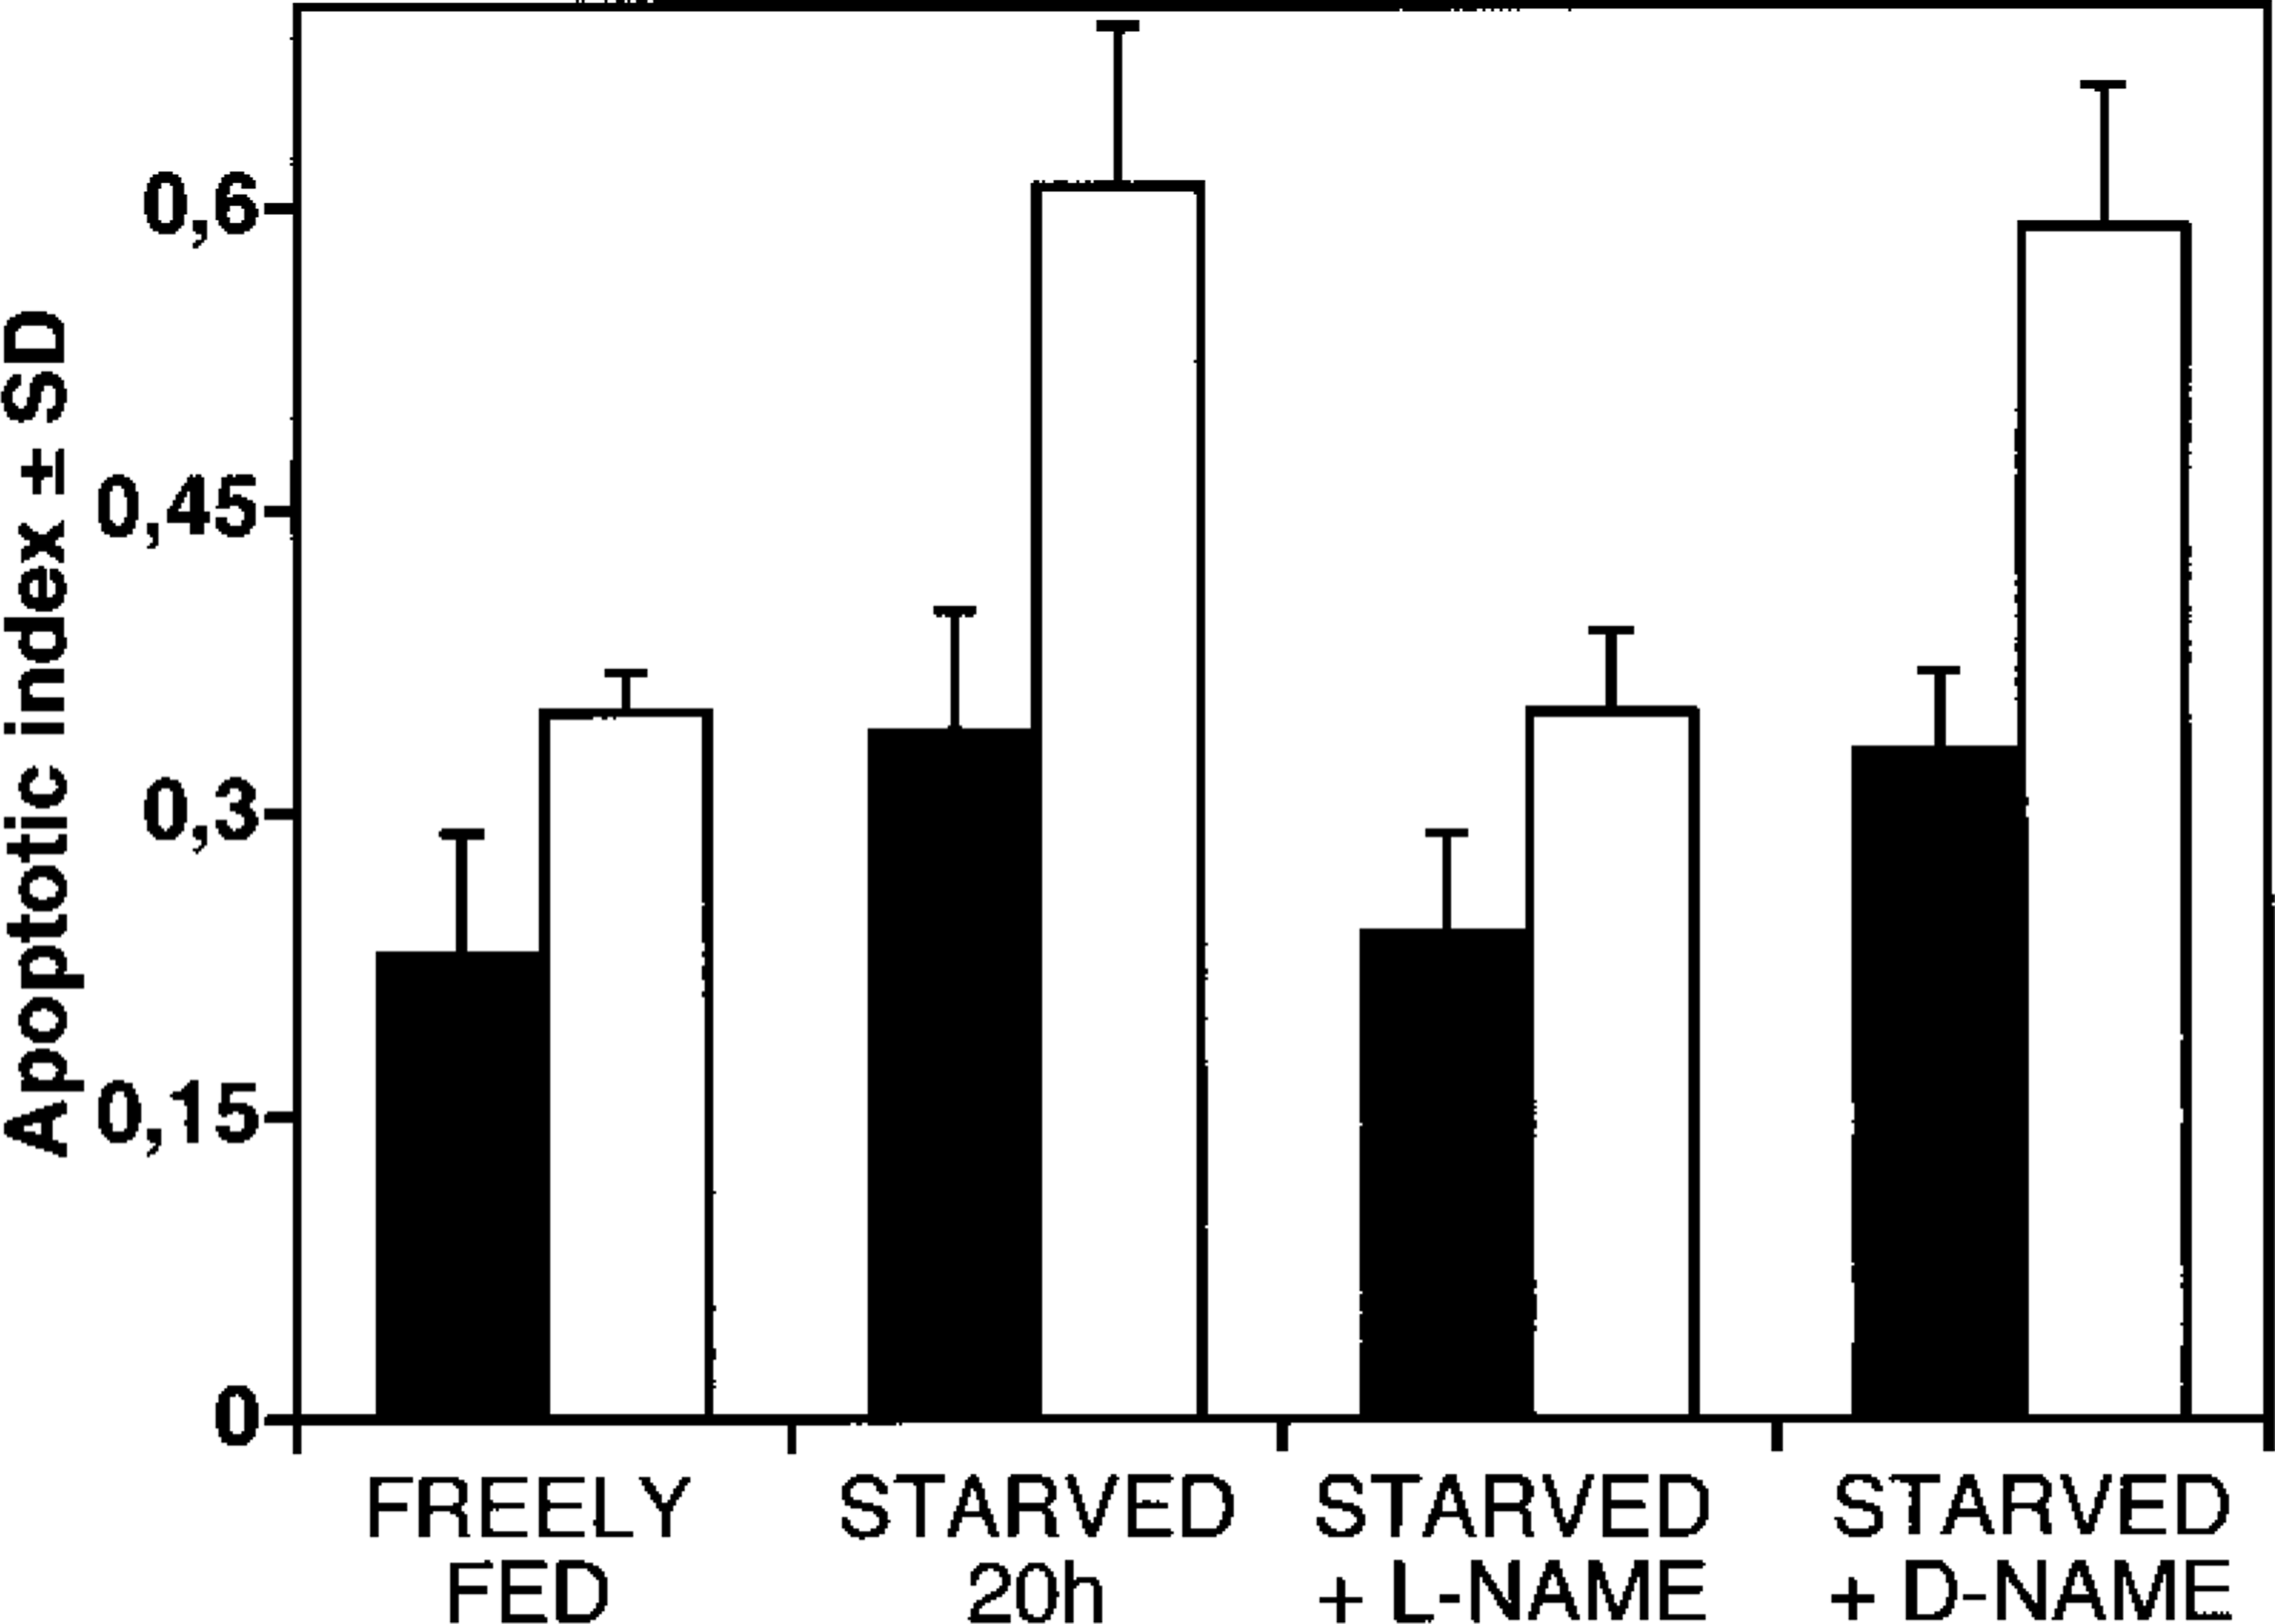
Changes in apoptotic index (± SD) between G-cells (filled columns) and general epithelial cells (open columns) in groups (n = 6) of freely fed, starved, starved + L-NAME, and starved + D-NAME-treated rats. Note that the general epithelial cells show a significantly higher apoptotic index than the G-cells (p<0.01 in freely fed rats) and that the starvation-induced increase in apoptosis of both cell types (p<0.02) is reversed by L-NAME (general epithelium p<0.01; G-cells p<0.02) but not by D-NAME treatment. None of the treatments produced significant changes in the apoptotic index of D-cells (not shown).
Controls and Validation of the TUNEL Method in Rat Antropyloric Mucosa
Omission of either TdT or digoxigenin-dUTP from the TUNEL reaction produced no staining. To correlate the morphology of the cells to TUNEL positivity, some sections were first stained by the TUNEL method (using immunofluorescent detection) and then restained for DNA using bisbenzimide. Such sections revealed that all TUNEL-positive cells of the rat antropyloric mucosa also displayed the typical morphology of apoptotic cells. This morphology included early stages displaying condensed chromatin and later stages displaying fragmentation of condensed chromatin and eventual formation of apoptotic bodies. By triple staining we could confirm that this also applied to endocrine cells (Figure 2).
Effects of Inhibition of NOS Activity on Antropyloric Apoptosis
Female rats fasted for 18 hr received either L-NAME or its inactive stereoisomer D-NAME by gavage and were sacrificed 3 hr later. Comparisons between apoptotic indices of untreated, fasted rats (n = 6) with D-NAME-treated, fasted rats (n = 6) showed no differences with respect to general epithelium (0.61 ± 0.08 vs 0.59 ± 0.07; p=0.6), G-cells (0.34 ± 0.06 vs 0.33 ± 0.04; p=0.9), or D-cells (0.16 ± 0.06 vs 0.13 ± 0.05; p=0.4) (Figure 1). In contrast, L-NAME treatment (n = 6) significantly reduced the AI of the general epithelium (0.35 ± 0.04; p<0.01) and of the G-cells (0.24 ± 0.05; p<0.02) while having no effect on the AI of the D-cells (0.13 ± 0.05; p=0.9).
(
Distribution of NOS-positive Cells
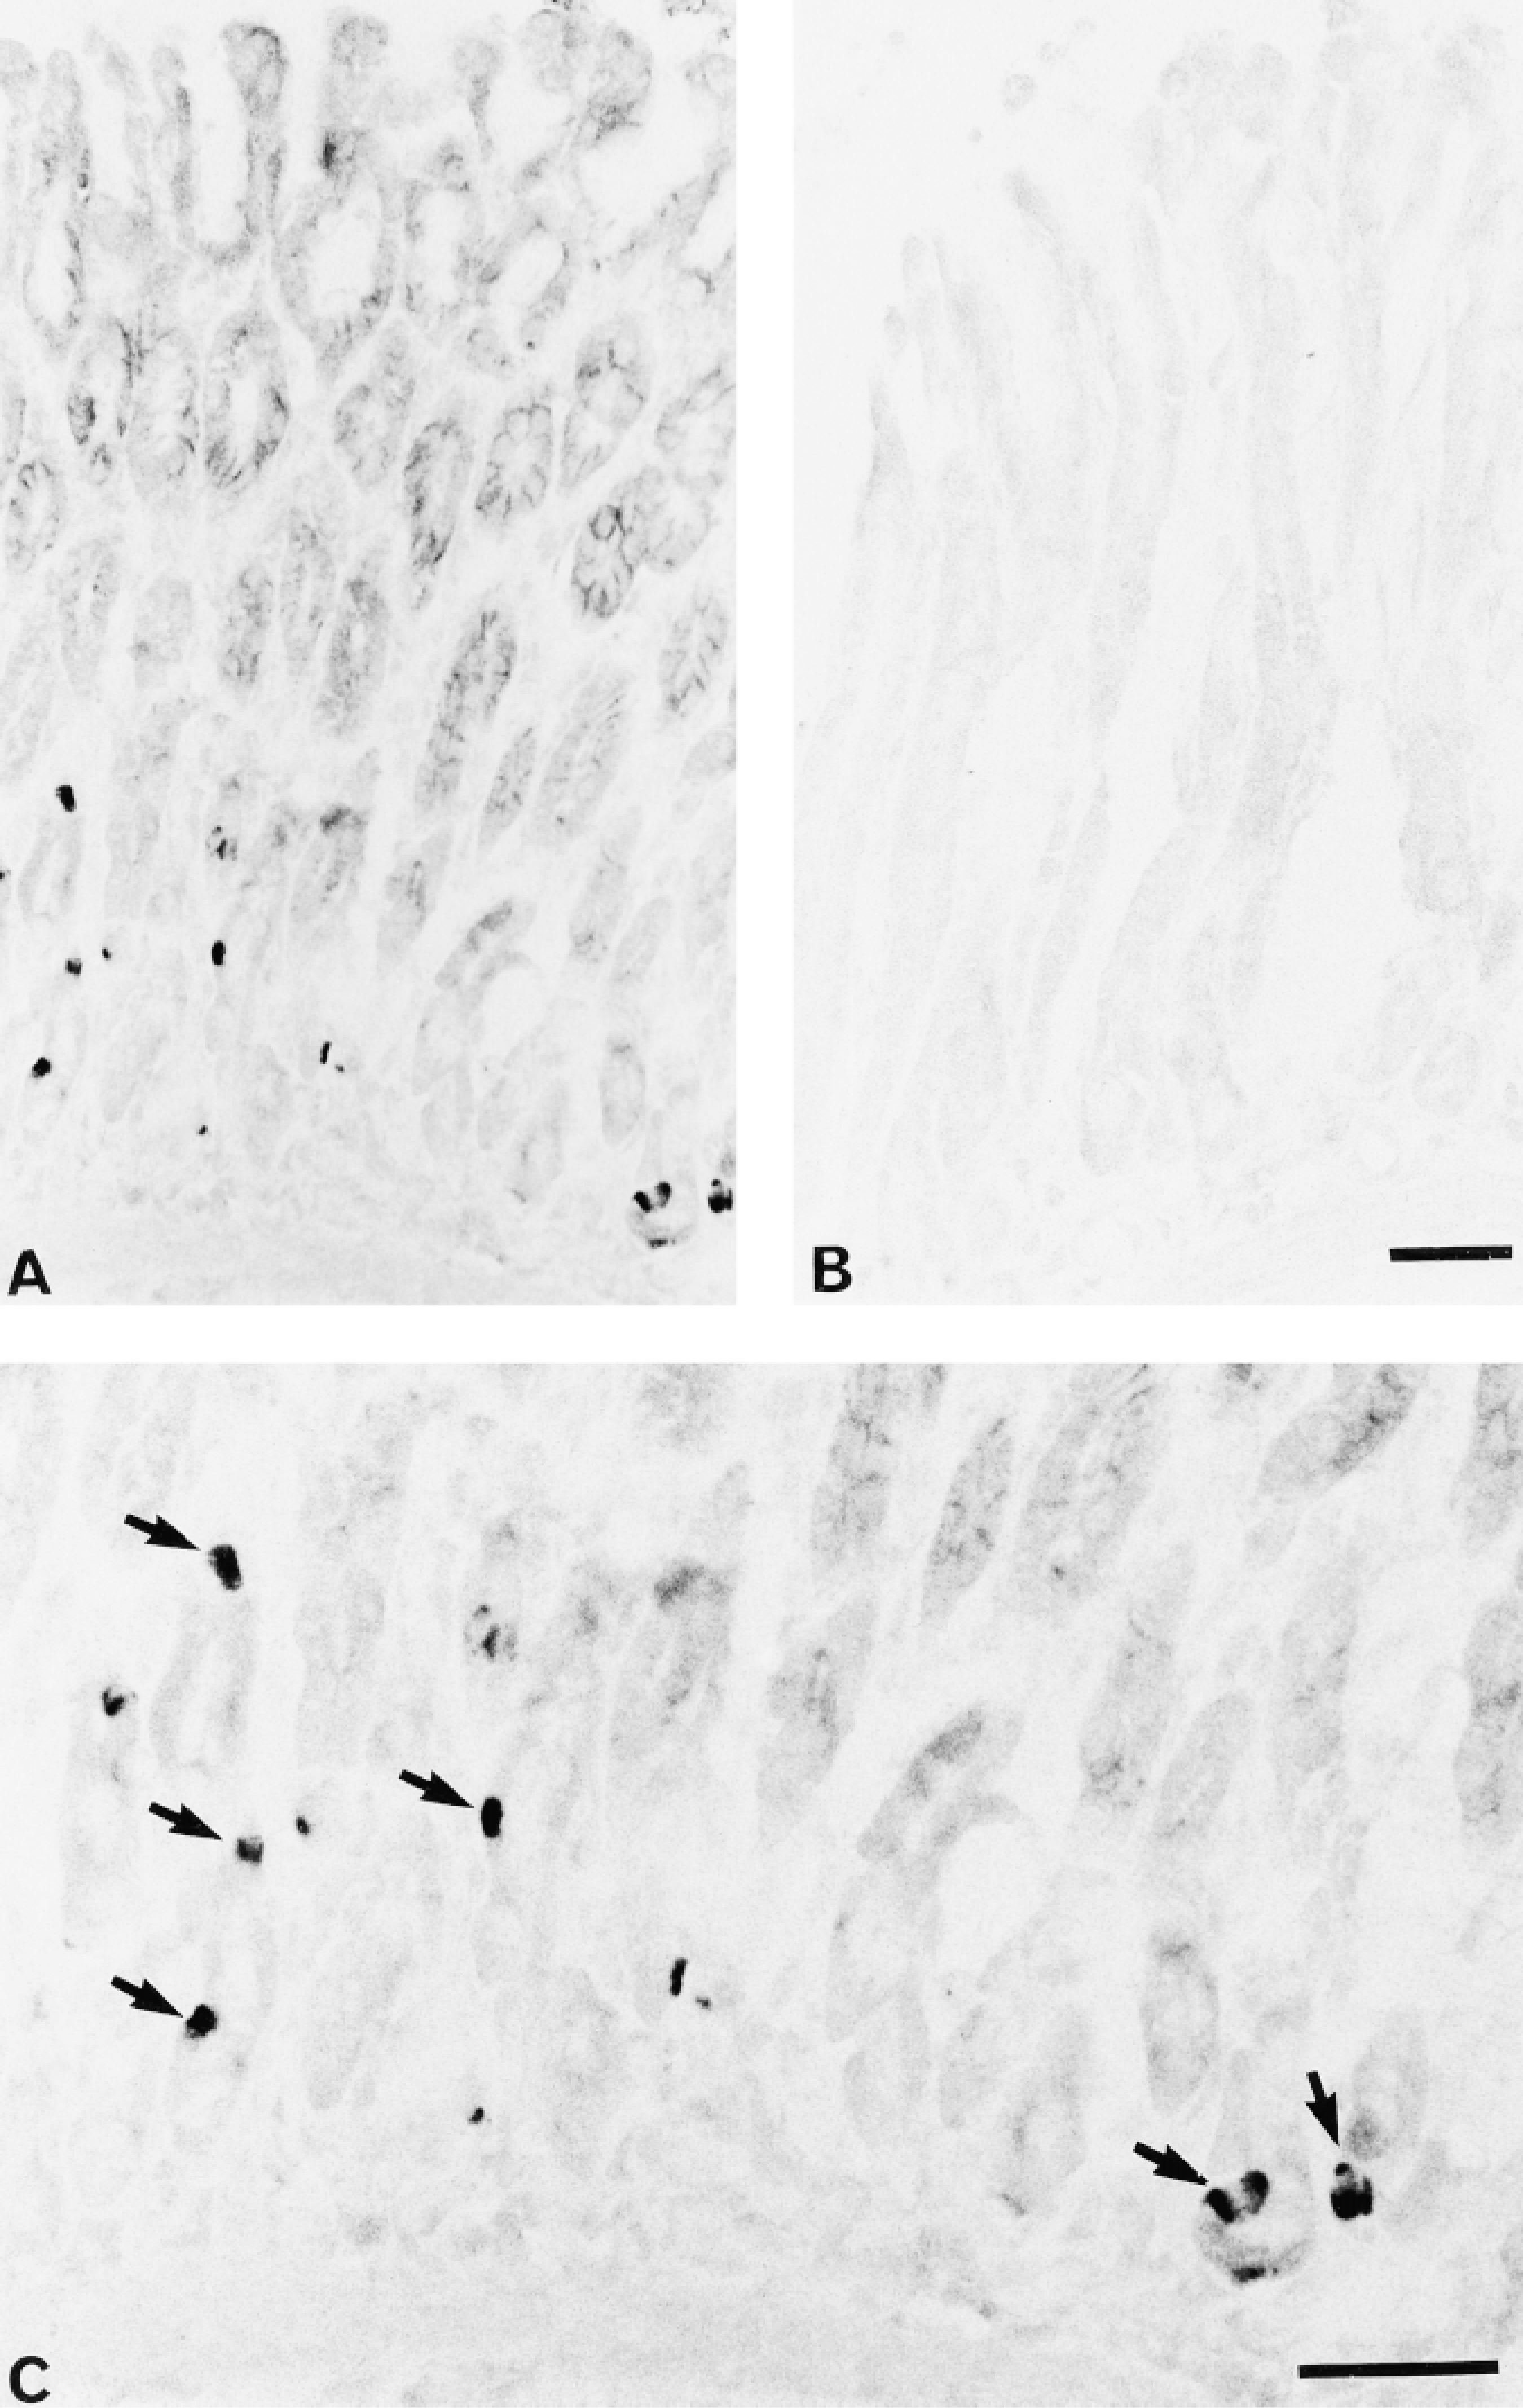
Staining of rat antropyloric mucosa by the polyclonal nNOS antisera demonstrated scattered strongly stained endocrine-like cells, which by double staining were found to correspond to somatostatin cells (Figure 2). In addition, the mid-region nNOS antibody also produced weaker staining of many epithelial cells that were mainly present in the pits and surface epithelium (Figure 3). Only very sparse nerve terminals were detected in the mucosal layer. Preabsorption of both polyclonal antisera against the corresponding synthetic peptide eliminated all staining, whereas absorption against somatostatin or poly
(
RT-PCR
By use of nNOS-specific primers, one strong band corresponding in size to that expected from nNOS transcripts was obtained from rat antropyloric RNA (Figure 4). Simultaneous amplification using an intronspanning β-actin primer set produced only the band expected from RNA (503 bp) and excluded the presence of genomic contamination. Moreover, no band could be detected in controls from which reverse transcriptase was excluded.
Discussion
Our results demonstrate that the frequency of apoptosis in the antropyloric region of the stomach varies with the prandial state and that NO synthesis is required for the increased apoptosis seen after fasting. Because all three known isoforms of NOS can be inhibited by L- but not by D-NAME, they could conceivably all contribute to the fasting-induced apoptosis observed. Our present data and data from others show that the two Ca2+-calmodulin-dependent enzyme forms are present in the gastric mucosa (Salter et al. 1991; Whittle et al. 1992; Aimi et al. 1993; Kugler et al. 1994; Burrell et al. 1996; Price et al. 1996), whereas only extremely sparse iNOS-positive cells can be observed. The scarcity of iNOS positive cells agrees with previously published biochemical data (Salter et al. 1991; Price and Hanson 1998). Although nNOSpositive nerve fibers were regularly detected in the muscle wall, submucosa, and lamina muscularis mucosa they were very sparse in the mucosa (cf. Ekblad et al. 1994). Therefore, the nNOS mRNA detected by RT-PCR is most likely mainly of epithelial cell origin. Different studies undertaken in different regions of the rat stomach have reported on the localization of NOS to different epithelial cell types. In the cardia of the rat stomach, NOS-like immunoreactivity was localized to brush cells, and studies in the corpus region have reported on nNOS-like immunoreactivity in surface epithelium (Price et al. 1996). Finally, studies in the corpus and antropyloric region have localized nNOS-like immunoreactivity to D-cells (Burrell et al. 1996). Our present results with two region-specific (mid-region and C-terminal) peptide antibodies directed towards closely homologous regions of rat and human nNOS (cf. Materials and Methods) support the presence of nNOS-like immunoreactivity in D-cells. In addition, the antiserum recognizing the middle region of nNOS also stained epithelial cells predominating in the surface and pit region. Similar results were obtained in formaldehyde-fixed cryostat sections that were not exposed to antigen retrieval. The results obtained by the different antisera need not be contradictory because recent studies (Price and Hanson 1998) have revealed differences in antigenicity between gastric and cerebellar nNOS in the C-terminal region towards which one of our antisera was directed. Although different splice variants of nNOS have been described (Brenmann et al. 1997; Huber et al. 1998), no such splice variants have been detected in rat gastric mucosa (Price and Hanson 1998). Accordingly, it is possible that different gastric epithelial cells may produce forms of nNOS differing in posttranslational modifications (Price and Hanson 1998). This could explain the high activities of gastric nNOS (Price and Hanson 1998), which are difficult to attribute to the scarce D-cells alone. Moreover, staining with the NADPH diaphorase method, which detects cells containing NOS and related enzymes (cf. Persson et al. 1999), produces a rather uniform staining of the gastric epithelium (Price et al. 1996; and our unpublished results), which agrees with the staining obtained by our mid-region-specific antibodies and the staining reported by Price et al. (1996).
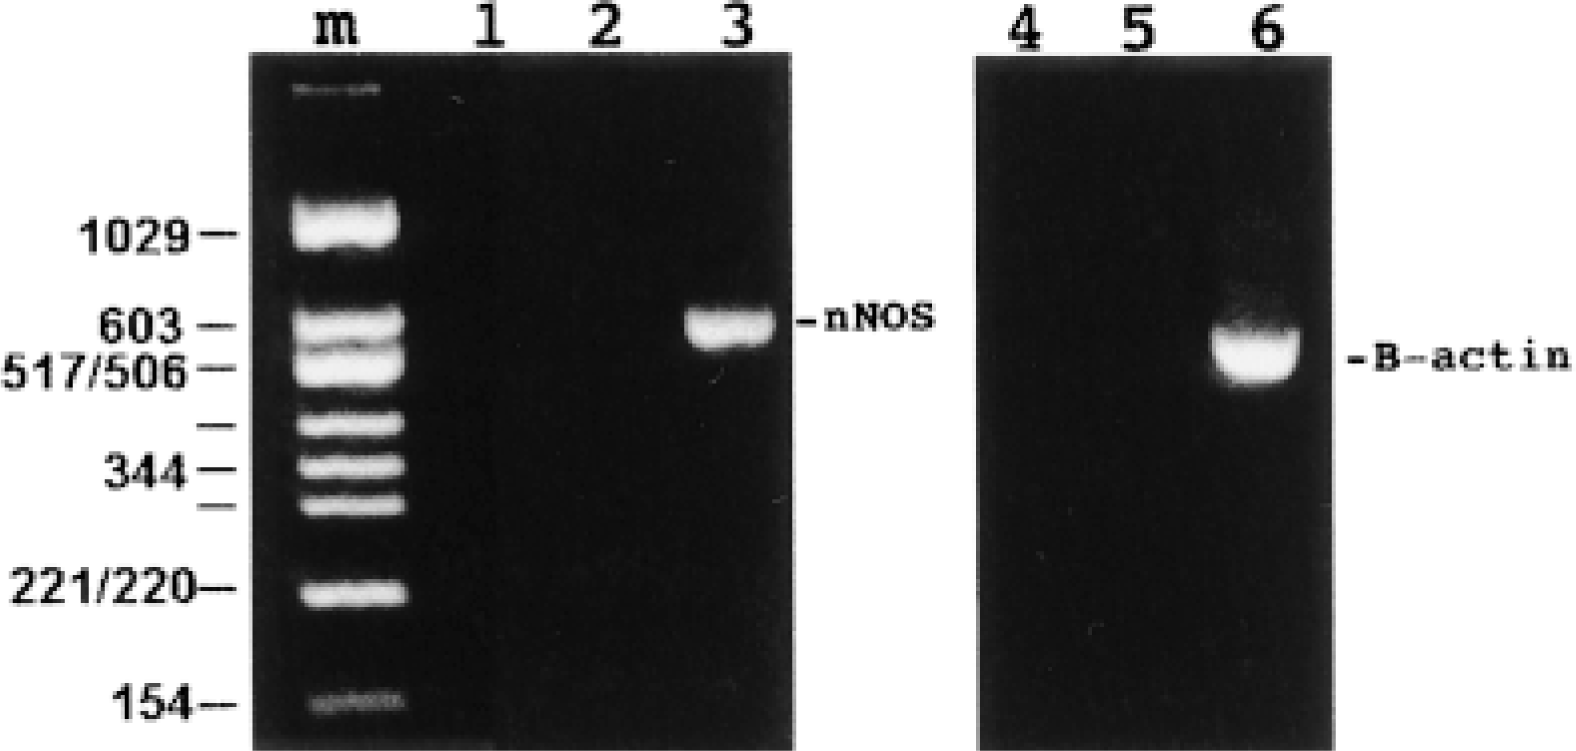
RT-PCR of rat antropyloric mucosal RNA. Note that primers specifically detecting nNOS amplify a band of the expected size (599 bp, Lane 3; molecular size markers, Lane m), while an intronspanning actin primer set amplifies a single band corresponding in size to that expected from β-actin mRNA (503 bp, Lane 6) but not from genomic DNA (713 bp). Lanes 1 and 4 represent controls without template and Lanes 2 and 5 are controls without reverse transcriptase.
Our data leave room for the hypothesis that D-cells regulate apoptosis in G-cells by paracrine release of NO. Thus, local release of NO can induce apoptosis (Sandoval et al. 1995; Bonfoco et al. 1996; Melkova et al. 1997; Umansky et al. 1997) and G- and D-cells are in close paracrine contact (Larsson et al. 1979), probably reflecting their derivation from a common gastrin-somatostatin-coexpressing stem cell (Larsson et al. 1995,1996). D-cells regulate G-cell function by paracrine release of somatostatin (Saffouri et al. 1979, 1980; Chiba et al. 1981; Wolfe et al. 1983; McIntosh et al. 1991; Holst et al. 1992). A lowered intragastric pH activates paracrine somatostatin release, which inhibits gastrin secretion and reduces further stimulation of gastric acid production. Moreover, paracrine somatostatin not only blocks gastrin release but also inhibits gastrin gene transcription and reduces gastrin mRNA stability (Brand and Stone 1988; Karnik et al. 1989; Karnik and Wolfe 1990). All of these mechanisms safeguard the stomach against inappropriate stimulation of gastric acid secretion evoked by the secretory and trophic actions of gastrin on the parietal cells. Starvation, a situation in which gastrin is not needed, is also known to result in reduced numbers of gastrin-immunoreactive and mRNA-positive cells (Lichtenberger et al. 1975; Larsson 1978; Larsson and Hougaard 1993a,b). However, it has been uncertain whether this phenomenon reflects a reduction in biosynthesis of the hormone, making the cells undetectable by immunocytochemistry and in situ hybridization, or whether actual losses of G-cells occur during starvation. Our results now document an increased rate of apoptosis in G-cells during starvation. Because this can be inhibited by the NOS inhibitor L-NAME, it is tempting to believe that increased paracrine NO release from stimulated D-cells will induce apoptosis in G-cells. This could then represent a third mechanism of paracrine control to be exerted in situations where gastrin release is superfluous or even harmful. Interestingly, after refeeding, gastrin cells of starved rats show an increased [3H]-thymidine labeling index (Bertrand and Willems 1980). Therefore, feeding-induced proliferation may compensate for the starvation-induced apoptosis of G-cells.
Very recently, Scheller et al. (1998) reported that NOS inhibitors also appeared to block nicotinic acetylcholine receptor channels in patch-clamp experiments. This raises the concern of whether the effects observed with L-NAME or with other NOS inhibitors could be due to effects on NO generation or on nicotinic acetylcholine receptors. Regrettably, Scheller et al. (1998) did not examine whether the commonly used inactive stereoisomer of L-NAME, D-NAME, had any effects on nicotinic acetylcholine receptors. However, several lines of evidence make it highly unlikely that blocking of nicotinic acetylcholine receptors could account for the decrease in apoptosis observed after L-NAME treatment. First, many studies show that, in most cell types, stimulation of nicotinic acetylcholine receptors decreases apoptosis (Wright et al. 1993; Maneckjee and Minna 1994; Rinner et al. 1994; Aoshiba et al. 1996; Heusch and Maneckjee 1998). Hence, blocking of these receptors would be expected to result in increased rather than decreased levels of apoptosis. Second, and more importantly, we observed increased apoptosis during starvation, which is characterized by less cholinergic input to the stomach than in the fed situation. Therefore, we believe that it is highly probable that the effects observed in the present study are attributable to NOS activity and not to blocking of nicotinergic receptors. However, interactions between the two pathways are difficult to exclude because nicotinic receptors affect NOS expression (Nakamura et al. 1998), and NO affects cholinergic neurotransmission (Leclerc and Lefebvre 1998) in the stomach wall.
In addition to the effects on G-cells, starvation and NOS inhibitor treatment also influenced the AI of the general antropyloric epithelium. Apoptotic general epithelial cells were detected also in the surface and pit epithelium, where D-cells are virtually absent. Possibly, changes in gastric blood flow caused by L-NAME treatment could affect the degree of apoptosis. However, this mechanism would be expected to be rather unspecific and to affect all gastric epithelial cell types, including the D-cells. A more likely explanation is that the other nNOS-positive epithelial cells, which were found to predominate in the surface and pit regions, could be important for regulating adaptive apoptosis during starvation. Alternatively, the expression of other cellular survival factors, including gastrin itself or neuronal factors, may be regulated by NO-dependent mechanisms during starvation.
Footnotes
Acknowledgements
Supported by grants from the Danish Medical Research Council and the Danish Cancer Foundation. Dr Cao was supported by a scholarship from the Danish National Research Foundation.