
Abstract
The metaphase nucleolar organizer regions (NORs) contain ribosomal genes associated with proteins such as upstream binding factor (UBF) and RNA polymerase I (RPI). These genes are clustered in 10 loci of the human acrocentric chromosomes (13, 14, 15, 21, and 22). Some NOR-associated proteins, termed AgNOR proteins, can be specifically stained by silver. In this study we took advantage of technical advances in digital imaging, image restoration techniques, and factorial correspondence analysis (FCA) to study the different AgNOR staining patterns of metaphase chromosomes in human lymphocytes. Three predominant patterns could be distinguished: pair (47%), stick-like (28%), and unstained (18%) structures. By studying the frequency of occurrence of each pattern on different chromosomes, two groups could be defined. Chromosomes 13, 14, and 21 carried predominantly pair or stick-like AgNOR structures, whereas chromosomes 15 and 22 mainly carried pair AgNOR structures or remained unstained. We suggest that the different AgNOR shapes reflect both the number of ribosomal genes carried by each chromosome and the differential recruitment of active ribosomal genes in each NOR cluster. This is the first study showing a nonrandom distribution of AgNOR shape among acrocentric chromosomes.
Keywords
A
Silver staining of NORs is due to nonhistone proteins called Ag-NOR proteins (Howell 1982). It localized in the vicinity of rDNA genes in metaphase and mainly in the fibrillar component of the nucleolus in interphase (for review see Thiry and Goessens 1996). RPI and UBF have been proposed as the major metaphase AgNOR proteins (Roussel and Hernandez-Verdun 1994) and their immunological co-localization in NORs was observed by confocal microscopy (Robert-Fortel et al. 1993; Gilbert et al. 1995; Héliot et al. 1997; Suja et al. 1997).
In situ studies have shown that metaphase AgNORs exhibit different morphologies independent of the cell type and fixation. Pair and stick-like AgNOR structures have been described with confocal microscopy (Ploton et al. 1994) and conventional electron microscopy (Schwarzacher et al. 1978; Goessens 1984; Ploton et al. 1986; Thiry et al. 1988). These structures have also been observed after immunostaining of UBF (Héliot et al. 1997). More recently, a fine fibrillar organization within stick-like AgNOR structures has been revealed by 3D electron microscopy (Héliot et al. 1997). However, it has not yet been determined whether these different NOR patterns (pair, stick-like, singlet structures or unstained) are randomly borne by the acrocentric chromosomes.
In this study we addressed this question, basing our analyses on the shape of AgNORs and taking advantage of technical advances in digital imaging, image restoration, and analysis. Two groups of acrocentric chromosomes were distinguished according to the AgNOR structures that they preferentially carry. The biological significance of these results is discussed.
Materials and Methods
Chromosome spreads were prepared from phytohemagglutinin (PHA)-stimulated peripheral blood by conventional cytogenetic techniques (Ronne 1985). Silver staining was performed as described by Goodpasture and Bloom (1975) and adapted by Ploton (1982). Chromosomes were stained with 200 ng/ml of 4'-6-diamidino-2-phenylindol (DAPI; Molecular Probes, Eugene, OR) in an antifading buffer containing 2.3% diazo-2-2-2-bicyclo-octane (DABCO; Sigma, St Louis, MO). This study has been carried out on 10 acrocentric chromosomes (diploid cell) in 612 metaphase from 18 healthy donors inrelated. Thirty-four metaphases per donor were selected for analysis on the basis of following criteria: normal number of chromosomes (46 XX or 46 XY), low frequency of physical overlap between chromosomes, weak nonspecific silver staining, and easy identification of NOR-carrying chromosomes.
Preparations were observed under an epifluorescence microscope (Axiophot; Zeiss, Oberkochen, Germany) equipped with a Zeiss filter set 01 (BP 365, dichroic filter 395, LP 397) for DAPI fluorescence and by using transmitted light for AgNOR staining. The AgNOR and DAPI staining could be observed simultaneously or successively, using a ×63, 1.25 NA oil-immersion objective and an intermediate magnification lens (Optovar; X1.25). Images were collected using a cooled CCD camera (C4880; Hamamatsu, Tokyo, Japan). To improve the quality of blurred images (caused by out-of-focus haze and glare), deconvolution was performed on gray level 16-bit images with image restoration software and according to procedures developed in our laboratory (Monier et al. 1996). The images of AgNOR structures were analyzed (measured for the size of structure) with CytoFISH (unpublished data).
Factorial correspondence analysis (FCA) (Lebart et al. 1982) is a multivariate data analysis method that provides a graphic synthetic representation of the dependencies between the rows and the columns of a contingency table. The principle of FCA is to calculate a multidimensional space based on the stress forces between rows and columns. Briefly, let us consider that each column (e.g., AgNOR patterns) is a string whose length is proportional to the sum of the row contents (number of occurrences for an AgNOR pattern). The final graphic representation is obtained by projecting the locations of the column data and the row data on factorial planes whose orientations are selected in such a way that they maximize the gaps between the pattern classes. In our data set, the number of rows is 90 and corresponds to the classes of acrocentric chromosomes (five categories) in each individual (18 donors). The five columns correspond to the AgNOR pattern classes. The results are expressed by the mean and standard deviation in dealing with frequencies (continuous variable expressed in %) and by the modal value and maximal deviation in dealing with scores (discrete data). See Appendix for further details.
Results
This study was carried out in 18 healthy donors (six women and 12 men) aged between 25 and 50 years. For each individual, 34 metaphases were analyzed, i.e., 68 occurrences per acrocentric chromosome (13, 14, 15, 21, and 22). Altogether, we analyzed 340 acrocentric chromosomes per donor and 1224 occurrences of each five acrocentric chromosomes. For the 18 donors, the number of AgNOR structures per metaphase ranges between 7 and 10 (mean modal value 8 ± 1) (Table 1). The number of AgNOR structures per metaphase varied within the same individual (Figure 1) and was characterized for each donor by the standard variations presented in Table 1. Figure 1 shows the distribution of AgNORs between the acrocentric chromosomes for 34 metaphases from donor P. Both chromosomes of pairs 13, 14, and 21 frequently carried an AgNOR (31 of 34). Quite often, only one homologue of pairs 22 (12 of 34) showed AgNOR staining. The observations for donor P were representative of the AgNOR distribution in the other subjects.
Modal values and standard variations (SD) of AgNOR frequency
Number of AgNOR structures carried by acrocentric chromosomes for individual P. For 34 metaphases observed, a modal value of 9, a mean of 8.4, and an SD deviation of 0.8 were found. Only five of 34 metaphases fell outside the interval modal value ± 1. Among those, four (7, 20, 23, 27) were characterized by absence of staining on chromosomes 15 and 22. Metaphase number 32 appears to be atypical.
A morphological analysis of AgNOR staining distinguished three patterns: stick-like, pair, and singlet structures (Figure 2), which were described by 3D electron microscopy in our previous work (Héliot et al. 1997). In addition, we considered the unstained NOR position as a morphological pattern. The structures were analyzed after image restorations (Parraza et al. 1993). The stick-like structure has an elongated shape, with its main axis perpendicular to the chromosome axis, and is located across the two chromatids (Figure 2). To belong to this class, the total length of these patterns (Figure 2, W) should be more than 0.9 μm, which represents at least 75% of the chromosome width (Figure 2, C, around 1.2 μm). The pair structure corresponds to an arrangement of two well-separated AgNOR spots, each of which is associated with one chromatid. The diameter of each spot should be smaller than 0.7 μm (Figure 2, W'), with a distance exceeding 0.1 μm (one pixel) between them (Figure 2, d). Two spots in contact, representing a total length of 0.4-0.8 μm, were also considered as a pair structure. Finally, the singlet structure is composed of a single spot, with a mean diameter less than 0.3 μm and carried by only one chromatid (Figure 2, W'). Two further classes were defined, acrocentric chromosomes devoid of AgNOR structures (unlabeled class) or whose labeling could not be assigned to any other class (atypical class). Figure 3a shows a metaphase chromosome spread and Figure 3b a visual summary of these main classes of structures. Statistical analysis of the pooled results (Figure 4) showed that the three most frequent patterns are pair-like (47%) and stick-like structures (28%), along with unlabeled acrocentric chromosomes (18%). The singlet pattern was seldom encountered (1%), and the proportion of atypical labeling was low (6%).
Classification and parameters of AgNOR shapes. W and W', width (see text); h, height (around 0.2 μm); d, distance between two AgNOR spots (see text). C, chromosome width (0.6-0.7 μm).
Partial karyotyping was performed using DAPI banding and image deconvolution to study the relationship between the AgNOR shape and the identity of the labeled chromosomes. The distribution of acrocentric chromosomes into two groups according to their AgNOR structure was clearly emphasized by a multivariate analysis. The FCA (Figure 4) summarizes the distribution of the 6120 chromosomes in this study. The symbols correspond to the 68 observations (34 metaphases) of individual acrocentric chromosomes of each donor. For example, arrows indicate the chromosomes of a single donor (donor P, Table 1). The chromosomes are distributed between three major attractors corresponding to their AgNOR structures (i.e., stick-like or pair patterns, or unstained). The first factorial plane encompasses 93% of stress information (Figure 4; see Materials and Methods). The third factorial axis bears only 5% of stress information (corresponding to the atypical class) and consequently was not plotted. The FCA graph shows two groups (Figure 4). The first group, containing chromosomes 13, 14, and 21, spreads along a line between stick-like and pair patterns (Figure 4). The second group, composed of chromosomes 15 and 22, spreads along a line between unstained cases and pair patterns. Pair patterns are evenly distributed between acrocentric chromosomes (Figure 4). Table 2 summarizes data extracted from the multivariate analysis exposed as the distribution of AgNOR shapes on acrocentric chromosomes. The number of pair structures per chromosome ranges between 41 and 54 (average 47 ± 11%). In contrast, 96 ± 4% of the stick-like structures are carried by chromosomes 13 (53 ± 10%), 14 (32 ± 8%), and 21 (48 ± 13%). This structure is only found at 4 ± 3% on chromosome 15 and 1 ± 1% on chromosome 22. Most of the unlabeled chromosomes (93 ± 7%) are chromosomes 15 (46 ± 11%) and 22 (39 ± 15%). These data are summarized in Table 2. AgNOR patterns are dependent neither on the size of chromosomes (i.e., cytogenetic groups D and G) nor on the sex of the donor (Table 1).
Discussion
Here we describe a new aspect of human AgNORs, the nonrandom location of differently shaped structures on the five NOR-carrying chromosomes. Eighteen healthy donors were included in this study and 6120 chromosomes were analyzed. The mean modal number of AgNOR structures per individual was 8, ranging from 7 to 10 with a very low SD (between 0.61 and 2.37) for each donor (Table 1). Our data are in agreement with the results of six previously published studies (Table 3) except for those of Varley (1977), who reported a lower number of AgNOR structures. These differences probably originate from protocol variations, as suggested by Verma et al. (1981). Finally, Ozen et al. (1995) have found a modal number of 9, but they worked with only a single donor.
Two chromosome groups, independent of cytogenetic classes D and G and of donor sex, could be distinguished by multivariate analysis (Figure 4; Table 2). Chromosomes 13, 14, and 21, constituting the first group, preferentially carry stick-like and pair structures; on average, 96% of stick-like structures are borne by these chromosomes. The second group, containing chromosomes 15 and 22, preferentially exhibits pair structures or is unstained; this group contains 93% of the unstained chromosomes. Pair structures are most numerous (47%) and can be found on all acrocentric chromosomes, whereas stick-like structures and unstained cases are mutually exclusive (Figure 4; Table 3). Homologous chromosomes may carry AgNORs of different shapes, and the occurrence of singlet structures shows that sister chromatids do not always carry a similar AgNOR. These differences may reflect either rDNA deletion or variations in expression, a question that requires further studies of singlet structures.
During interphase, the size of AgNORs and the number of fibrillar components are correlated with the level of ribosomal gene activity after the stimulation of lymphocytes with PHA or cell fusion (Arrighi et al. 1980; Babu and Verma 1985; Wachtler et al. 1986; Zurita et al. 1998). During mitosis, silver staining is associated with clusters of rDNA genes that were transcriptionally active during the preceding interphase (Miller et al. 1976). Several studies indicate that metaphase NORs reflect the potential ribosomal gene activity (Warburton and Henderson 1979; Wachtler et al. 1986; Zurita et al. 1998). Sequential silver staining and in situ hybridization with an rDNA probe (ISH) on cells of the mole Talpa occidentalis with a single pair of NOR-carrying chromosomes have demonstrated a direct correlation between the intensity of AgNOR staining and that of ISH (Zurita et al. 1998). These authors have concluded that AgNOR staining depends predominantly on the number of ribosomal cistrons. The same conclusion was reached in a study of two human subjects (Wachtler et al. 1986), although in both studies a significant number of cells in all individuals did not display this tendency. De Capoa et al. (1988) have shown that the number of rDNA genes (evaluated by the number of silver grains after in situ hybridization) was not directly associated with rDNA activity, measured by frequency of silver staining, nor with the size of the AgNOR. We therefore suggest that the stick-like AgNOR structures on chromosomes of group 1 (13, 14, and 21) and the pair structures on chromosomes of group 2 (15 and 22) are a qualitative reflection of the differences in the number of genes per cluster and are characteristic of the maximal level of potential gene activity. Chromosomes of group 1 more often carry an AgNOR than those of the second group (Figure 1), suggesting that on average they carry more rDNA genes. Less frequent AgNOR shapes (i.e., pairs for group 1 and unstained for group 2) would correspond to an intermediate or minimal level of potential rDNA activity per cluster.
Types of AgNOR patterns. (
The transcriptional activity of ribosomal cistrons requires the binding of transcription factors to their promoters, and AgNOR staining could also be influenced by the number of initiated transcription complexes. Models to explain the differences between NOR shapes on homologous and nonhomologous chromosomes must take into account how, when, and to what extend the binding of transcription factors takes place. Each transcription factor (UBF and others) may bind randomly to ribosomal cistrons in all clusters, or once the first factors are bound the others may bind in a cooperative manner (Moss 1983; Zurita et al. 1998; for review see Jacob 1995). A correlation between the size of AgNORs and the amount of the transcription factor UBF has been shown in several studies (Roussel and Hernandez-Verdun 1994; Zatsepina et al. 1996), and stick-like and pair NOR structures are also observed by immunostaining for UBF (Héliot et al. 1997). RPI is also associated with rDNA in mitotic NORs (Scheer and Rose 1984; Zatsepina et al. 1996) and is stalled after the transcription of a few hundred bases (Weisenberger and Scheer 1995). These data suggest that assembled transcription complexes inherited from the previous interphase may determine the pattern of an AgNOR at the beginning of the next cell cycle (Ferraro et al. 1981). CpG methylation may also play a role in ribosomal gene regulation (Bird et al. 1981; Brock and Bird 1997) and could influence the AgNOR pattern. Irreversible repression of rDNA genes was suggested to explain the decreased number of AgNORs correlated with increased age (Denton et al. 1981; Thomas and Mukherjee 1996). The different characteristic AgNOR shapes shown here may therefore reflect both the number and the molecular regulation of rDNA gene clusters.
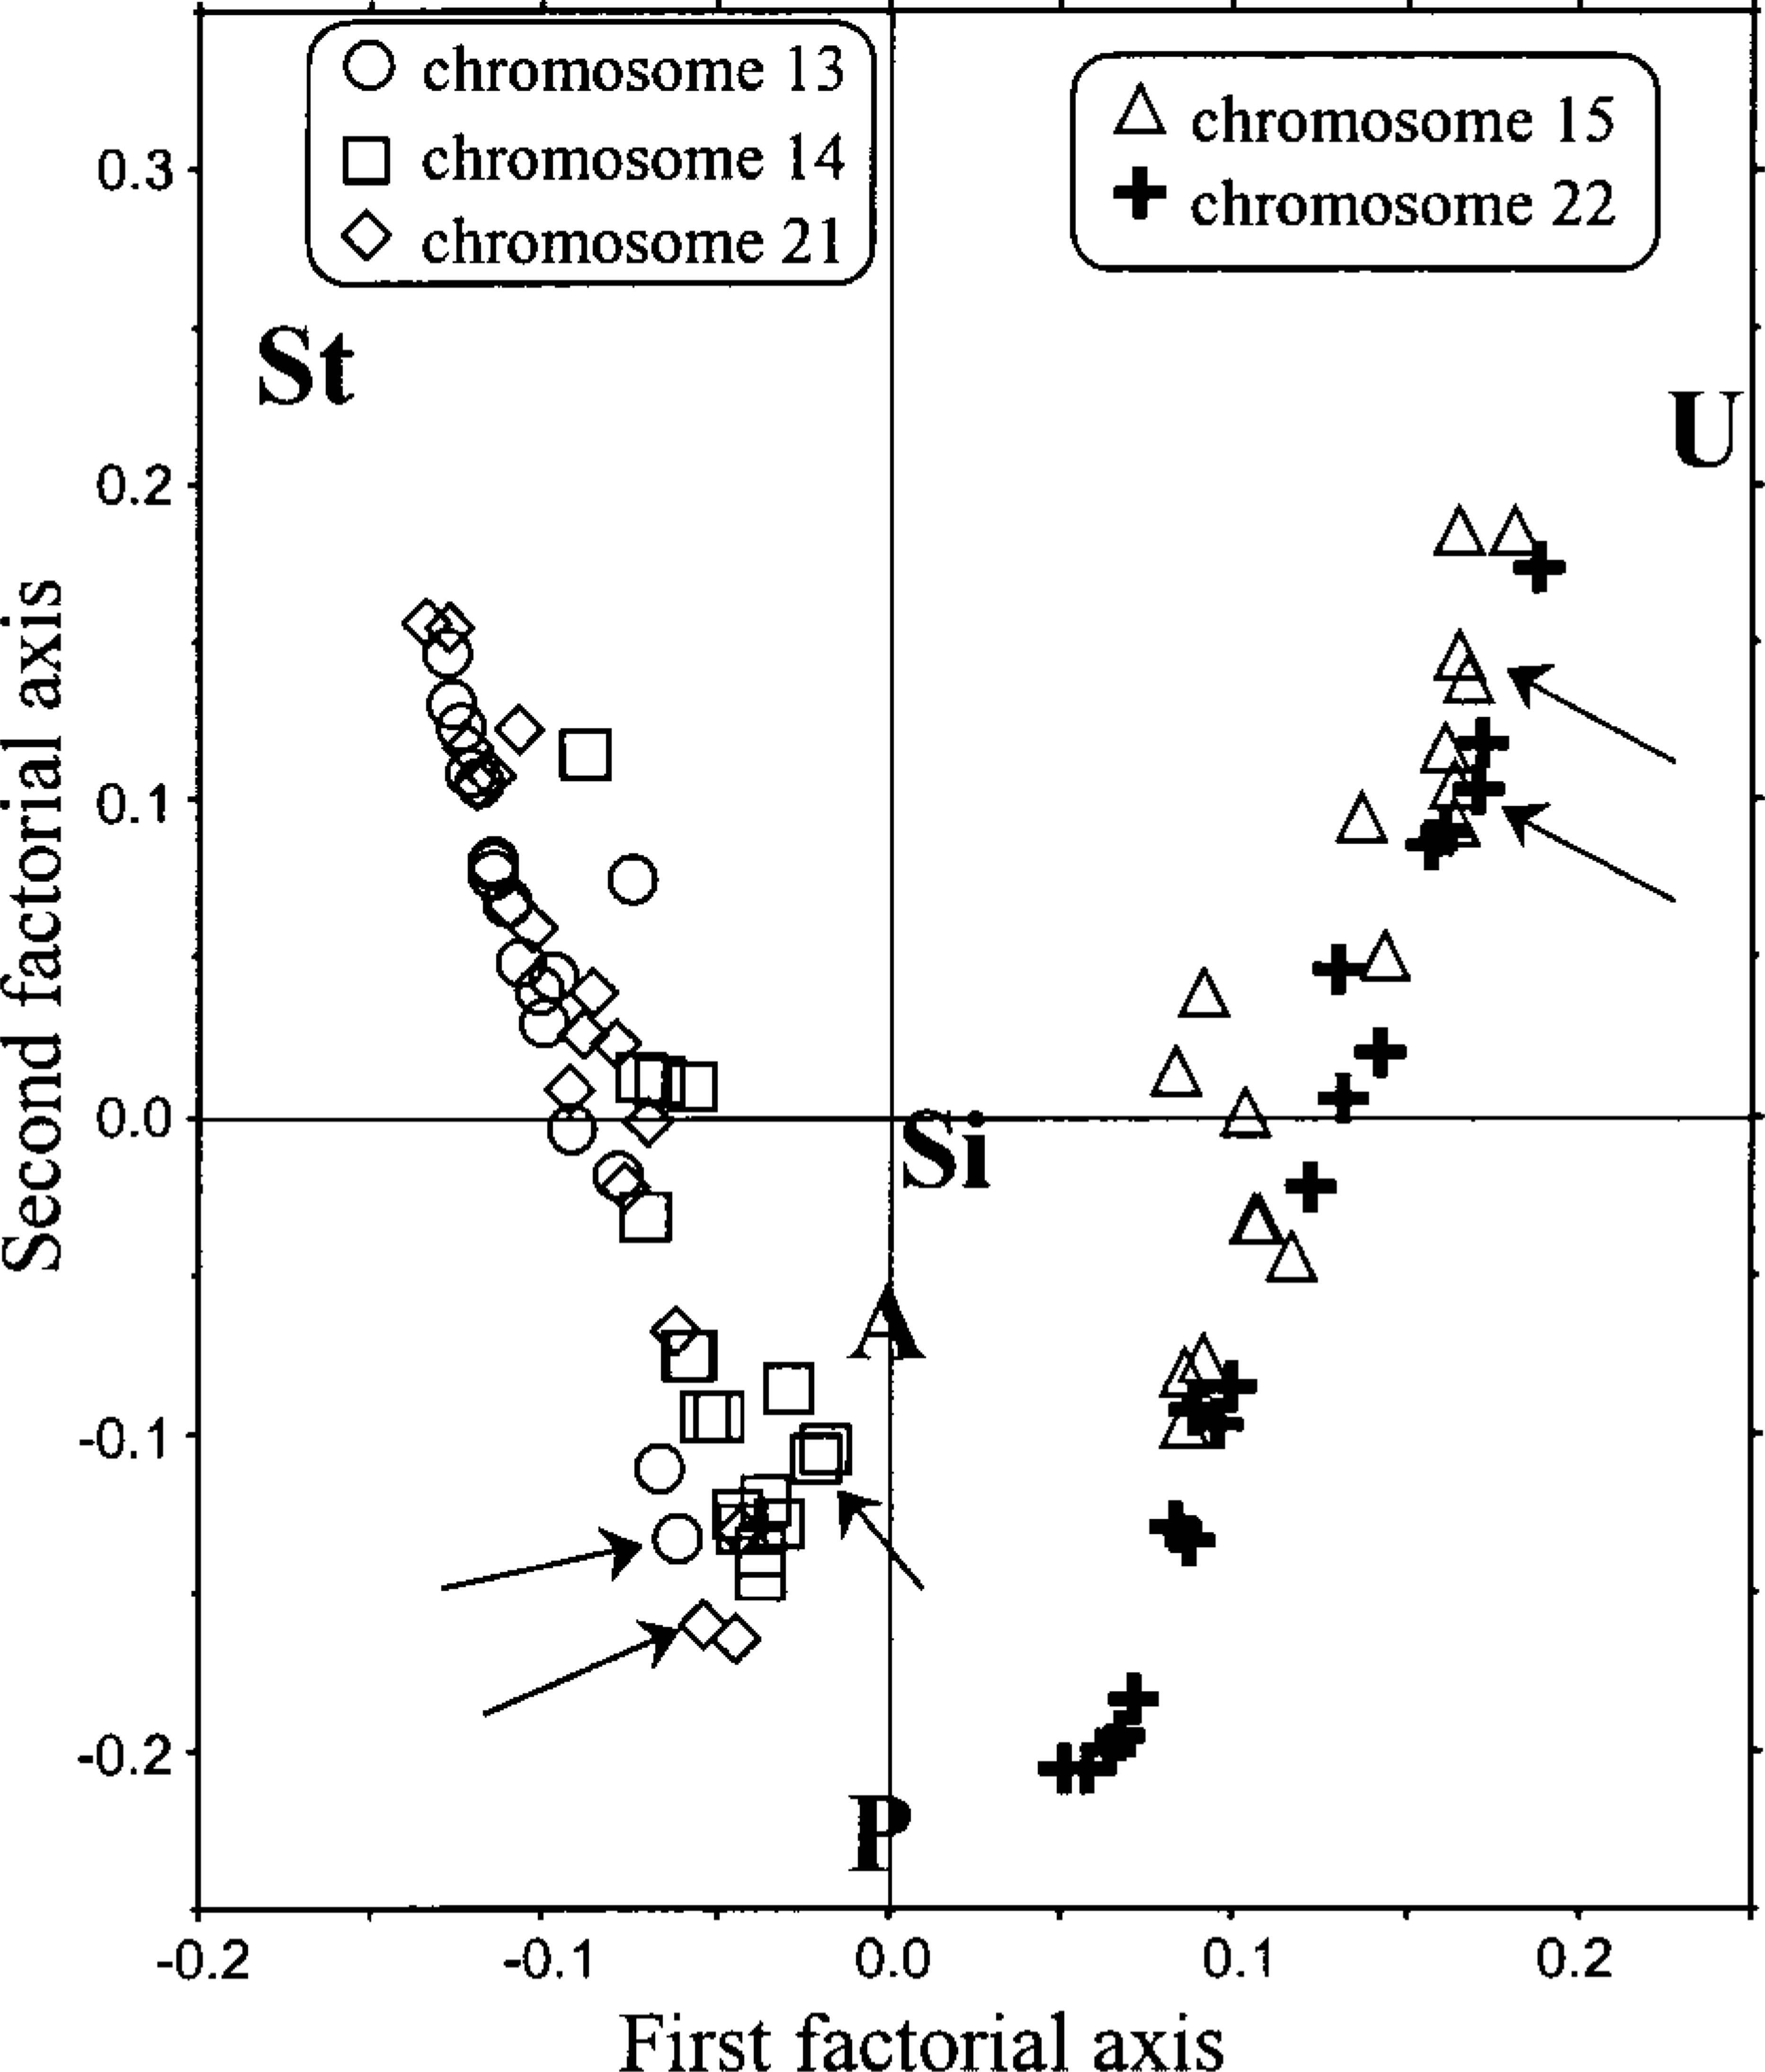
Multivariate analysis of AgNOR distribution for each donor. This representation shows the distribution of AgNOR patterns (four structures and the unstained case) on each chromosome. The first and second factorial axes are defined in Materials and Methods; units are expressed in standardized variance. Arrows indicate the positions of acrocentric chromosomes of donor P (see Table 1). St, stick-like; U, unstained; P, pair; Si, singlet; A, atypical.
Footnotes
Appendix
Factorial correspondence analysis (FCA) is basically a graphic representation of large contingency tables. A contingency table K is an array of p rows and n columns where an element kij (with 1<i<p and 1<j<n) contains the score of individuals of type i and bearing the character j. For example, it could be a table with 4 rows corresponding to the hair color of boys in a classroom (blond, black, brown, and red) and with 4 columns corresponding to the eye color (blue, brown, green, and black). An element of this array corresponds to the number of boys sharing the same hair color and the same eye color.
In a first stage, the K table is converted into a frequency table F by applying the following transform:
Let us consider that p≥n. In this case, the FCA consists in solving the following equation:
where t denotes transposition, I is the identity matrix, U1 are the latent roots or eigenvalues of the matrix, and U1 are the ancillary eigenvectors.
The projection of the row vectors in the factorial space defined by U1 and U1 are obtained as follows:
Acknowledgements
We thank Drs R. Hancock and M. Thiry for their thoughtful discussions and suggestions, and Drs M. J. O'Donohue, D. Morel, and S. Stephan for revising the English style of the manuscript. We thank the reviewers for their suggestions, which significantly improved the quality of this manuscript.