
Abstract
In early 2020, when COVID-19 began to spread in the United States, many Twitter users called it the “Chinese virus,” blaming racial outgroups for the pandemic. I collected tweets containing the “Chinese virus” derivatives posted from March to August 2020 by users within the United States and created a data set with 141,290 tweets published by 50,695 users. I calculated the ratio of users who supported the racist naming of COVID-19 per county and merged Twitter data with the county-level census. Multilevel regression models show that counties with higher COVID-19 mortality or infection rates have more support for the racist naming. Second, the mortality and infection rates effects are stronger in counties with faster minority growth. Moreover, it is mainly in poor counties that minority growth enlarges the effects of infection and mortality rates. These findings relate to the theories on disease-induced xenophobia and the debate between conflict and contact theories.
First comes the disease, then the scapegoating. Existing studies have long noted that public health crises may lead to discrimination against minority groups (e.g., Crawford 1994; Joffe 1999; Kurzban and Leary 2001). Since the outbreak of the COVID-19 epidemic, hostility toward Chinese or Asian communities has risen in the United States (e.g., Budhwani and Sun 2020; Gover, Harper, and Langton 2020; Li and Nicholson 2021; Wu, Qian, and Wilkes 2021). For example, the FBI documented 279 hate crime incidents against Asians in 2020, a 76% increase compared with the previous year (Barr 2021). Past works have described racial demographic change and economic distress as the essential sources of racial discrimination in American society (e.g., Citrin et al. 1997; Monnat and Brown 2017; Putnam 2007; Quillian 1996). However, few studies have examined how demographic and economic contexts may moderate the relationship between local COVID-19 prevalence and anti-outgroup sentiments. These preexisting demographic and economic contexts may shape people’s responses to the COVID-19 outbreak. Therefore, the spread of COVID-19 may provoke stronger xenophobia in some areas with specific economic and demographic characteristics.
In order to fill the gap in the literature, the present study focuses on the support for the racist calling of COVID-19 on Twitter. On March 16, 2020, when COVID-19 was beginning to spread in the United States, then-President Donald J. Trump referred to the coronavirus as the “Chinese Virus” on Twitter: “The United States will be powerfully supporting those industries . . . that are particularly affected by the Chinese Virus.” Naming a disease with a particular group of people often leads to scapegoating and discrimination (World Health Organization 2015). Despite this concern, tweets containing “Chinese virus” or similar words increased almost 10-fold following Trump’s statement (Budhwani and Sun 2020). These tweets that support the racist naming of COVID-19 exemplify the xenophobia that blames a racial outgroup for the health crisis. Analysis of this online xenophobia may shed light on how the spread of COVID-19 shapes intergroup relations. This study addresses two questions: (1) how the local COVID-19 outbreak influences the support for racist naming of COVID-19 and (2) how racial demographic change and economic distress moderate the effect of the local COVID-19 outbreak.
I constructed a novel data set by combining social media data and census information. I collected tweets containing the “Chinese virus” derivatives posted from March to August 2020 by users within the United States. From this collection of tweets, I used supervised machine learning algorithms to select the tweets that support the racist calling of COVID-19. After extracting the county location of the users who posted these tweets, I calculated the ratio of users who supported the racist naming for each county. I merged the aforementioned data with county-level census data, which provide economic and demographic information. By linking tweets to the census, such a new approach makes it possible to examine how people’s surrounding contexts shape their attitudes.
According to this study, the spread of COVID-19 influences the scapegoating of the COVID-19 outbreak. In counties with higher COVID-19 mortality and infection rates, there is greater support for the racist calling of COVID-19. Second, the mortality and infection rates significantly interact with racial demographic change. In counties with larger increases in minority populations, the mortality and infection rates have stronger effects on the support for racist naming. Third, economic conditions, the COVID-19 outbreak, and demographic change have a significant three-way interaction. In poor counties, minority growth increases the effects of infection and mortality rates. However, in affluent counties, minority growth does not moderate the effects of infection and mortality rates. In the following section, I review theories on disease-induced xenophobia and intergroup relations and then introduce the data collection process. The next section includes data analysis and interpretation of key findings. I conclude by discussing how the findings improve the understanding of contextual determinants of disease-induced xenophobia.
Background
This Study’s Framework
Figure 1 summarizes this study’s framework. The COVID-19 pandemic has sparked a growing body of research on the relationship between disease outbreaks and xenophobia (solid line A). Existing studies have long pointed out that demographic and economic contexts shape people’s attitudes toward outgroups (solid line B). However, little research has explored the moderating effects of demographic and economic contexts on the association between disease outbreaks and xenophobia (dash line C). This study attempts to fill such a gap in the literature. In the following section, I elaborate on the related research and propose hypotheses on the moderating potential of demographic and economic contexts.
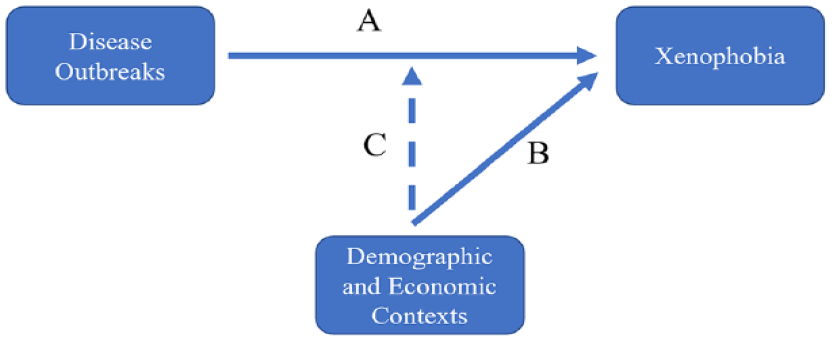
This Study’s Framework.
Existing Studies on COVID-19-Induced Xenophobia
Past works have analyzed the marginal status of Asian groups in the United States (e.g., Kim 1999; Okamoto 2003; Xu and Lee 2013; Zeng and Xie 2004; Zhou 2004). Since the outbreak of COVID-19, Asians have faced a new wave of discrimination. Scholars have noted the spikes in anti-Asian hate crimes in large cities since the COVID-19 outbreak, and these crimes are related to the deep-seated stereotypes that treat Asian Americans as “perpetual foreigners” (Gover et al. 2020; Li and Nicholson 2021; Tessler, Choi, and Kao 2020). Many Asian and other minorities reported experiencing COVID-19-related discrimination (Cheah et al. 2020; Strassle et al. 2022). Survey research has found that anti-Asian prejudice rises when respondents have worries about COVID-19 (Reny and Barreto 2022) or are exposed to COVID-19-related messages (Dhanani and Franz 2021; Lu et al. 2021). Cross-national research has shown that the pandemic also leads to stigmatization in East Asia, Europe, and Africa (Dionne and Turkmen 2020; Fan, Qian, and Jin 2021). Moreover, the literature has noted the health problems that Asian Americans experienced during the pandemic. Recent discrimination has led to mental health problems among Asians (Wu et al. 2021). Because of their limited economic resources and social connections, undocumented, low-income, elderly, and limited-English-proficient Asian Americans may be severely affected by the pandemic (Le et al. 2020). Scholars have advocated that people should not associate the coronavirus with the places of origin to avoid causing xenophobia (Zeng, Wang, and Zhang 2020).
Anti-Asian content has strikingly increased on social media since the COVID-19 outbreak. The number of tweets that contain the racist naming of COVID-19 rapidly grew (Chou and Gaysynsky 2021; Pei and Mehta 2020). For example, the number of these tweets increased by a factor of 10 in March 2020 (Budhwani and Sun 2020). Many tweets that used the racist naming of COVID-19 showed anti-Asian sentiments (Lwin et al. 2020). In conclusion, social media like Twitter has hosted many COVID-19-related xenophobic messages.
Local COVID-19 Prevalence and Xenophobia
However, the aforementioned empirical studies say little about how the local COVID-19 outbreak in an area influences the xenophobic attitudes of residents living in that area. There is little evidence for the relationship between the local COVID-19 outbreak and anti-outgroup hostility. Informed by the othering and disease-avoidance theories, I argue that there should be greater support for the racist naming of COVID-19 in counties where the pandemic is more severe.
The othering and disease-avoidance theories explain the link between disease outbreaks and xenophobia from different perspectives. The othering theory argues that the dominant group blames and keeps its distance from a marginalized group to reduce frustration, powerlessness, and anxiety during a health crisis (Crawford 1994; Eichelberger 2007; Joffe 1999). The dominant group often disparages the subordinate group as culturally inferior and thus responsible for transmitting contagious diseases. From the evolutionary psychological perspective, the disease-avoidance theory reasons that humans have evolved special psychological mechanisms to avoid exposure to disease or detect disease cues (Faulkner et al. 2004; Kurzban and Leary 2001; O’Shea et al. 2020; Thornhill and Fincher 2016). One cue often used is physical appearance indicating whether an individual is from an outgroup. Because contact with unfamiliar outgroups is associated with the risk of exposure to unknown contagious diseases, special psychological mechanisms lead people to avoid or attack outgroup members.
According to the othering theory, the dominant group may blame marginalized groups in order to reduce frustration, powerlessness, and anxiety during health crises. Residents in places with a severe outbreak may undergo these negative experiences and thus become more likely to scapegoat Chinese or Asian groups. Moreover, the disease-avoidance theory suggests that people may associate outgroups with unknown contagious diseases to avoid exposure. Residents in places struck by the COVID-19 pandemic face a higher health risk and may be more motivated to avoid potential health and economic loss. The residents in these areas may be more likely to associate the novel coronavirus with the Chinese or Asian groups.
I use mortality and infection rates to measure local COVID-19 prevalence following past works (e.g., Algara et al. 2022; Baccini, Brodeur, and Weymouth 2021). The former measure refers to the number of confirmed infection cases, while the latter relates to the number of deaths due to the coronavirus. The infection rate may be less accurate than the mortality rate because some people who contracted the disease may not be diagnosed and recorded. I hypothesize that:
Hypothesis 1: There is greater support for the racist naming of COVID-19 in counties with higher COVID-19 mortality and infection rates.
In addition to examining the relationship between the local COVID-19 outbreak and the support for racist naming, this study explores the contextual variation of this relationship. The othering and disease-avoidance theories and recent research on COVID-19-induced xenophobia have not explicitly examined the moderating potential of demographic and economic contexts. Demographic and economic forces shape the pre-outbreak intergroup relations and thus may affect how people respond to the spread of COVID-19.
Demographic Change
Scholars have long debated the social consequences of increasing racial diversity in Western societies. One side of the debate points to its negative influences on intergroup relations. Conflict theory portrays the increasing racial diversity as erosive to social cohesion because it generates intergroup struggle over economic resources and social status (Blumer 1958; Bobo and Hutchings 1996; Stephan and Stephan 2000). Moreover, research shows that people naturally evaluate outgroups as more threatening and less trustworthy than ingroup peers (McPherson, Smith-Lovin, and Cook 2001). However, the other side of the debate highlights the benefits of social interaction across group boundaries (for a review of the early history of intergroup contact theory, see Allport 1954; Pettigrew 1998; Pettigrew et al. 2011; Williams 1947). According to contact theory, the growth of the minority population facilitates interracial interaction, which should reduce prejudice and inappropriate behavior and breed empathy and friendship.
Many empirical studies in this field have revealed the negative consequences of racial demographic change in Western societies. Exposure to large minority groups or fast growth of minority population is associated with White people’s racial prejudice or opposition to race-targeted policies (Abascal 2023; Quillian 1996; Taylor 1998), electoral support for far-right politicians (Golder 2003; Maggio 2021; Mutz 2018; Vasilopoulos, McAvay, and Brouard 2021), anti-immigration resentment (Citrin and Sides 2008; Hopkins 2010; Newman 2013), and declining trust and neighborhood attachment (Alesina and La Ferrara 2002; Dinesen and Sønderskov 2015; Gijsberts, van der Meer, and Dagevos 2012; Laurence and Bentley 2016; Stolle, Soroka, and Johnston 2008; Sturgis et al. 2011). However, there is also support for contact theory. Research has found that living with a large racial outgroup can reduce prejudice (Oliver and Wong 2003; Pettigrew, Wagner, and Christ 2010) or increase racial tolerance (Laurence 2011; Marrow et al. 2019).
Recent research on racial diversity and intergroup relations has found that minority population growth is more influential than minority population size. A key rationale of this argument is that people are attentive to the changes in racial composition in their surrounding areas, so the growth of local minority groups can influence attitudes toward other groups (Hopkins 2010). However, people may be accustomed to minority group size in their surrounding environment, so minority group size may have limited effects in changing people’s racial attitudes. Consistent with this argument, scholars have found that the growth of local minority groups influences residents’ perceptions of immigration (Newman and Velez 2014), attitudes toward outgroups (Abascal 2023), and voting for far-right politicians (Maggio 2021).
Existing studies reviewed so far have analyzed racial demographic change’s complicated impacts on intergroup relations. Based on these studies, I argue that racial demographic change may moderate the effects of local COVID-19 prevalence on the support for racist naming of COVID-19. The spread of COVID-19 may trigger different social reactions in places with different intergroup relations. In places with amicable relations across group boundaries, the COVID-19 outbreak may not lead to the xenophobia that casts blame on outgroups. By contrast, the pandemic may induce anti-outgroup hostility in areas where racial tensions are high. Local demographic change influences intergroup relations, thus moderating residents’ reactions to the COVID-19 outbreak. Because conflict and contact theories have divergent views on how local demographic change influences intergroup relations, I propose contrasting hypotheses on the moderating effects of demographic change.
According to conflict theory, minority population growth aggravates intergroup tensions. Thus, the spread of COVID-19 may result in more support for racist naming in these places with faster minority growth. As noted by past works, demographic change may increase the majority group’s hostility toward all minorities in general (Kinder and Kam 2010). For example, White people exposed to Latino population growth report greater resentment against Asian and Black people (Abascal 2023; Craig and Richeson 2014). These studies suggest that although the Chinese or Asian group is not the primary driver of recent racial demographic change in the United States, the decline in the White population may lead to hostility toward Chinese or Asians. Therefore, when COVID-19 spreads to areas with fast minority growth, the preexisting racial tensions may translate into xenophobia that blames Chinese or Asians for the COVID-19 outbreak. By contrast, intergroup relations should be more amicable in areas with limited growth of minority populations. The spread of COVID-19 in these areas is less likely to provoke a xenophobic response to the disease outbreak. This argument leads to a hypothesis:
Hypothesis 2a: The effects of COVID-19 mortality and infection rates on the support for racist naming of COVID-19 are stronger in counties with a larger increase in minority populations.
Contact theory predicts the opposite pattern. In areas with fast minority growth, intergroup contact can improve attitudes toward the encountered outgroup and minorities in general (Pettigrew 2009). For instance, White people with frequent contact with African Americans are receptive to Asian and Latino immigrants (Marrow et al. 2019). Positive attitudes toward minority groups may make it less likely to scapegoat outgroup members for disease outbreaks. Therefore, the spread of COVID-19 is less likely to generate resentment in counties with a large inflow of minorities. Informed by contact theory, I propose a contrasting hypothesis:
Hypothesis 2b: The effects of COVID-19 mortality and infection rates on the support for racist naming of COVID-19 are weaker in counties with a larger increase in minority populations.
Although conflict and contact theories feature contrasting propositions on the moderating effects of minority population growth, these arguments may not be as contradictory as they seem. Whether or not minority population growth amplifies the effects of COVID-19 spread may further depend on local economic conditions. In the next section, I articulate how local economic conditions may shape the moderating effects of minority population growth.
Economic Distress
Many studies have noted the link between economic distress and intergroup relations. Poor economic environments intensify the actual or perceived intergroup competition over scarce resources, which further leads to hostility toward immigrants/minorities or the support for anti-immigration policy (e.g., Bobo and Hutchings 1996; Citrin et al. 1997; Finseraas, Pedersen, and Bay 2016; Quillian 1996; Stephan and Stephan 2000; Wilkes, Guppy, and Farris 2008). In addition, research has noted that macro-economic changes during past decades—such as automation in manufacturing and economic globalization—have led to job displacement and income decline in Western societies, partly contributing to the rise of far-right movements (e.g., Goetz et al. 2019; Green and McElwee 2019; Jackman and Volpert 1996; Monnat and Brown 2017; Vasilopoulos et al. 2021).
Economic conditions and racial demographic change may jointly influence local intergroup relations, thus moderating the effects of COVID-19 prevalence. In other words, economic conditions, racial demographic change, and the COVID-19 prevalence may have a three-way interaction effect on the support for racist naming. As summarized in the previous section, a key mechanism linking faster minority growth and worse intergroup relations is that minority growth may lead to resource competition (Blumer 1958; Bobo and Hutchings 1996; Stephan and Stephan 2000). The extent to which minority growth increases competition is contingent on the economic context. In poor places, fast minority growth can strongly escalate intergroup competition due to limited economic resources (Knowles and Tropp 2018; Quillian 1995). Acting in tandem, fast minority growth and grim economic conditions can heighten racial tensions. In such a context, the adverse impacts of demographic change may prevail over its beneficial effects on intergroup relations. Therefore, in areas with fast minority growth and poor economic performance, the spread of COVID-19 may activate preexisting racial resentment. In these areas, a severe outbreak may produce a high level of xenophobia.
However, economic prosperity may alleviate the negative impacts of demographic change. Local industries can absorb the increasing supply of immigrant workers in areas with a booming economy without causing massive wage reductions and layoffs for native-born laborers (Peri 2007). Minority population growth may have limited effects on intensifying economic competition. In this situation, the conflict-triggering effect of minority population growth may be offset by contact opportunities across racial groups. Therefore, in places with fast minority growth and prosperous economies, intergroup relations could be relatively amicable. The spread of COVID-19 in these areas may not generate xenophobia. To conclude this line of reasoning, I propose the following hypothesis for a three-way interaction between COVID-19, minority growth, and economic conditions:
Hypothesis 3: In poor counties, minority population growth enlarges the effects of COVID-19 mortality and infection rates on the support for racist naming of COVID-19. However, in affluent counties, minority population growth does not amplify the effects of COVID-19 mortality and infection rates on the support for racist naming of COVID-19.
Data and methods
Twitter as Data Source
Twitter has become an emerging data source for social scientific studies. Sociologists, as well as scholars from other social disciplines, are beginning to use the massive volume of information generated by Twitter users for various academic ends, such as measuring public attitude toward immigration laws (Flores 2017), predicting congressional election results (DiGrazia et al. 2013), assessing neighborhood disadvantage (Levy, Phillips, and Sampson 2020), and detecting influenza outbreak (Culotta 2010). Compared with traditional survey instruments, one advantage of social media data is that it is better equipped to capture instant reactions to unexpected events. A growing body of literature has studied how the unexpected COVID-19 pandemic generates anti-Asian content on Twitter (Budhwani and Sun 2020; Chou and Gaysynsky 2021; Lwin et al. 2020; Pei and Mehta 2020).
One may be concerned with the representativeness of Twitter users. A recent Pew report revealed that Twitter users were younger, more educated, and more likely to be urban residents than the entire U.S. population (Perrin and Anderson 2019). The present study’s data showed a similar pattern of Twitter users. In counties with more tweets, there was a larger share of college graduates, a smaller share of Republican voters, and a lower median age (for detailed information, see Appendix Table 6 in the online version of the article). Although Twitter users are not perfectly representative, this problem did not inevitably invalidate this study’s findings. Young, educated residents usually tend to be liberal. If the disease outbreak, increasing racial diversity, and economic distress lead Twitter users to scapegoat outgroups, given the demographic skew we observed, any observed effects may underrepresent xenophobia in the overall population.
Tweet Extraction and Preparation
I acquired relevant tweets through Twitter’s official application programming interface. The collection process had several conditions. First, I extracted original tweets using a list of keywords that are the derivatives of the “Chinese virus.” The list included “Chinese virus,” “Chinesevirus,” “China virus,” “Chinavirus,” “Wuhan virus,” “Wuhanvirus,” “Kung Flu,” “KungFlu,” “Kung Fu Virus,” and “KungFuVirus.” Although Trump’s (2020) tweet did not mention the city of Wuhan, where the first COVID-19 cases emerged, naming the disease with the city of origin causes stigmatization, according to the standard of the World Health Organization (2015). Due to its racist implication, I decided to include the tweets that mentioned the “Wuhan virus” for analysis. Second, I collected tweets posted from March to August, a six-month period after Trump’s (2020) “Chinese virus” tweet. The main findings are based on the information gathered from March to August 2020. In addition, I tested if the main findings could remain robust with a shortened period from March to May (see Appendix Table 4 in the online version of the article). The models based on different periods yielded the same results. Third, I relied on users’ self-reported geographic locations in their profiles. It is a common practice to measure Twitter users’ geographic addresses based on their self-report locations (Budhwani and Sun 2020; Culotta 2010; Curtis et al. 2018; Flores 2017). Applying the aforementioned standards, I acquired 503,861 tweets published by 184,728 users in total. Among all the acquired data, 93,876 users—who were about 50.8% of all users in the data and posted 225,166 tweets—reported valid city- or county-level addresses. The percentage aligned with previous research, which showed that about 40% of Twitter users reported valid city- or county-scale locations (Hecht et al. 2011). Because a significant share of Twitter users’ profiles is location-tagged, this study can examine the county-level variation of online xenophobic response to COVID-19.
This study focused on tweets that supported the racial naming of COVID-19. However, some Twitter users opposed such naming. I employed supervised machine learning algorithms to differentiate tweets that support racial naming and those that oppose it. The supervised learning process worked as follows. As the first step, human coders labeled a random sample of tweets (N = 3,000) by hand. The coders classified the tweets into the “support” and “opposition” categories. The second step was using algorithms to learn the distinct patterns of the tweets belonging to different categories. I adopted ensemble learning, a technique that allows multiple algorithms to learn the categorization rules simultaneously and then aggregates the predictions of each algorithm. This method can achieve higher accuracy than relying on a single algorithm. The algorithms used in this study were logistic regression, support vector machines, and random forest. To improve prediction accuracy, I fine-tuned regularization parameters by cross-validation. The ensemble model predicted support for racist naming with an in-sample accuracy of 82%. As the last step, the model was then employed on the full set of tweets in the data to classify every unlabeled tweet as belonging to the support category or the opposition category. The support category includes 141,290 tweets published by 50,695 users. For detailed information for the classification process, see the Appendix Note in the online version of the article. For example tweets that support the racist calling of COVID-19, see Appendix Table 1 in the online version of the article.
Coding the Outcome Variable
To account for variations in population size, I calculated the ratio of Twitter users who tweeted to support the racist naming per 10,000 people for each county using the following formula:
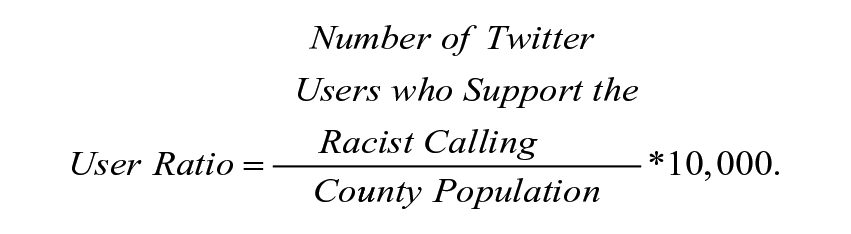
Following previous research (Budhwani and Sun 2020), I used the 10,000 people constant to make the user ratio easier to understand. Also, the infection and mortality rates, this study’s key predictors, are often shown as the rate per 10,000 population. Thus, using the 10,000 people constant for the user ratio kept the rate formula consistent throughout this study. The distribution of the user ratio was highly skewed. The user ratio ranged between 0 and 34.425, with an average of .633. It means that for an average county, less than 1 person in 10,000 tweeted to support the racist naming of COVID-19. The user ratios were substantial in some counties, up to 34 persons in 10,000. As noted earlier, many Twitter users in this study’s data did not report their county-level locations. If all users from a county did not report county location information, this county’s user ratio would be artificially 0 due to the missing location data. Therefore, the 0 may mean a complete lack of Twitter users who supported the racist naming or a lack of county-level location data provided by users.
Such a highly skewed distribution means that a small number of counties with large user ratios may disproportionately influence model estimation. To deal with this problem, I recoded the user ratio in two ways. First, I used a natural logged form for the ratio variable. The logged user ratio ranged between −3.070 and 3.540, with an average of −1.442. The second method was classifying counties into two groups, the high-support counties, which were those in the top quartiles of the user ratio (coded as 1), and the low-support counties, which were the remaining counties (coded as 0). The average user ratio of the high-support counties was 1.909, while the average was .207 for the low-support counties.
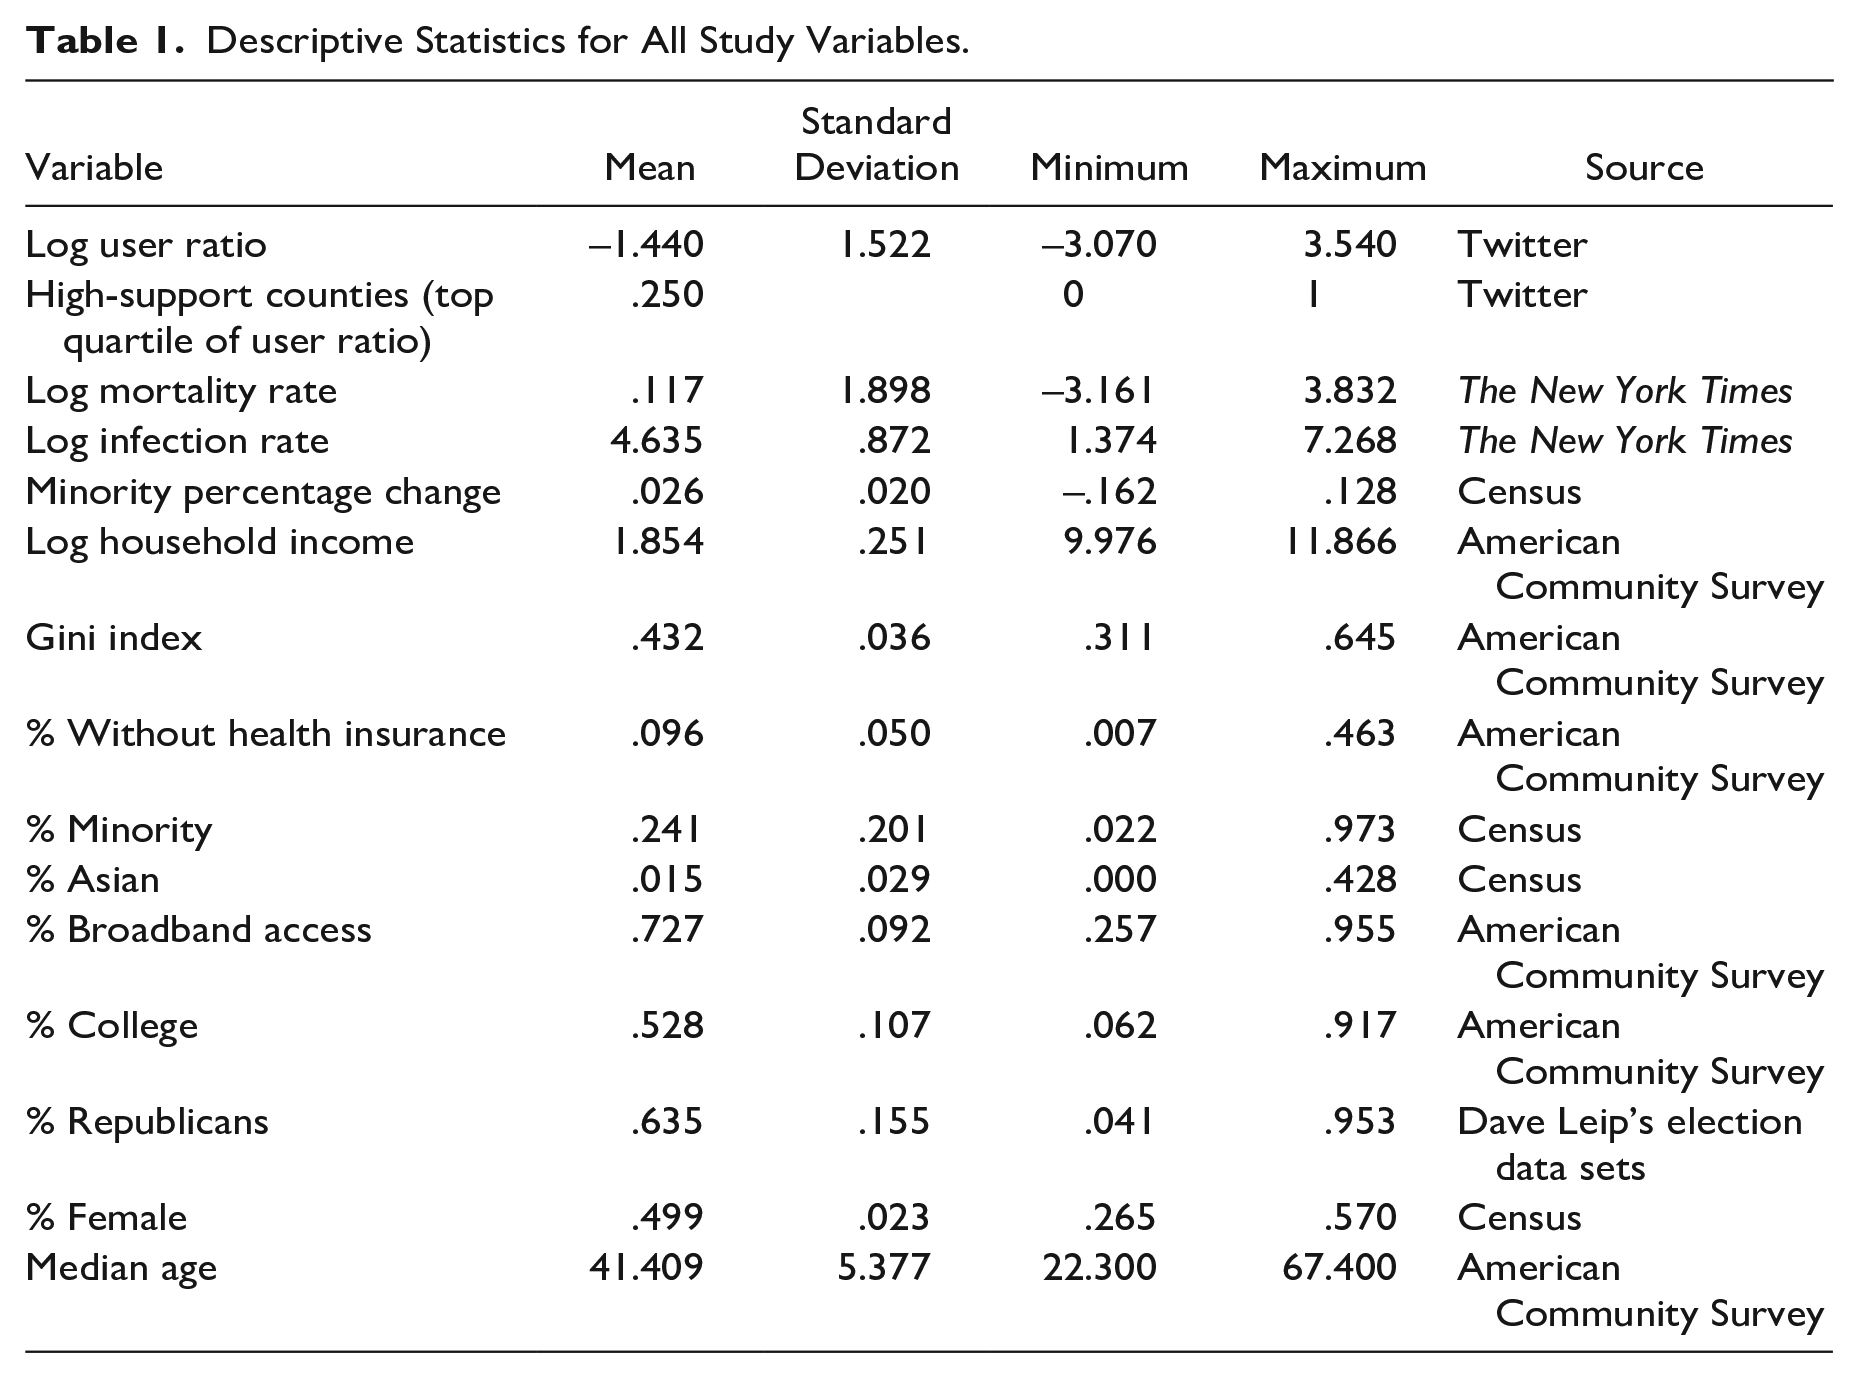
I estimated models for these outcome variables, respectively. I report in Table 3 (later in the article) the linear regression models based on the logged user ratio. I present the logistic regression models on high-support counties defined as the top quartile of user ratio in Appendix Table 3 in the online version of the article. Different approaches to coding the outcome variable yielded similar results, providing credibility to the findings’ robustness. The descriptive statistics for all study variables are presented in Table 1.
Descriptive Statistics for All Study Variables.
Key Independent Variables
I measured the county COVID-19 outbreak by the infection and mortality rates from March to August 2020 based on the data compiled by The New York Times (2021). I calculated the infection and mortality rates using the following formula:
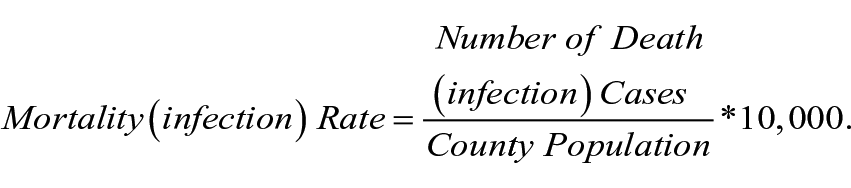
The average mortality rate was 3.404, ranging from 0 to 46.116. The average infection rate was 145.004, ranging from 3.953 to 1,433.889. I used a natural logged form for both infection and mortality rates because the infection and death rates’ effects on people’s emotions and attitudes may diminish as the rates increase. For example, an increase in COVID-19 cases from 0 to 100 may be more shocking to residents than an increase from 1,000 to 1,100.
To measure racial demographic change, I used the minority share of the county population (excluding non-Hispanic White) in 2010 as the baseline. I then subtracted the minority share in 2010 from the 2019 value to generate the minority percentage change variable. For example, if the minority share of a county increased from .05 to .15, the minority percentage change is .10. On average, the minority percentage change between 2010 and 2019 was about .026. Existing studies usually looked at the population change across a roughly 10-year period (Abascal 2023; Hopkins 2010; Newman 2013). According to these studies, a 10-year period is better than longer periods because people would probably be more attentive to the latest demographic change. I followed this common approach of the existing studies.
I adopted median household income (natural logged) to measure county-level economic conditions, with its values from 2019. Past works have widely used this indicator (e.g., Goetz et al. 2019; Green and McElwee 2019; Monnat and Brown 2017). Lower values mean more severe economic disadvantages.
Covariates
Table 2 presents the correlations of all predictors and covariates. I included in the models the variables that may be correlated with the key predictors and the outcome. First, I used the Gini index to measure economic inequality in the models. Inequality is often related to economic conditions (Piketty 2014). Economic inequality may also generate resentment against minority groups (Rodrik 2018). Second, I included the county percentage of households without health insurance in the models. In places where fewer families have health insurance, the spread of COVID-19 may cause more damage and higher levels of xenophobia that casts blame on outgroups.
Correlations between Predictors and Controls (N = 3,115).
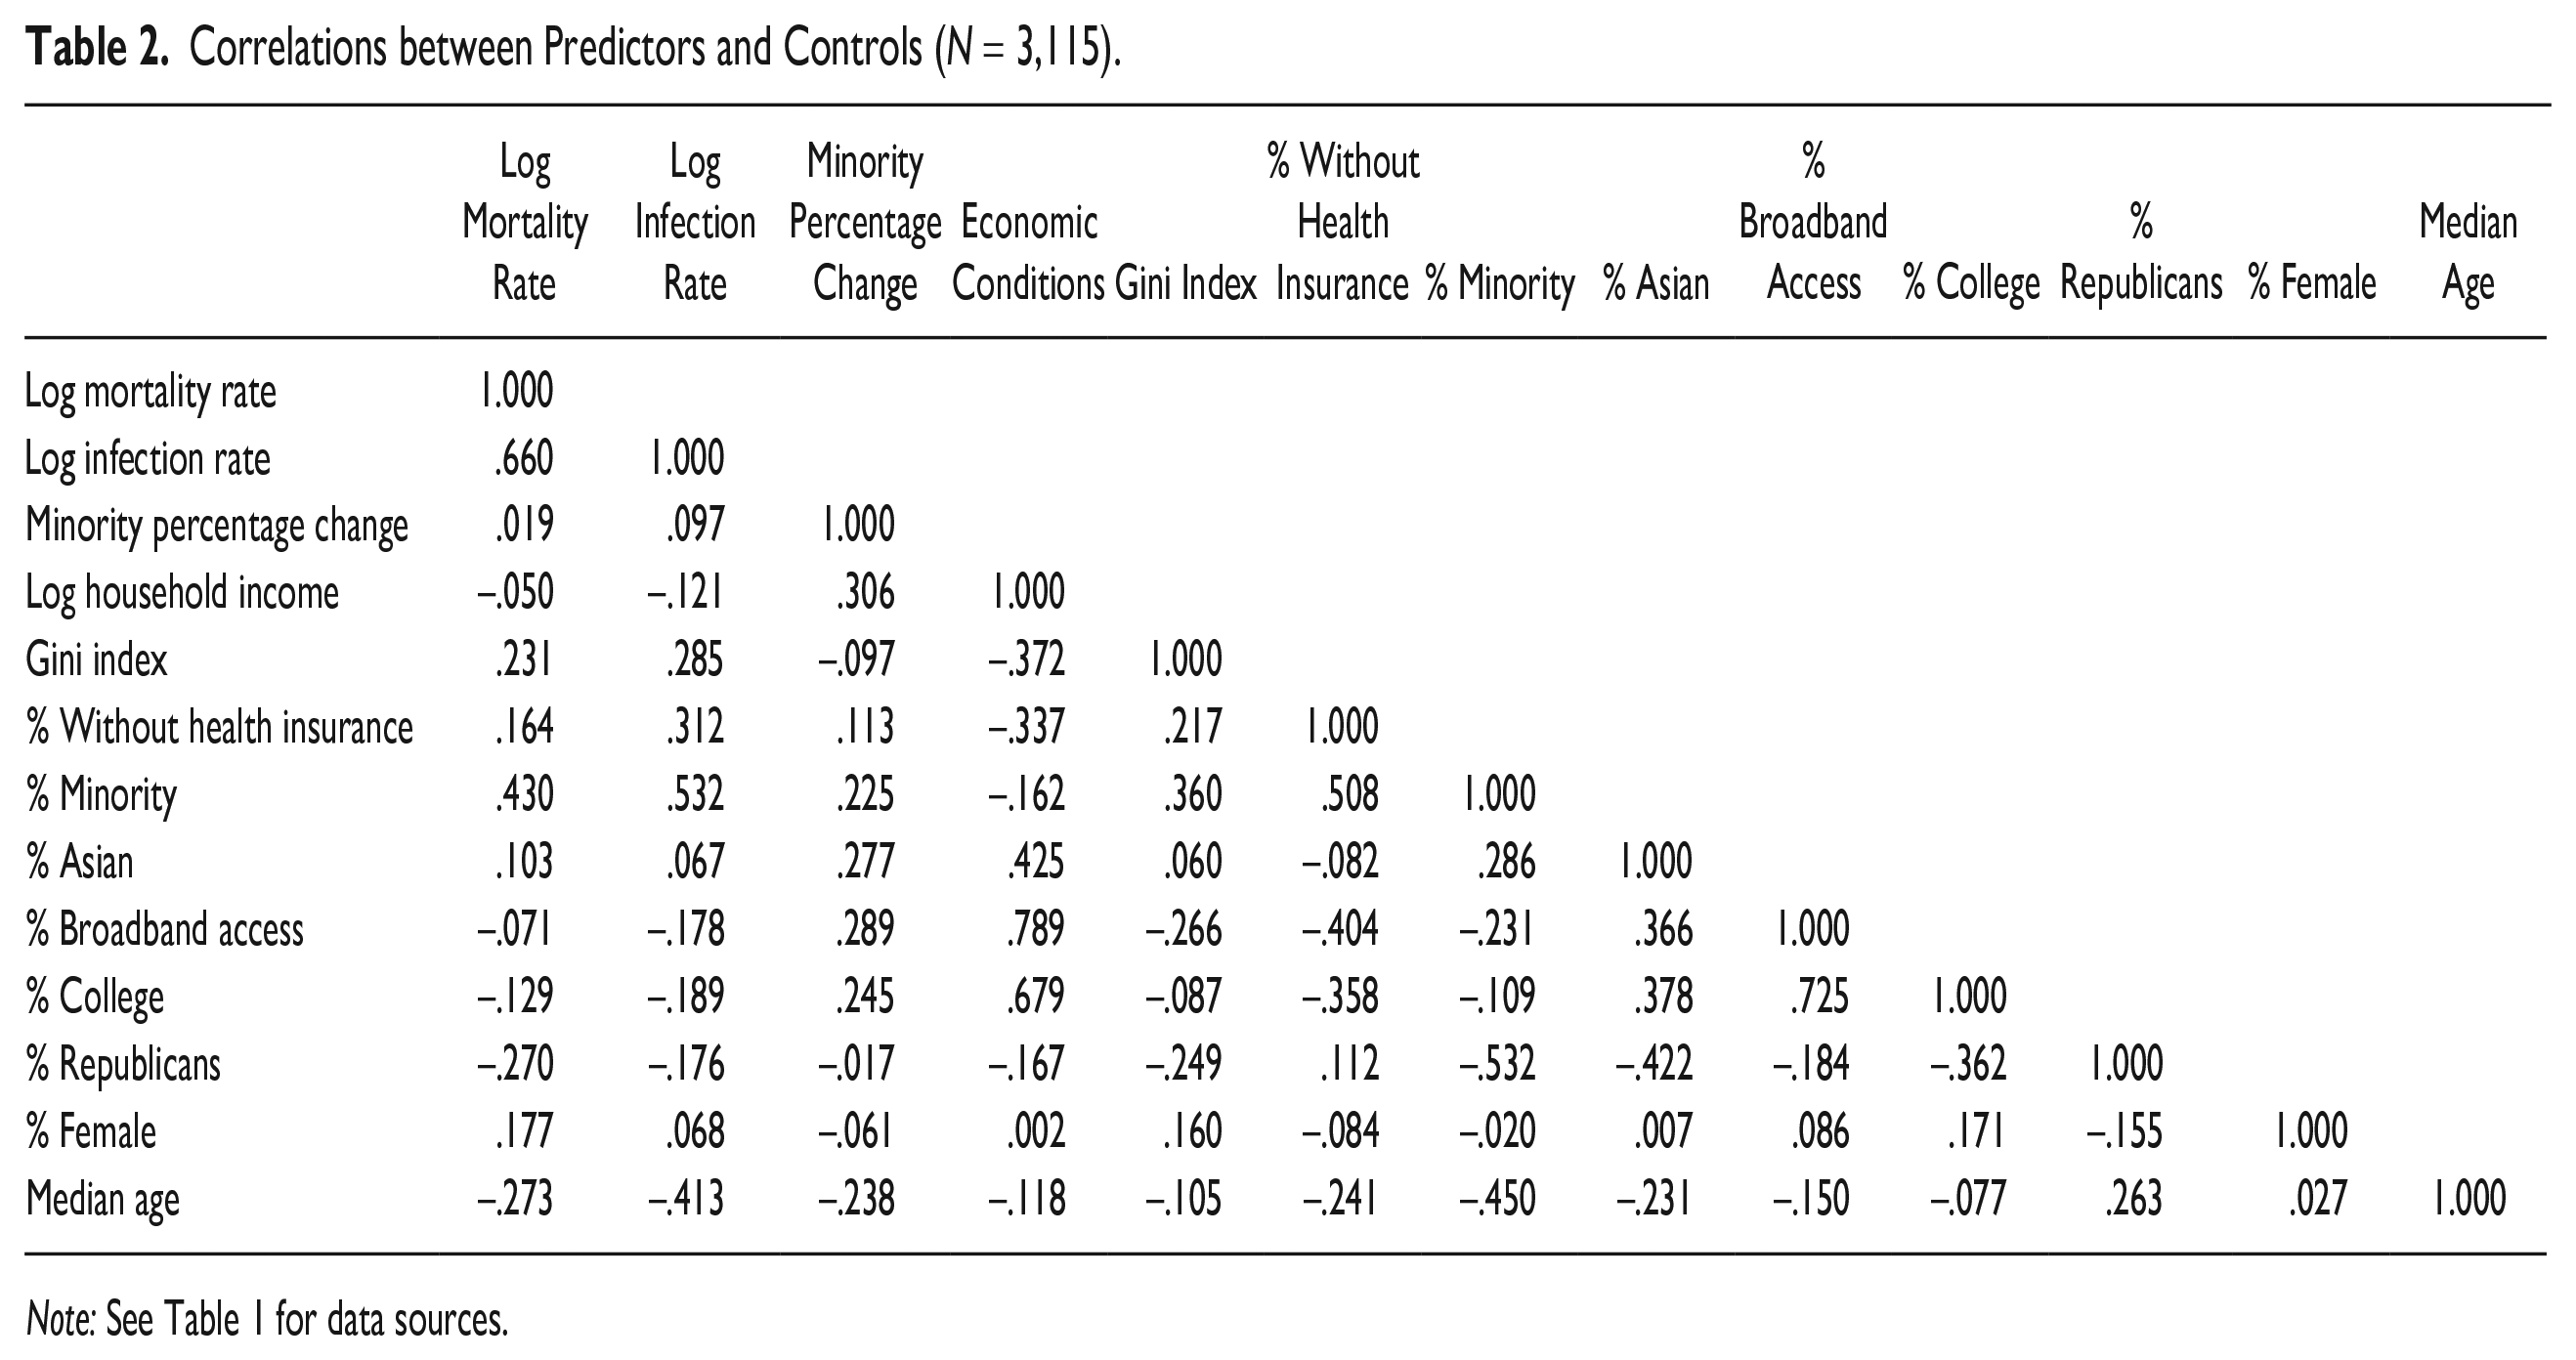
Note: See Table 1 for data sources.
Third, the minority share of the county population was a potential confounding variable. On the one hand, the minority share is related to the minority percentage increase. There are more racial minorities in counties with a larger increase in minority populations. On the other hand, there may be less support for the racist naming of COVID-19 in counties with more racial minorities. Thus, I included the minority share of the county population in 2019 in the models. Fourth, I adjusted for the Asian share of the county population. As shown in Table 2, Asian share was related to minority percentage change, a key predictor of this study. Meanwhile, a large Asian group size in an area may lead to anti-Asian hostility during the pandemic and support for racist naming of COVID-19.
Fifth, broadband internet infrastructure preconditions the use of social media networks. Without internet access, people cannot discuss local health crises on social media platforms. Internet coverage is often higher in high-income areas. Because internet coverage is a potentially confounding variable, I added the percentage of households with access to broadband internet. Sixth, an analysis of social media users’ demographic characteristics reveals that individuals with a college education are far more likely to use Twitter than those without (Perrin and Anderson 2019). There may be more discussions of COVID-19 on Twitter in counties with more college graduates. Local economic conditions, a key predictor in this study, are correlated with residents’ educational attainment. Thus, I adjusted the models for the county percentage of residents with a college education.
Seventh, political party affiliation at the county level is associated with COVID-19 spread. Democratic-leaning urban counties were affected during the early months of the pandemic (Kaashoek et al. 2022). Also, Republicans are found to be less likely to use Twitter than Democrats (Perrin and Anderson 2019), and so there may be less discussion of COVID-19 in Republican-majority counties (Mutz 2018). To account for the county-level political partisanship, I included the percentage of voters who supported Donald J. Trump in the 2016 presidential general election. In addition to these variables, I added the shares of female residents and the median age of the county population, which are common demographic variables in past works (Maggio 2021; Monnat and Brown 2017).
Multilevel Modeling
I employed multilevel modeling techniques to account for the hierarchical structure of the present study’s data. This study’s basic analysis units were counties nested within states. The counties in the same state may share similar racial cultures and health care systems. Using ordinary regression violates an assumption that cases should be independent of each other and therefore miscalculates the standard errors. Multilevel modeling was thus appropriate for this study because it accounted for the interdependence of cases. In this study’s models, I set the intercept to vary across states, meaning that the state-level mean of logged user ratio differs. I used Stata 17.0 to estimate the multilevel regression models.
Results
Spatial Distribution of User Ratio
Figure 2 shows the geographic variation of the user ratio across counties. The user ratio is higher in the West Coast, the Northeast, and some parts of Florida and Texas. Also, the user ratio tends to be higher in counties around major cities. By contrast, it is lower in the Midwest and the Appalachia region. Such geographic variation suggests that certain contextual factors may influence people’s attitudes and that it is necessary to employ multilevel models to account for between-state variance. The following section explores the effects of health, economic, and demographic contexts.
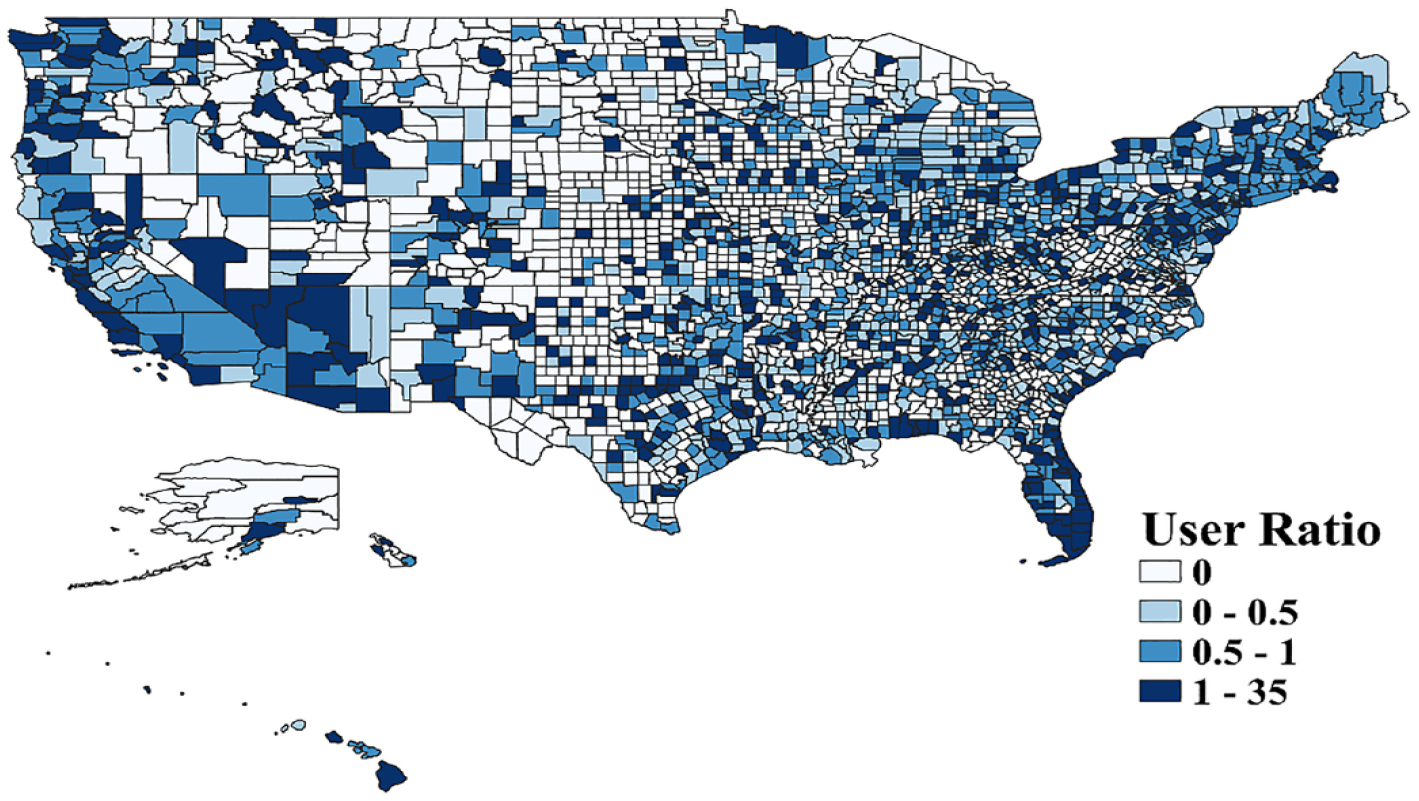
Spatial Distributions of the User Ratio per County (N = 3,115).
Regression Analysis
I first ran an unconditional model on the logged user ratio without any covariates (not shown). The interclass correlation is about .132, which means that about 13.2% of the total variance in the logged user ratio can be attributed to between-state differences. Therefore, it is proper to use multilevel regression models to account for the between-state variance along with the within-state variance.
Table 3 summarizes the multilevel linear regression models for the logged user ratio. Model 1 includes the key predictors and covariates. Compared with the unconditional model (not shown), Model 1 explained 38.8% of the between-state variance and 29.4% of the within-state variance. Stata 17.0 does not provide postestimation commands to check multicollinearity after multilevel regression models. Alternatively, I estimated an ordinary least sqaures regression model for the same set of variables and then conducted the variance inflation factor (VIF) test. The VIF test shows that the mean VIF value is 2.25, and the largest VIF value is less than 4. According to the model result, the effect of the logged COVID-19 mortality rate is significant (β = .100, SE = .015), suggesting that in counties with more COVID-19-related deaths, there is greater support for racist naming. This finding provides evidence for Hypothesis 1, which expects a positive association between the local COVID-19 outbreak and the support for racist naming.
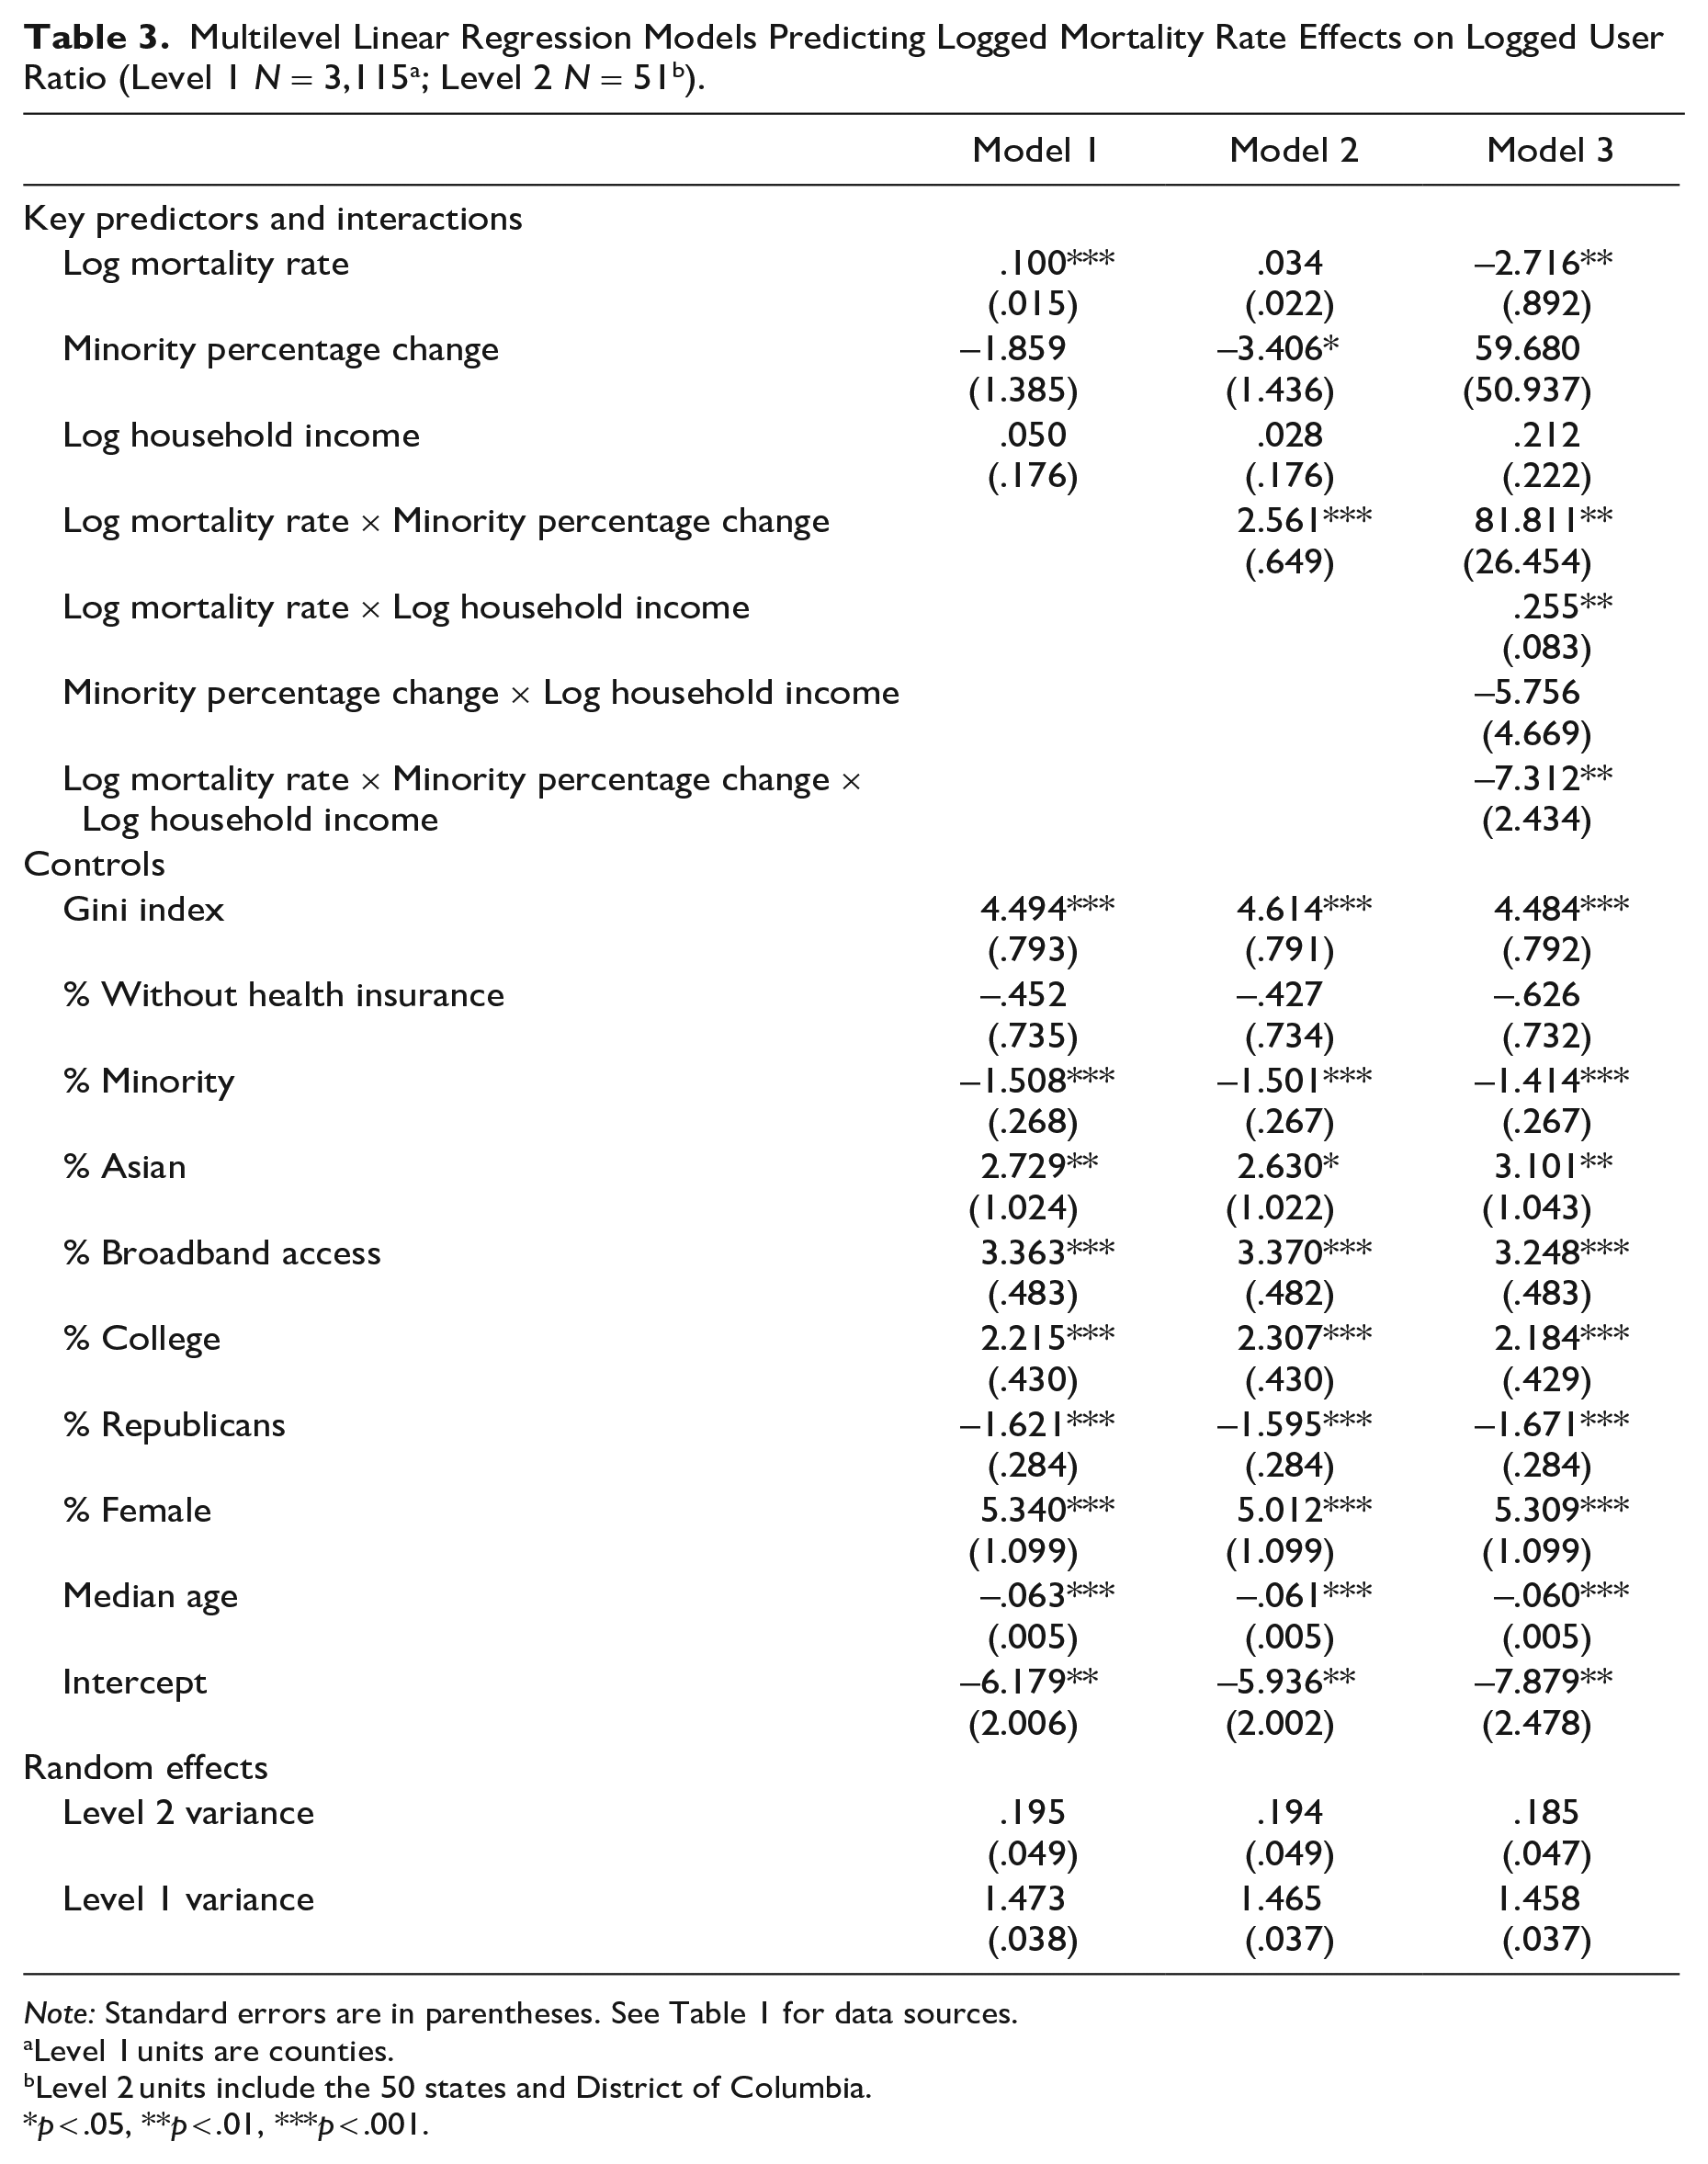
Note: Standard errors are in parentheses. See Table 1 for data sources.
Level 1 units are counties.
Level 2 units include the 50 states and District of Columbia.
p < .05, **p < .01, ***p < .001.
Model 2 estimates the interaction between minority percentage change and logged COVID-19 mortality rate. The interaction coefficient is significant (β = 2.561, SE = .649), revealing that the effect of mortality rate depends on minority percentage change. Figure 3 displays this interaction effect. In counties with slow minority growth, the logged mortality rate has limited effects. However, as the minority groups grow faster, the logged mortality rate’s effects are stronger. These results suggest that in counties with a larger increase in minority populations, the COVID-19 mortality rate has larger effects on generating xenophobia. The finding aligns with Hypothesis 2a, which expects that racial demographic change exacerbates intergroup competition, thus amplifying the detrimental effects of COVID-19 on intergroup relations.
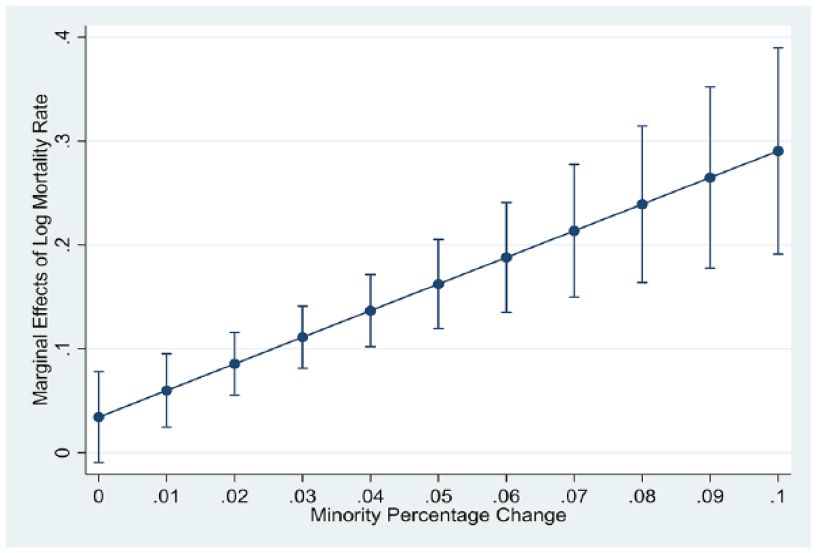
Predicted Marginal Effects of Logged Mortality Rate across Minority Percentage Change, Model 2 in Table 3 (N = 3,115).
Model 3 shows a significant three-way interaction between logged mortality rate, minority percentage change, and economic conditions (β = −7.312, SE = 2.434), suggesting that economic conditions shape the moderating effects of the minority percentage change. Figure 4 visualizes the moderating effects of minority percentage change in different economic contexts. The top graph shows the interaction effect between minority percentage change and logged mortality rate in poor areas (which is defined as 1 SD below the mean). The mortality rate’s effects are larger as minority groups grow faster in poor areas. The bottom graph shows the interaction effect in question in affluent areas (1 SD above the mean). The effects of the mortality rate are stable as minority groups grow faster in affluent areas. These findings provide evidence for Hypothesis 3. In poor counties, minority population growth amplifies the effects of COVID-19 mortality rates on the support for racist naming of COVID-19; in affluent places, however, minority population growth does not amplify the effects of COVID-19 mortality.
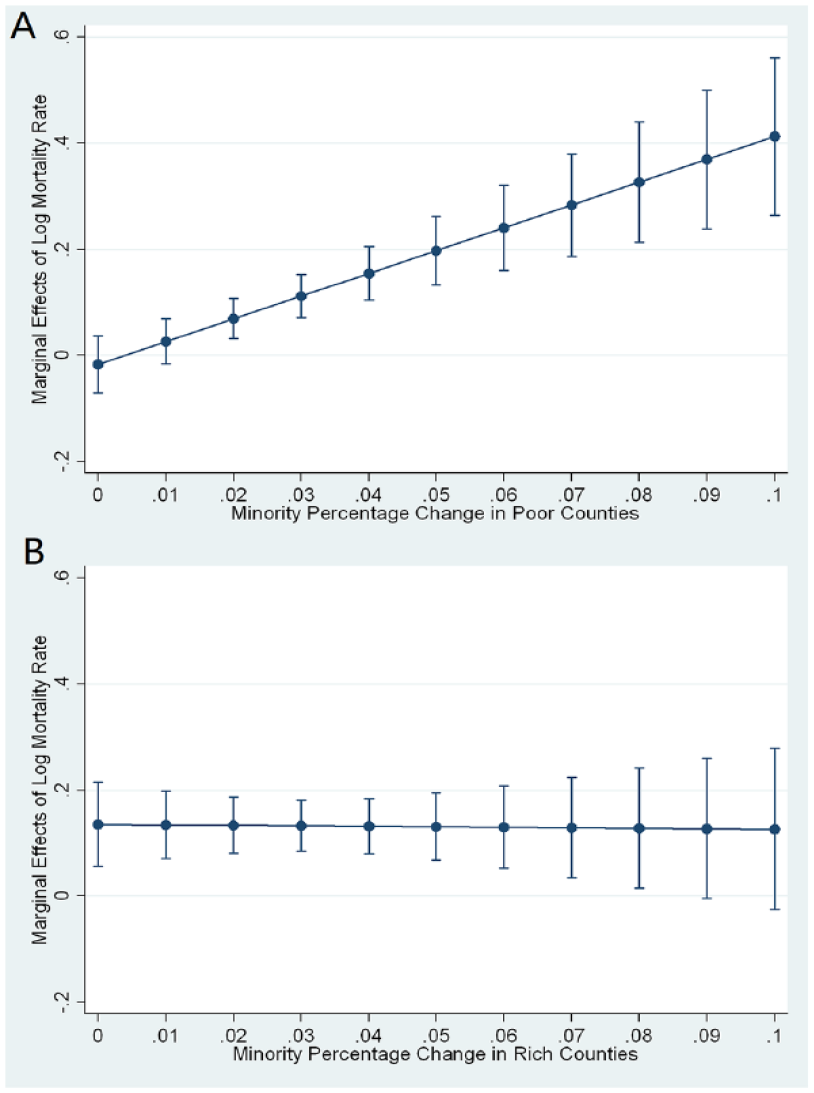
Predicted Marginal Effects of Logged Mortality Rate across Minority Percentage Change and Economic Conditions, Model 3 in Table 3 (N = 3,115). (A) The Interaction between Logged Mortality Rate and Minority Percentage Change in Poor Counties (1 SD below the Mean). (B) The Interaction between Logged Mortality Rate and Minority Percentage Change in Rich Counties (1 SD above the Mean).
Additional Analysis
I replicated the analysis by replacing the mortality rate with the infection rate (see Appendix Table 2 in the online version of the article). As shown in Appendix Table 2, the logged infection rate is positively associated with the logged user ratios, meaning that in places with higher infection rates, there is greater support for the racist naming of COVID-19. Also, the effects of infection rate are dependent on minority percentage change. The infection rate leads to greater support for the racist naming in places with larger increases in minority populations. Furthermore, the three-way interaction between economic conditions, the infection rate, and minority percentage change is significant. The minority percentage change amplifies the effects of logged infection rate mainly in poor places. Generally, the infection rate models yield substantially similar results to those with the mortality rate.
The outcome variable in Table 3’s models is the logged user ratio. To assess the robustness of these findings, I repeated the analysis with a binary outcome variable in which the counties in the top quartile of the user ratio are classified as high-support counties (coded as 1) and the others as low-support counties (coded as 0). According to the model results (see Appendix Table 3 in the online version of the article), the COVID-19 mortality rate is positively associated with high-support counties, suggesting that the counties with more death cases are more likely to have strong support for the racist naming of COVID-19. The effects of logged mortality rate are moderated by minority percentage change and economic conditions. In counties with faster minority growth and poorer economies, the effects of the COVID-19 mortality rate become stronger. Generally, the core findings in the logistic models are consistent with those in Table 3. Therefore, these findings are robust across different approaches to coding the outcome variable.
As articulated in the methodology section, I collected the relevant tweets posted from March to August 2020. The model results could change if the analysis is based on a different period. I checked the model robustness by using the tweets posted from March to May 2020, the early three months of the pandemic in the United States. During this shortened period, the user ratio ranges between 0 and 28.565, with an average of .485. The average mortality rate during this period is about 1.291, ranging between 0 and 30.477. The models with the three-month tweets yield substantially similar findings (see Appendix Table 4 in the online version of the article). The logged COVID-19 mortality rate is positively associated with logged user ratio, and this association depends on demographic and economic contexts. The model findings are robust with different periods of analysis.
The spread of COVID-19 generates hostility toward Asian groups. One may wonder if the Asian population growth moderates the relationship between COVID-19 mortality and the support for racist naming. I measured the Asian population growth by subtracting the Asian share of the county population in 2010 from the number in 2019. The interaction between the Asian percentage change and logged mortality rate is not significant (see Appendix Table 5 in the online version of the article). The finding means that local Asian population growth does not condition the mortality rate’s effects.
I further checked whether the missing data influenced the model results. The Twitter data that I collected contains 184,728 users in total, among which 36,151 users did not provide any information for their specific locations, 54,701 users reported a valid state location but without a valid county location, and 93,876 users reported both state and county locations. The missing data consist of two groups: The first group is the 36,151 users without any location information, and the second group is the 54,701 users with only state locations. I focused on the second group. Because these users reported their state locations, I can explore the state-level distribution of these users. First, Appendix Table 7 in the online version of the article summarizes each state’s missing data percentage. Second, I explored how key demographic, economic, and political variables are related to the percentage of missing data. Appendix Table 8 in the online version of the article shows that state-level racial demographic composition and college education are related to the percentage of users missing county locations. However, the percentage is not associated with state-level economic conditions, political partisanship, and COVID-19 mortality rates. Third, I checked this study’s core findings by adding the state-level percentage of users missing county locations in the models. According to Appendix Table 9 in the online version of the article, the percentage of missing data does not change COVID-19 mortality rates’ effects and interactions with demographic and economic contexts. Thus, I have not found that the percentage of missing data substantially distorts this study’s findings.
Discussion
Summary of Results
The hostility toward minority groups has been surging in recent years due to the COVID-19 pandemic. To understand such a xenophobic reaction to the pandemic, I explored contextual determinants underlying the support for racist naming of COVID-19 on Twitter. I collected the tweets that supported the racist naming posted by U.S. users between March and August 2020 and then matched the users’ locations with county-level census information. This novel approach helps examine how social context affects public opinions on unexpected events.
This study’s findings indicate that the spread of COVID-19, racial demographic shift, and economic distress jointly explain the support for racist naming of COVID-19. In counties with higher COVID-19 mortality and infection rates, there is greater support for the racist calling of COVID-19. Moreover, the effects of mortality and infection rates depend on local demographic change. The mortality and infection rates have stronger effects in counties with a larger increase in minority populations. Besides, economic conditions shape the moderating effects of minority population growth. The minority population growth amplifies the effects of mortality and infection rates, mainly in poor places.
Implications for the Literature
This study provides new evidence to the theories on disease-induced xenophobia. The othering and disease-avoidance theories from different perspectives have explained how the outbreaks of contagious diseases generate hostility toward minority groups (e.g., Crawford 1994; Eichelberger 2007; Faulkner et al. 2004; Joffe 1999; Kurzban and Leary 2001). In the COVID-19 case, empirical studies have noted that worries about the coronavirus or exposure to COVID-19-related information led to anti-Chinese or Asian discrimination (e.g., Gover et al. 2020; Li and Nicholson 2021; Reny and Barreto 2022; Wu et al. 2021). This study provides further evidence by showing how the severity of COVID-19 in an area influences residents’ tendency to cast blame on minority groups. The finding is in line with the established theories on disease-induced xenophobia.
However, the othering and disease-avoidance theories have not explicitly discussed how demographic and economic contexts shape the link between disease outbreaks and xenophobia. People living in different places may respond differently to the COVID-19 pandemic. Thus, this present study contributes to the knowledge of disease-induced xenophobia by exploring the moderation of demographic and economic contexts. Racial demographic change and economic distress can shape pre-outbreak intergroup relations, which affect how the COVID-19 pandemic brings resentment toward outgroup members. These findings suggest that scholars need to account for the preexisting social environment to understand the social consequences of public health crises.
This study also points to a heated debate on the social consequences of increasing racial diversity. On the one hand, conflict theory portrays increasing racial diversity as erosive to social cohesion. The majority group’s exposure to large minority groups is associated with the perception of status threat, the resentment against minority groups, and the voting for far-right politicians (e.g., Dinesen and Sonderskov 2015; Maggio 2021; Mutz 2018; Putnam 2007; Quillian 1996). On the other hand, contact theory views racial diversity as an essential source of contact and empathy across group boundaries (Allport 1954; Pettigrew 1998; Williams 1947). Living in areas with more minority groups should raise majority group members’ tolerance and reduce their discrimination toward minorities. This study’s model result aligns with conflict theory. In counties with faster growth of minority groups, the COVID-19 mortality and infection rates have larger effects on the support for racist naming. The result suggests that the increase in minority populations may worsen intergroup relations, thus making people more readily to scapegoat outgroup members for disease outbreaks.
In addition, this study’s finding provides more nuance to conflict theory. This study finds a significant three-way interaction between economic conditions, minority population growth, and the COVID outbreak. Mainly in poor places, minority population growth enlarges the effects of the COVID-19 outbreak. This finding suggests that the conflict-triggering effect of minority population growth mainly happens in poor places where economic resources are limited. By contrast, minority population growth may not deteriorate intergroup relations in prosperous places. The validity of conflict theory depends on economic contexts.
The present study finds that the growth of minority groups is a significant moderator, but the growth of Asian groups alone is not. This finding suggests that the resentment due to the growth of minority groups may translate into xenophobia against Asians during the pandemic. COVID-19-induced hostility is related to the overall change of racial composition in American society rather than to the change in Asian groups alone. This finding echoes the ethnocentrism theory (Kinder and Kam 2010). This theory argues that people have a psychological predisposition that tends to favor ingroup members while negatively evaluating all outgroups, no matter whether they are African, Hispanic, or Asian. Racial demographic change can activate this psychological predisposition. Therefore, when COVID-19 spreads to places with fast minority growth, the preexisting generalized hostility may turn into the blaming of Asian Americans.
Moreover, this study adds to the economic theory of xenophobia. Many studies have linked economic distress with xenophobia. People with economic hardship are more likely to be hostile toward outgroups, endorse anti-immigration policies, and vote for far-right politicians (e.g., Bobo and Hutchings 1996; Citrin et al. 1997; Goetz et al. 2019; Green and McElwee 2019). Most existing studies have focused on how economic distress directly influences xenophobia. Beyond the existing studies, this study shows that economic distress is also related to disease-induced xenophobia. Economic distress may act in tandem with racial demographic change, influencing how people respond to health crises.
Limitations to This Study
There are some limitations to this study. First, Twitter users may not represent the general population even if the size of Twitter membership continues to grow. The differences in socioeconomic characteristics between Twitter users and those who do not use Twitter may restrict the generalizability of this study’s findings. However, it is necessary to note that relative to the general population, Twitter users are younger and more educated and tend to be more liberal. These contextual determinants lead to the scapegoating of outgroups for the disease outbreak among Twitter users. It might be possible that these determinants have larger effects on those who do not use Twitter. Second, not all Twitter users who support the racist calling of COVID-19 may choose to tweet “Chinese virus.” Some users may avoid publicly discussing controversial topics on social media even if they internally endorse racist naming. Analysis of social media data may not capture the attitudes of all users. Third, I removed the tweets without valid location information from the analysis. Additional analysis shows that the state-level percentage of users with missing location information does not substantially change this study’s findings. Future research may further examine whether there are systemic differences between the users who report their locations and those who do not.
Conclusion
By linking social media information to census data, this study shows that the local COVID-19 outbreak, increasing racial diversity, and economic distress influence xenophobia in social reaction to the COVID-19 pandemic. This study introduces a novel approach to examining how social contexts influence public opinions and has implications for the literature on disease-induced xenophobia. The findings provide new evidence for the theories on the association between health crises and discrimination against minority groups. Moreover, the study suggests that the relationship between disease outbreaks and xenophobia depends on preexisting intergroup relations. In the case of the COVID-19 outbreak, racial demographic change and economic distress condition how people respond to this health crisis in the United States.
Supplemental Material
sj-docx-1-hsb-10.1177_00221465231194355 – Supplemental material for Disease, Scapegoating, and Social Contexts: Examining Social Contexts of the Support for Racist Naming of COVID-19 on Twitter
Supplemental material, sj-docx-1-hsb-10.1177_00221465231194355 for Disease, Scapegoating, and Social Contexts: Examining Social Contexts of the Support for Racist Naming of COVID-19 on Twitter by Yun Lu in Journal of Health and Social Behavior
Footnotes
Funding
The author disclosed receipt of the following financial support for the research, authorship, and/or publication of this article: This work is supported by the National Social Science Fund of China, Grant No. 22CSH005.
Data availability statement
Supplemental Material
Appendices Table 1 through 9 and the Supplementary Material are available in the online version of the article.
Author Biography
References
Supplementary Material
Please find the following supplemental material available below.
For Open Access articles published under a Creative Commons License, all supplemental material carries the same license as the article it is associated with.
For non-Open Access articles published, all supplemental material carries a non-exclusive license, and permission requests for re-use of supplemental material or any part of supplemental material shall be sent directly to the copyright owner as specified in the copyright notice associated with the article.