
Abstract
The main purpose of this retrospective of the economic theory of alliances is to characterize three basic paradigms: purely public deterrence, spatial connectivity, and joint products. For each model, allies’ military expenditure (ME) responds differently to the aggregate ME of the other allies, known as defense spillins, thereby resulting in diverse burden sharing, allocative implications, membership composition, and institutional recommendations. The underlying theoretical models determine reduced-form equations for allies’ interdependent defense demands. We examine how changes in strategic doctrines, weapons technology, enemy threats, and membership composition affected NATO burden sharing and its allocative efficiency over time. Generally, changes that increase the share of excludable defense benefits possess a better prognosis for burden sharing and allocative efficiency. Principles and insights from the economic theory of alliances are related to defense demands at the operational level and for non-NATO alliances.
Keywords
Introduction
The origins of the economic theory of alliances can be traced back to two seminal contributions – The Logic of Collective Action (Olson 1965) and “An economic theory of alliances” (Olson and Zeckhauser 1966) – appearing some 60 years ago. In the pioneering studies, allies are viewed as sharing a pure public good in terms of deterrence of an enemy through a promised devastating retaliation (McGuire 1990; Schelling 1960). The theory underscores burden-sharing issues whereby rich (large) allies spend disproportionately large shares of their gross domestic product (GDP) on military expenditure (ME), thereby affording a free or easy ride to poor (small) allies. The hypothesized unequal burden sharing illustrates the so-called exploitation hypothesis of rich allies by poor allies (Murdoch 1995; Olson 1965; Sandler and Cauley 1975). In addition, alliance theory highlights the suboptimal provision of common defense owing to free riding to the detriment of the alliance’s mission to keep members safe. For pure public deterrence, there is no need to restrict alliance size because the entry of another ally implies no congestion costs on members, so that the entrant’s positive gain outweighs its zero inclusion costs.
The economic theory of alliances was immediately applied to the 15-member (at the time) North Atlantic Treaty Organization (NATO) for which Olson and Zeckhauser (1966) showed that the exploitation hypothesis held for 1964, the single year tested with a Spearman rank-correlation test between defense burdens (ME/GDP) and GDP. Subsequent tests of NATO burden sharing did not necessarily uncover disproportionate burden sharing among allies based on their ranked GDP (Khanna and Sandler 1996; Russett 1970; Sandler and Murdoch 2000). To accommodate such varied findings, the joint product model of alliances was formulated where allies’ defense activity generated multiple defense outputs that vary in their degree of publicness (Sandler 1977; van Ypersele de Strihou 1967). Depending on the mix of joint products, the broader model may or may not be associated with disproportionate burden sharing, defense suboptimality, or inclusive or exclusive alliances.
With President Trump assuming his second term, NATO burden sharing remains a top concern with European NATO allies scrambling to allocate at least 2 percent of their GDP to ME and 40 percent of their defense budgets to defense equipment, pledges made in principle at the Wales Summit of NATO in 2014 (Alozious, 2022; Becker et al., 2024; North Atlantic, 2014). More recently, the Vilnius Summit of 2023 has some NATO allies recognizing that exceeding the targeted 2 percent of their GDP is necessary, given Trump’s remarks about not defending NATO allies whose ME spending is too small. In March 2025, developments between the United States and Ukraine have European NATO members contemplating allocating upward of 3.5 percent of their GDP to defense (Economist 2025, 43).
Given the current interest in NATO’s challenges in Europe and beyond (e.g., the Middle East and North Africa), the economic theory of alliances remains highly relevant. Alliance transformations concern the evolution of strategic doctrine, development of weapons technology, the emergence of novel threats, and changes in NATO’s membership, making the applicability of the economic theory of alliances in a state of constant flux. Not only is the theory pertinent to NATO but it is also applicable to other military alliances associated with the European Union (EU), the African Union (AU), bilateral defense pacts (e.g., US-Israel, US-Japan, US-Philippines, US-Australia, and US-Republic of Korea), and Southeast Asia.
The primary purpose here is to present an up-to-date retrospective on what economic theory has taught us about past and present alliances, especially with respect to burden sharing, allocative efficiency, institutional form, and membership composition. Our aim is not to provide an exhaustive survey of the vast economic literature on alliances; instead, we focus on select contributions, especially those of the last 25 years, that offer the most profound insights relevant to today’s challenges. Thus, we emphasize recent developments concerning allies’ spatial-based defense demands, their operation-based defense demands, alliance composition, and other topics, not addressed in other surveys (Bogers et al. 2022; Sandler and Hartley 2001).
A few key insights from the survey are highlighted. First, strategic doctrine, weapons technology, allies’ threat perception, and alliance membership composition are the essential drivers of the mix of defense-derived outputs in an alliance. Second, the appropriate alliance model – pure public, spatial, or joint products – impacts burden-sharing behavior, allocative efficiency, and alliance size. Third, the relative geographical locations of allies and enemies play a crucial role in the extent of alliance free riding. Fourth, the nature of the dependent variable in allies’ demand estimates hinges on the antecedent theoretical model, which is not generally specified. Fifth, alliance theory has much to say about burden sharing and allocative decisions for non-NATO alliances. Sixth, when defense demand is disaggregated to the operational level (i.e., personnel, operations and maintenance (O&M), equipment, and infrastructure), various allocative decisions are impacted.
Two Basic Conceptual Paradigms of Alliances
The pioneering model of the economic theory of alliances viewed allies as jointly contributing to a defense activity that is a pure public good (Olson and Zeckhauser 1966). To qualify, defense benefits must be nonrival so that one ally’s consumption of a unit of the defense activity does not detract, in the slightest, from the consumption opportunities still available to other allies from that same unit. Defense benefits are nonexcludable if, once provided by any ally, those benefits cannot be withheld from other allies. Olson and Zeckhauser (1966) characterized nuclear-weapon-based deterrence as satisfying both properties of pure publicness. Deterrence benefits are nonrival among allies because the embedded threat of unacceptable retaliatory damage aimed at an aggressor can be made on the behalf of any number of allies without causing benefit rivalry. In terms of nonexcludability of deterrence benefits, the alliance must be perceived as unified so that the threatened retaliation is automatic on behalf of any ally whose territory or interests are encroached. By stationing sizable US forces in Europe, the nonexcludability of US promised retaliation was credible owing to US casualties from a European attack. That credence was further enhanced through US and other allies’ foreign direct investments and trade flows throughout NATO countries. Moreover, citizens from NATO countries resided in other NATO countries. Thus, any attack on one ally would result in severe collateral economic and human damage on other allies, leading to an interest in a collective response.
The original economic theory of alliances rested on some important implicit assumptions: (1) a single shared defense good, (2) a unitary decision maker in each ally, (3) identical per-unit defense costs throughout the alliance, (4) simultaneous defense allocations by allies, and (5) perfect substitutability of defense output in the alliance. Each of these assumptions can be relaxed with easy-to-derive changes to the theory’s predictions.
The second (more general) paradigm of the economic theory of alliances can be traced to van Ypersele de Strihou (1967), who characterized allies as sharing ally-specific defense benefits that are private among allies, but public within an ally. Private defense benefits may include protecting coastal waters and resources, dispatching national guard, addressing disaster relief, curbing illegal immigration, quelling domestic unrest, and maintaining colonial interests. Private defense benefits are rival and perfectly excludable among allies. Unlike pure public defense benefits, allies’ private benefits are not substitutable among allies.
The joint product model went a step further than van Ypersele de Strihou’s (1967) formulation by allowing a defense activity to produce multiple defense outputs that vary in their degree of publicness (McGuire 1990; Sandler and Forbes 1980). That is, a defense activity may yield ally-specific private benefits, purely public deterrence, and impurely public damage-limiting protection. The latter protection is applicable to efforts by allies to fortify a front against an enemy incursion with conventional forces. In that scenario, ally-deployed forces along a perimeter may result in a spatial rivalry in terms of force thinning as forces are spread over a longer exposed border (Sandler 1977). Concentrating troops and weapons along one stretch results in greater vulnerabilities elsewhere on the front, consistent with partial rivalry of benefits. Moreover, force placement is at the discretion of the providing ally, resulting in partial excludability.
With defense joint products, the alliance may resort to alternative allocative mechanisms depending upon the mix of outputs and their publicness. Ally-specific outputs can be allocated by markets, while damage-limiting protection can be allocated by a club arrangement. The latter charges a toll per-unit of protection equated to the marginal thinning costs imposed on allies, with the toll proceeds going to financing shared troops and equipment (Buchanan 1965; Sandler 1977). Pure public deterrence poses the greatest allocative challenge owing to its perfect substitutability among allies. As the ratio of private and excludable defense benefits to all defense benefits received increases toward 1, market and club-based arrangements can foster efficient allocation.
Theoretical Models
Pure Public Good Model of Alliance
In each ally, a unitary decision maker (e.g., the Prime Minister, President) decides its government’s allocation between private nondefense consumption and defense activity to maximize its perceived social welfare or utility of the constituency. As such, representative ally i’s utility function is denoted by

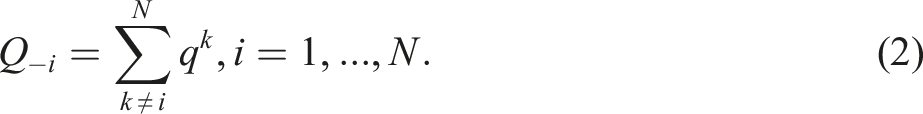
At this point, the unit weights on each ally’s defense provision implies perfect substitutability among the allies’ defense spending, namely,
In the above utility function, the following conditions hold:
The budget constraint for ally i is

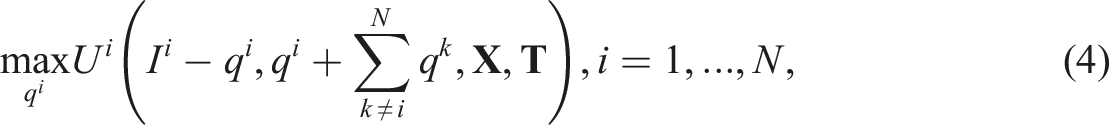
First-order conditions (FOCs) associated with equation (4) can be expressed as


There are a number of things to highlight about these defense demand functions. First, they correspond to a static Nash-equilibrium allocation of defense spending among the allies. Second, they generally correspond to positive contributions by each of the allies, which may not be the case for disparate-sized allies, where some small allies may contribute nothing. Third, given the explicit theoretical derivation, the dependent variable in an ally’s defense demand is its ME rather than its defense burden, ME/GDP. Fourth, if defense is an income normal good, then an ally’s defense demand responds positively to increases in income (Bogers et al. 2022; Murdoch and Sandler 1984; Sandler and Murdoch 1990; Smith, 1980, 1995). Generally, income normality characterizes allies’ defense demands (Dudley and Montmarquette 1981; McGuire and Groth 1985). Fifth, for pure public defense, allies are anticipated to respond negatively to spillovers in less than a dollar-for-dollar fashion (Cornes and Sandler 1996). Sixth, an ally may spend more on defense as population increases when the ally’s decision maker places greater importance on protecting people. In contrast, the decision maker may spend less on defense in reaction to population increases if a greater need for social programs is perceived (Dunne and Perlo-Freeman 2003). Given that allies’ response to increased population can be positive or negative, allies’ actual response is an empirical question. Seventh, threat factors – for example, enemy ME spending increases – are anticipated to raise allies’ defense demand.
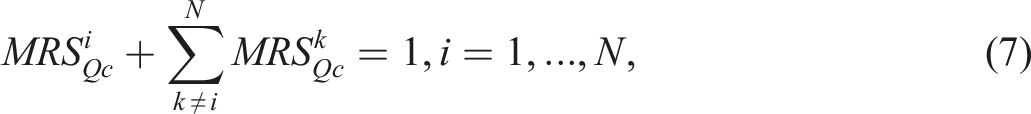
Finally, we consider the normative implications of the pure public theory of alliances. To characterize the Pareto-optimal defense provision, the maximization of the social welfare function of the alliance must be considered (Olson and Zeckhauser 1966; Sandler and Hartley 1999). In so doing, the optimality condition for defense provision is:
Spatial or Connectivity Models of Alliances
The canonical pure public model of alliances can be easily extended to allow for a wide range of spatial or institutional connectivity considerations through an adjustment to spillins. Ally i’s defense spillins are now generalized to equal
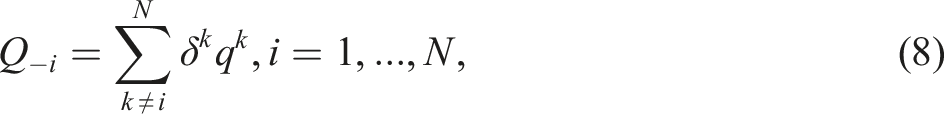
For the spatial representation, the allies’ utility optimization problem requires a simple modification to equation (4), namely, to replace Q with
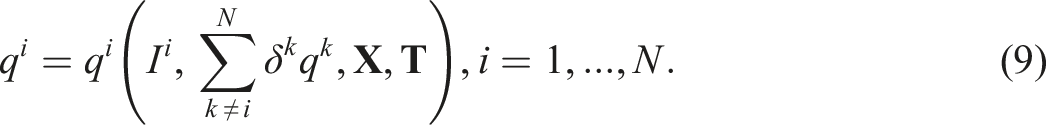
In estimating equation (9), the spatial spillins weights assume an important role in gauging spillins-induced free riding among allies. When free riding is more limited with some spatial weighting schemes, the extent of suboptimality (thus, the need for corrective policy) declines as defense spillins are constrained. The roles of income, population, and threat in affecting an ally’s defense demand remain the same as in the pure public, nonspatial representation. When
Joint Product Model of Alliances
Prior to the spatial representation of defense demands, the initial and far-reaching extension of the pure public alliance model involved the allowance of joint defense products. For simplicity, we assume just two joint products – a country-specific defense output,
Given fixed proportions, alliancewide total deterrence, Z, equals


When jointly produced defense benefits include private and public outputs, the joint product representation of an alliance yields some important differences when compared to the pure public deterrence model. First, the Nash equilibrium implies that

An important extension is to permit additional joint products such as damage-limiting protection along a common front, subject to force thinning (McGuire 1990; Takabatake 2024). With another jointly produced defense benefit, the optimal provision condition in equation (13) would now have a third MRS expression weighted by the fixed proportion parameter for producing damage-limiting defense. With force thinning, an optimal alliance membership must balance marginal thinning costs caused by an entrant with the cost savings achieved from an additional ally (Sandler 1977). The expansion decisions in NATO from 1999 on was more based on political consideration than on thinning concerns.
Another extension to the joint product model, not yet done, is to include spatial aspects with respect to spillins. To accomplish this extension, we must use
Application to the NATO Alliance
On April 4, 1949, the North Atlantic Treaty was signed in Washington, DC by Belgium, Canada, Denmark, France, Iceland, Italy, Luxembourg, the Netherlands, Norway, Portugal, the United Kingdom, and the United States, thereby giving birth to NATO (NATO Office of Information and Press 1995). Greece and Turkey joined in 1952; West Germany joined in 1955, and Spain joined in 1982. After 1999, NATO doubled in size growing from 16 to 32 members.
Since 1999, NATO’s eastward expansion means that the alliance now includes seven ex-Warsaw Pact countries – Albania, Bulgaria, Czechoslovakia, East Germany, Hungary, Poland, and Romania. Their inclusion along with Estonia, Latvia, and Lithuania (three of the Baltic states) greatly angered Putin. Other NATO entrants include Slovenia (2004), Croatia (2009), Montenegro (2017), and North Macedonia (2020). Finland and Sweden joined NATO in 2023 and 2024, respectively. Finland’s membership is particularly noteworthy given its 830-mile border with Russia, greatly augmenting NATO’s exposed border (Economist 2022).
There are two key articles of the NATO treaty to emphasize (NATO Office of Information and Press 1995, 231-234). Article 5 commits members to confer and react to an attack on a NATO member in which the collective is only committed to an appropriate unanimous response, which need not include armed retaliation. Article 6 broadens members’ strategic interests to include their territorial holdings and interests, thus paving the way for crisis management and peacekeeping beyond the members’ boundaries, known as out-of-area missions.
NATO Strategic Doctrines and Implications
Over its lifetime, NATO altered its strategic doctrine in reaction to evolving threats. At its birth, NATO confronted a Soviet Union seeking a westward expansion to acquire satellite states. Contrary to NATO, the Soviet Union continued to amass post-World War II conventional forces, intended to offset somewhat NATO’s superiority in strategic nuclear weapons. In that environment, NATO adopted a strategic doctrine of mutual assured destruction (MAD) deterrence, whereby any further Soviet expansion would trigger a devastating nuclear attack by NATO, as embedded in Directive MC 48, approved in 1954 by the North Atlantic Council (Rearden 1995, 73). At the time, NATO’s possession of a first-strike advantage gave credence to MAD.
After the Soviet Union backed down during the Cuban missile crisis in reaction to US strategic pre-emptive superiority, the Soviets embarked on a massive buildup of its strategic nuclear forces. Given the ensuing greater parity in strategic forces, the United States adopted the doctrine of flexible response in 1967, whereby NATO would respond in a measured fashion to Warsaw Pact provocations (Rearden 1995). Directive MC 14/3 formally embodied the doctrine of flexible response, where Soviet conventional aggression in Europe would be first met with a NATO conventional force response that would escalate as warranted (North Atlantic Military Committee, 1968). Flexible response meant that conventional, tactical nuclear (short-range battlefield nuclear weapons), and strategic nuclear forces became complementary (Murdoch and Sandler 1984). Most important, those force deployments would yield joint products with varying degrees of publicness.
For the initial period of flexible response during 1967–1981, the enhanced importance and deployment of conventional forces meant that the thinning of forces became more relevant. That focus brought up the notion of perimeter defense as a weakest-link public good in which the least fortified border could invite an enemy incursion that reduced the protection of all behind-the-front allies – see Hirshleifer (1983) on weakest-link public goods whose level equals the smallest contribution. Flexible response motivated European NATO allies to build up their conventional forces so as not to draw Soviet aggression (Sandler, 1977; Sandler and Forbes, 1980; Sandler and Murdoch, 1990). As a result, NATO’s disproportionate burdens based on GDP was reduced, along with suboptimality of defense provision. By raising the importance of conventional forces in Europe, US share of total NATO ME fell, while other NATO European allies’ residual share of total NATO ME increased – a prediction supported in the next section. Flexible response also gave rise to more ally-specific benefits than MAD, which improved benefit-burden concordance as allies defense spending burdens were increasingly guided by their own gains. Finally, force thinning justified limiting alliance size as geographically larger allies require more protective conventional forces.
The later period of flexible response roughly ran from 1982 to 1990, marked by Reagan’s enhanced defense procurement and strategic buildup, France and UK strategic buildup, the development of precision-guided munitions, and forward-defense (“deep strike”) strategy. The latter meant that NATO acquired the ability to strike enemy assets well behind the front with the Warsaw Pact. These developments enhanced the relative share of pure public joint products making for disproportionate burden sharing, reduced benefit-burden concordance, and greater suboptimal ME.
With the 1991 dissolution of the Warsaw Pact and the Soviet Union, NATO sought a new mission to replace the Cold War (Asmus, 1997; Gompert and Larrabee, 1997; Hartley and Sandler, 1999). As Russia was then viewed as less of a threat, NATO allies started to take advantage of a “peace dividend” by redirecting some of their ME to social programs. At the Oslo Summit in 1992, NATO embraced the need for enhanced peacekeeping in a world besieged by civil wars (Asmus 1997, 37). NATO agreed to the development and deployment of Combined Joint Task Forces (CJTFs), which are NATO-drawn rapid-deployment forces, at the Brussels Summit of 1994. NATO peacekeeping troops and personnel were subsequently deployed to Bosnia in December 1995 as an Implementation Force (IFOR), followed a year later there by the Stabilization Force (SFOR). Another NATO peacekeeping deployment went to Kosovo in 1999 as KFOR. NATO’s Article 6 justified those and other out-of-area deployments (e.g., in Afghanistan after 9/11).
The crisis management doctrine increased the share of pure public joint products, thereby enhancing disproportionate burden sharing based on allies’ GDP (Hartley and Sandler, 1999; Sandler and Murdoch, 2000, 307-308). Additionally, with the greater share of purely public outputs, enhanced crisis management was anticipated to augment defense spending suboptimality, free riding, and alliance inclusion, and to reduce benefit-burden concordance. When successful, NATO peacekeeping offered an increased measure of world stability and security that enriched all allies – contributors and noncontributors alike. The enrichment concerned more limited refugee flows, more stable resource supply flows, reduced terrorism, and diminished conflict spillovers. Because the peacekeeping portion of NATO ME is small, the anticipated influences on burden sharing may not always show up (Sandler and Shimizu 2014).
The final era concerns NATO expansion from 1999 to 2024, which created more ally-specific benefits, particularly for new frontline allies (e.g., Poland and Finland). By increasing exposed borders and force thinning, NATO expansion curbed the share of alliancewide pure public benefits. By contrast, the increased threat of transnational terrorist attacks, enhanced Russian nationalism, the Russo-Ukrainian War of 2022–2025, and larger Russian ME augmented alliancewide public benefits for NATO allies. The Wales Summit of 2014, where allies agreed in principle to raise their GDP shares going to ME and defense equipment, should increase alliance benefits by augmenting NATO’s ME, its frontline protection, and equipment modernization (Haesebrouck, 2022; North Atlantic, 2014). In total, the share of public benefits may or may not increase, depending on how the differing public-private influences counter one another. Similarly, the overall influence on benefit-burden concordance depends on the countervailing influences that increased membership has on the mix of joint products.
NATO ME Spending over Time
Based on Stockholm International Peace Research Institute (SIPRI) (2025) data, ensuing figures offer different views of ME burden-sharing measures over time, where ME is measured in constant 2022 US dollars. GDP data is obtained from the World Development Indicators (WDI) of the World Bank (2025) and is converted into constant 2022 US dollars using WDI’s GDP deflator. In Figure 1, the top plot depicts US share of GDP devoted to ME (i.e., ME/GDP), while the bottom plot depicts non-US NATO allies’ average share of their GDP devoted to ME during 1961–2023. Although those burden shares vary over time, the United States always allocated a much greater portion of its GDP to ME than other NATO allies on average. Flexible response, which began in 1967 and was well underway by 1974, is associated with a marked decline of US ME/GDP until the Reagan defense buildup in the 1980s when the mix of public benefits increased. At the end of the Cold War, the declines in ME/GDP for both the United States and non-US NATO allies reflect all allies taking advantage of the peace dividend. Both the Crimean invasion in 2014 and the Ukraine War starting in 2022 resulted in a small increase in average ME/GDP burdens carried by non-US NATO allies. Despite the rise in Russian nationalism, US defense burdens have fallen since about 2009 after first increasing after the 9/11 terrorist hijackings. ME as a percentage of GDP, US versus non-US NATO allies, 1961–2023.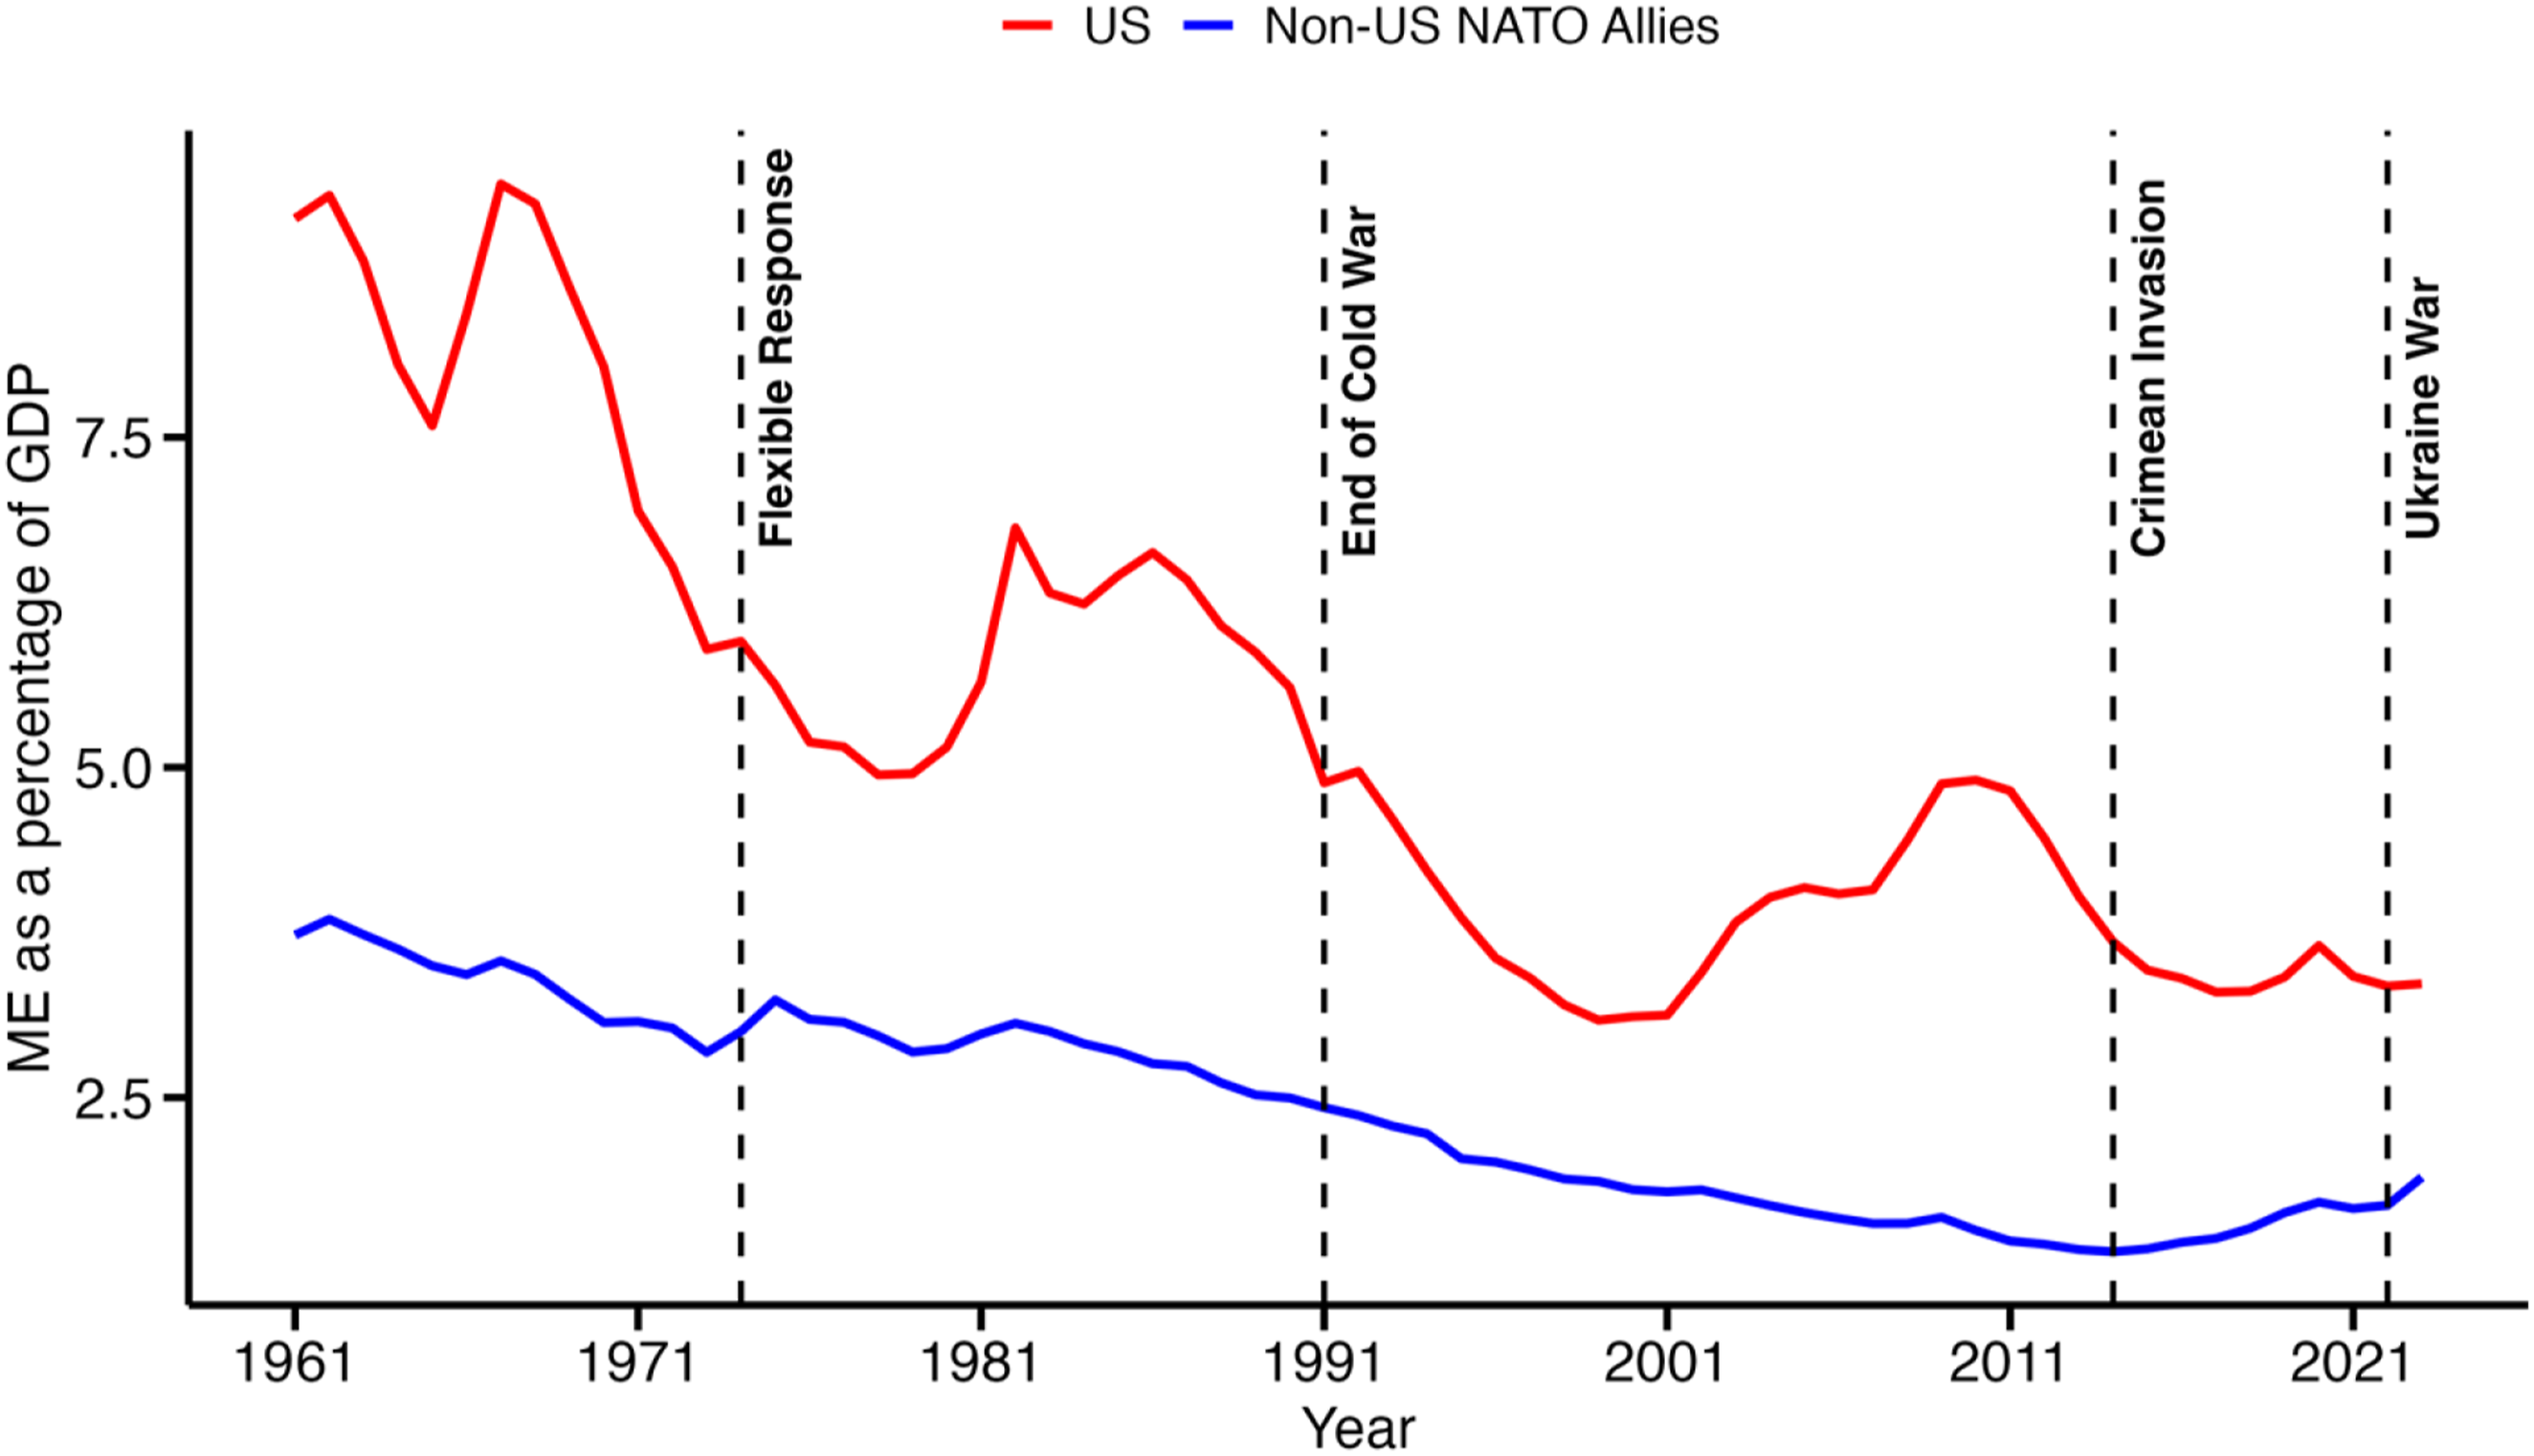
In Figure 2, the single plot captures the between-ally, burden-sharing metric consisting of US defense spending as a percentage of total NATO ME during 1961–2023. The United States covered up to 80 percent of total NATO ME before flexible response went into effect. With this doctrine, US share of NATO ME declined greatly until the Reagan buildup started in 1981, which meant that non-US NATO share of the alliance defense spending increased greatly from 1967 to 1981. In effect, flexible response caused a tremendous shift in total NATO burden assignments as European allies fortified borders. From before the end of the Cold War, US overall NATO burden share fell until just before 9/11. The so-called war on terror again caused the United States to assume more of NATO total defense spending. Since the rise in Russian nationalism, US ME as a percentage of NATO total ME has declined as the non-US NATO allies have carried more of NATO total ME owing to an expanding number of NATO European allies and their somewhat greater ME. US ME as a percentage of overall NATO ME, 1961–2023.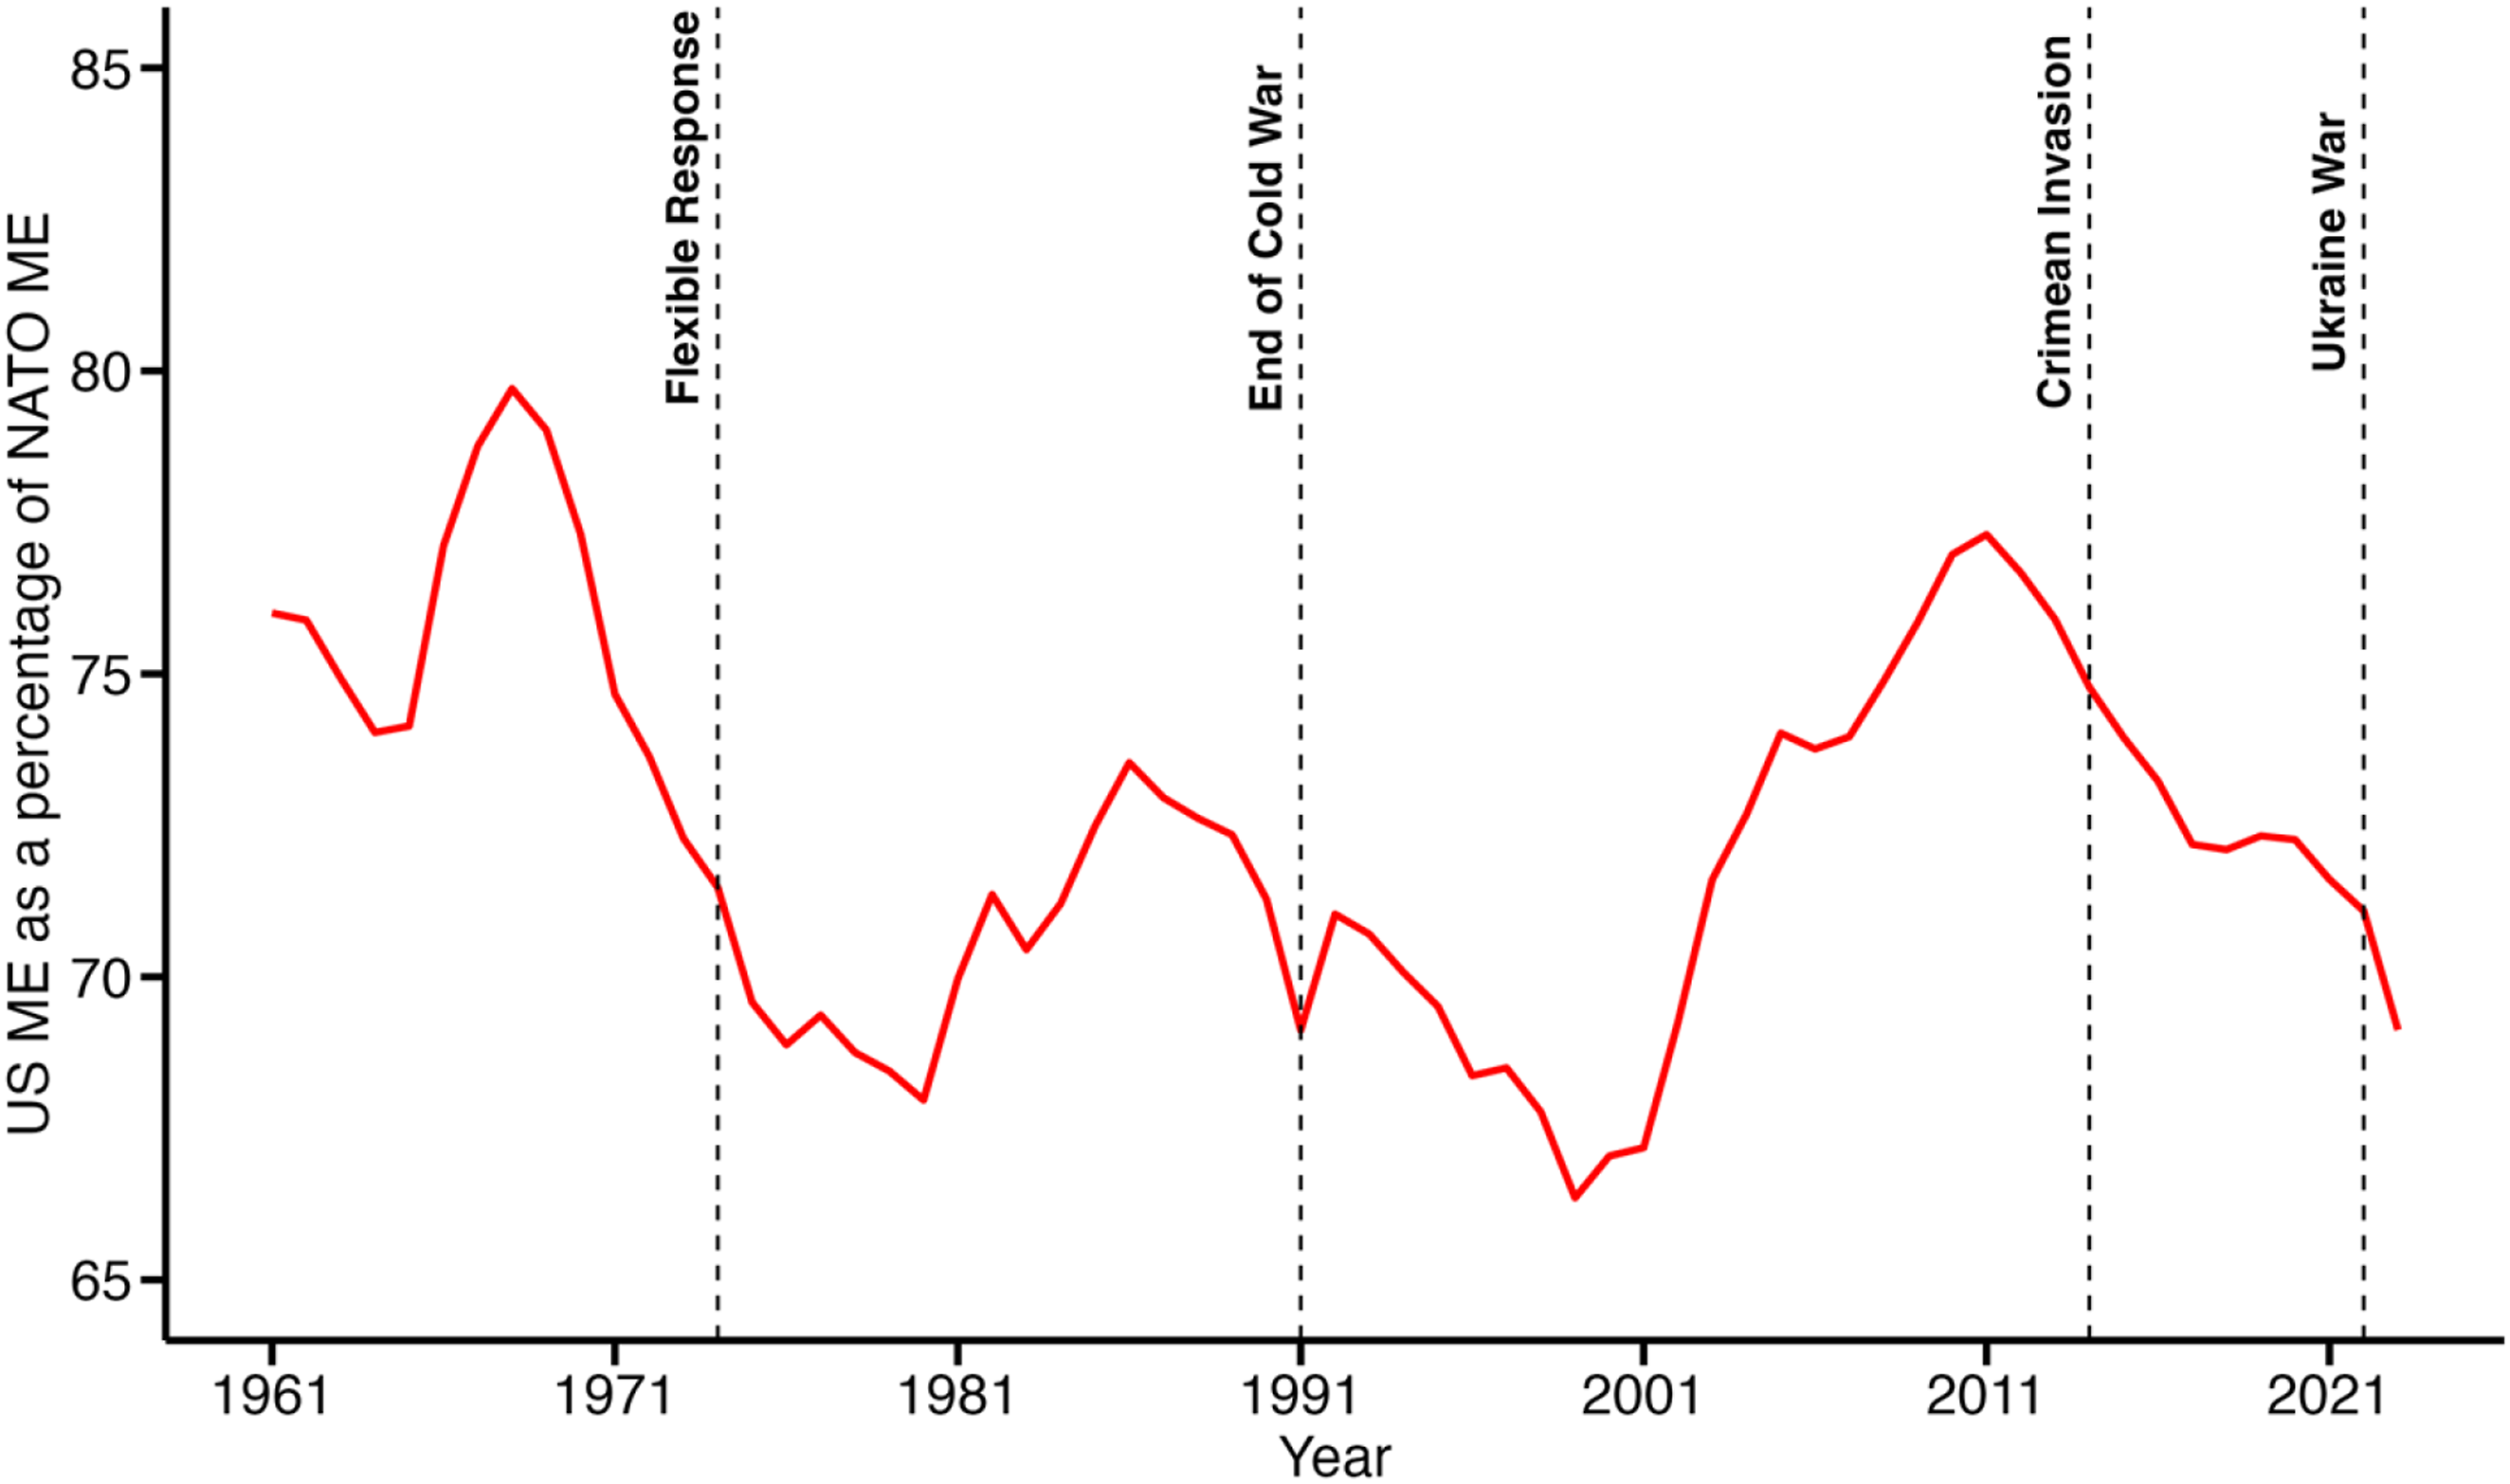
In billions of constant 2022 US dollars, Figure 3 provides plots of US, non-US NATO, and Russian defense spending during 1991–2023. As displayed from 1997, there was steady rises in non-US NATO ME and Russian ME, where the former increase was due to the growth in membership and the increase in allies’ ME. Since the Crimean invasion in 2014, US ME grew by 9.8 percent (from 800 to 880 billion US dollars); non-US NATO ME grew by 45.5 percent (from 270 to 393 billion US dollars); and Russian ME grew by 57.14 percent (from 80 to 126 billion US dollars). Clearly, the United States did not try to match Russian defense growth to limit the small increasing gap in defense spending between the two countries (Sandler and George, 2016). US ME, Russian ME and non-US NATO ME, 1991–2023.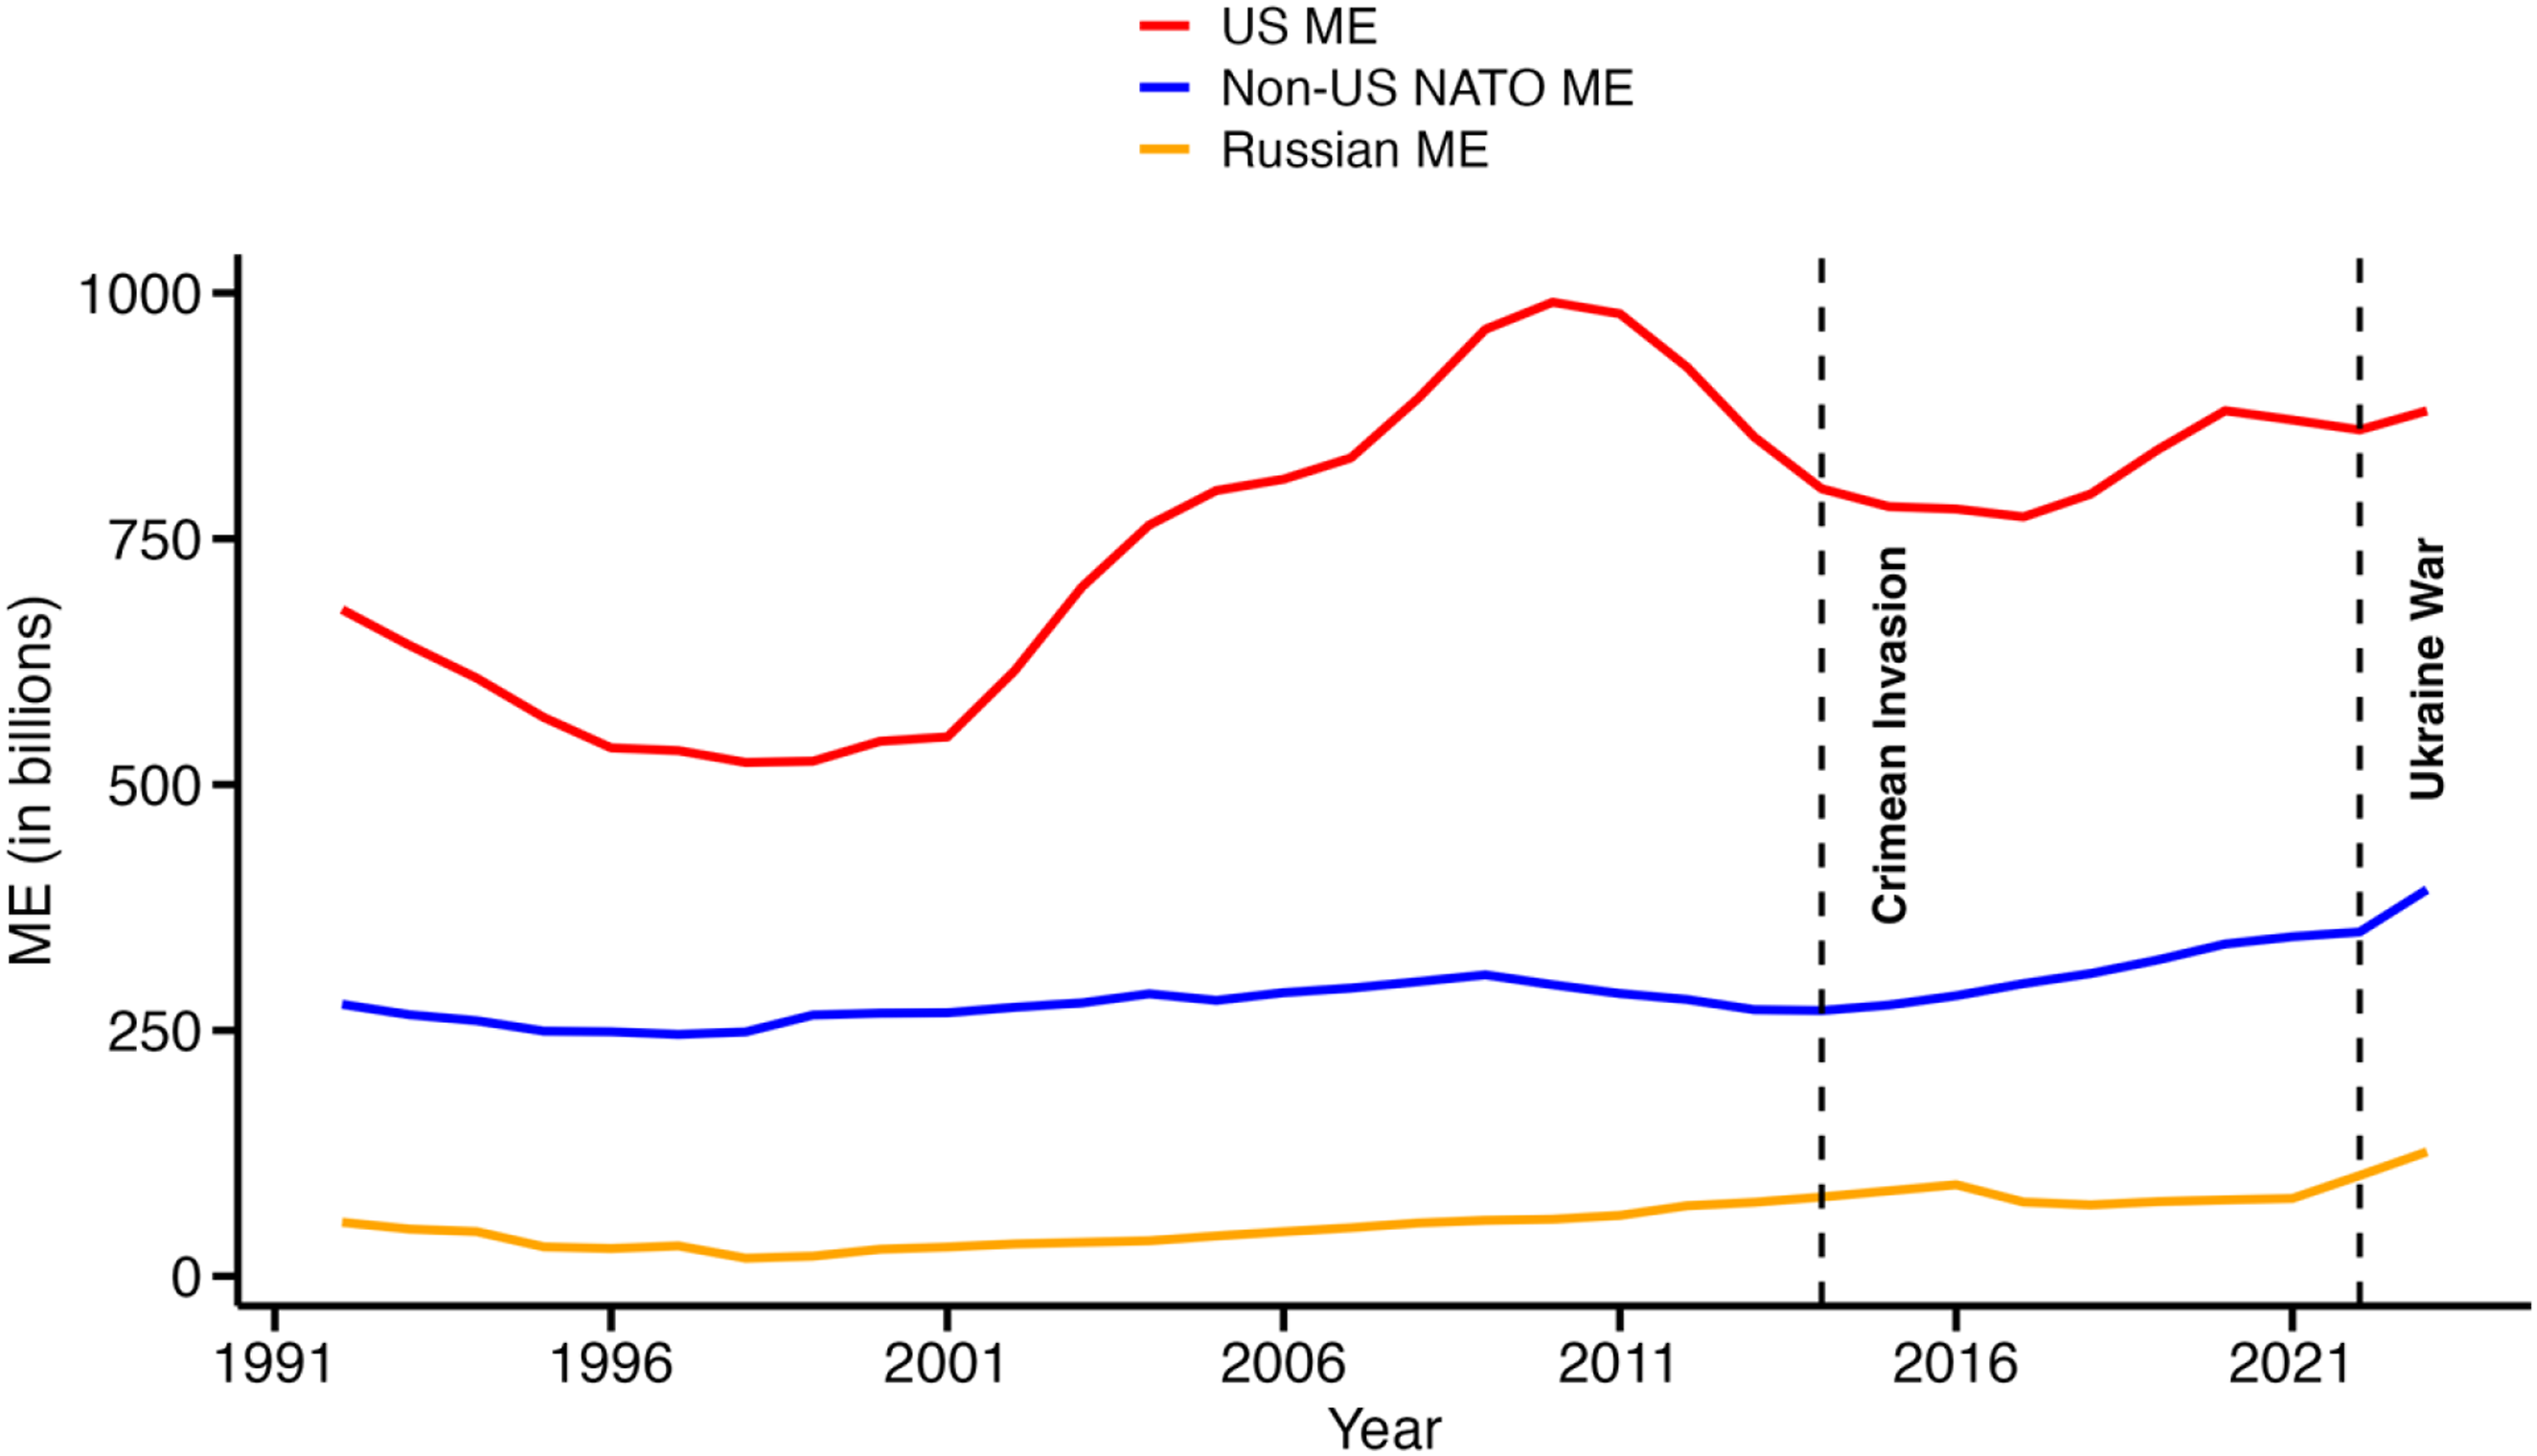
NATO Defense Disproportionality and Benefit-Burden Concordance
We return to the roots of the NATO burden-sharing controversy by investigating Spearman rank correlations between allies’ ME/GDP and their GDP for select years. In the current exercise, we compute a simple rank correlation measure,
Spearman Rank Correlations Between Defense Burden (ME/GDP) and GDP.
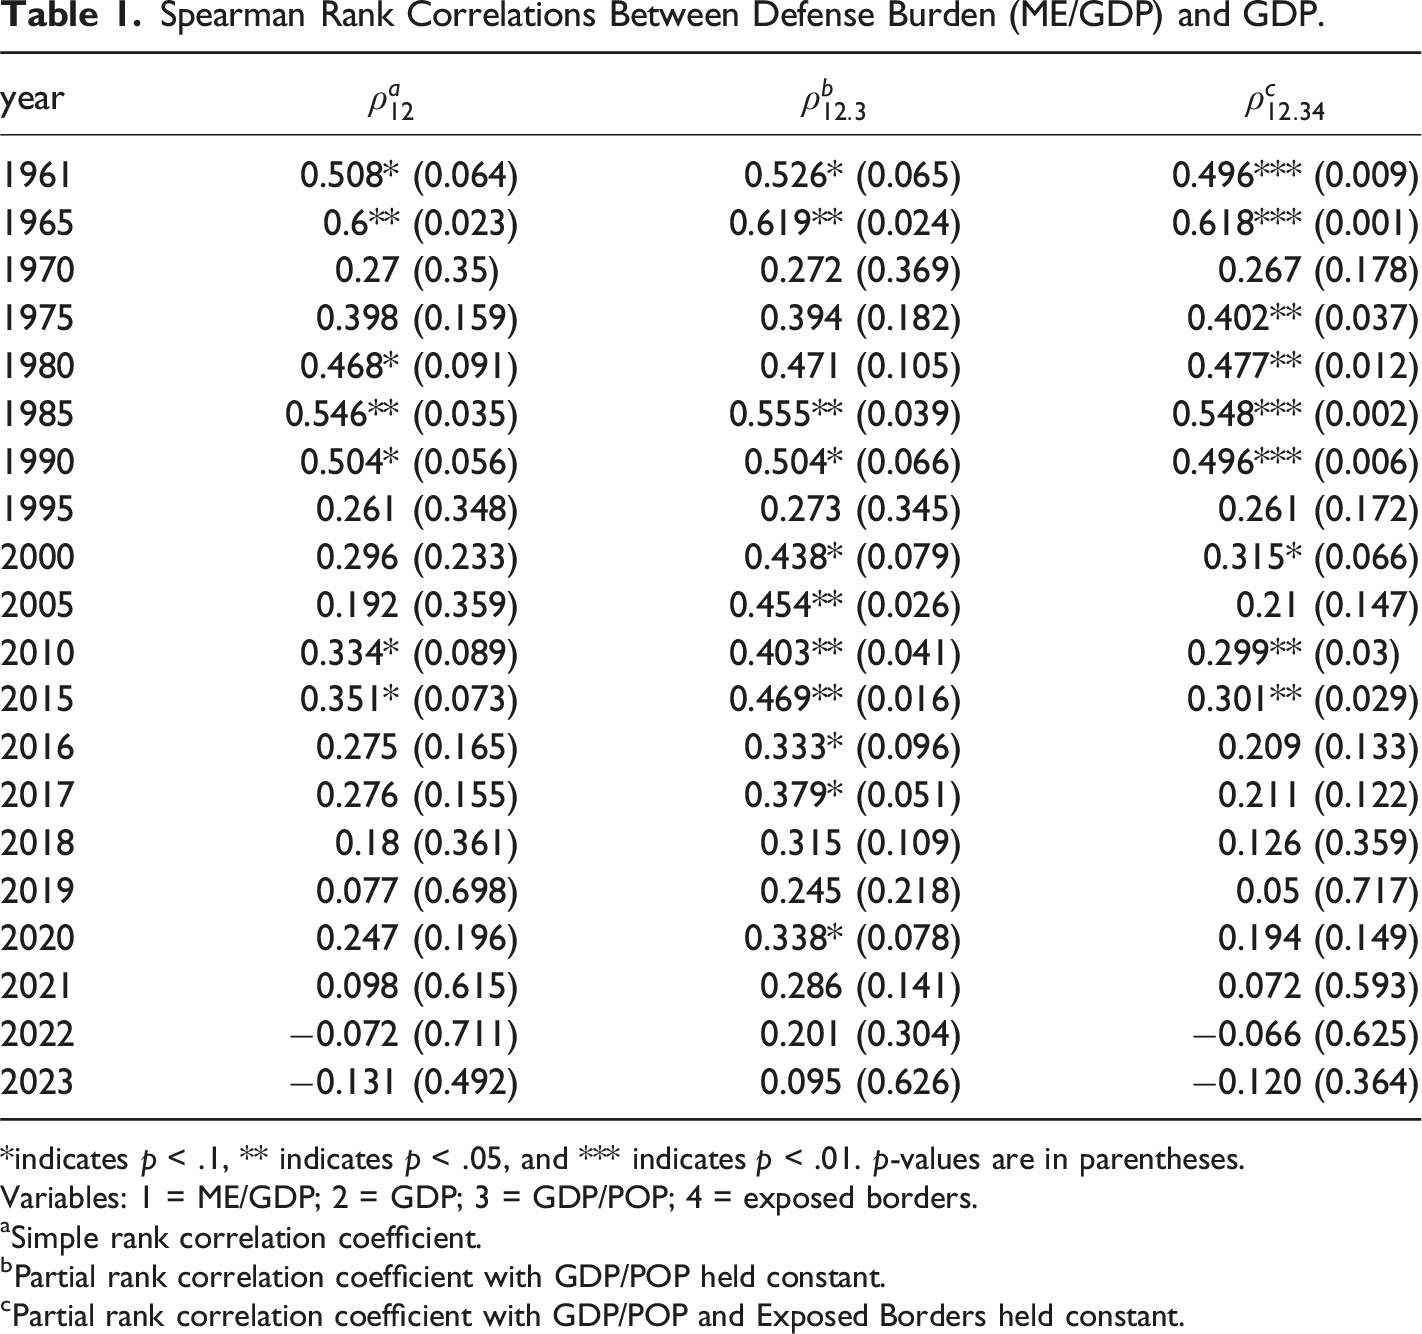
*indicates p < .1, ** indicates p < .05, and *** indicates p < .01. p-values are in parentheses.
Variables: 1 = ME/GDP; 2 = GDP; 3 = GDP/POP; 4 = exposed borders.
aSimple rank correlation coefficient.
bPartial rank correlation coefficient with GDP/POP held constant.
cPartial rank correlation coefficient with GDP/POP and Exposed Borders held constant.
As another means for judging the applicability of the joint product model, we investigate the concordance between allies’ average benefit shares and their share of NATO total ME. The latter share equals an ally’s ME divided by NATO total ME in a given year. In terms of allies’ average benefit shares, we consider three alternatives: (i) average share 1 consisting of an ally’s GDP, population, and exposed border shares; (ii) average share 2 consisting of an ally’s GDP, population, exposed border, and transnational terrorist attack on its soil shares; and (iii) average share 3 consisting of an ally’s GDP, its population, exposed border, and transnational terrorist attacks against its interest shares. Our measure of transnational terrorism is derived from the International Terrorism Attributes of Terrorist Events (ITERATE) dataset (Mickolus et al. 2024) for which a terrorist incident is transnational if it involves two or more countries through the perpetrators, victims, or host country.
Because we do not know an ally’s relative preferences for protecting the components in each benefit share measure, we merely take an average of the designated components’ shares by applying equal weights (Sandler and Forbes 1980; Solomon and Fetterly 2024). If, for example, an ally possesses 10 percent of NATO’s GDP, has 5 percent of NATO’s population, and contains 15 percent of NATO’s exposed borders in a given year, then its average benefit share 1 is 10 percent, which is then compared to its share of NATO’s ME in that year. If an ally covers 5 percent of NATO ME and gains a benefit share of 10 percent, then the ally underpays for its derived defense benefits; if, in contrast, an ally covers 5 percent of NATO ME and gains a benefit share of 3 percent, then the ally overpays for its derived defense benefits.
A nonparametric Wilcoxon signed rank test determines whether computed average benefit shares match or agree with allies’ assumed ME burdens during a given year. For every sample year, Wilcoxon ranks are assigned according to the absolute value of the differences between the ally’s average benefit share and its burden measure. Following a computation of the sum of the ranks with positive and negative differences, we apply a z-test statistic using the sum of positive differences. For the Wilcoxon signed rank test, the alternative hypothesis is that the distribution of NATO’s defense burdens and that of allies’ average benefit shares are different, indicating the absence of concordance. The null hypothesis is that the two distributions are the same, consistent with benefit-burden concordance. Not rejecting the null hypothesis favors the joint product model of alliances with sizable shares of excludable benefits.
Wilcoxon Signed Rank Correlations of ME/NATO ME and Alternative Average Benefit Shares.
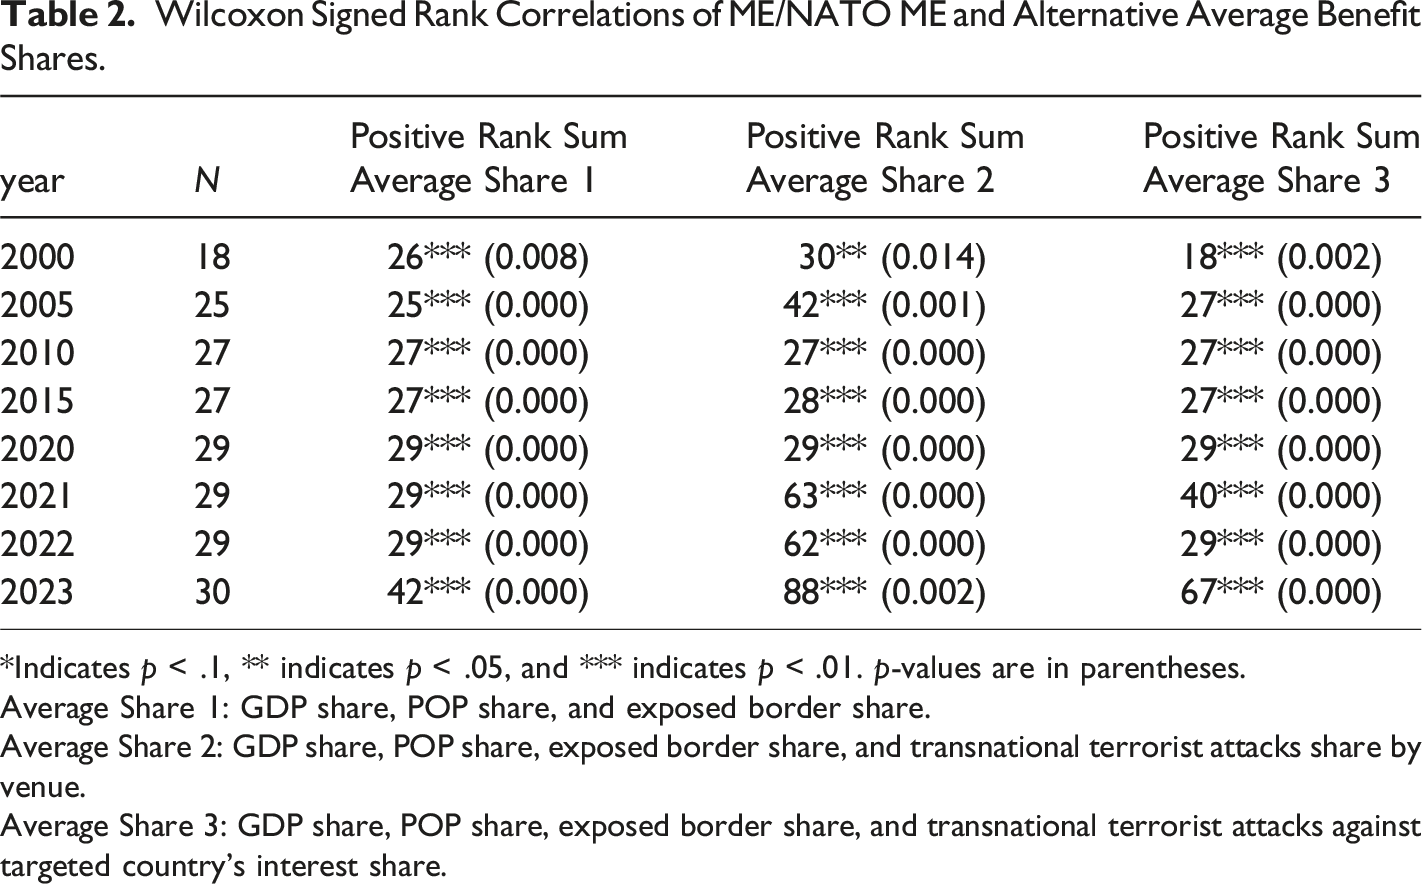
*Indicates p < .1, ** indicates p < .05, and *** indicates p < .01. p-values are in parentheses.
Average Share 1: GDP share, POP share, and exposed border share.
Average Share 2: GDP share, POP share, exposed border share, and transnational terrorist attacks share by venue.
Average Share 3: GDP share, POP share, exposed border share, and transnational terrorist attacks against targeted country’s interest share.
Demand for Defense
From the outset of the study of the economics of military alliances, interest focused on estimating allies’ demand for defense (Murdoch and Sandler 1984; Smith 1980, 1989). A representative form for ally i’s defense demand, based on equations (6) or (12), is
The independent variables of defense demand may be theoretical or ad hoc based on empirical fit or considerations. In the latter instance, a dynamic panel specification may be applied with lagged defense spending introduced in the estimating equation (e.g., Alozious 2022; Smith 1989). With lagged defense spending in the defense demand equation, bureaucratic inertia is apt to slow down the adjustment of defense to spillins and other considerations, leading to a smaller short-run impact compared to more substantial long-run adjustment (e.g., Kuokštytė and Kuokštis 2025).
Some researchers replaced ME with ME/GDP (the defense burden) as the dependent variable in the defense demand equation, which raises some important issues. First, the appropriate antecedent theoretical model is not indicated, giving rise to an empirical-driven exercise. Second, the form of the spillins term is not clear because summing the defense burdens of the other allies is not really appropriate in contrast to summing their MEs. Third, if the average of the other allies’ defense burdens is used, then an ally’s ME/GDP is likely to respond positively to the average ME/GDP of the other allies owing to defense burden convergence (Arvanitidis et al. 2014). Alternatively, the positive response to the other allies’ average defense burden may be motivated by an ally not wanting to appear to be the weakest link which attracts an enemy’s attack. Fourth, with ME/GDP as the dependent variable, the free-riding concept loses its standard meaning.
Spatial-Based Defense Demand
An important innovation to the estimation of defense demand started with the seminal article by Goldsmith (2007) involving a global sample with allies and adversaries. When allies’ defense spending receives a unit weight for their alliance membership, the canonical Olson and Zeckhauser (1966) alliance model follows with the standard spillins expression,
Demand for Defense Spending Based on Spatial Connectivity.
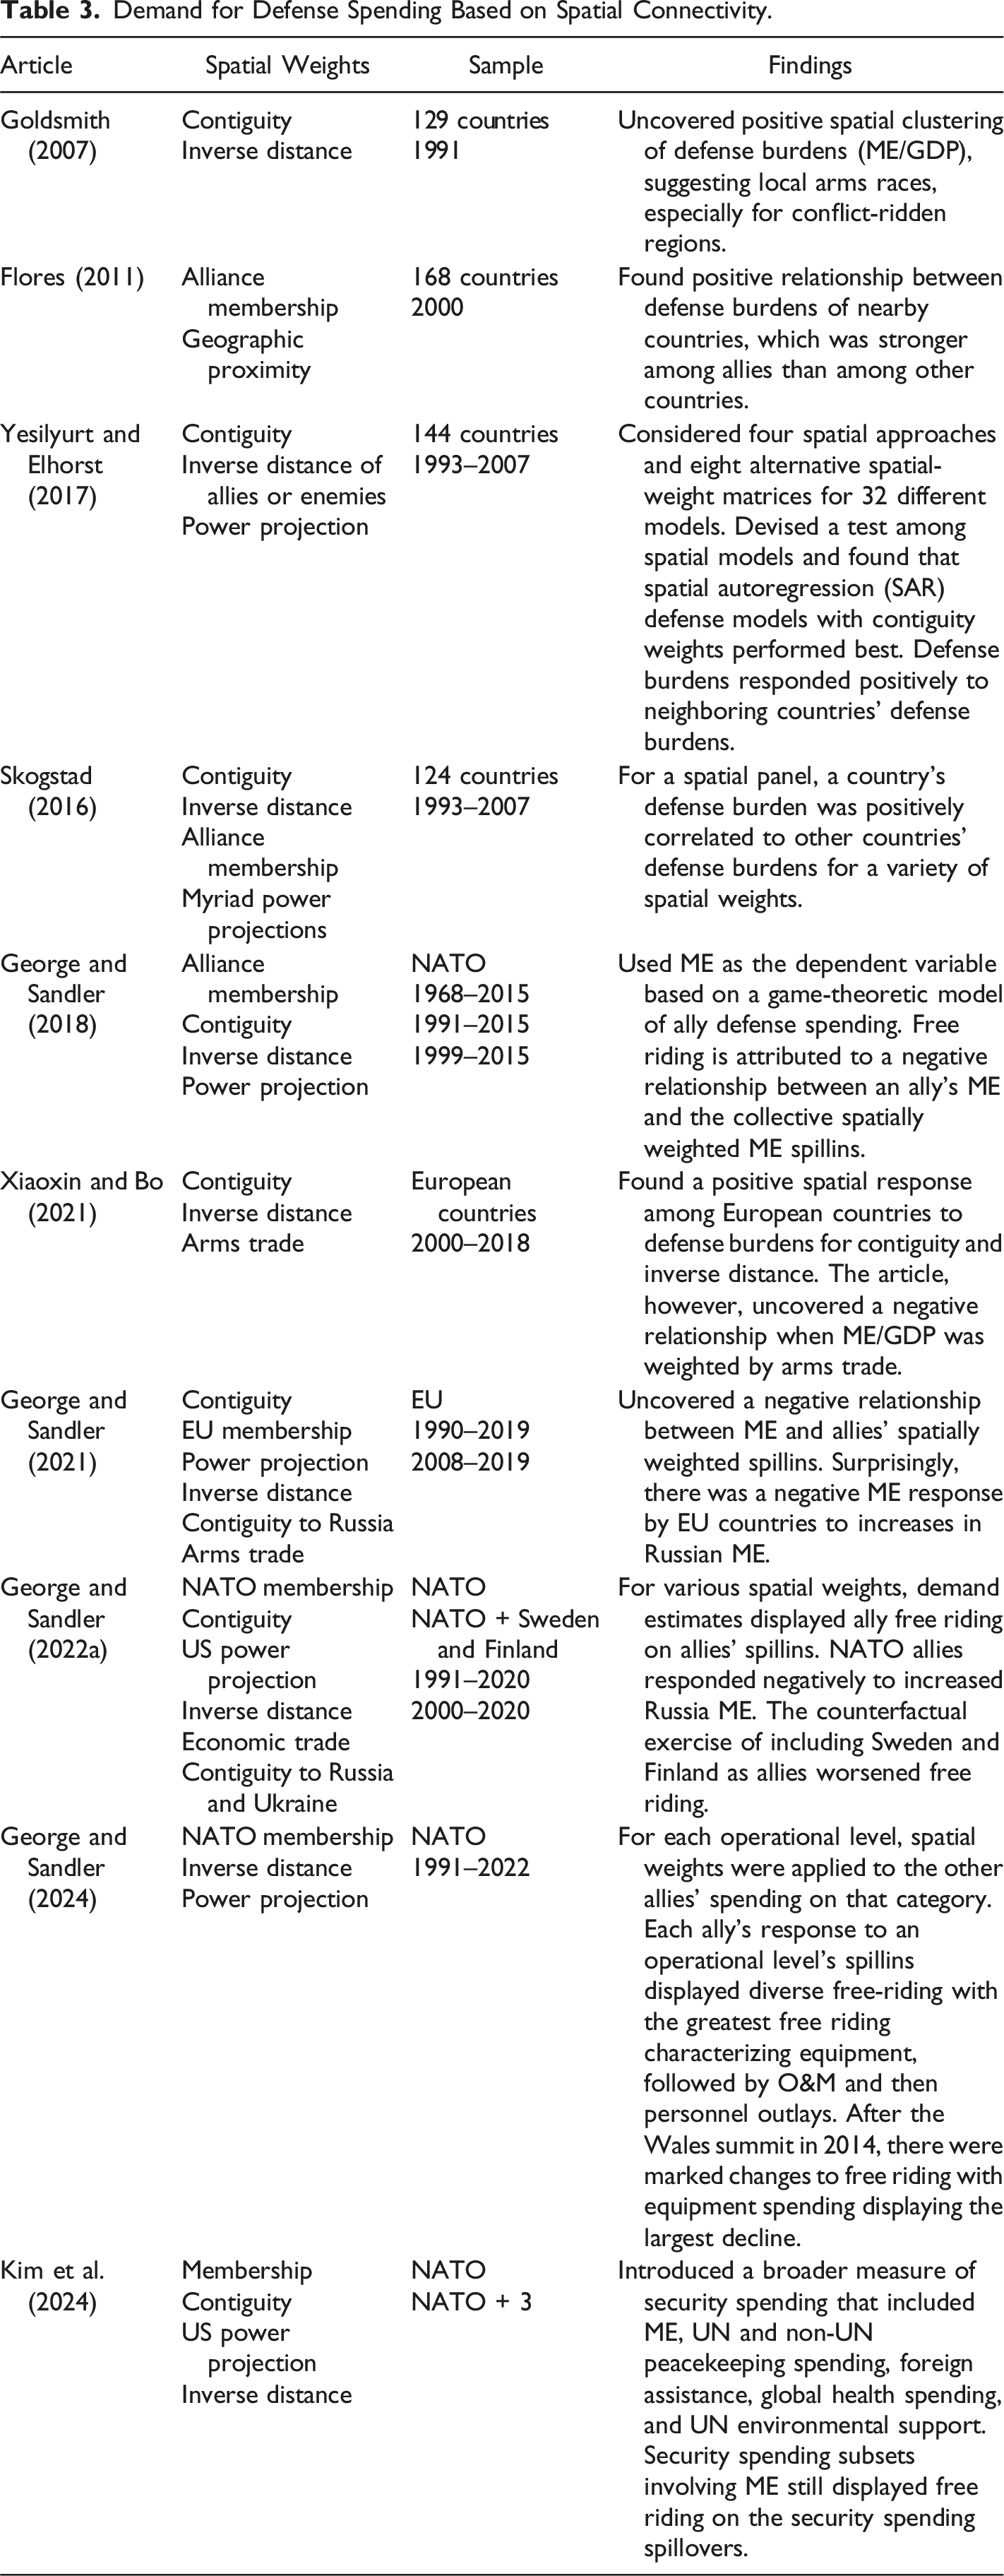
Based on those findings, we distill some important insights. First, when ME is the dependent variable, there is clear evidence of free riding or negative responses to various spatial-weighted spillins (e.g., George and Sandler 2018, 2021, 2022a, 2024). Free riding is a robust relationship, which held for NATO when some non-NATO allies were included (George and Sandler 2022a; Kim et al. 2024). Second, when ME/GDP is the dependent variable, there is a positive response to the other allies’ defense burdens (Flores 2011; Goldsmith 2007; Skogstad 2016), which likely captures an arms race among some adversarial countries in the large-sample studies, or burden convergence for allies in alliance-specific studies. Third, the free-riding response was also found to hold for the EU (George and Sandler 2021). Fourth, for more extended measures of security that includes ME, foreign assistance, peacekeeping, and other considerations, free riding is detected (e.g., Kim et al. 2024).
Defense Demand at the Operational Level
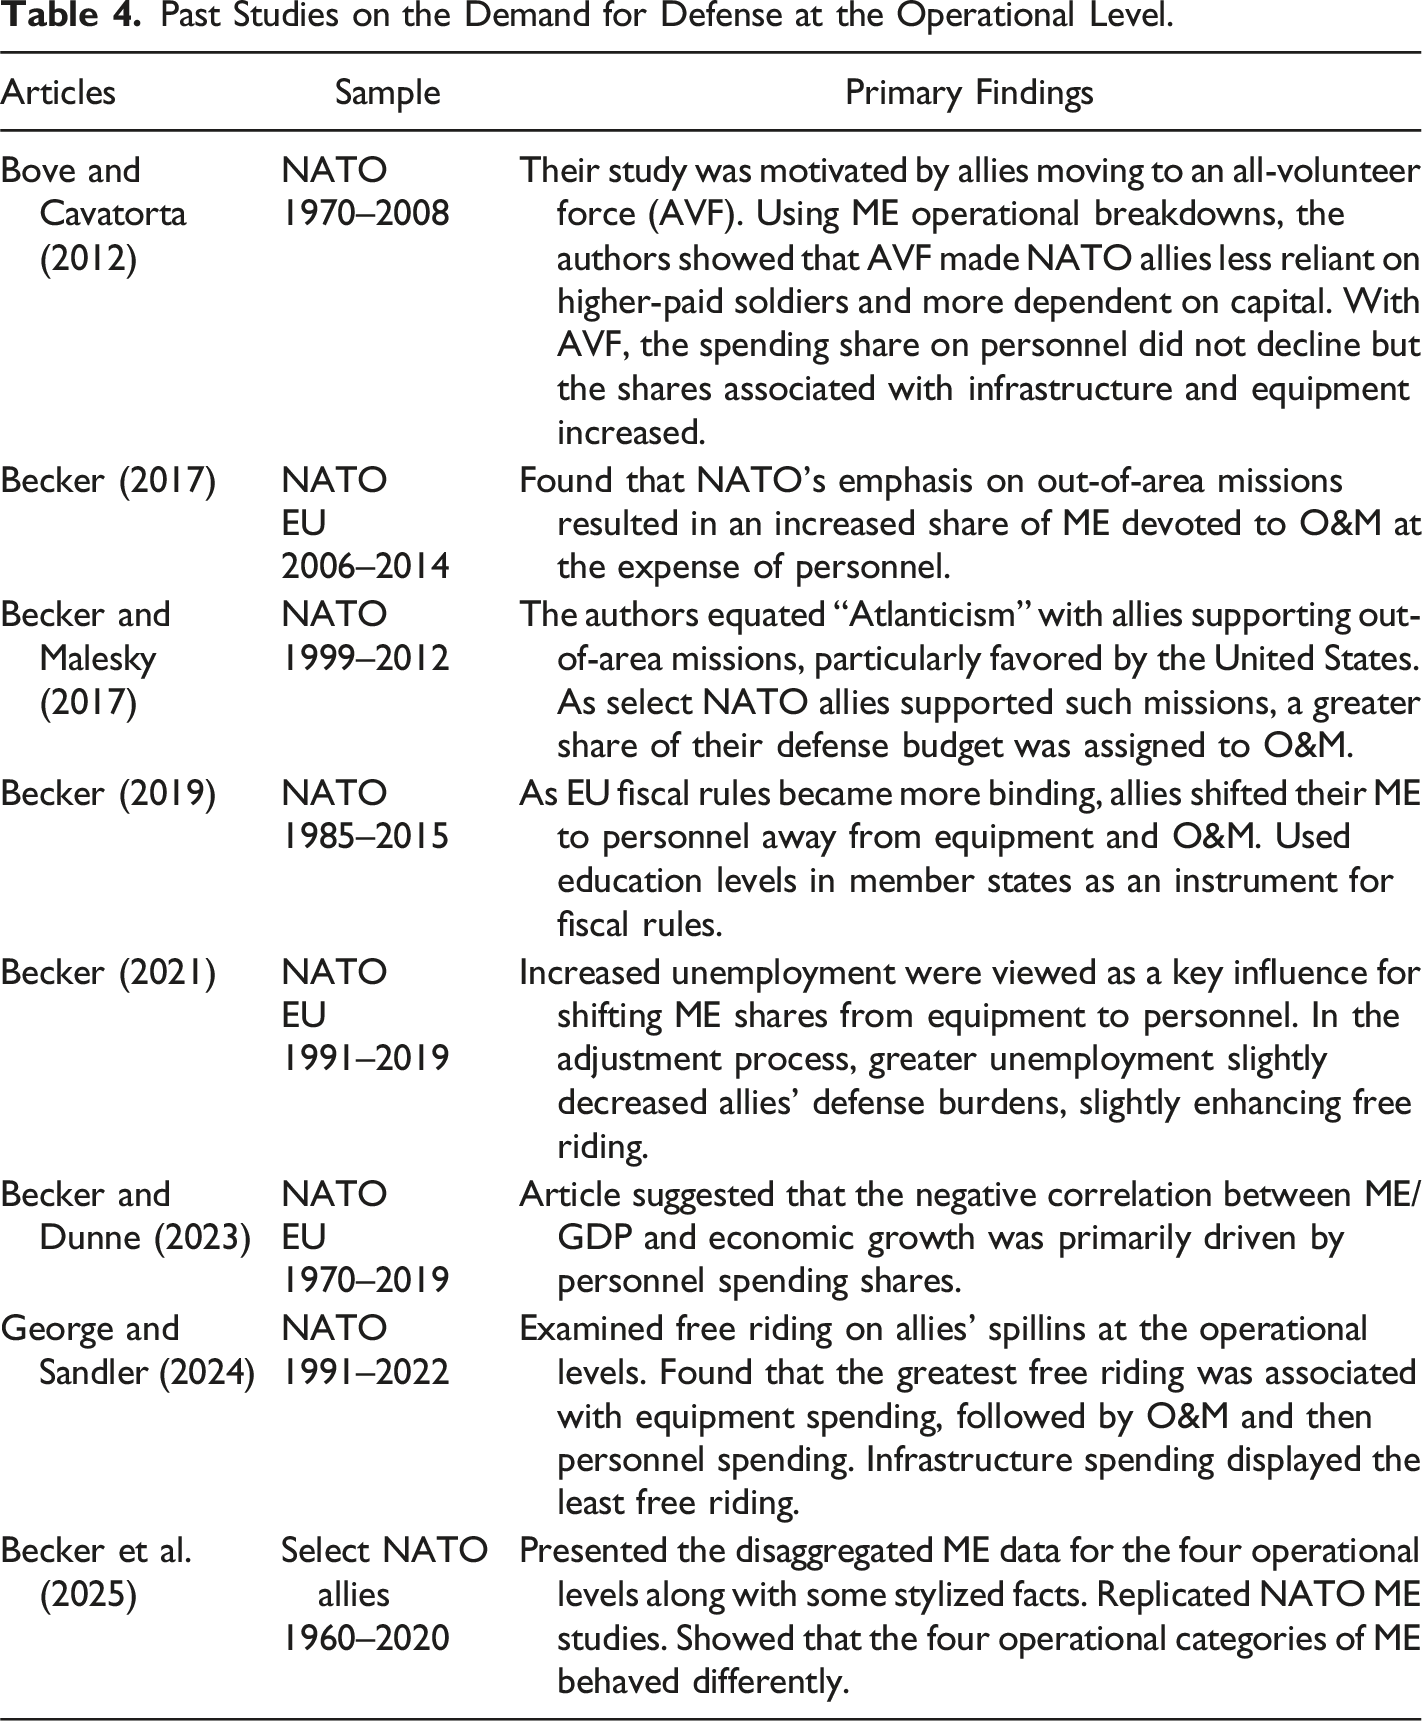
ME can be disaggregated into at least four categories. Personnel spending is often the largest share of a country’s ME and includes military and civilian workers’ compensation, support, and pensions. O&M mainly encompasses the cost of exercises, readiness training, ammunition, and troops’ sustenance. In the military budget, defense equipment outlays involve weapons platforms (e.g., warships, aircraft, and transport planes) procurement, weapons upgrades, small arms, and weapons research and development. Finally, infrastructure spending includes NATO common infrastructure support, military bases, command headquarters, airfields, and training camps (Becker et al. 2025).
Understandably, each of the four disaggregated defense spending categories implies different burden sharing, allocative efficiency, or exploitation consequences than those concerns associated with overall defense spending. This prediction follows in part from the different adjustment flexibilities that each spending category possesses when reacting to changes in strategic doctrines, membership composition, exigencies, and policies. For example, equipment shares may be sticky owing to the huge lead time to procure, develop and perfect new generations of weapons. In a pioneering article, Bove and Cavatorta (2012) showed that, as more NATO allies adopted the All-Volunteer Force (AVF) during 1970–2008, defense spending shares favored infrastructure and equipment over personnel. The latter share remained constant as defense capital and infrastructure substituted for higher-paid soldiers. For a strategic doctrine shift, Becker (2017) found that the implementation of crisis management missions increased O&M defense shares at the expense of personnel, equipment, and infrastructure shares (also see Becker and Malesky 2017). As an offset to unemployment, Becker (2021) showed a shift from equipment to personnel shares for both NATO and EU military budgets during 1991–2017. At the four disaggregated NATO defense levels for 1991–2022, George and Sandler (2024) found that free riding was most associated with equipment, followed by O&M, and then personnel spending. Given its immobility, infrastructure offered and displayed the least free riding given its limited substitutability among allies.
Past Studies on the Demand for Defense at the Operational Level.
Once one goes down the disaggregation path, the question arises as to how far disaggregation should be carried to solicit new allocative insights. Surely, a mere four categories mask many within-category trade-offs and insights. At the personnel level, there is potential substitution between military and civil personnel. For equipment, there is the essential difference between nuclear strategic and conventional weapons.
Other Alliances
There have been myriad applications to other non-NATO alliances. Given available historical data, two important pre-World War I alliances – Triple Alliance and Triple Entente (1880–1914) – have been examined. In particular, Conybeare et al. (1994) investigated which aggregator technology of public good supply applies to those alliances, where the aggregator refers to how allies’ defense provision determines the overall level of alliance defense (Hirshleifer 1983). For best shot, the largest defense provision of an ally fixes the alliancewide defense level; for weakest link, the smallest defense provision of an ally fixes the alliancewide defense level. Conybeare et al. (1994) engineered a joint product model with alternative aggregators including summation, best shot, and weakest link. Through a series of empirical tests to distinguish among the underlying aggregators, those authors found the Triple Alliance to adhere to best shot and the Triple Entente to adhere to weakest link. Germany was the best-shot ally in the Triple Alliance, while the United Kingdom was the weakest-link ally in the Triple Entente (also see Conybeare and Sandler 1990).
Other Military Alliances.
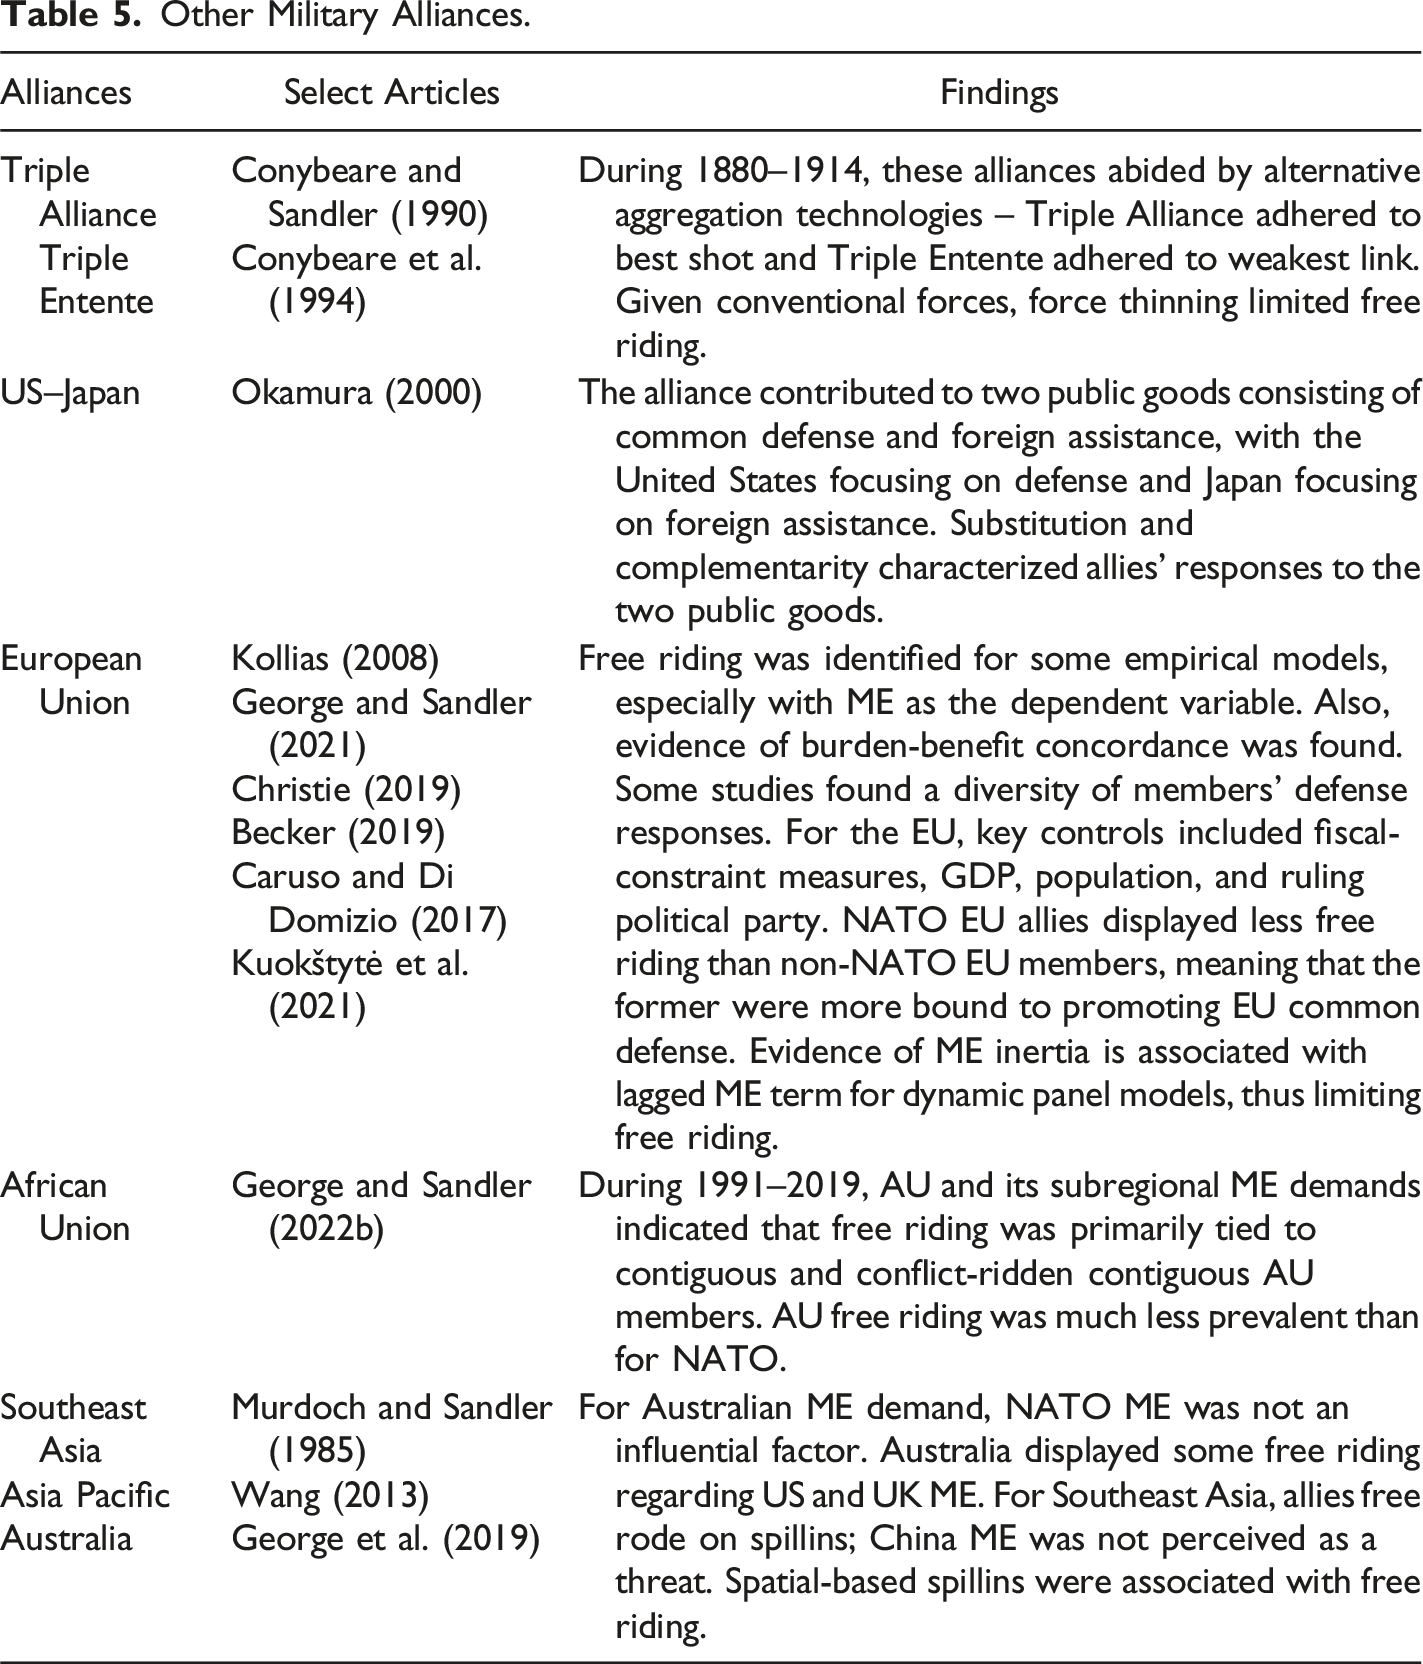
The AU study investigated free riding for the entire continent and its five subregions, using a spatial spillins paradigm (George and Sandler 2022b). At its current stage of development with largely undefined alliance commitments in times of threat, there was only modest evidence of free riding mainly based on contiguity where neighboring defense interests are most aligned. AU subregions displayed vastly different defense outlays depending, in large part, on the presence of nearby coups, civil wars, and terrorist threats. Finally, mixed evidence of free riding characterized alliances in Southeast Asia and the Asia-Pacific regions.
Past studies of small alliances (e.g., US-Japan, US-Israel, US-Australia) found little or no evidence of the exploitation hypothesis because a large portion of ally-specific benefits went to the small ally, located where the threat was the greatest, thereby motivating those small allies to allocate a large share of their GDP to ME relative to the United States. Often, multiple public goods (e.g., defense and foreign aid) are important for non-NATO alliances (see Okamura 2000 on this trade-off for the US-Japan alliance). Earlier studies of NATO investigated allies’ trading defense and foreign assistance or other multiple public goods (e.g., Palmer and David 1999). For a number of non-NATO alliances, dynamic panel investigations uncovered bureaucratic inertia that reduced defense free riding in the short but not in the long run. In general, non-NATO alliance studies experimented with a variety of empirical paradigms with much emphasis on empirical fit.
Concluding Remarks
Since its introduction 60 years ago, the economic theory of alliance has been an essential paradigm in the study of defense economics and related areas. Alliance theory has undergone two crucial generalizations involving jointly produced defense outputs with alternative degrees of publicness and involving the spatial configuration of allies and enemies with varying spatial-based spillins. The current survey carefully spells out the theoretical foundations of the three basic analyses of alliance theory to derive the estimating allies’ equations for defense demand. Although the survey investigates the origins and application of alliance theory since its inception in 1965–1966, we focus on the literature and its developments in the last 25 years. Consequently, we are concerned with how the theory and its empirics have captured recent developments in NATO, especially changes in strategic doctrine, weapons technology, membership composition, and threats. Noteworthy literature developments involved spatial-based ally defense demand estimations, operation-based defense demand studies, non-NATO alliance applications, and the developing empirical paradigms for defense demand estimations.
A few important insights follow. First, strategic reorientation, technological change, membership composition, and threat perception greatly influence the mix of joint products, thereby affecting alliance burden sharing, allocative efficiency, and institutional policy recommendations. Second, those same four factors determine the role played by the spatial configuration of allies and enemies, thereby also affecting burden sharing and allocative implications. Third, the post-1998 doubling of NATO membership has profound implications for how NATO’s burden sharing is responding to the growth of Russian nationalism. Despite an increasing risk to the new frontline NATO allies, there is still an imbalance between burdens carried by the United States and its NATO allies. Fourth, examining NATO defense spending at the operational level has shown that unemployment, the crisis management doctrine, economic growth, and spatial considerations differentially affected the subcategories of defense spending in ways that differ from changes in overall defense spending. Fifth, the development of alliance theory and its empirics allowed for an understanding of burden sharing and related issues in non-NATO alliances. Sixth, defense demand estimates critically depend on the form of the dependent variable, which varies between studies emphasizing a theoretical versus an empirical basis.
There are myriad avenues for future directions. From a spatial perspective, much more needs to be done in incorporating the spatial positions of an alliance’s enemies into the analysis, contrasting with the past focus on the relative positions of the other allies. For example, more spatially diffused enemies will influence an alliance’s response to increases in enemies’ defense spending differently than for less diffused enemies. At the operational level, the response of individual allies or an alliance to enemy defense spending has ignored the enemy’s operational breakdown of defense spending. Surely, an alliance is more apt to respond differently to increases in an enemy’s defense equipment and personnel than to its infrastructure and O&M. A huge breakthrough that is still needed is a truly integrated theory of opposing alliances that account for within-alliance burden sharing and between-alliance arms race. More must be done to recognize a broader measure of defense burden that includes ME, foreign assistance, global health spending, and environmental protection spending (Balcaen et al. 2023).
The economic theory of alliances has much to offer for our understanding of efforts to foster the provision of transnational public goods, because they often yield joint products that vary in their degree of publicness. For instance, the promotion of biodiversity gives rise to host-country specific gains (e.g., larger nut and fruit harvests), impure public benefits (e.g., eco-tourism) subject to crowding, and purely public benefits (e.g., greater gene pool and reduced greenhouse gas emissions). Alliance theory can also be applied to the implementation of sanctions and cybersecurity, both with severe free-riding and joint product concerns, where empirical lessons from alliance research apply. Another instance of joint products arises from peacekeeping missions that reduce casualties in the host country (a country-specific benefit) and limit transnational externalities from smaller refugee flows, more stable resource supplies, and less violence spillovers. Similarly, global health actions and foreign assistance offer a host of joint products of varying degrees of publicness.
Supplemental Material
Supplemental Material - Economic Theory of Alliances: Sixty Years Later
Supplemental Material for Economic Theory of Alliances: Sixty Years Later by Todd Sandler and Justin George in Journal of Conflict Resolution
Footnotes
Acknowledgments
The authors thank an anonymous reviewer and Paul Huth for comments on an earlier draft.
Declaration of Conflicting Interests
The author(s) declared no potential conflicts of interest with respect to the research, authorship, and/or publication of this article.
Funding
The author(s) received no financial support for the research, authorship, and/or publication of this article.
Data Availability Statement
The dataset and replication material used in this study are available at https://doi.org/10.7910/DVN/FVKEQY. The data and replication material are also available at the JCR replication website at https://jcr.sagepub.com/ (George, 2025).
Supplemental Material
Supplemental material for this article is available online
References
Supplementary Material
Please find the following supplemental material available below.
For Open Access articles published under a Creative Commons License, all supplemental material carries the same license as the article it is associated with.
For non-Open Access articles published, all supplemental material carries a non-exclusive license, and permission requests for re-use of supplemental material or any part of supplemental material shall be sent directly to the copyright owner as specified in the copyright notice associated with the article.