
Abstract
This paper analyses how pre-pandemic levels of inequality across US counties have shaped the impact of the COVID-19 pandemic on the incidence of protests. The results from difference-in-differences and instrumental variable models using high-frequency weekly data show that more stringent measures to contain the pandemic increased the incidence of protests, but only in US counties with high levels of inequality before the start of the pandemic where grievances may have been initially stronger. The impact of government responses to COVID-19 on protests is largely explained by adverse changes in economic conditions in counties with the highest levels of pre-pandemic inequality. Policy stringency measures were also associated with more protests in the most unequal counties which voted for the Republican party in the 2016 elections and exhibited, at the start of the pandemic, lower levels of trust in the president and lower satisfaction with democracy.
Introduction
Understanding the causes and consequences of protests and organized collective dissent has been a longstanding question in political science. Existing studies have identified several determinants of protests, ranging from economic and social exclusion to political ideology, push back against repression and the expansion of social media (Chenoweth and Stephan 2008; Enikolopov, Makarin, and Petrova 2020; Manacorda and Tesei 2020; Rozenas and Zhukov 2019; Sangnier and Zylbergerg 2017; Wasow 2020). One of the earliest and most prominent theories focuses on the role of economic inequality in motivating civic unrest (Boix 2008; Gurr 1970; Lichbach 1989). However, empirical analyses of the impact of inequality on protests have generated ambiguous results (Dubrow, Slomczynski, and Tomescu-Dubrow 2008; Solt 2015) and, to date, we have limited understanding of the causal mechanisms that may explain a possible relationship between inequality and protests. This paper seeks to address these questions in the context of the COVID-19 pandemic.
The global COVID-19 pandemic offers a unique opportunity to study the relationship between inequality and protests. First identified in China’s Wuhan region in December 2019, the SARS-CoV-2 virus rapidly spread to the rest of the world. By April 2020, most countries had adopted stringent measures to avoid its diffusion. This process continued over several waves of the virus and its variants. As the virus spread and restrictions increased, so did social discontent and public demonstrations. Protests across the world increased by almost 30 percent between January 2020 and January 2021 (Kishi 2021).
1
In the USA, protests increased considerably from mid-April 2020, and remained above historical levels in 2021 (Figure 1), albeit with large variation across counties.
2
Protests in USA, 2010–2021.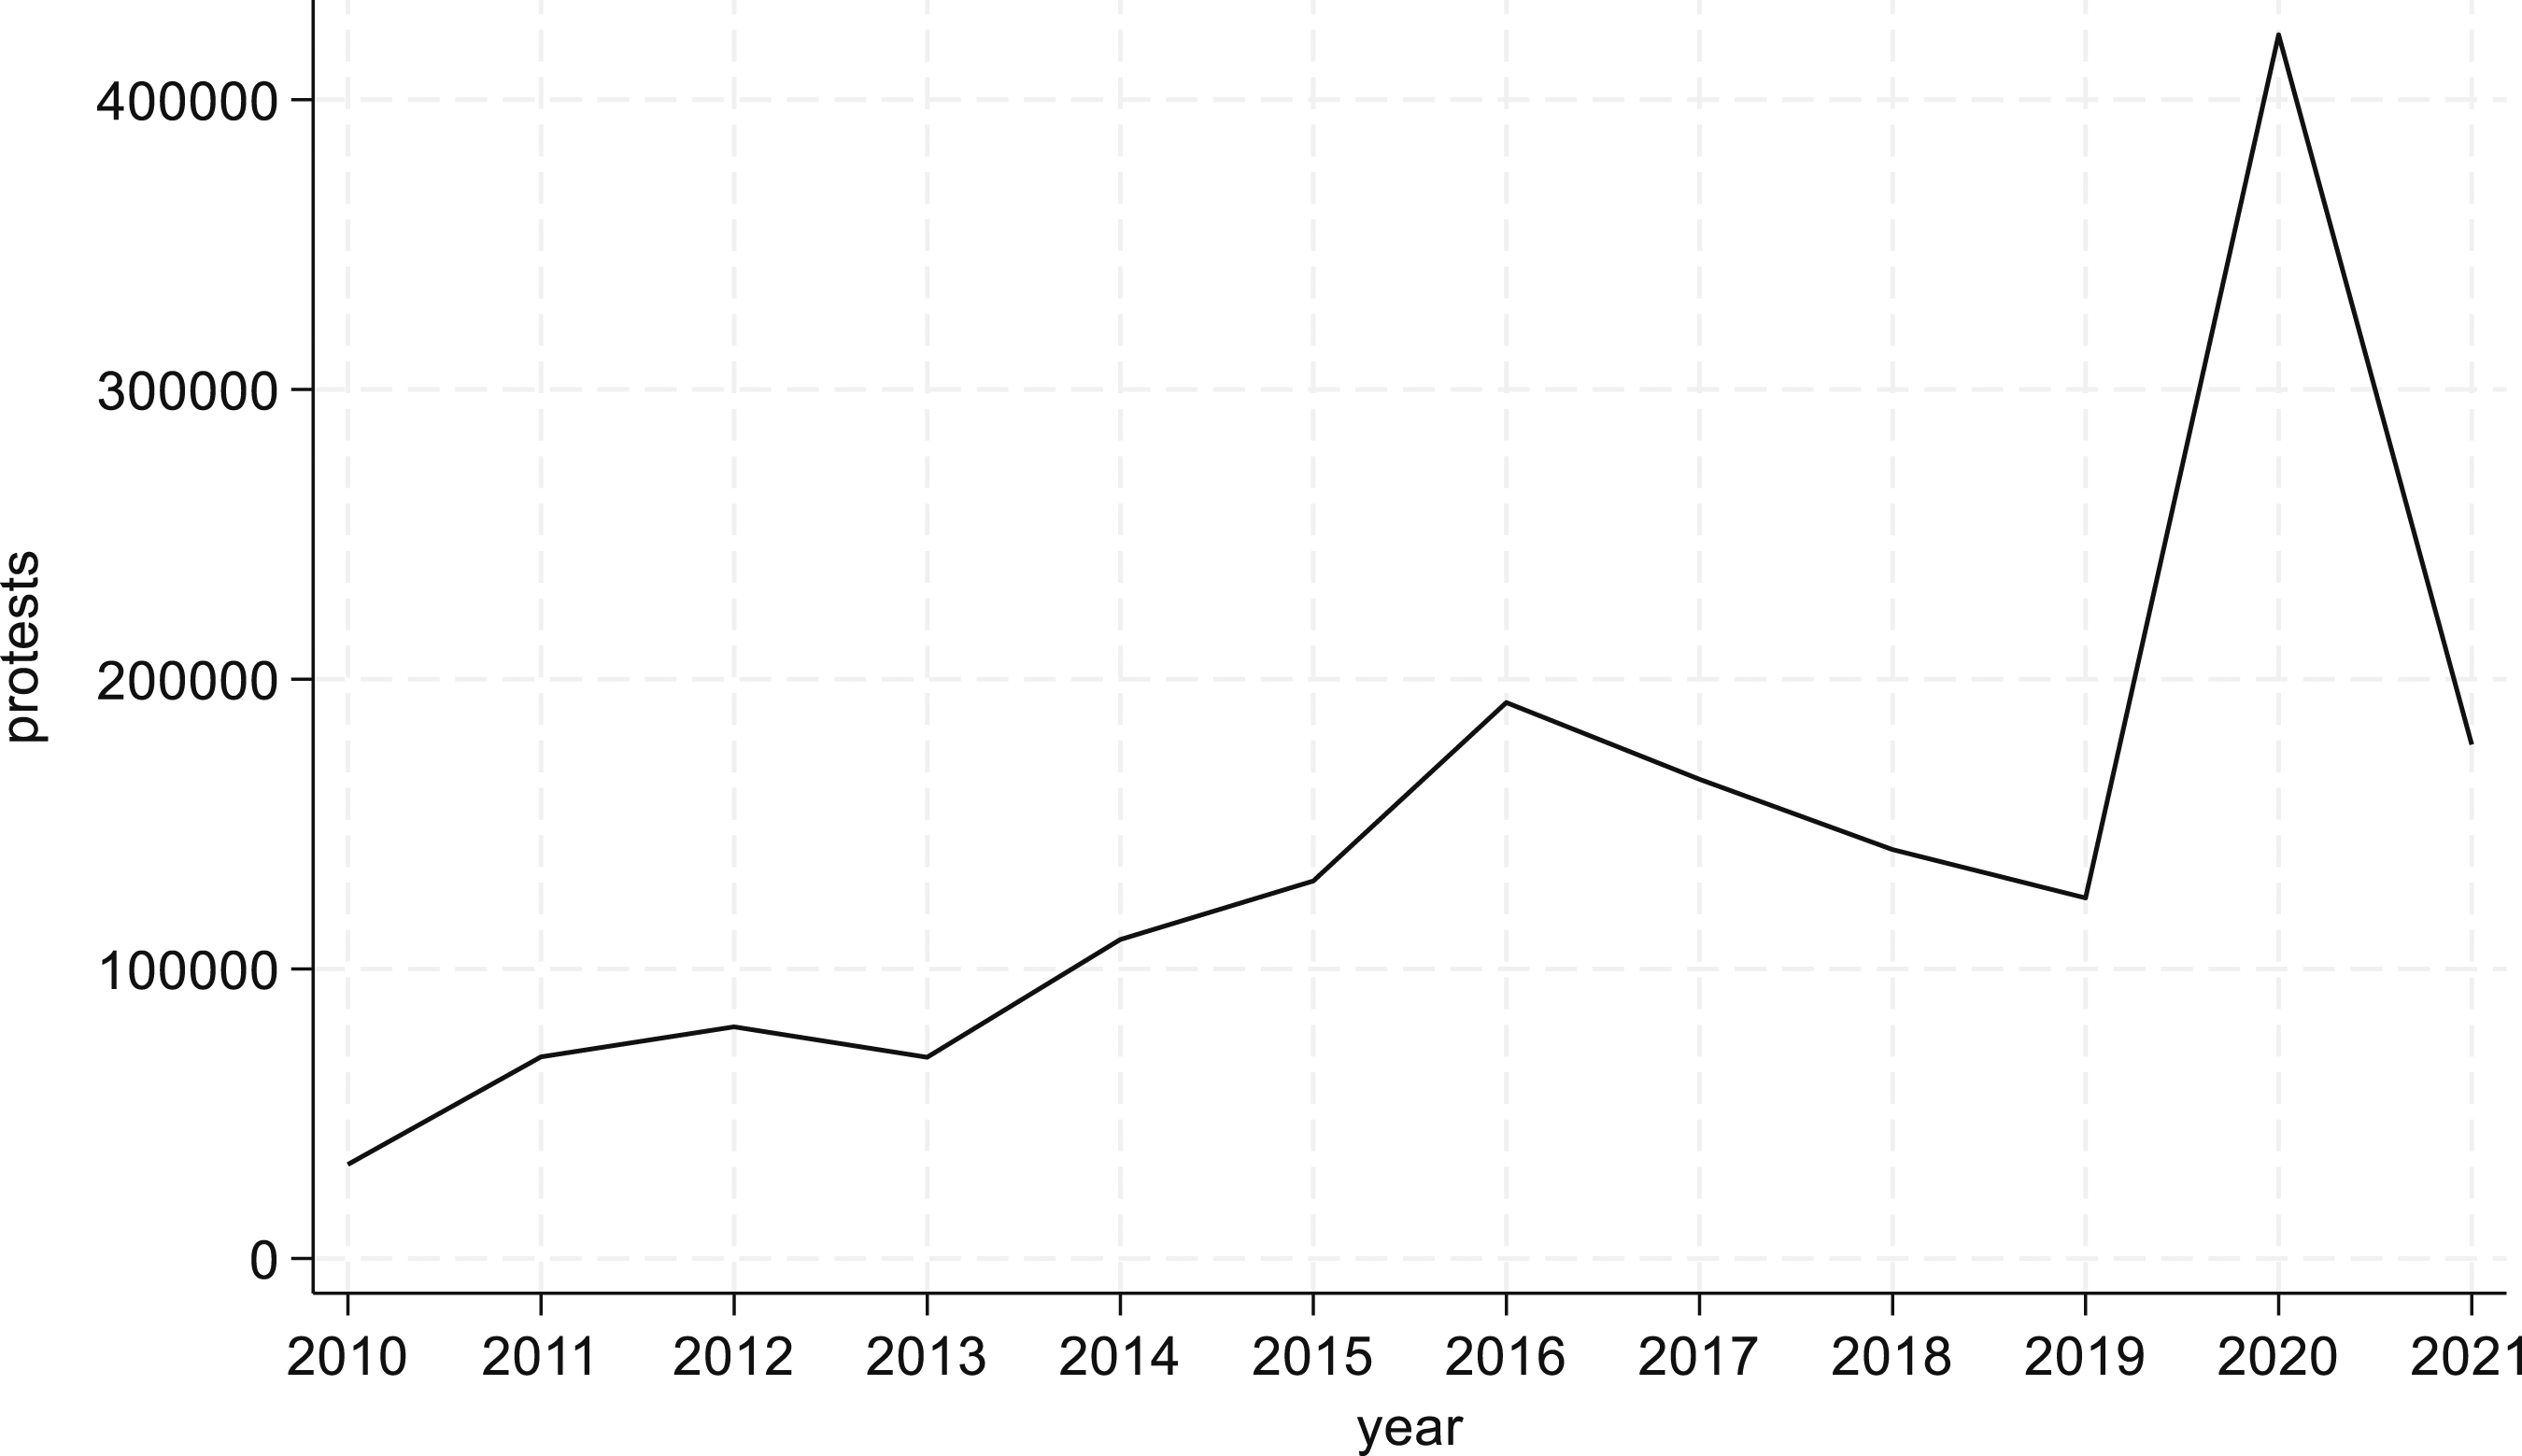
While COVID-related protests seemed initially to be fueled by political polarization and ideological anger at government-imposed restrictions, there is now a growing understanding that these public demonstrations might have reflected ingrained discontent against persistent inequalities and structural divisions – which have been amplified by the impact of the pandemic across different racial, ethnic, and economic groups. Highest risk areas may have faced a ‘perfect storm’; lockdowns and other measures implemented to reduce the spread of COVID-19 may have magnified existing inequalities, thereby intensifying long-standing social and economic grievances associated to these pre-existing conditions, which subsequently led to rises in protests. Stringent measures to contain the pandemic led to large negative effects on labor markets and to substantial job losses, particularly among those employed in occupations which had been less able to transition to online work. As a consequence, these groups, more than others, might have suffered drastic reductions in their material well-being, which in turn could have magnified pre-existing disparities and historical feelings of injustice, motivating them to mobilize against the state. Evidence of this vicious cycle of public health crisis, persistent inequalities and social discontent is, however, largely anecdotal. The main aim of this paper is to disentangle empirically the role of (pre-existing) inequality in explaining the relationship between policy restrictions to contain the spread of COVID-19 and the incidence of protests in the USA and what mechanisms may explain such relationship.
To address this puzzle, we use a dataset compiled by the US Crisis Monitor, a collaboration between the Armed Conflict Location & Event Data Project (ACLED) (Raleigh et al. 2010) and the Bridging Divides Initiative at Princeton University. The US Crisis Monitor collected real-time data on protests across US counties between January 2020 and December 2021. To measure the impact of COVID-related policies, we exploit the Oxford COVID-19 Government Response Tracker (OxCGRT) (Hale et al. 2020), which collects systematic information on policy responses to the pandemic taken by governments in 180 countries. The detailed level of disaggregation of these datasets across units of analysis and time allows us to compare weekly variation in protest incidence across US counties which experienced different degrees of policy restrictions in response to COVID-19. 3 To test the role of pre-pandemic inequality, we use data on inequality at county-level compiled by the United States Census Bureau. In all estimations, we use county and week fixed effects to generate within-county estimates of the effect of policy restrictions on protest incidence between January 2020 and December 2021, across different amounts of county-level pre-pandemic inequality. This strategy reduces potential biases resulting from policy measures and protests being correlated with county-specific characteristics or changes in unobservable variables. However, it is still possible that policy stringency levels and protests are correlated with each other due to unobservable time-varying county-level characteristics or reverse causality. To address these concerns, we apply an instrumental variable (IV) strategy, which exploits the levels of policy stringency in neighbouring states as a source of exogenous variation.
All models show that more stringent policies have fuelled protests across the USA, but only in the most unequal counties; in our preferred specification, a 0.6-point increase in the stringency index (equivalent to the change experienced on average by all US counties in March 2020) leads to a 14-percentage point increase in the probability of a protest taking place in the most unequal counties. These results are largely explained by increased unemployment and reduced economic activities and spending in US counties with initially higher levels of inequality following the implementation of measures to curb population movements and social gatherings. Policy stringency measures were also associated with more protests in the most unequal counties which voted for the Republican party in the 2016 elections and exhibited, at the start of the pandemic, lower levels of trust in the president and lower satisfaction with democracy.
These results offer new contributions to two literature strands. First, we show new evidence for a causal effect of the interaction between inequality and policy stringency on protest incidence during the ongoing pandemic due to the adverse economic effects of policies to contain the spread of the virus. A large literature in economics, political science and sociology has long postulated a positive relationship between economic inequality and protests (Boix 2008; Gurr 1970; Lichbach 1989; Solt 2015; Tilly and Tarrow 2015). However, the causal identification of such relationship and of the mechanisms that may shape it has been elusive. Our results suggest that reactions to government policies (like those related to COVID-19) increase the likelihood of protests, but only in communities where grievances already existed (due to the high level of inequality). Even though some of these protests may have been portrayed in the media as reactions against the use of masks and other civil liberties, our results suggest that strong economic motivations may have been at the heart of these protests by plausibly having magnified discontent with pre-existing inequalities.
Second, we contribute to a growing literature on the consequences of pandemics (Barro, Ursua, and Weng, 2020; Blair, Morse, and Tsai 2017; Galletta and Giommoni 2022; González-Torres and Esposito 2020; Voigtländer and Voth 2013). Existing studies have largely focused on economic and social outcomes and much less is known about their political consequences (Eichengreen, Saka, and Aksoy 2023; Flückiger, Ludwig, and Önder 2019; Giommoni and Loumeau 2020). Only few studies have explored the consequences of the pandemic on protests. Neumayer, Pfaff, and Plümper (2023) have reported that more protest events in Europe in the time of the COVID-19 pandemic correlated with the stringency of policy restrictions but also with political factors. In a comparative study of the US, Pfaff, Plümper, and Neumayer (2023) have argued that protests during the pandemic were politicized, with a higher incidence of protests in Democratic states than in Republican ones. Pfaff, Plümper, and Neumayer (2023) have also controlled for the level of income inequality at the state level in their analysis reporting a positive correlation between protests and inequality. We bring into this literature two main innovations. Unlike Pfaff, Plümper, and Neumayer (2023), we use more granular information about inequality and mitigate problems in terms of reverse causality using information before the outbreak of the pandemic. We show that economic factors, particularly pre-existing inequality and the economic costs of the crisis, are the main drivers in explaining protests in the US during the COVID-19 pandemic period. By contrast, we find limited direct support for the political preferences hypothesis, although further heterogeneity analysis suggests that policy stringency measures and inequality interplayed with political factors.
Finally, we add to a body of work on the links between rising inequality and political polarization (Gilens 2012; McCarthy, Keith, and Howard 2006), and the consequences of such polarization for the rise of populism and the sustainability of democracy (Guriev and Papaioannou 2022). This literature argues that global rises in inequalities have led to increased political polarization, the capture of the political system by those at the top of the income distribution, and the erosion of democratic structures. We show that counties with initially high levels of economic (and racial) inequality at the start of the pandemic were in fact more likely to protest during the COVID-19 pandemic against government policies that further deteriorated their economic standing – despite those policies curtailing the spread of the pandemic. These results are of relevance to the USA but also to other countries where political polarization has been growing alongside economic inequality, and we discuss these implications in the conclusion.
Theoretical Framework
Several US counties experienced a surge in protests from around mid-April 2020, with protesters voicing their anger about lockdown restrictions, racial discrimination and in pro- and against-Trump rallies. Protests increased considerably in the USA in 2020 in relation to previous years (Figure 1), with large variation across different counties. Why did protests rise when a pandemic was rampant? And what explains the variation in protest incidence during the COVID-19 pandemic across US counties? To address these two questions and explain the rise in protests during the COVID-19 pandemic, we draw on multiple theoretical approaches and connect established findings in these fields which have few touchpoints but mutual relevance.
A long-established explanation for why citizens protest is that of the Political Opportunity Structure theory, which illustrates how citizens’ decision to engage in collective action is a result of economic, social, and political opportunities (e.g., McAdam, Tarrow, and Tilly, 2001; Meyer 2004; Tilly 1978; Tilly and Tarrow 2015). According to this approach, the institutional context determines a structure of opportunities that may facilitate or constrain social mobilization and protests. The COVID-19 pandemic and the resulting policy responses might have affected people`s perceptions about the opportunities available to engage in protests by modifying the structure of costs associated with collective mobilization. On the one hand, policing of curfews and social distance guidelines may have increased the social coordination costs of protests due to the likelihood of large gatherings being broken up by law enforcement. On the other hand, a shock like the COVID-19 and the degree of uncertainty surrounding the initial responses to the crisis might have yielded the perception of a weak government and instability creating political opportunities for political mobilization. Engaging in civil resistance movements carries additional opportunity costs resulting from exchanging time spent on working or leisure activities for time spent on engaging in collective actions. Closing workplaces, banning travel, and canceling festivals may lower these costs increasing the opportunities for individuals to invest more time in protests (see Grossman 1991).
But the decision to participate in protest is not only based on opportunity costs. Recent contributions also show that emotions concerning a disease outbreak contribute to shaping political decisions (Campante, Depetris-Chauvin, and Durante, 2024). In times of anxiety, citizens may prefer the “safest” scenario; fear of falling ill or of spreading the virus to others may have thus lowered the individual incentives of participating in protests because of people try to socially distance from each other to avoid exposure to the virus. 4 The escalation of violence during initial demonstrations may have also contributed to constraining protest participation (Dave et al. 2021). However, instability may rise once tension development overshoots or outpaces the adaptation capacity of society – which refers to its capability to cope with different emotions such as fear, stress, or social tension. The length of lockdowns and stay-at-home orders may have therefore driven people to resent social isolation and social distance measures (Armbruster and Klotzbücher 2020; Briscese et al. 2023), and to become less willing to accept restrictions on their freedom and liberties (Alsan et al. 2020).
Both theoretical frames around political opportunity structures and emotional responses seem to suggest that the causal relationship between the rise of protests in the USA in 2020 and policy restrictions implemented to contain COVID-19 is theoretically ambiguous and will depend on specific contexts. However, neither of these two approaches takes into consideration that different areas or groups will face different costs and incentives to engage in social mobilization, which is mainly determined by the interplay between opportunities, emotions and pre-existing conditions. One useful framework to explain the role of pre-existing conditions in shaping political decisions is the longstanding Deprivation theory, which emphasizes the role of economic grievances, resulting from actual or perceived differences in the distribution of resources, that is, economic inequality, in motivating people to engage in protests (Gurr 1970). Recent evidence on the social, economic, and psychological effects of the COVID-19 pandemic suggests that protests during the pandemic may have reflected profound pre-existing discontent with economic conditions and structural divisions, which were in turn amplified by the differentiated effects of the pandemic across regions and social groups. Government-imposed restrictions may have further intensified perceptions about existing inequalities, thereby causing social discontent, which subsequently led to rises in protests (Enikolopov, Makarin, and Petrova 2020; Enos, Kaufman, and Sands 2019; Rozenas and Zhukov 2019). Hence, the first hypothesis we will test is the following;
Shocks like the COVID-19 pandemic magnify pre-existing economic inequalities and lead to protests in the most unequal areas.
If hypothesis 1 is correct, what are the channels through which the outbreak of the COVID-19 pandemic boosted protests in the most unequal areas? Empirical evidence shows that past health crises have contributed to increasing social instability – even though they were smaller in scale than the COVID-19 pandemic – due to their effects on socioeconomic outcomes (González-Torres and Esposito 2020; Li and Coppo 2020; Sedik and Xu 2020). The economic consequences of the COVID-19 pandemic were considerable and disrupted the day-to-day lives and material well-being of citizens. Lockdowns and other measures implemented to reduce the spread of COVID-19 led to large adverse effects on labor markets and to substantial job losses, particularly among those employed in low-skilled jobs (Sedik and Xu 2020). These drastic reductions in living standards in a short period may have, in turn, stimulated grievances and feelings of injustice, motivating people to protest. As unemployment and economic insecurity rose (IMF 2020; Li and Coppo 2020; Sedik and Xu 2020), the pandemic started to expose structural inequalities (Galletta and Giommoni 2022), which may have fueled feelings of relative deprivation, as first theorized by Gurr (1970). When perceptions of unfairness and anger at economic decline and social isolation reached certain thresholds, many may have reacted by engaging in protests and demonstrations (Justino and Martorano 2019). We will thus test in the empirical section the following hypothesis:
The COVID-19 pandemic boosted protests in the most unequal areas due to the economic consequences of the crisis.
In addition, it is plausible that pre-existing, political preferences may have also contributed to explaining people’s reactions to government responses to the pandemic. Notably, it appears that the COVID-19 crisis has led some groups to embrace populist and more extreme political positions, particularly among those who perceive preventive measures, such as wearing face masks or staying at home, as unjustified interventions that threaten human rights and individual freedoms. 5 Scholars have long highlighted the role of group identity and political preferences in promoting social mobilization (Dalton 2017; Tilly and Tarrow 2015; Wasow 2020). The recent Black Lives Matter (BLM) movement is an example of how these factors can play an important role in explaining people’s engagement in protests. Recent evidence also shows that participation in the Capitol insurrection on January 6, 2021 was connected to political preferences in previous elections (van Dijcke and Wright 2021). In addition, factors such as social and political trust and levels of civic engagement and social cooperation may play key roles in mobilizing individuals to protest, including during COVID-19 (Acemoglu, Hassan, and Tahoun 2018; Aghajanian, Justino, and Tranchant 2020; Justino and Martorano 2018, 2019; Levi and Stoker 2000; Manacorda and Tesei 2020; Neumayer, Pfaff, and Plümper 2023; Pfaff, Plümper, and Neumayer 2023; Sangnier and Zylbergerg 2017). 6 The third and final hypothesis we test is the following:
The effect of COVID-19 on protests in the most unequal areas is moderated by social and political context factors.
Context and Data
To test the hypotheses discussed in the previous section, we built a new dataset comprising 3,142 US counties from 50 states and the District of Columbia. For each county, we compiled information on (i) weekly-aggregated figures on COVID-related protest events, (ii) weekly changes in COVID-related policies, with a specific focus on movement-restriction policies, and (iii) a measure of income inequality in 2019, expressed as a Gini index. The period of analysis is January 2020-December 2021.
COVID-related Protests Events
The years 2020 and, to a lesser extent, 2021 were characterized by large turmoil all around the world. In the USA, politically motivated violence and instability were fueled by increased political polarization, violent hate crimes, and large-scale social movements. In 2020, several protests in the USA were motivated by social discontent against police brutality and led by the Black Lives Matter (BLM) movement. Demonstrations were also held in support and against President Trump and, from November 2020, against the results of the general election – eventually leading to the attack of the Capitol on January 6, 2021. American citizens also took to the streets to protest their discontent towards the government’s handling of the pandemic. 7
All protest events that occurred in the US between January 1 and December 31, 2021 were recorded by the Armed Conflict Location & Event Data Project (ACLED) and the Bridging Divides Initiative (BDI) at Princeton University under the US Crisis Monitor initiative. The dataset includes dates, actors, locations, fatalities, and types of all political violence and demonstration events in the USA. 8 All events are accompanied by a note describing the context of each event. Using these notes, we coded protest events based on their motives and actors.
We identify three distinct types of protests: COVID-related protests, which represent our main outcome of interest, Black Lives Matter-related protests, and general election-related protests.
9
Figure 2 illustrates changes in these protests in 2020.
10
The incidence of the three types of protests changed substantially across the year. BLM protests, which peaked at over 30,000 per week, are concentrated around the date of the killing of George Floyd in May 2020. Protests related to the presidential elections increase in the weeks leading to and following the general election. Protests related to COVID-19 are more evenly distributed but three peaks can be identified, coinciding with the COVID-19 waves in April, July, and November 2020. Protest events in USA by type, 2020.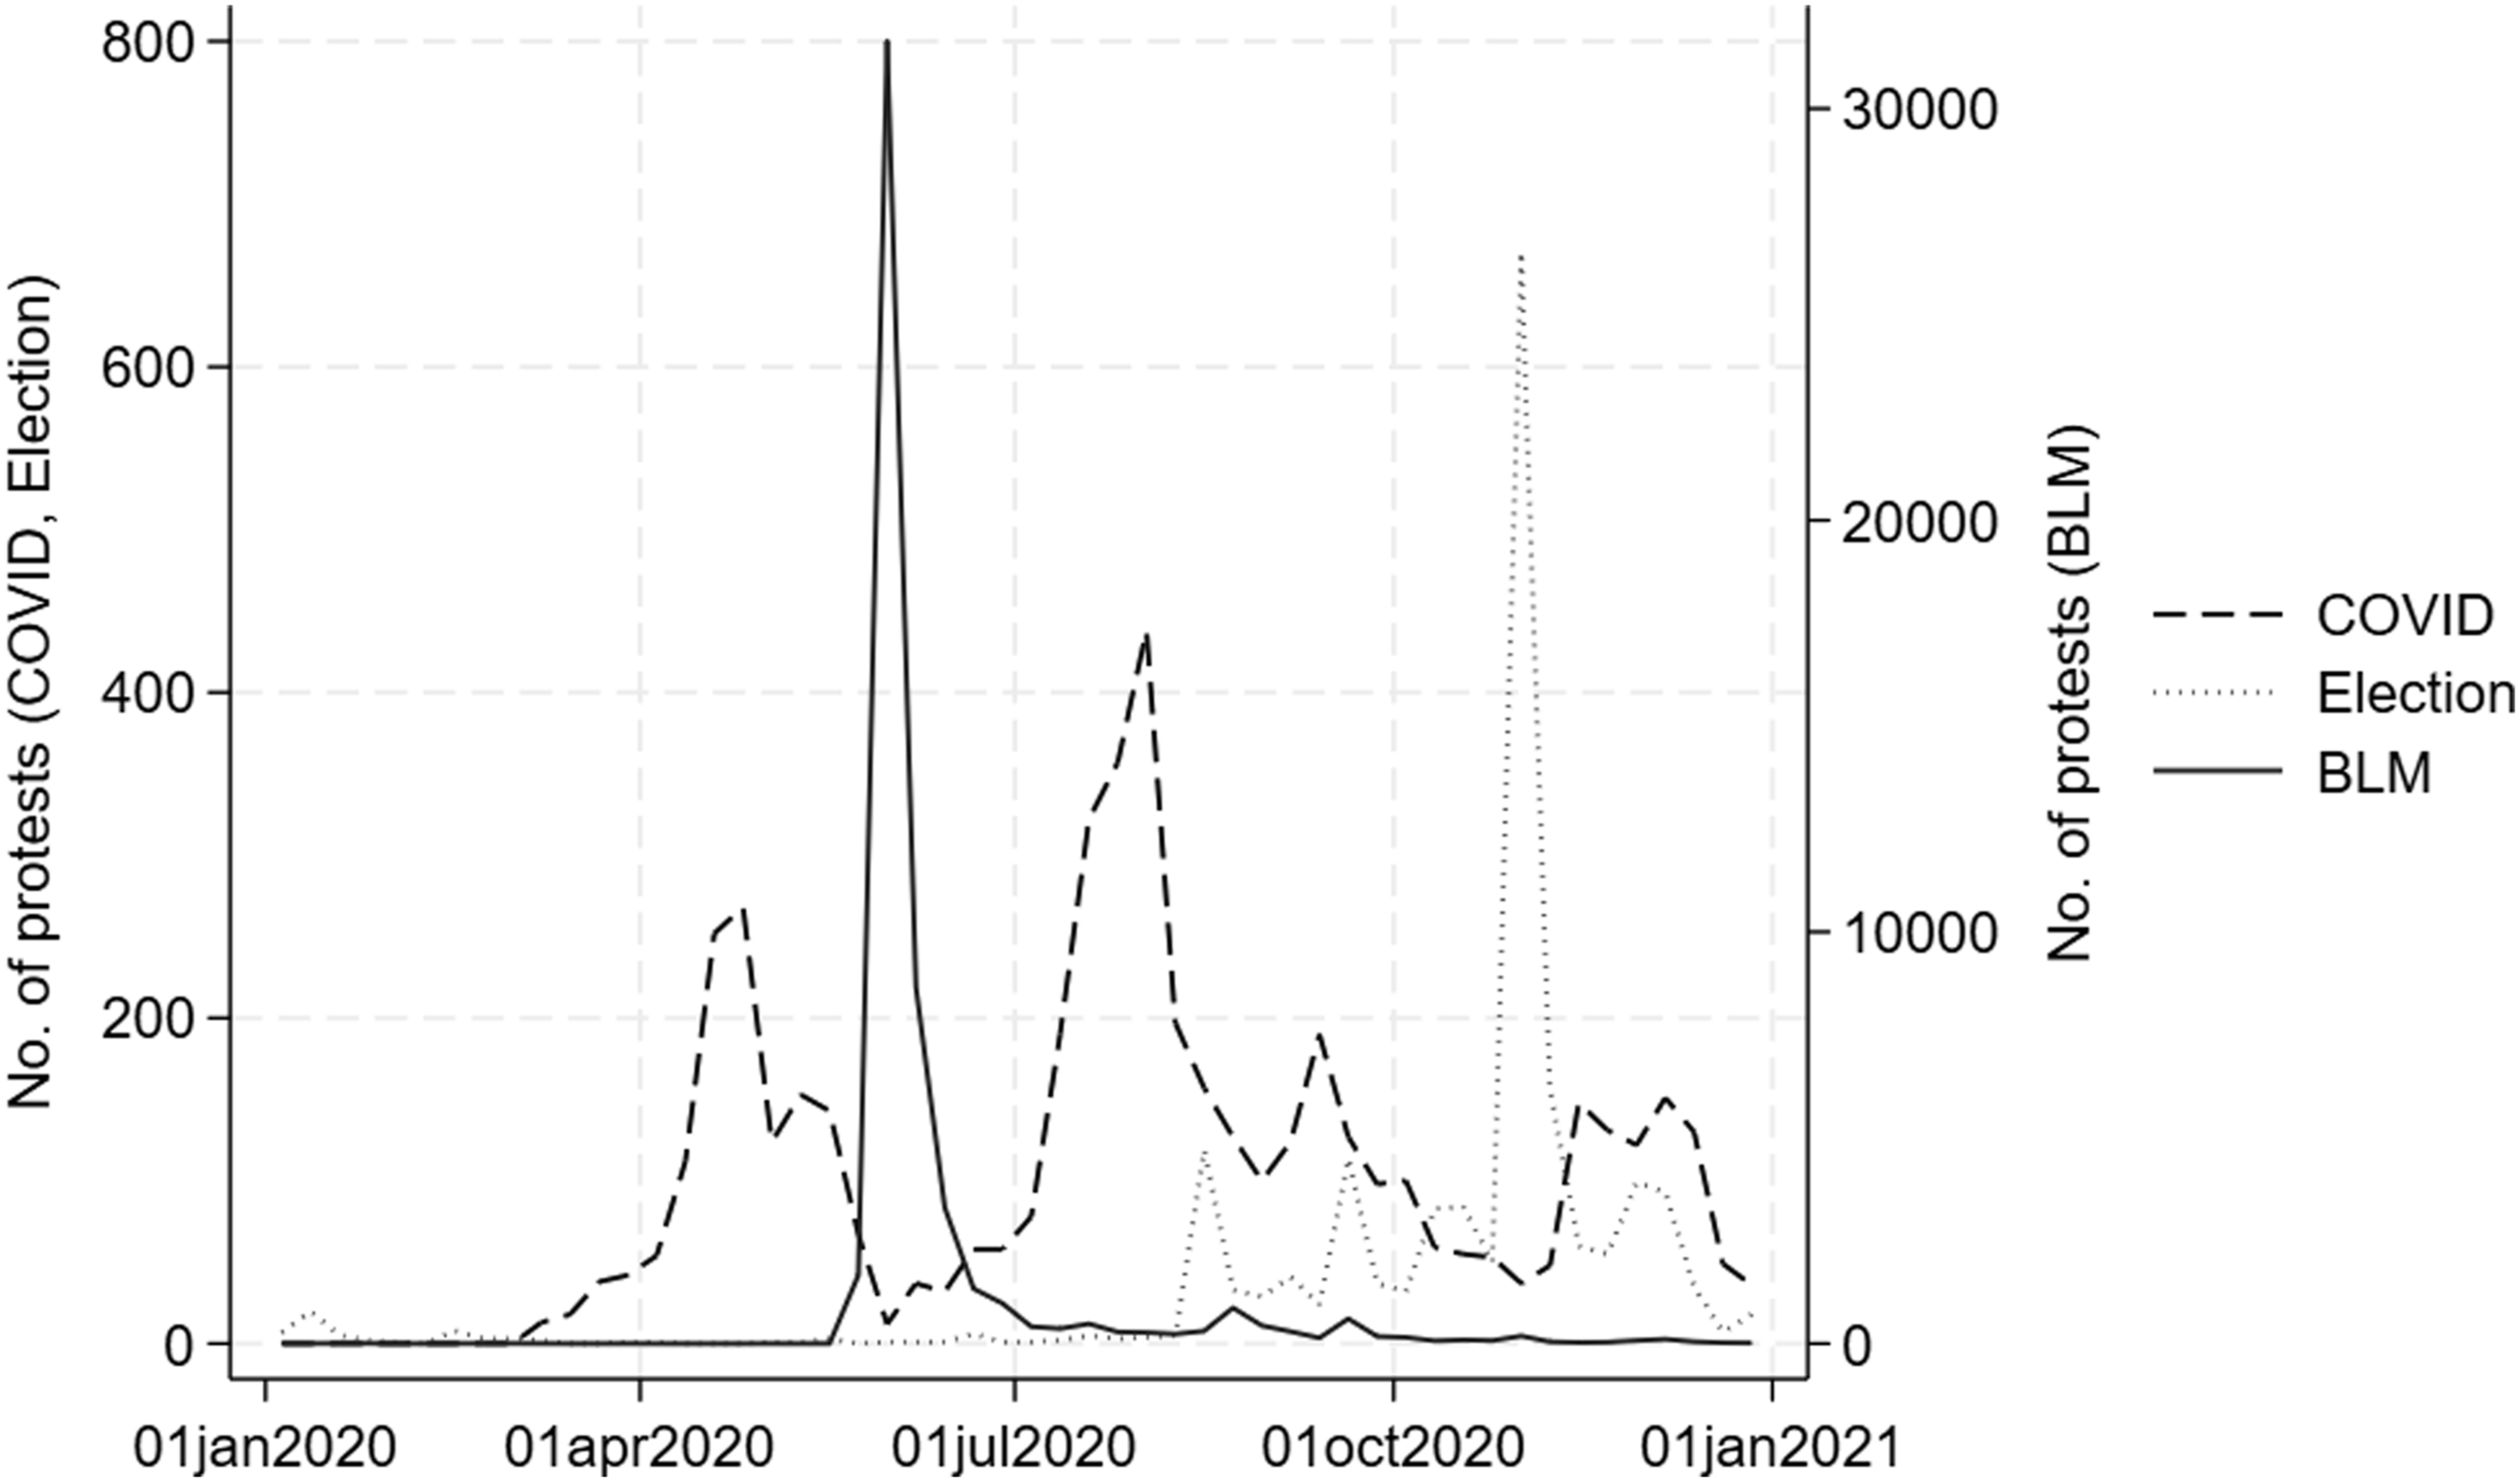
We base our main empirical analysis on the variable measuring protests related to COVID-19. We perform, however, sensitivity analysis with alternative definitions of COVID-related protest in Section A2 in Appendix A. We also re-estimate our baseline regression by substituting our main dependent variable with dummies for alternative protest events and for all protests. Results remain unchanged to the use of alternative definitions of COVID-related protest (Tables A3 and A4 in Section A2 in Appendix A) and confirm that protests were directly motivated by the effects of the pandemic (see Table A5 in Section A3 in Appendix A).
COVID-19 and Containment Policies
To curb the number of new COVID-19 infections, almost all countries across the world introduced policy measures to restrict the movement of people and social gatherings, both within and outside national borders.
Policy measures enacted in response to the COVID-19 pandemic were meticulously recorded by the Blavatnik School of Government at the University of Oxford (Hale et al. 2020). The Oxford COVID-19 Government Response Tracker (OxCGRT) collected systematic information on ‘lockdown’-style measures and scored the stringency of such measures. A total of 20 indicators were monitored across 180 countries. 11 Some of these indicators, particularly those related to movement and gathering restrictions, were aggregated into a Stringency Index ranging between 1 and 100, with 100 representing complete lockdown. In few countries, this information was also reported at subnational level. In the case of the US, information on ‘lockdown’-style measures and scored the stringency of such measures were available at state level.
We rescaled the Stringency Index into a continuous variable ranging between 0 and 1, with higher values representing more restrictions. Data show that stringency measures peaked in the USA in April 2020, when the index reached an average of over 0.60. There was another smaller peak in December 2020, followed by a steady reduction and reaching a plateau around July 2021 (Figure 3). Average stringency index in USA, 2020–2021.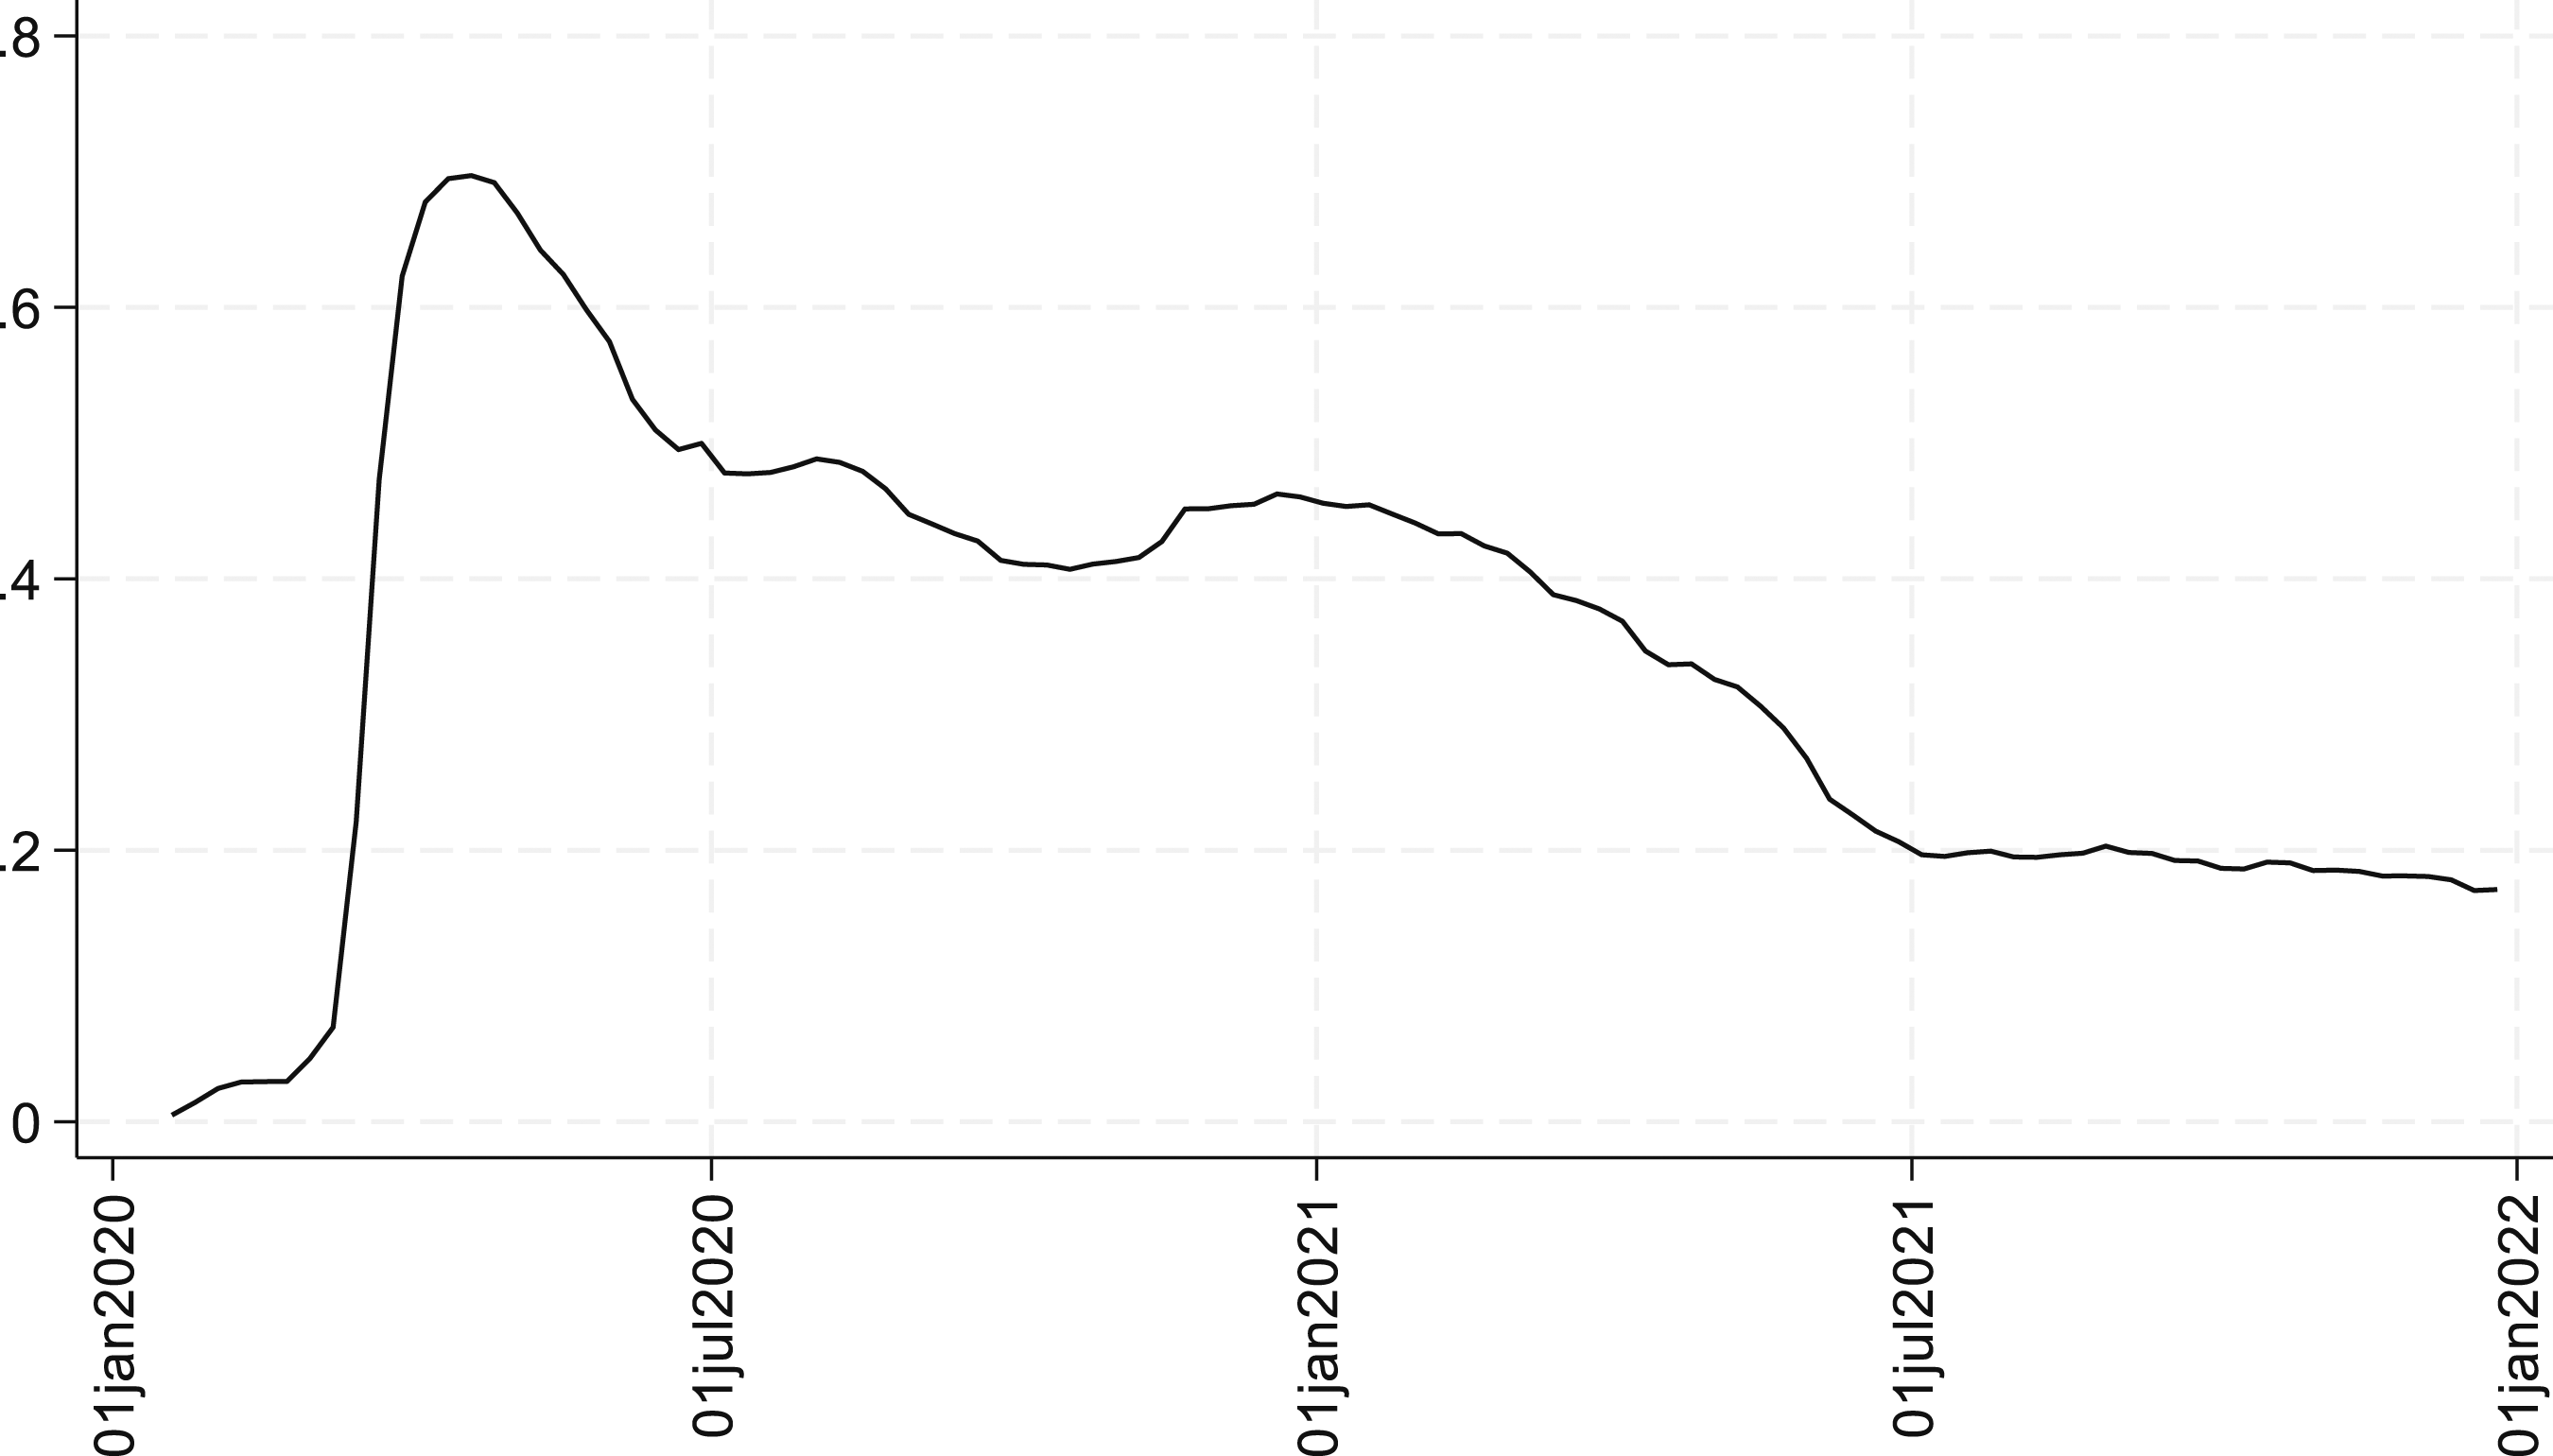
However, it is worth to note that there are interesting heterogeneities within the US as the federal government was reluctant to respond to the COVID-19 pandemic with movement limitations and lockdown-style measures. Hence, state governors implemented their own measures, with large policy variations across states.
12
As shown in Figure 4, coastal states consistently adopted more stringent policies in the period between January and December 2021, reflecting the faster spread of the virus in these areas (also the most populous in the country). In contrast, mid-western and southern states adopted much laxer restrictions and returned to them only in the summer, when holidaymakers and, later, university students acted as super-spreaders.
13
Stringency and protests in the USA, 2020–2021.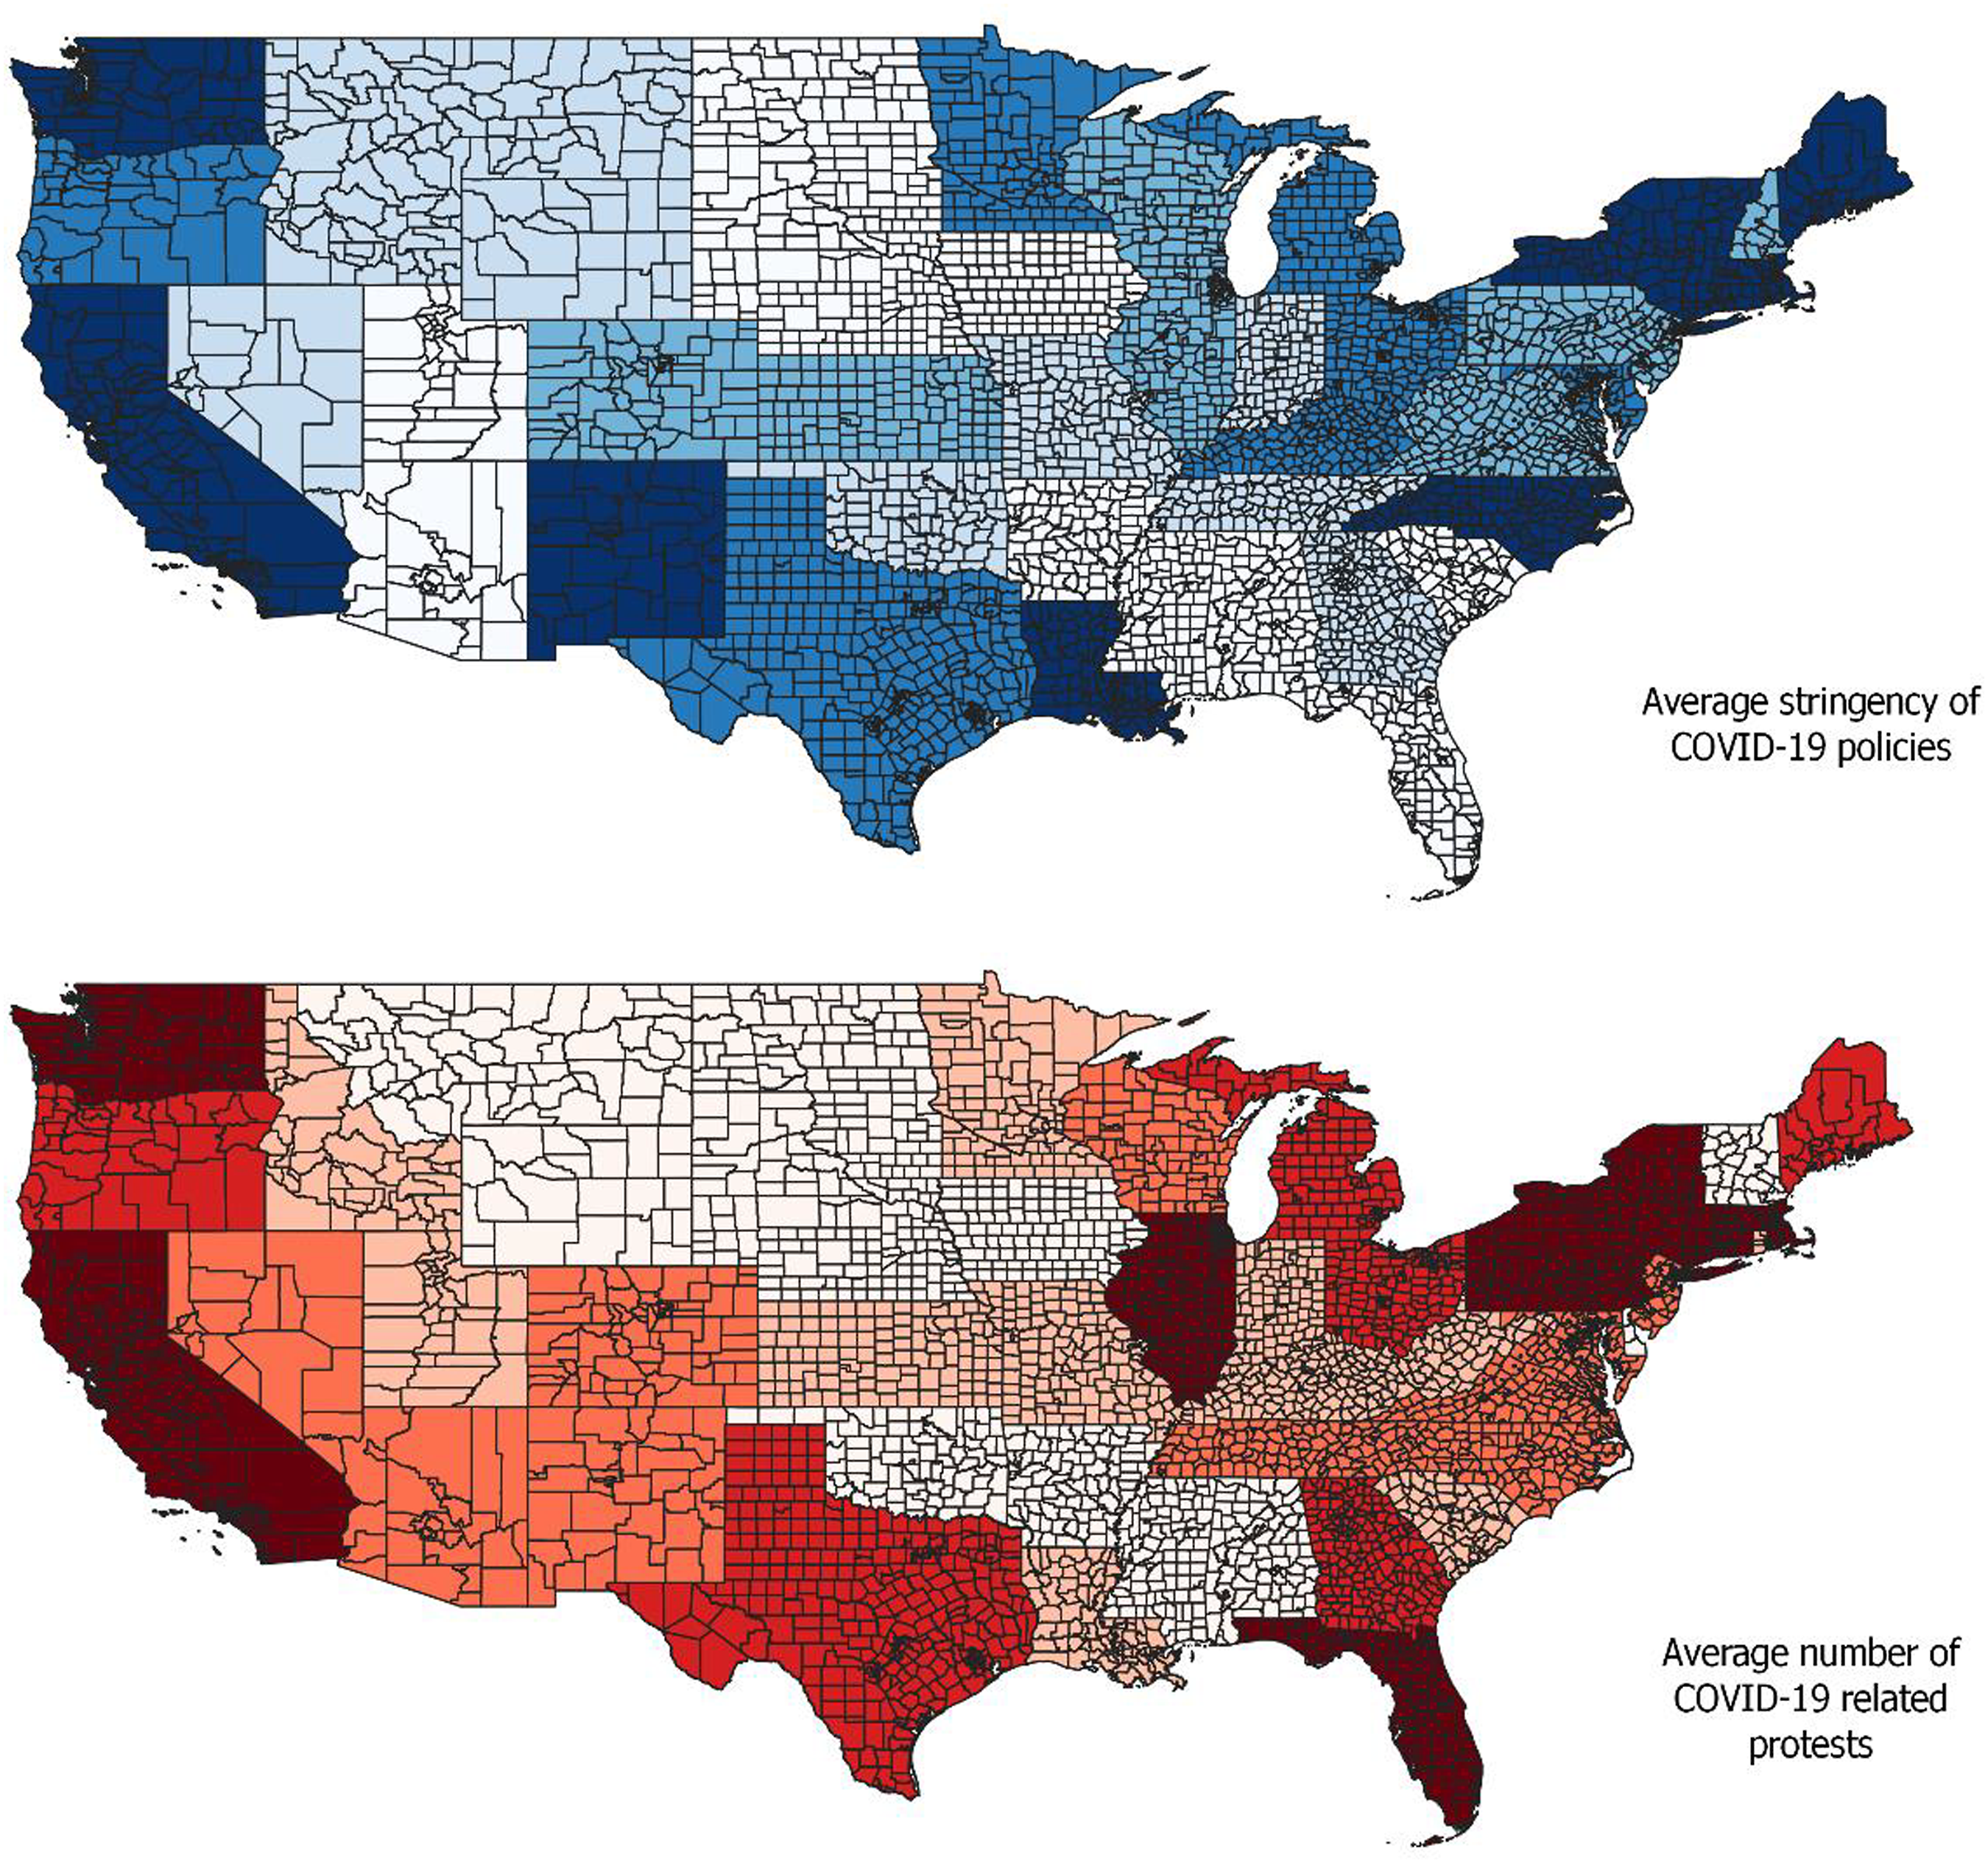
Inequality Across USA Counties
Inequality in the USA is higher than in almost any other developed country (Piketty 2014). In 2019, the USA had a Gini coefficient of 0.46, far above the average Gini coefficient in other OECD countries.
14
In this study, we use information on the Gini index for 2019 calculated using the United States Census Bureau data. The Gini index is calculated at county-level using household income data from the 2019 American Community Survey.
15
Estimates are available for all 3142 US counties included in our sample, with large variation across counties. As shown in Figure 5, the most unequal counties prior to the start of the pandemic are in the District of Columbia and in the South East – in particular, in the states of Louisiana and Mississippi. The most equal counties pre-pandemic are in Utah. Gini Index across USA counties, 2019.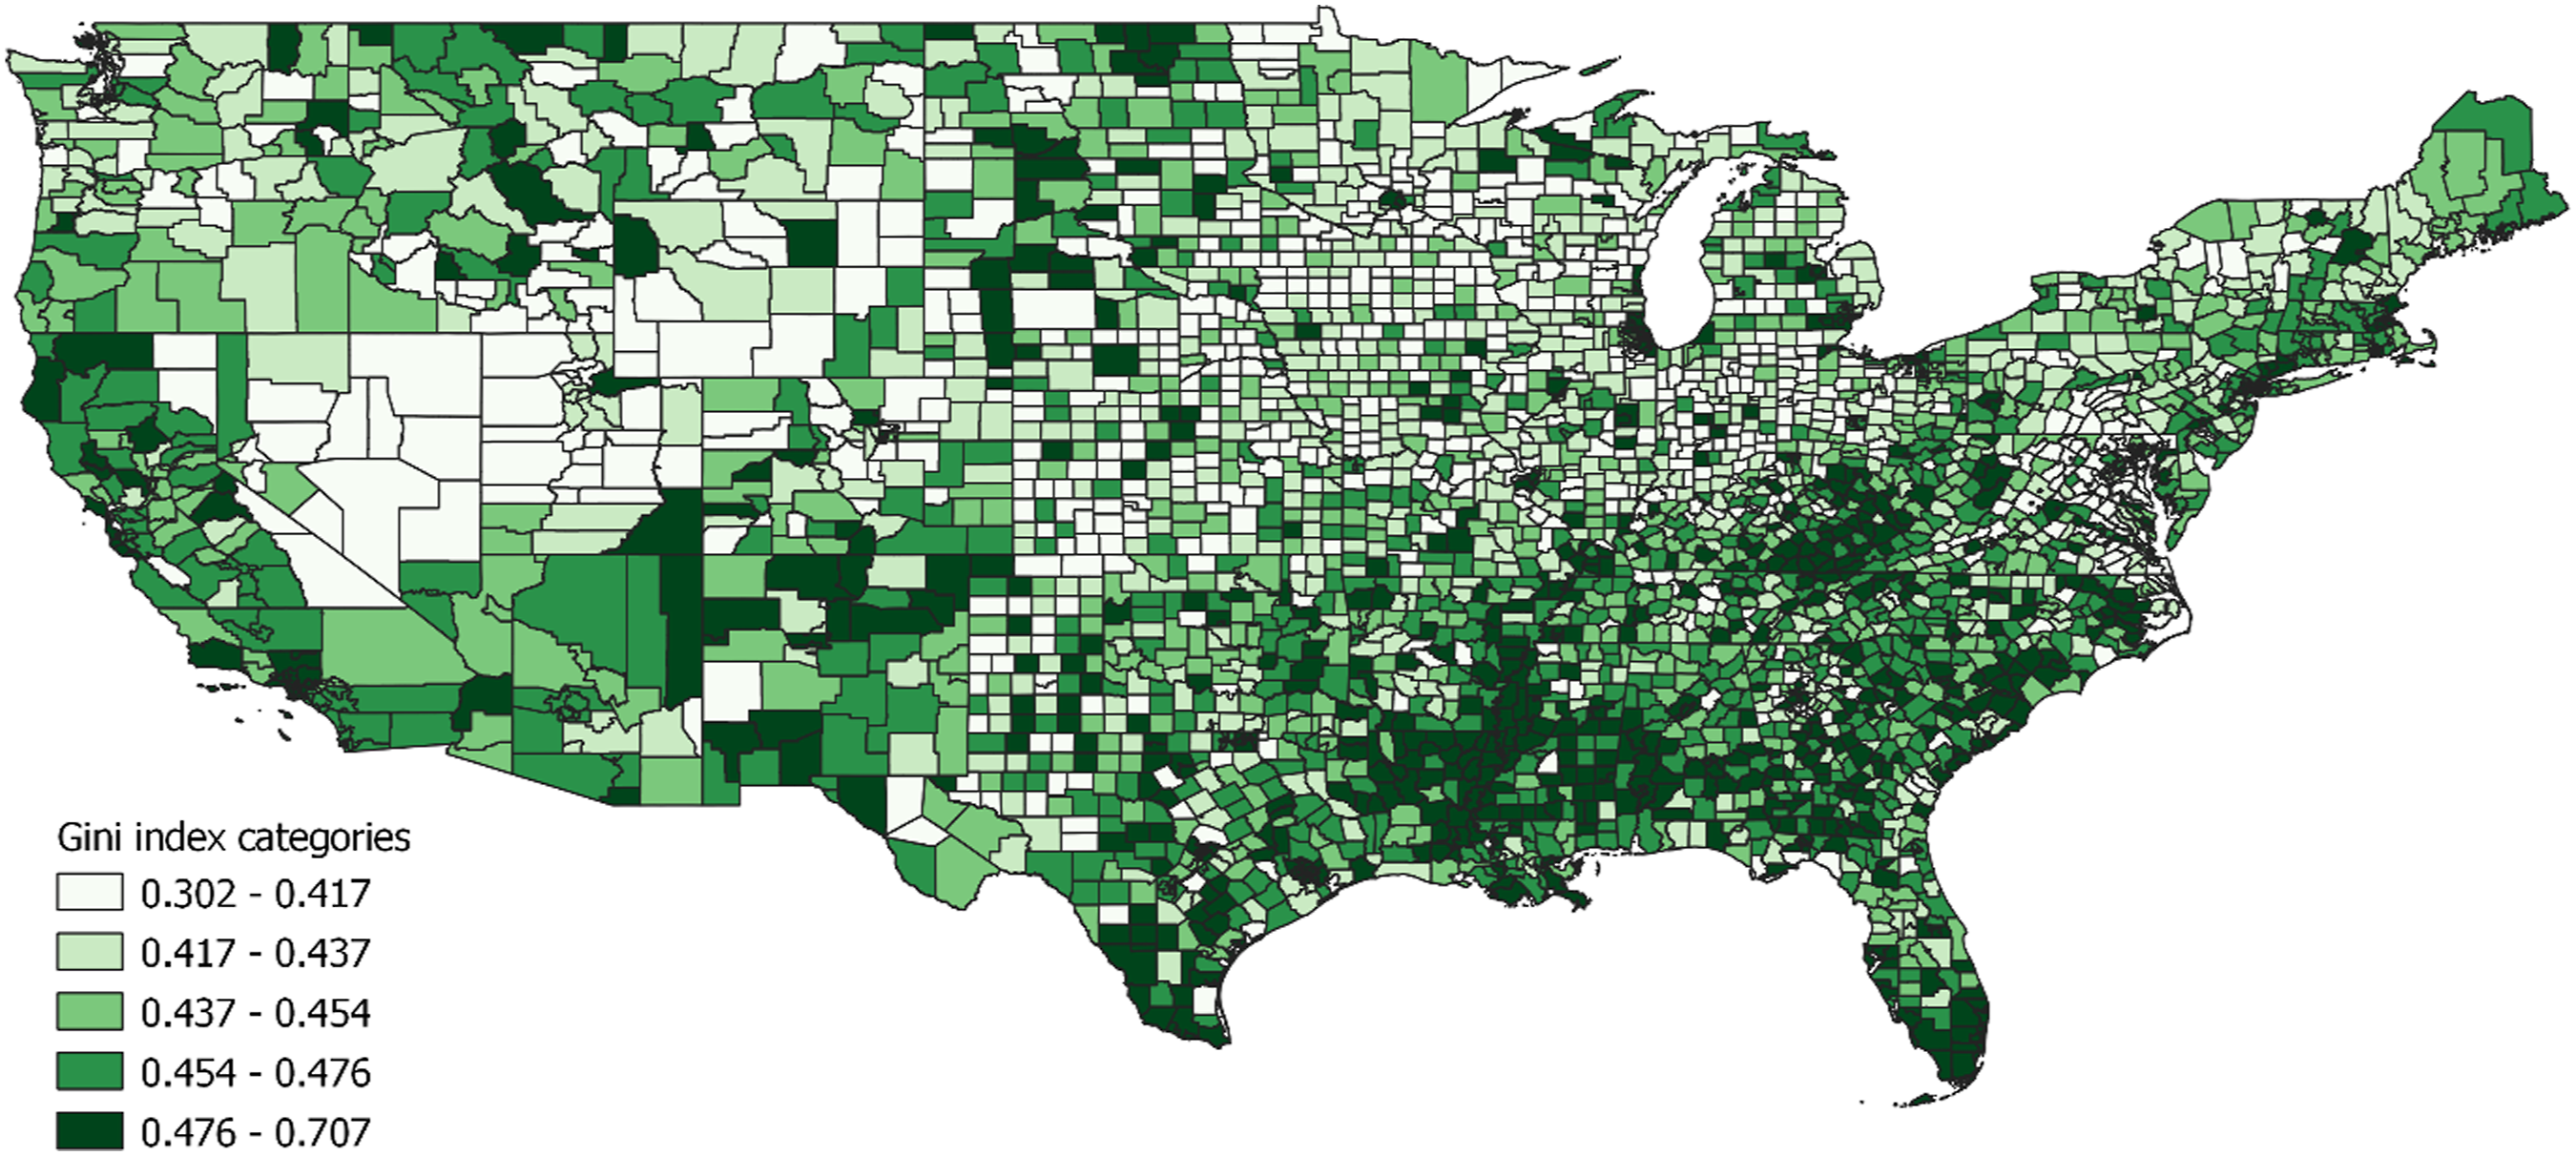
Empirical Strategy
Our empirical strategy starts by employing a difference-in-differences approach, which compares the effect of inequality on the incidence of protests in counties characterized by high and low inequality, respectively, before and after the week of March 16, 2020. The choice of this reference date is based on the declaration of COVID-19 as a global health pandemic on March 11 and its declaration as a national pandemic on March 13. US states reacted after those declarations and, on March 19, California issued the first stay-at-home orders. Within a few days, almost all US states had adopted stay-at-home orders. Formally, we have:

The approach above assumes an average policy response across all counties and ignores the panel dimension of our sample. As a second exercise, we use the Stringency Index described above, which captures the time-continuous change in the strictness of anti-COVID-19 policy measures across US states, and modify the regression model above as follows:

The main independent variables are the index measuring the stringency of anti-COVID-19 policies in state i in the week t, and the interaction term,
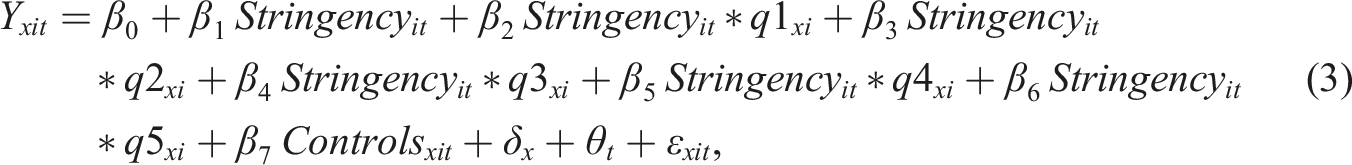
Equation (2) implies that the effect of the level of policy stringency on protest incidence varies linearly with the level of inequality. However, it might be possible that the impact of policy stringency varies across different levels of inequality in a non-linear manner. To capture these non-linearities, we interact levels of policy stringency with quintiles of the Gini index, as follows:
Equations (1)–(3) include several controls. First, we control for the (log) total number of COVID-19 cases to take into consideration a possible direct effect of the intensity of the health crisis on protests (Barrios et al. 2021). We use the number of cases recorded in the previous week to reduce potential concerns about reverse causality.
17
Other controls are based on a longstanding literature showing a close association between the incidence of protests and several social and economic variables (reviewed in Dalton 2017): population density,
18
percentage of non-white population, percentage of people employed in services, (log) number of people 18 years and older, (log) median household income in 2019, and number of political organizations per county. Since the data refer to cross-sectional county characteristics that change only very slowly across time, we interact these indicators with a linear time trend (Manacorda and Tesei 2020). Madestam et al. (2013) show, in addition, that political protests in the USA can be affected by local weather conditions. We control for weather conditions using average rainfall and land surface temperature for each county.
19
The definition and sources for all variables used in the paper are provided in Table A1 in Appendix A. Table A2 in the same Appendix provides descriptive statistics. To capture unobserved heterogeneity at the national and the local level, we include in equations (2) and (3) above county (
Empirical Results
Main Results
COVID-19, Policy Responses and Protests in USA Counties.
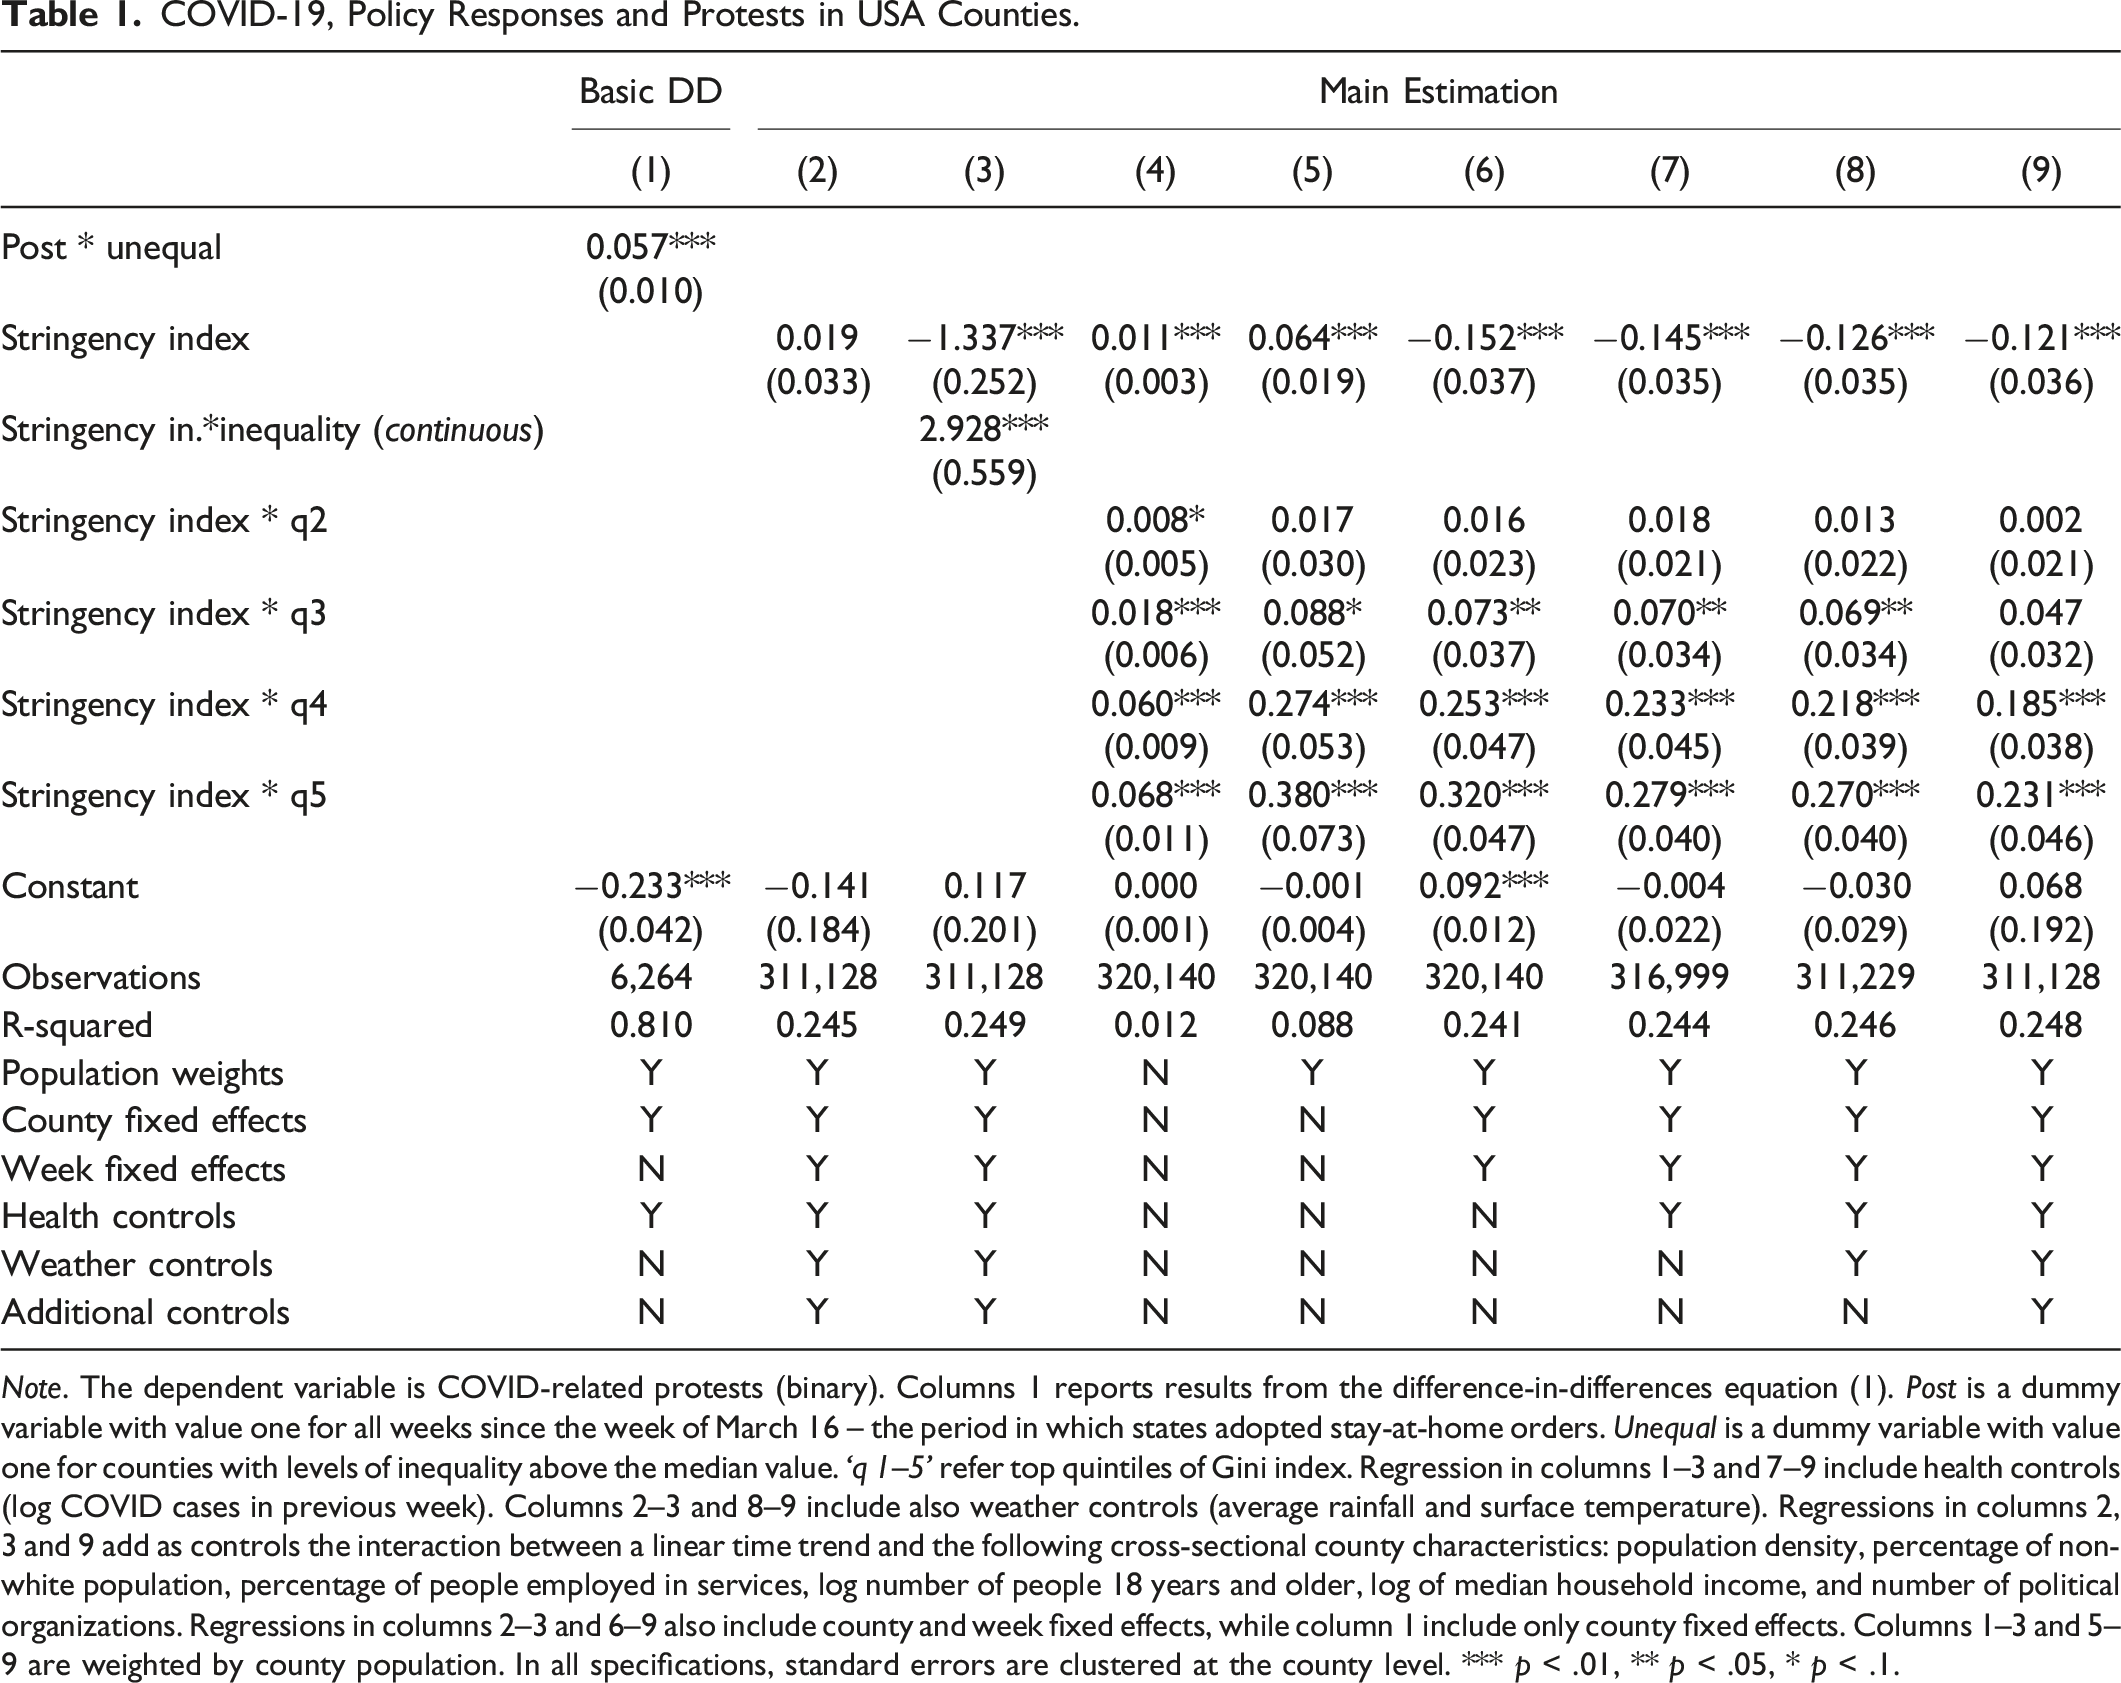
Note. The dependent variable is COVID-related protests (binary). Columns 1 reports results from the difference-in-differences equation (1). Post is a dummy variable with value one for all weeks since the week of March 16 – the period in which states adopted stay-at-home orders. Unequal is a dummy variable with value one for counties with levels of inequality above the median value. ‘q 1–5’ refer top quintiles of Gini index. Regression in columns 1–3 and 7–9 include health controls (log COVID cases in previous week). Columns 2–3 and 8–9 include also weather controls (average rainfall and surface temperature). Regressions in columns 2, 3 and 9 add as controls the interaction between a linear time trend and the following cross-sectional county characteristics: population density, percentage of non-white population, percentage of people employed in services, log number of people 18 years and older, log of median household income, and number of political organizations. Regressions in columns 2–3 and 6–9 also include county and week fixed effects, while column 1 include only county fixed effects. Columns 1–3 and 5–9 are weighted by county population. In all specifications, standard errors are clustered at the county level. *** p < .01, ** p < .05, * p < .1.
Moving to equation (3), column 4 confirms that more stringent measures to contain the pandemic are instrumental in driving the incidence of protests but its effect varies across different levels of inequality. The interaction terms between the index of policy stringency and all inequality quintiles are always positive but the interaction term is statistically significant only for the most unequal counties (quantiles 3, 4 and 5 of the Gini coefficient). In columns 5–9, we add population weights, fixed effects, and all controls in sequence. The coefficients of interest remain largely unchanged across all specifications.
Our preferred specification in column 9 includes population weights, county and week fixed effects and all controls discussed above. The results in this column also support the main hypothesis (Hypothesis 1) indicating that a one standard deviation increase in the stringency index leads to an increase of five percentage points change in the probability a protest occurs in the most unequal counties. This translates into a 14-percentage point increase in the probability of a protest taking place in the most unequal counties in response to a 0.6-point increase in the stringency index (the average change experienced by all US counties in March 2020).
As an additional exercise, Figure 6 depicts visually the effect of policy stringency on protests at different levels of inequality. In Panel A of Figure 6, we constrain the effect of stringency to vary linearly with the level of inequality. Results confirm that the impact of stringency is magnified by the level of inequality: the effect is negative at very low levels of inequality and becomes progressively more strongly positive as inequality rises. Panel B of Figure 6 shows that the impact is not linear, justifying the decision of allowing the effect of stringency to vary across different quintiles of inequality. As discussed, statistically significant effects are only found at the top of the inequality distribution, while the effects at the bottom of the distribution are close to zero. Effect of stringency on protests at different levels of inequality.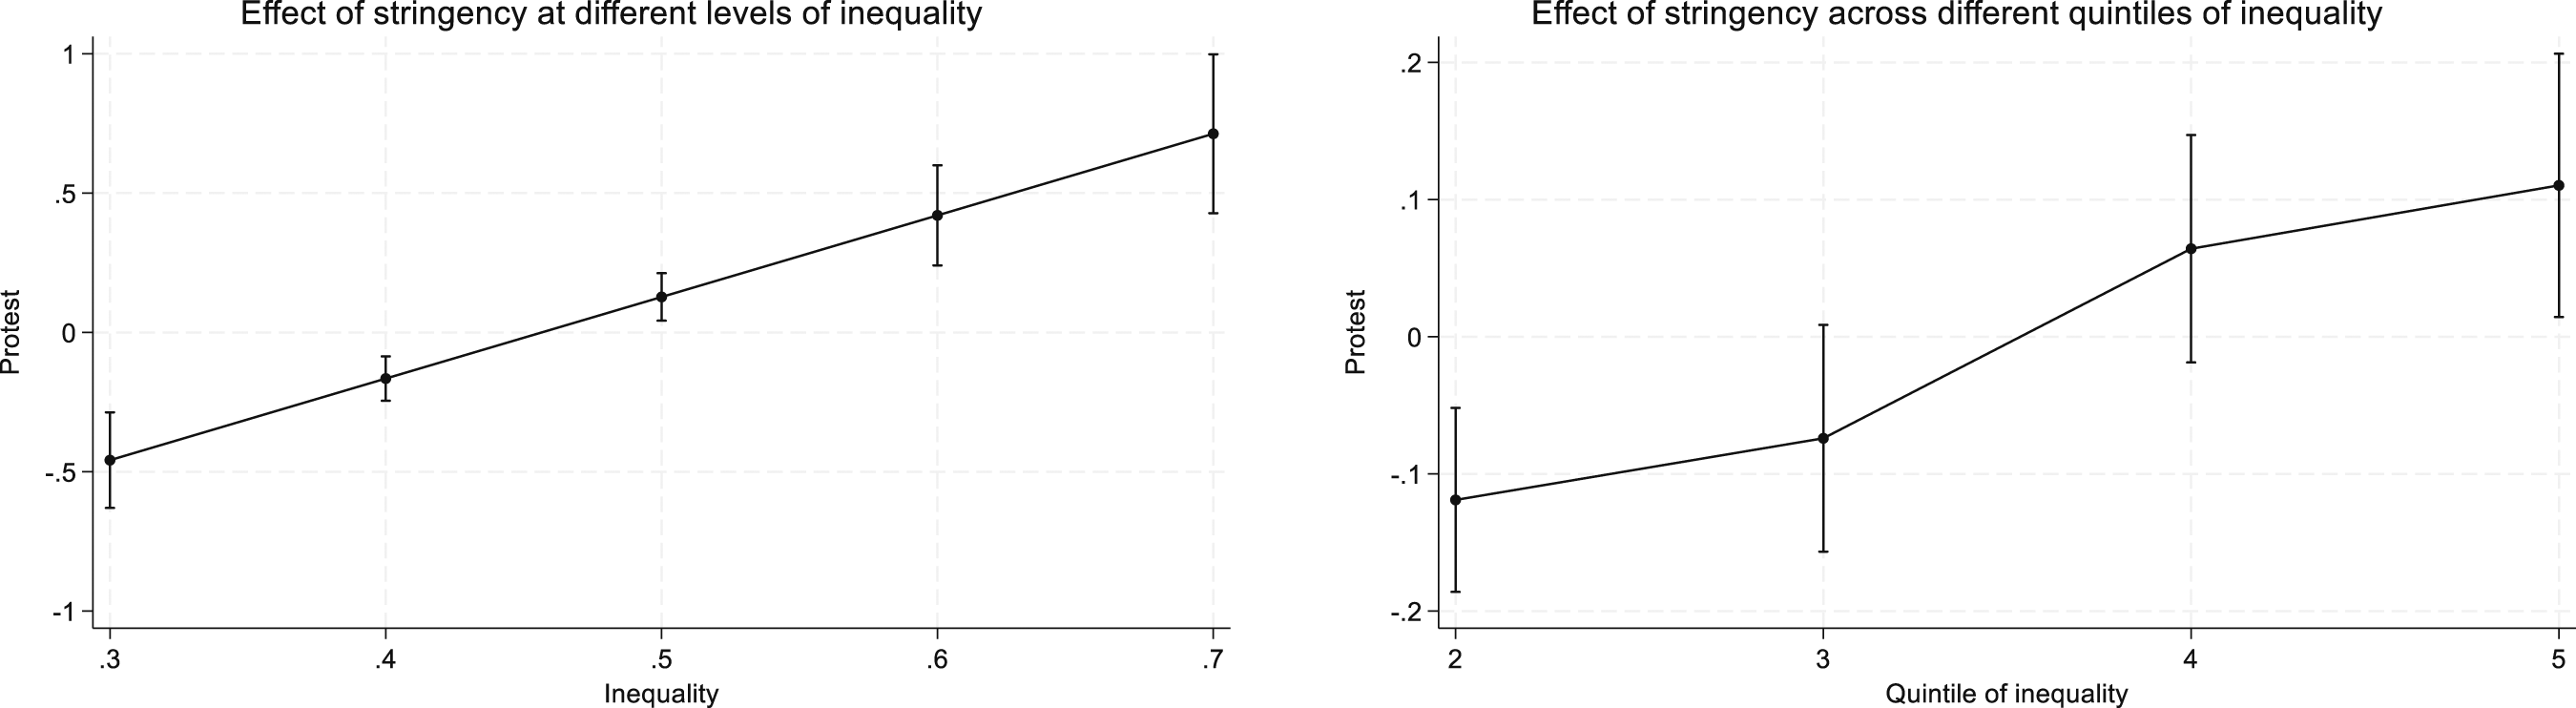
Parallel Trends and Endogeneity
Identification in specifications (1)–(3) above relies on the assumption of parallel trends. This assumption implies that, in the absence of COVID-19, the probability of protest incidence would follow a parallel trend in areas characterized by different levels of inequality. While this assumption cannot be easily tested, we nonetheless provide supportive evidence for the likely existence of parallel trends by testing if trends in the outcome variable (probability of protests) before the outbreak of the COVID-19 pandemic are parallel across different levels of exposure to the treatment (levels of inequality). In this exercise, we follow Egorov et al. (2021) and plot the observed protests over time separately for low-middle unequal counties (those in the first two quintiles) and highly unequal counties (those in the three highest quintiles). To conduct this test, we need information on protest events prior to the beginning of the pandemic. Since the US Crisis Monitor data is only available from 1st January 2020, we test for parallel trends using the alternative Google’s Global Database for Events, Language and Tone (GDELT).
20
Although the GDELT algorithm may potentially identify a larger number of protest events than ACLED/US Crisis Monitor’s researcher-based approach, the trends between the two databases for 2020 and 2021 are almost perfectly comparable, as shown in Figure C1 in Appendix C, with protest peaks registered in both cases at the end of May 2020 (following the killing of George Floyd). Results in Figure 7 show that trends in the probability of protest incidence are parallel in areas with different levels of inequality (Panel A). We also run an additional test that considers the observed number of protests over time separately for counties with levels of policy stringency above and below the median. Figure 7 shows no visible difference in the probability of protest incidence in areas with different levels of policy stringency (Panel B). Probability of protests before COVID-19. Panel A. Probability of protests before COVID-19 across different levels of inequality, Panel B. Probability of protests before COVID-19 across different levels of stringency.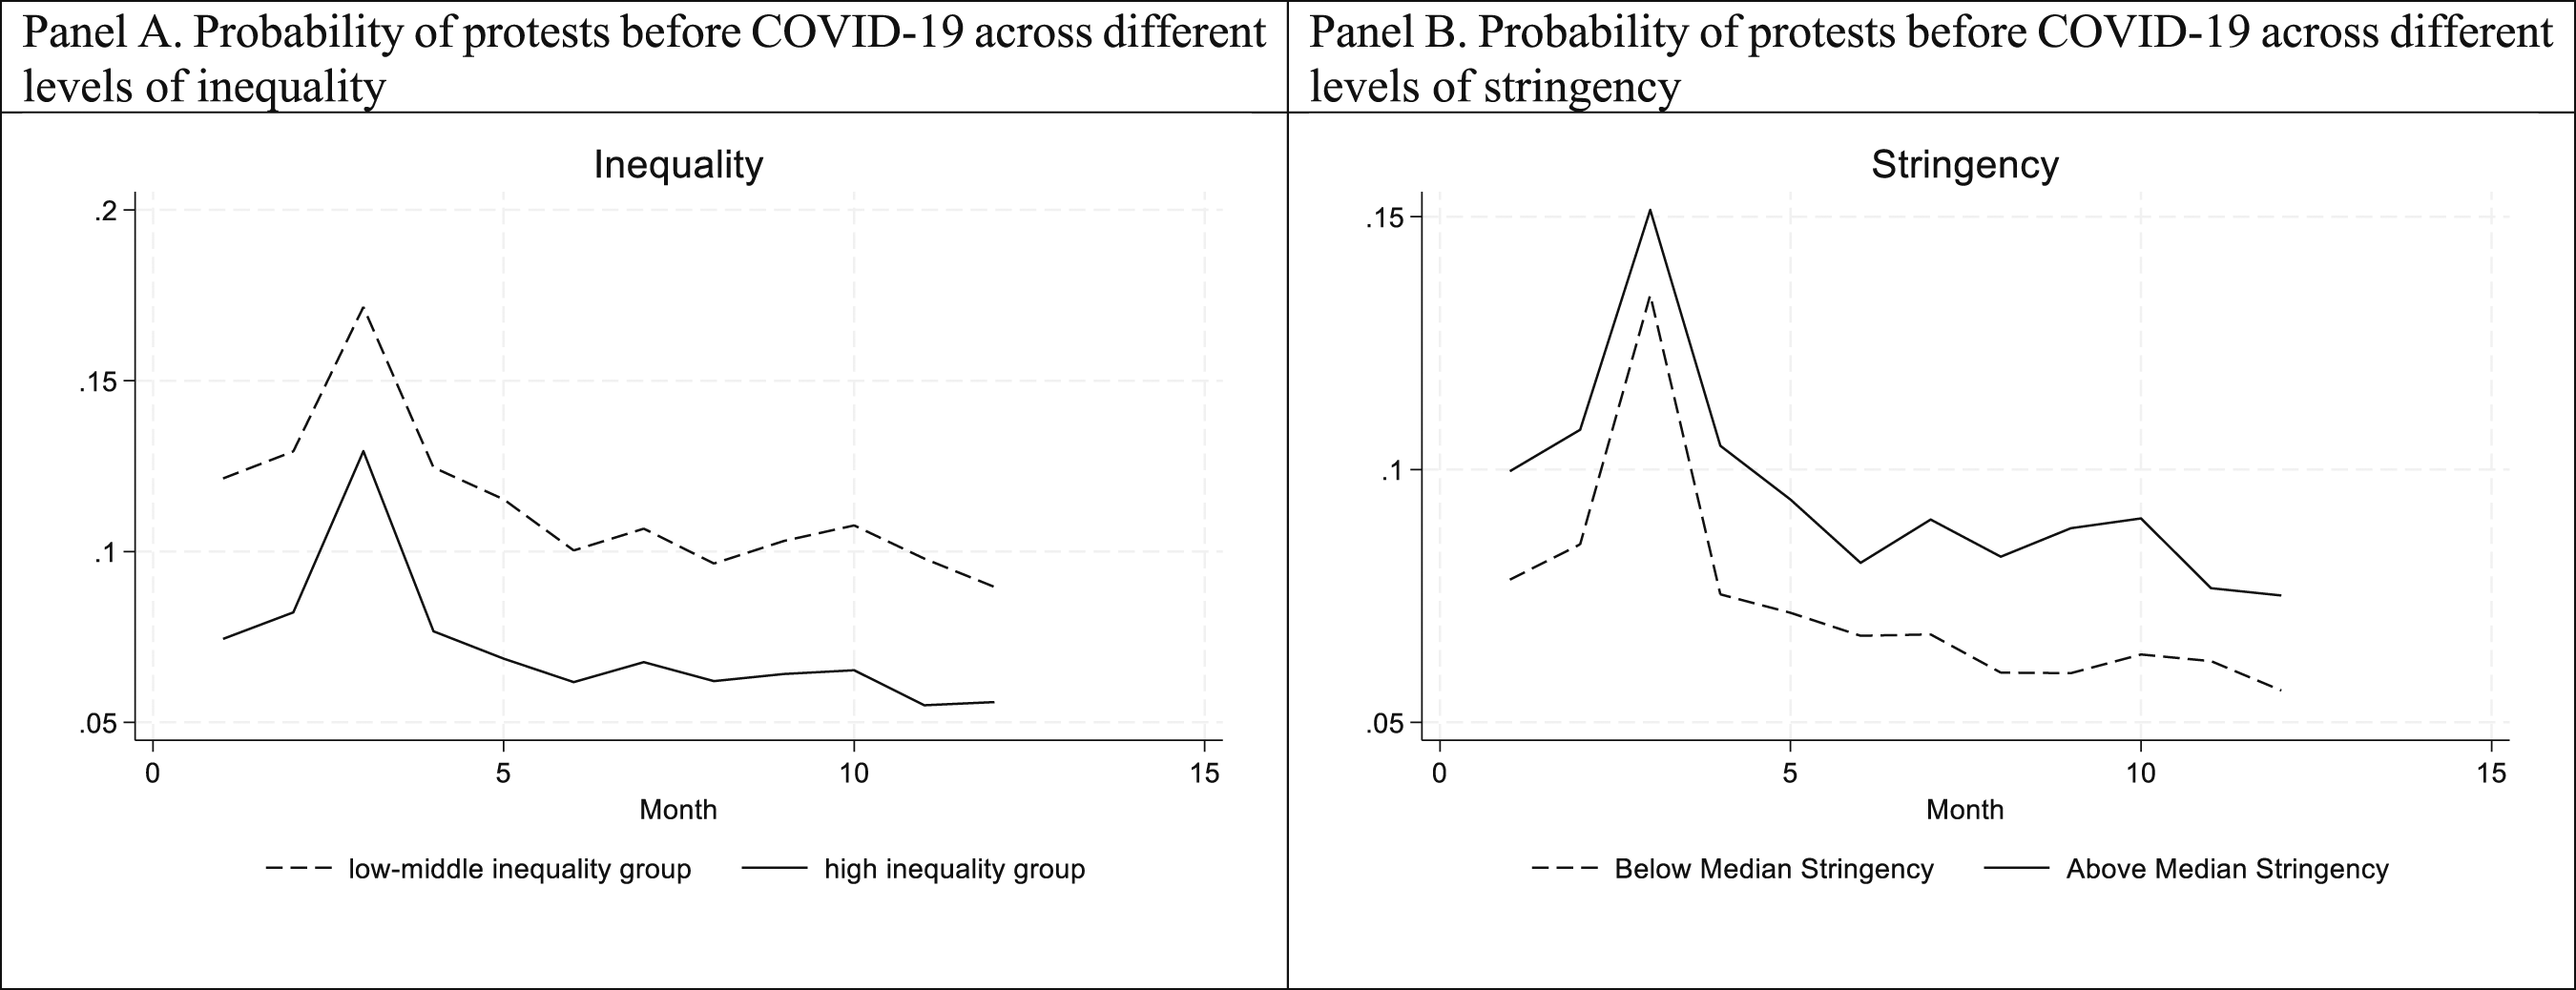
Another concern with our empirical strategy is related to potential endogeneity. The estimations above rely on the use of the interaction between the Gini index for county x before the outbreak of COVID-19 and the policy stringency indicator in state i implemented after the outbreak of the pandemic as a source of exogenous variation. However, the exclusion restriction assumption might be violated if, for instance, the time invariant component (the Gini index) is endogenously determined. The structure of the data ensures that the incidence of protests during week t is unlikely to affect levels of inequality – which were recorded in the same county during the previous year. Despite that, results could still be biased if protests influence the policy measures introduced by states to contain the spread of COVID-19. For instance, the level of policy stringency might be shaped by previous protests when they acted as super spreaders (Dave, McNichols, and Sabia 2022). To further address these endogeneity concerns, we employ an instrumental variable strategy that proxies state level stringency measures with the average level of policy stringency in states within the same geographical division. 21 This strategy is inspired by learning models whereby policy choices spread across countries because policies in one country are influenced by past policy decisions in neighboring countries via policymakers’ beliefs (Buera, Monge-Naranjo, and Primiceri 2011). 22
In the case of the USA, it is plausible to assume the existence of diffusion and spill-over effects in policy design across states within the same geographical divisions. It is also reasonable to assume that changes in policy against COVID-19 in states within the same geographical region affected protests in one state largely through these state policies. First, due to absence of federal coordination and the lack of recent pandemic experience, states decided to impose certain restriction policies when they observed neighboring states doing so. Indeed, initial policy responses look like simple imitation processes from the day in which California issued the first stay-at-home orders. 23 Within a few days, almost all the states had adopted stay-at-home orders. 24 Second, due to widespread hesitancy towards lockdowns and social distancing measures at federal level, states introduced stringent measures to contain the rapid increase in COVID-19 cases when similar policies were effective in containing the virus among their neighbors. States also appeared more willing to relax policy restrictions against COVID-19 if they observed the same actions leading to positive outcomes in neighboring states. 25 Third, several states decided to coordinate their policies at subnational level. For instance, at the beginning of the crisis, New York, New Jersey, Connecticut, Massachusetts, Pennsylvania, Delaware, and Rhode Island planned to develop a regional plan, while California, Oregon and Washington announced a “Western States Pact” through which they agreed to ease restrictive measures only under certain conditions. 26
Instrumental Variable (IV) Regressions.
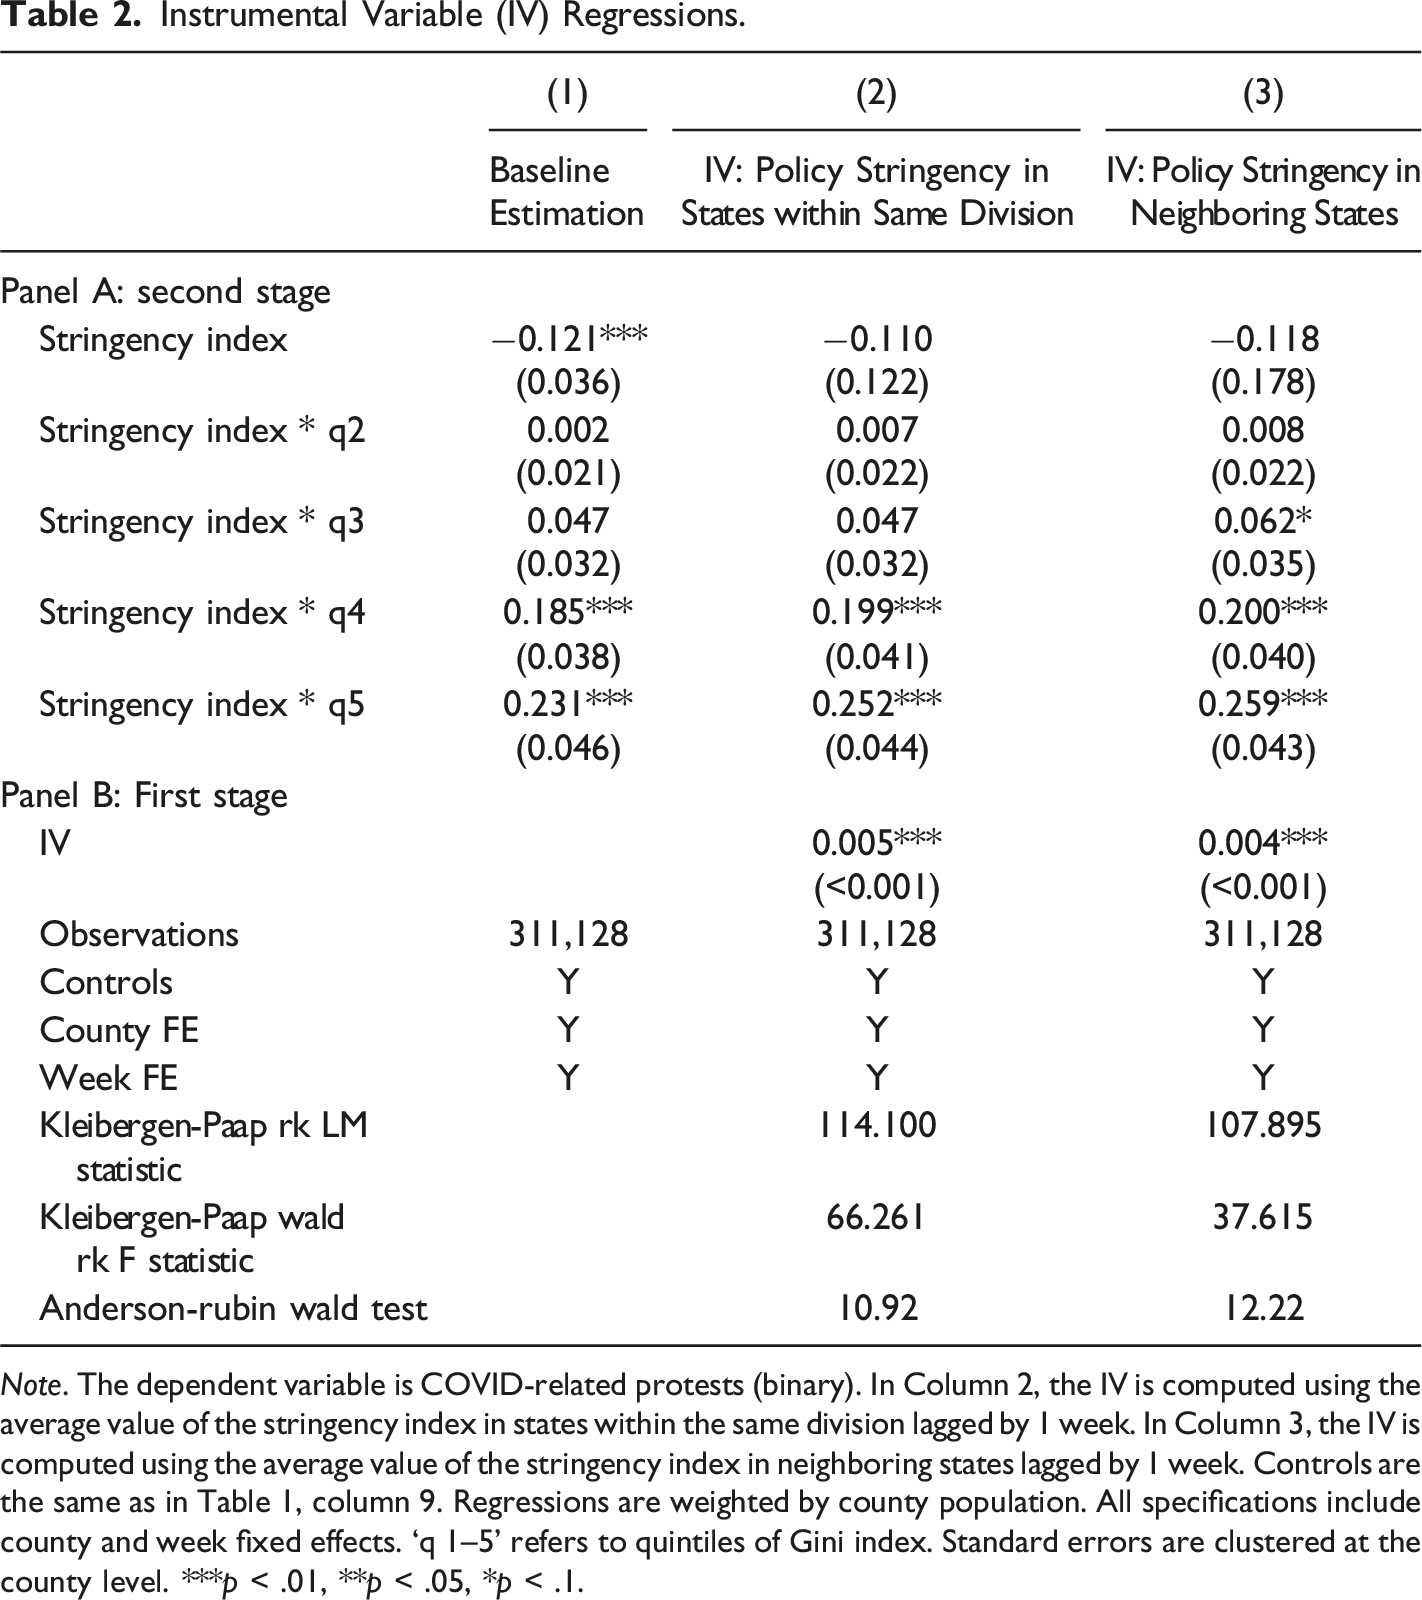
Note. The dependent variable is COVID-related protests (binary). In Column 2, the IV is computed using the average value of the stringency index in states within the same division lagged by 1 week. In Column 3, the IV is computed using the average value of the stringency index in neighboring states lagged by 1 week. Controls are the same as in Table 1, column 9. Regressions are weighted by county population. All specifications include county and week fixed effects. ‘q 1–5’ refers to quintiles of Gini index. Standard errors are clustered at the county level. ***p < .01, **p < .05, *p < .1.
Channels and Contextual Factors
What factors explain why policy stringency measures may have caused an increase in protests in more the unequal US counties in 2020 and 2021? To answer this question, we consider first changes in economic conditions (Hypothesis 2) and then we test if the incidence of protests varies with important contextual factors that characterized US counties before the pandemic, including political preferences and trust (Hypothesis 3).
Changes in Economic Conditions
Policy measures to contain the COVID-19 pandemic, especially lockdowns and stay-at-home orders, have caused severe economic damage including the reduction in consumer expenditure and unemployment. The US experienced in April 2020 its highest unemployment level since 1948, with an average rate of 14.8%. 27 Since then, the economy has adapted to restrictions and unemployment rate has decreased but remained at a high level of 6.7% in December 2020. In 2021, data showed that, while employment rates have rebounded past pre-COVID-19 levels for high-wage workers, they remain significantly lower for low-wage workers. 28 Workers most adversely affected included temporary workers, members of minorities, and the less educated. Fortune magazine reports that by September 2020, approximately 100,000 commercial establishments shut down permanently. 29 These were mostly restaurants and retail shops, but also beauty and fitness centers, and bars. The total GDP loss caused by the pandemic in the USA in 2020 and 2021 is estimated to be between $3.2 and $4.8 trillion (Walmsley, Rose, and Wei 2020).
To measure the role of these economic shocks in explaining our main results, we use data from different sources. First, we obtained information on consumer expenditure from credit and debit card spending from Opportunity Insights Economic Tracker, a project that has compiled private-sector sourced data on the COVID-19 pandemic and on several economic outcomes since January 2020. 30 These data are available for 1,685 of the original 3,142 US counties and show that consumers spent 3.5% less on average since the start of the pandemic until December 2020, when compared to January 2020. However, spending rebounded and increased by 10% on average in 2021. 31 Second, we use data on unemployment levels from the Bureau of Labor Statistics (BLS). These data are available for 3,141 counties, although they are collected monthly (not weekly). Data on consumer expenditure from the Economic Tracker are originally calculated as differences from January 2020 baseline values, 32 and data on unemployment from BLS is modified to report the same difference for each month.
Economic Channels.
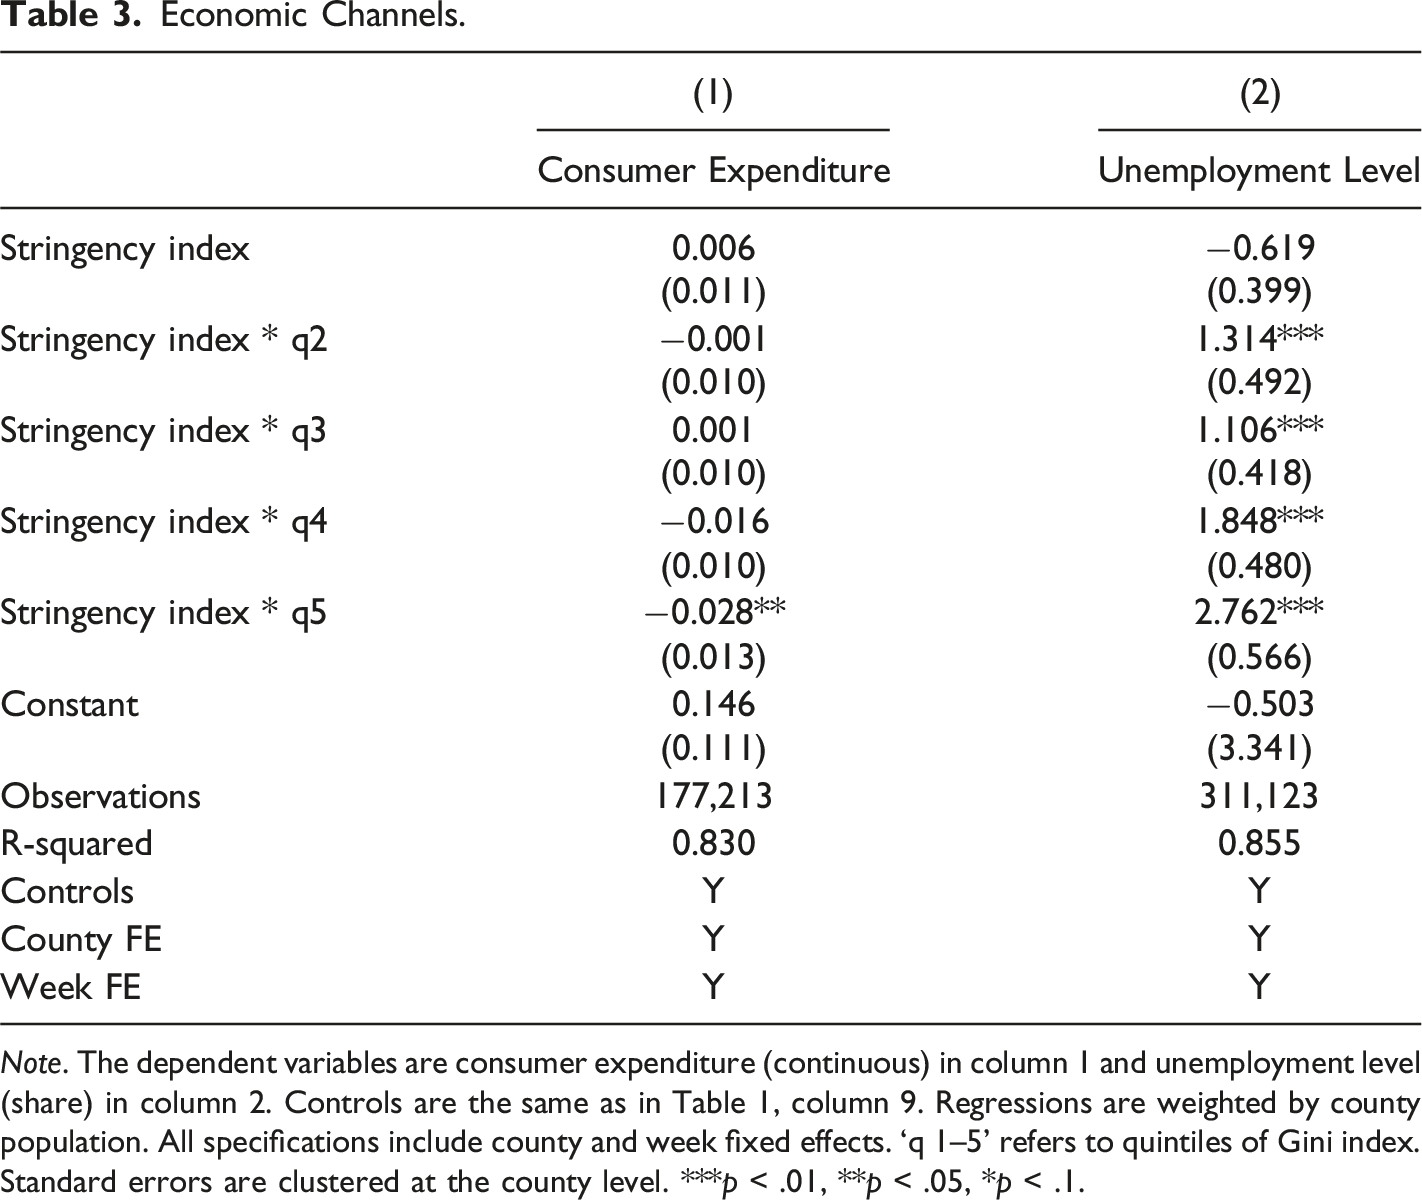
Note. The dependent variables are consumer expenditure (continuous) in column 1 and unemployment level (share) in column 2. Controls are the same as in Table 1, column 9. Regressions are weighted by county population. All specifications include county and week fixed effects. ‘q 1–5’ refers to quintiles of Gini index. Standard errors are clustered at the county level. ***p < .01, **p < .05, *p < .1.
Social and Political Context
Initial Political Preferences.
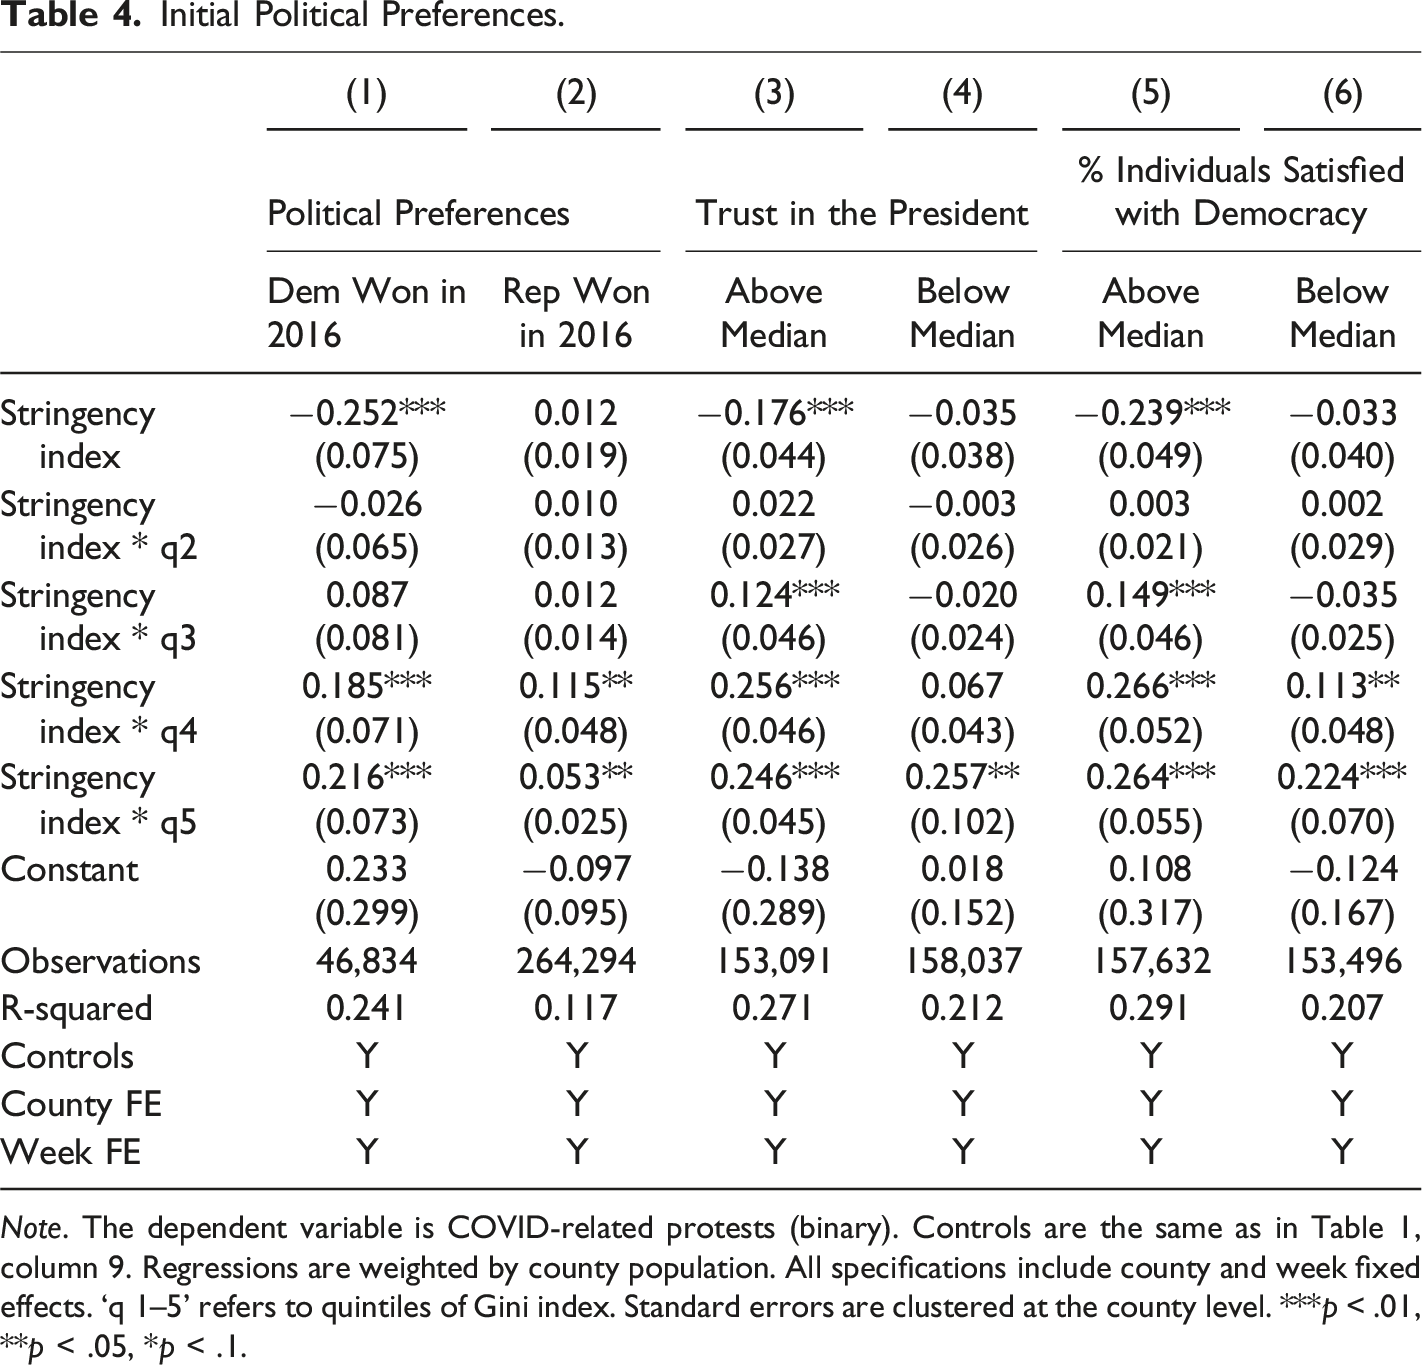
Note. The dependent variable is COVID-related protests (binary). Controls are the same as in Table 1, column 9. Regressions are weighted by county population. All specifications include county and week fixed effects. ‘q 1–5’ refers to quintiles of Gini index. Standard errors are clustered at the county level. ***p < .01, **p < .05, *p < .1.
Second, political preferences can be expressed in terms of voting preferences but also in how citizens trust their state institutions and democratic processes. Levels of political trust have been repeatedly shown to be negatively associated with social mobilization (Justino 2015; Justino and Martorano 2018, 2019; Levi and Stoker 2000; Sangnier and Zylbergerg 2017). To capture these effects, we split the sample into counties showing trust levels in the president above and below the median, respectively (Table 4, columns 3 and 4). These variables are measured on a scale of 1–7 in a Likert-scale. 34 In columns 5 and 6, we include percentage individuals (above and below the mean) who are satisfied with democracy. Information on these variables was obtained from the Latin America Public Opinion Project (LAPOP). 35 Data for the US in 2019 is based on information for approximately 1,200 individuals which we averaged at state-level (the lowest possible disaggregation level), covering all 50 US states. Results show that protests are more likely to take place in counties that before the pandemic were the most unequal (fifth quintile of Gini) and where trust in the president was below the median and citizens were less satisfied with democracy.
Overall, our findings show that the effect of COVID-19 pandemic on protests in the most unequal areas is moderated by social and political context factors, as postulated by Hypothesis 3.
Conclusion
This paper attempted to identify how pre-existing levels of inequality across US counties has shaped the impact of the COVID-19 pandemic on the incidence of protests. The main results show that the implementation of policy restrictions to contain the virus led to increases in the incidence of protests in US counties with high levels of inequality before the start of the pandemic. This result offers causal support for an extended version of Ted Gurr’s original deprivation theory, whereby reactions to government policies (like those related to COVID-19) affect the likelihood of protests taking place in areas where grievances already exist. It also shows that economic inequality and underlying deprivation theories may only explain the incidence of protests motivated by economic factors. Other protest types may not be affected by perceptions or experiences of deprivation and several other factors may be at play. This may explain why to date empirical tests of the original deprivation theory may have yielded mixed results. Future research needs to take into consideration much more explicitly variation in factors that motivate protests and social mobilization.
The paper has also important policy implications. For some time, there has been growing concern among scholars and political commentators about the political consequences of rises in inequality in the USA and elsewhere in the world. Studies have shown evidence for links between increases in inequality and unprecedented rises in far-right and populist political parties, the election of several governments with strong nationalistic overtones (including in the USA) and the erosion of social cohesion and democratic institutions (Guriev and Papaioannou 2022). Our results indicate that US counties with initially high levels of inequality were in fact more likely to protest during the COVID-19 pandemic. But importantly, the evidence also suggests that these protests were motivated by the drastically adverse economic effects of such policies on living standards. However, the political and social consequences of such a severe economic shock are yet to be completely understood and may take decades to be fully grasped.
Supplemental Material
Supplemental Material - Lockdown and Unrest: Inequality, Restrictions and Protests During COVID-19
Supplemental Material for Lockdown and Unrest: Inequality, Restrictions and Protests During COVID-19 by Francesco Iacoella, Patricia Justino, and Bruno Martorano in Journal of Conflict Resolution
Footnotes
Acknowledgments
The authors thank the Editor and two anonymous reviewers for their comments and suggestions. The authors are also grateful for discussions and comments from Laia Balcells, Tillman Hönig, Roudabeh Kishi, Clionadh Raleigh and seminar participants at UNU-WIDER, ZEW, and the Finnish Institute of International Affairs.
Declaration of Conflicting Interests
The author(s) declared no potential conflicts of interest with respect to the research, authorship, and/or publication of this article.
Funding
The author(s) disclosed receipt of the following financial support for the research, authorship, and/or publication of this article: This paper is part of a broader project on the ‘Institutional Legacies of Violent Conflict’, funded by United Nations University World Institute for Development Economics Research (UNU-WIDER).
Data Availability Statement
Datasets and related analysis files are publicly available via dataverse.nl: https://doi.org/10.34894/G7ZYLK.
Supplemental Material
Supplemental material for this article is available online.
Notes
References
Supplementary Material
Please find the following supplemental material available below.
For Open Access articles published under a Creative Commons License, all supplemental material carries the same license as the article it is associated with.
For non-Open Access articles published, all supplemental material carries a non-exclusive license, and permission requests for re-use of supplemental material or any part of supplemental material shall be sent directly to the copyright owner as specified in the copyright notice associated with the article.