
Abstract
Automated fibre placement (AFP) has emerged as a prominent manufacturing technique in the aerospace industry for producing high-performance composite structures. However, defects such as gaps and overlaps inevitably occur during the AFP process, and can significantly influence the end-product quality of composite structures. Compression strength can play an important role in composite structures, especially in the residual load-bearing capability in presence of damages, and its characterisation is necessary for the correct sizing of structures. To evaluate their impact on mechanical properties, dynamic compression testing of carbon fibre-reinforced low-melt polyaryletherketone (CF/LM-PAEK) is conducted using a high-speed test machine. An end-loading compression fixture with honeycomb is used to perform dynamic compression tests at strain rates up to 200 s−1. Ultrasonic C-scan images of as-manufactured defects in test specimens are examined to correlate the contents of gap defects and compressive strength. The results show a clear strain-rate effect on compressive strength within the range of tested strain rates. Also, a transition of failure modes from kink band to wedge splitting is observed at high strain rates. No clear correlation between the gap contents and compressive strength is identified. Those results indicate that the staggered gaps in tested specimens have a minimal impact on compression properties. The findings from this experimental study highlight the effect of defects induced by AFP manufacturing processes on compressive properties at intermediate strain rates. This research contributes to a deeper understanding of the complex relationship between AFP-induced defects and strain-rate effects, providing valuable insights into designing AFP components.
Keywords
Introduction
Automated fibre placement
Automated Fibre Placement (AFP) is an additive manufacturing process widely used in the aerospace industry for the production of high-performance and lightweight thermoset composite structures. This process involves the precise placement of composite prepreg tapes, allowing the fast production of composite structures with complex geometries and minimal material wastes.1,2 Additionally, AFP provides flexibility in fibre orientation along the load direction, which is beneficial for manufacturing structures such as composite tanks with non-geodesic paths. 3 The conventional composite manufacturing relies on the curing of the placed prepreg tapes using autoclaves. While autoclave processing ensures high-quality parts, it is time-consuming and costly. In contrast, thermoplastic in situ AFP enables the production of parts in a single step and real-time process monitoring by integrating in-line quality assurance methods. In situ consolidation AFP presents a promising alternative as an out-of-autoclave manufacturing technique to traditional methods.4,5 However, there is no opportunity for repairs before final curing due to the immediate consolidation during production. Thus, controlling process parameters and understanding the effect of defects are crucial for ensuring mechanical performance of composite parts. Manufacturing of complex shapes is still challenging with the AFP process. Nguyen et al. 6 pointed out that the prevention of imperfections like gaps and overlaps associated with the process of laying tapes in AFP is nearly impossible as those imperfections were inherent to any ‘mass’ production. Therefore, the quality of the incoming tapes is essential for achieving good results since the transient nature of in situ AFP leaves little time for curing inherently present defects.
Effect of defects in AFP materials
Apart from the optimisation of AFP process parameters like temperature, process speeds and compaction pressure, 7 research on AFP primarily focusses on minimising process-induced defects such as gaps and overlaps. Consequently, the effect of defects on mechanical properties has been intensively assessed.6,8–12 For example, Nguyen et al. 6 performed extensive experiments to investigate the influence of controlled gap and overlap defects on Toray T 800S/3900 composite laminate. They found that both tensile and compression properties (stiffness and strength) were reduced with increasing gap size. On the other hand, overlap defect tension stiffness and strength values were marginally increased with increasing overlaps while less significant changes were observed in compressive stiffness and strength values. Also, test results show that staggered defects were less influential than aligned defects.
Compression properties are critical design parameters in the design of fibre-reinforced plastics (FRP) composite structures as these materials must withstand crash and impact events to ensure structural integrity. 13 The inferior compressive performance of FRP composites than that of tensile performance is one of the design constraints that has to be carefully considered. 14 Croft et al. 8 investigated the effect of process-induced defects, namely gap, overlap, half gap/overlap and twisted tow. Their experimental work was carried out under different types of loading conditions. The results indicated that an introduction of longitudinal gap defects did not significantly affect the compression and in-plane shear properties compared with baseline results. Additionally, Lan et al. 9 reported the influence of gap and overlap defects on AFP carbon/epoxy composites manufactured with a Hexcel 8552/AS4/RC34/AW194 material system. Two stacking sequences, [(-45°/+45°)3/-45°] and [90°4/0°3/90°4] have been examined in shear and compression tests respectively. Two different sizes of aligned gap and overlap defects were introduced in 90° plies. Small gaps up to 0.5 mm were found to have no effect on the compressive strength while a strength reduction of up to 20% was observed with the larger gap (3.175 mm). The authors summarised that defects led to variations in thickness within the plate and suggested that using a caul plate during curing could help minimise thickness variations, and result in a lesser influence of the defects. It is evident that the mechanical properties of both thermoplastic in situ AFP and thermoset-based AFP are negatively impacted by the presence of defects. However, the characteristics of these defects may differ.15,16 As subsequent layers are laid down, thermoplastic prepreg tapes will flatten due to resin flow and fibre movement, making it challenging to estimate the consolidated tape width (CTW) for thermoplastic in situ AFP.
Strain-rate effect on compressive properties of composites
Furthermore, it is well-known fact that the polymer matrix is strain-rate sensitive.17–19 Considering strain-rate effects on the mechanical behaviour of FRP composites is crucial for the design of composite structures under impact and crash loadings. Trochez et al. 11 investigated the impact of AFP defects such as fibre tow gaps, overlaps, and folds on Hexcel IM7/8552-1 carbon/epoxy composites. They carried out testing at high strain rates using a split-Hopkinson pressure bar (SHPB) under compression loading. The study found that defects could lead to a significant reduction of the compressive strength under high strain rates compared to the pristine laminate. With an average strength reduction of 23%, no clear trend in strain-rate effect was found within the range of 50 s−1 to 300 s−1. The reduction in strength was more pronounced under dynamic than under quasi-static loading conditions. The authors suggested that the strength of AFP composite laminates was strongly influenced by ply deformation linked to out-of-plane fibre misalignment. Also, the location of the defects in thickness had little influence on compressive strength reduction. Although Trochez et al. 11 have reported dynamic compression properties of thermoset AFP, the formation of defects such as gaps would be different in the case of in situ thermoplastic AFP as they are not corrected or cured in a subsequent curing step.
Novelty of the approach
The absence of results regarding the impact of embedded defects in thermoplastic composites across a wide range of strain rates creates open research questions that justify the need to understand how these defects affect mechanical properties. To address this, dynamic compression testing at intermediate strain rates of up to 200 s−1 is conducted in this work to study the influence of gaps as well as strain-rate effect. Thus, this study presents comprehensive experimental investigations using a high-speed testing machine to characterise dynamic compression properties at intermediate strain rates, offering a novel and practical alternative to the Split Hopkinson Pressure Bar (SHPB) method.18,20
The thermoplastic material, low-melt polyaryl ether ketone (LM-PAEK), is particularly appealing due to its lower melting temperature and melt viscosity compared to other thermoplastic materials, making it more suitable for high-rate production. 4 As noted by Raps et al., 21 this type of thermoplastic is relatively new and has been rarely documented in the literature. Test samples are produced with carbon fibre-reinforced thermoplastic composite (CF/LM-PAEK) manufactured using in situ AFP with laser heating at 125 mm/s lay-up speed and a compaction force of 6 bars. The staggering gap defects are introduced in the 0° and 90° directions. This paper establishes a correlation between the presence of gaps in the test specimens and their dynamic compressive strength. The contents of gaps are determined on ultrasonic C-scan images while the damage progression is captured using digital image correlation (DIC) on high-speed sequences. Those measurements combined with the measured compression properties provide valuable insights for design guidelines concerning in situ AFP-manufactured composite structures.
Experimental analysis
Material and manufacturing
Figure 1(a) shows the AFP facility for manufacturing fibre-reinforced thermoplastic components. This set-up allows for the deposition of three ½” thermoplastic prepreg tapes in parallel. Unidirectional thermoplastic prepreg tapes made of carbon fibre-reinforced low-melt polyaryletherketone (CF/LM-PAEK, Suprem 55% FVF) were used to manufacture a laminate for investigating effect of gaps. The prepreg tape had a tow width of 12.7 mm (1/2″). A total of 16 plies were placed to manufacture a cross-plied 800 mm × 600 mm flat laminate [0/90]4s with a resulting nominal thickness of 2.8 mm. While angled-ply laminates offer superior tailoring of mechanical properties for specific loading conditions (e.g. increased shear stiffness), the reduction of testing complexity and manufacturing costs often makes cross-ply [0/90]ns laminates a more advantageous choice for fundamental dynamic compression testing. This stacking results moreover in a simpler calculation of the axial compressive strength of unidirectional plies. This layup is as well recommended in test standards such as ASTM D6641/D6641 M.
22
Automated fibre placement (AFP): (a) DLR AFP facility for manufacturing fibre-reinforced thermoplastic components facility; (b) the principle of AFP process.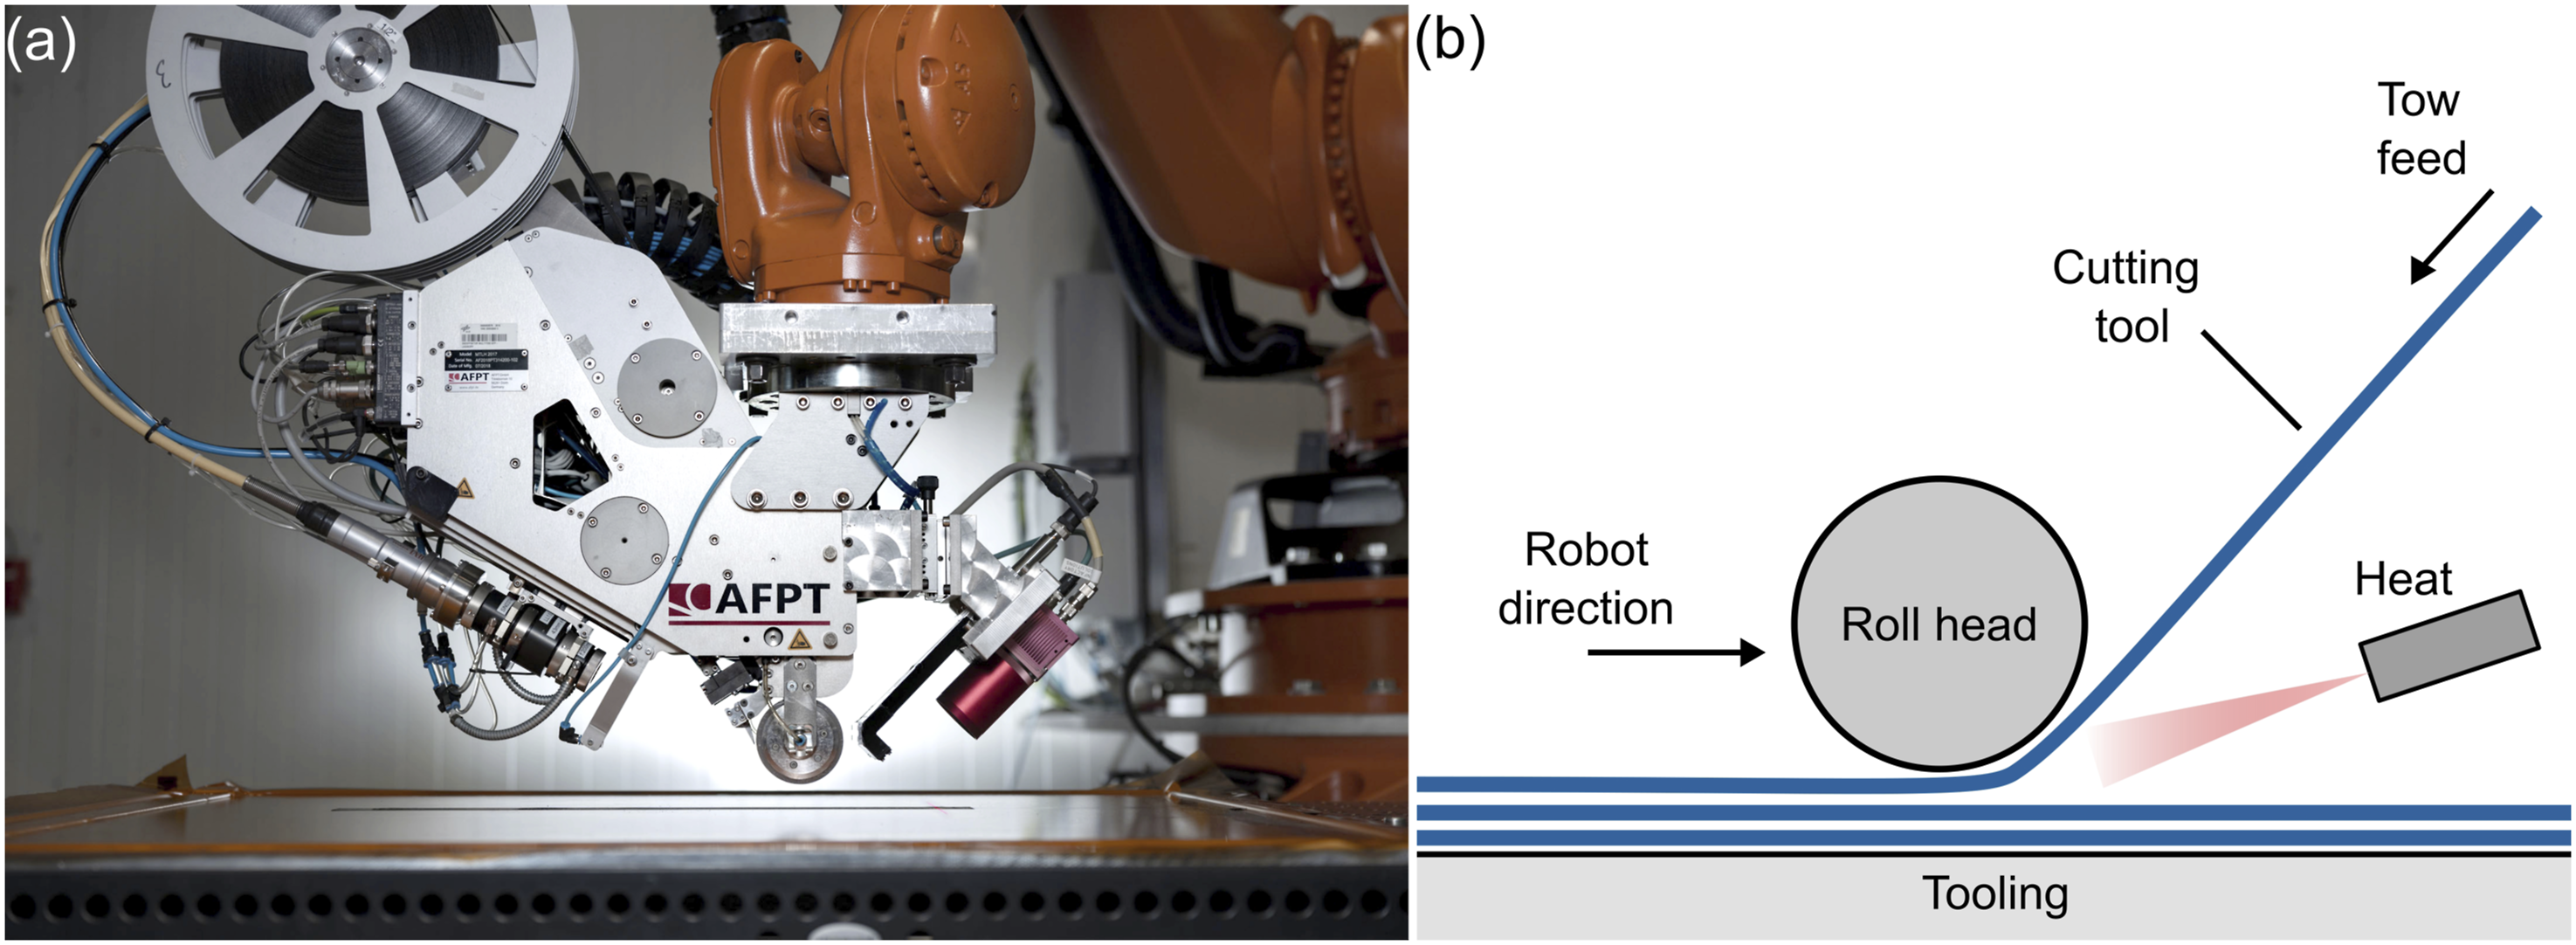
Optimal process parameters according to a previous study were used. 7 The most important process parameters were a layup speed of 125 mm/s (7.5 m/min), a setpoint temperature of 500°C which was equivalent of a process temperature in the heated zone of approximately 364°C, and a compaction pressure of 6 bars. For the given material a distance of 41.7 mm between consecutive tracks results in a near zero gap/overlap layup. The staggering of the tracks was the shift of plies of the same fibre angle by a defined length in order to prevent the butt joints in between tapes to accumulate on top of each other. Staggering was done in equal increments between the eight plies in the 0° and the 90° fibre angles, whereas the second ply of each angle was shifted by 20.85 mm – half of the distance between two tracks. Each following ply of the same angle was then again shifted by an additional 6.95 mm to achieve even staggering throughout the entire laminate. Finally, in one of the laminates deliberate gaps were introduced by increasing the track distance by 10% or 20% of the nominal tape width - 1.25 mm or 2.5 mm respectively. Within 90° plies the gaps were kept at 10% whereas the 0° layers were placed with one half 10% and the other half at 20% increased track distance. In order to precisely locate the introduced defects, three position markers were placed on the surface using the robot operating in the same case coordinate system to ensure precision.
Figure 2 illustrates the schematic of the programme-controlled staggered defects without stacking. Gaps were placed in longitudinal 0°-layers number 3, 5, 12, and 14 as shown in Figure 2(a). In contrast, gaps were located in 90°-layers number 4, 8, 9, and 13 as shown in Figure 2(b). Two types of nominal gaps as mentioned above were introduced during the layup process in order to investigate a potential influence of gap size on the mechanical properties of the CF/LM-PAEK. Schematic of a staggered gap design plan: (a) side view in 0° direction; (b) side view in 90° direction.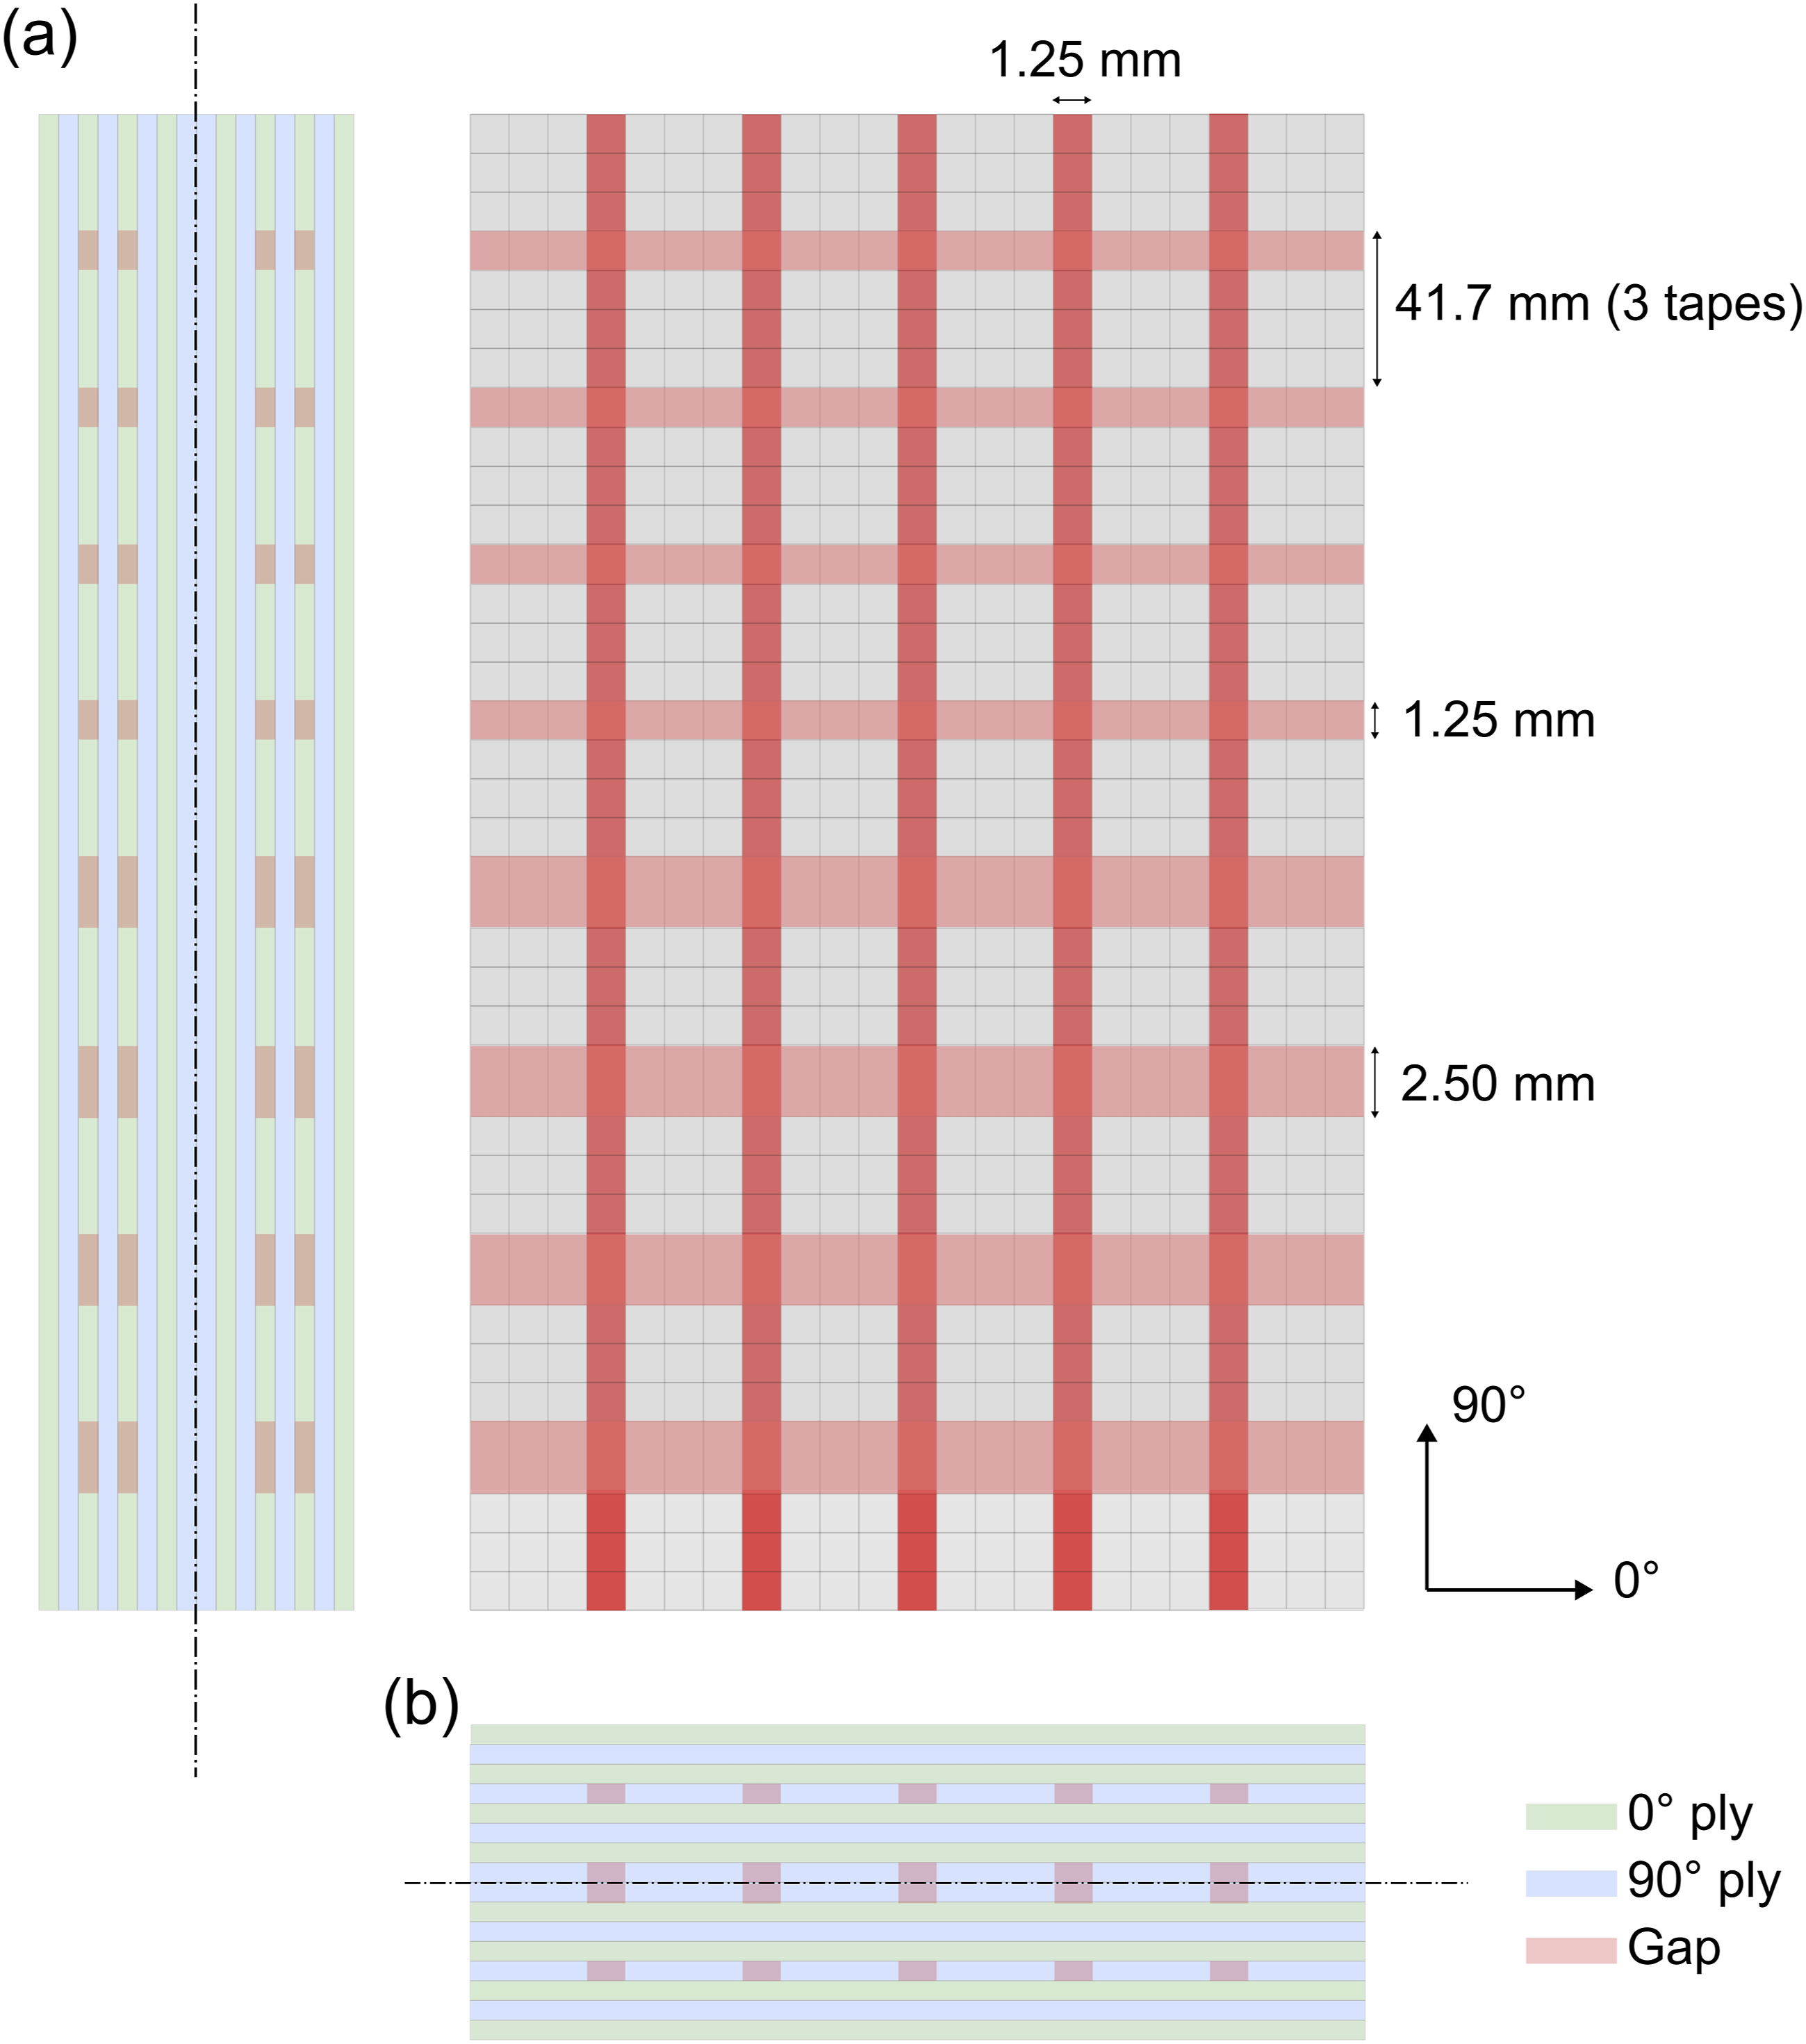
Ultrasonic testing and image analysis
Ultrasonic testing was conducted to assess the gap defect structure. A phased array flaw detector (Olympus OmniScan MX2, EVIDENT, Canada) was used in combination with a 5 MHz 5L64-NW1 phased-array probe. For the pulse-echo scanning method, manual spray-water coupling was used on the scanning side to ensure good acoustic transmission. The backside was kept dry to maintain a constant and high reflection coefficient at the back wall. After processing the data, images are generated for each specimen separately based on their position in the plate in order to extract the amount of defects and investigate a potential correlation with the mechanical properties.
The contents of the defect within the specimen is analysed with an open-source software ImageJ version 1.54 23 to correlate the material properties and manufacturing parameters. In a first step, the colour images of the samples obtained from the C-scans are pre-processed using a threshold based on a user-defined colour scale corresponding to the presence of defects. After that, those thresholded images are converted into black and white domains. Finally, the ImageJ plug-in, OrientationJ 24 is used to analyse the orientations of the defects, allowing for the distinction between defects at 0° and 90° within the sample.
Compression test fixture
Before discussing experimental results, it is worthy to mention here that the intermediate strain rate range is defined in this study as strain rates from 1 s−1 to 200 s−1. High-speed servo-hydraulic machines are typically the first choice for obtaining dynamic material properties at intermediate strain rates due to their unique capability of applying large displacements at high speeds of up to 20 m/s. This capability allows to cover the wide range of strain rates from quasi-static to intermediate strain rates with a single machine.
In current work, a compression test fixture based on end-loading of the specimen is used, in which the compression load is introduced into the flat end of the test specimen as documented in the work of Adam and Whitney. 25 As analogous to the end-loading concept, the present dynamic compression fixture is specially designed at the institute of Structures and Design. 26 The test specimen is stabilised laterally by a honeycomb material that prevents premature failure due to bending. The high orthotropy of the honeycomb material provides a strong stiffness transverse to the loading direction and therefore a high supporting capability. In the loading direction, the low stiffness and strength of the honeycomb reduces its influence on the testing results.
Specimen
The specimens are designed with a dog-boned geometry to localise the failure in a pre-defined area and minimize edge effects while increasing reproducibility. The dog-boned specimens are prepared with a parallel section of 10 mm as shown in Figure 3 for local strain measurements. The specimens were machined out using a CNC high-pressure water jet cutting system (WARICUT HWE-P6040/1, H.G. RIDDER GmbH, Germany). After cutting the specimens with consistent spacing, the specimen’s selection was randomised for each strain rate rather than being based on specific positions to ensure a fixed size of gap defects, as it was performed in the literature.8,9 Specimen geometry for dynamic compression testing.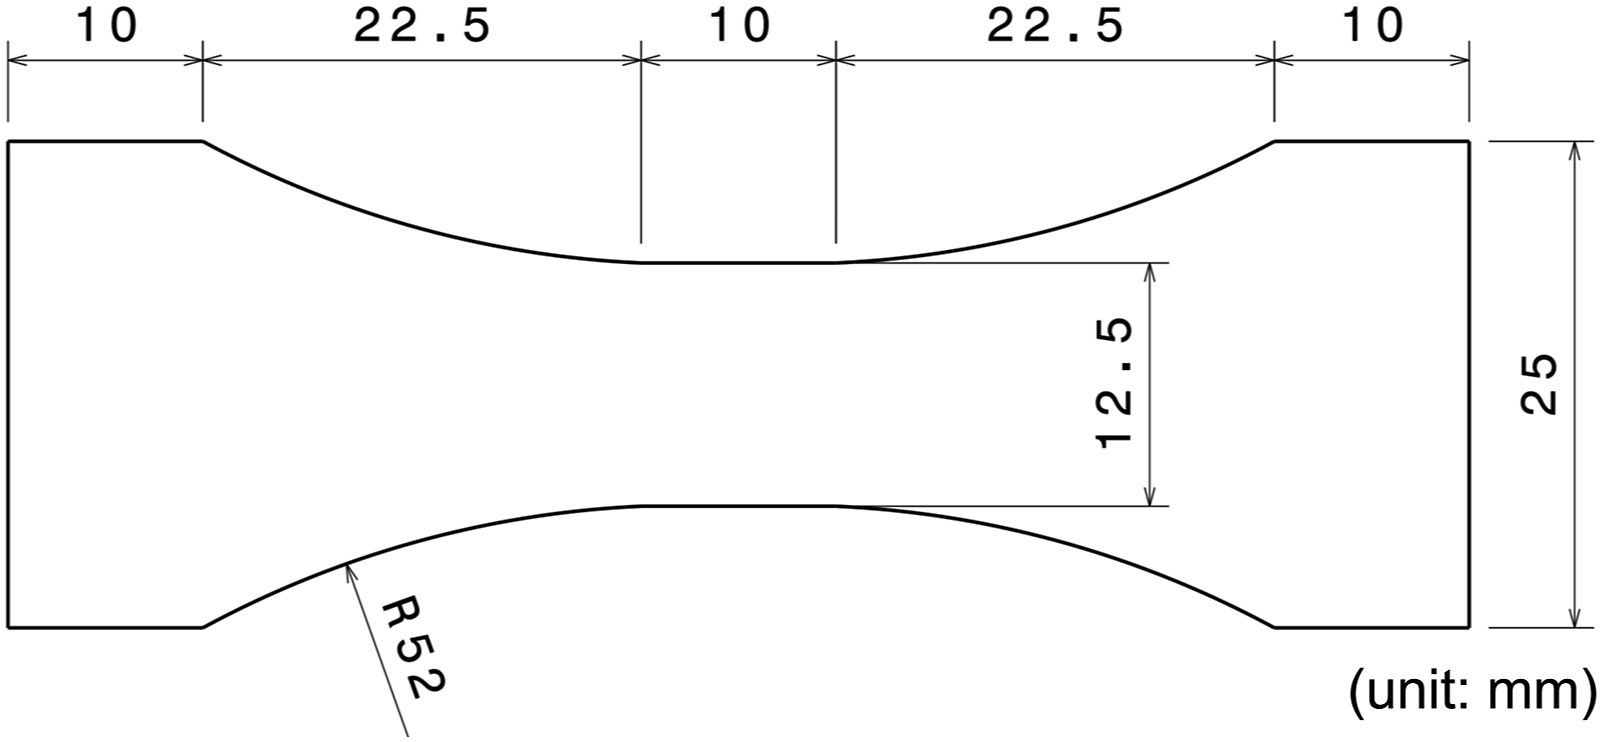
While the investigation of the influence of gaps by maintaining uniform gaps in the prepared specimens is common, this approach limits the variability in the dataset. By varying the levels of defects, we better reflect the randomness and distribution of defects found in actual manufacturing processes, making the findings more applicable to real-world scenarios. Therefore, this method offers a more realistic and comprehensive framework for understanding the relationship between defects and material properties, which is crucial for enhancing the reliability of the AFP manufacturing process.
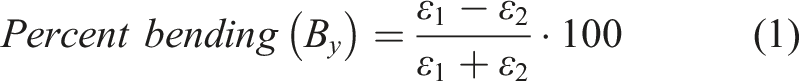
Two types of strain gauges (FLAB -3-11-1L and FLCA-3-11-1L, Tokyo Sokki Kenkyujo Co., Ltd, Japan) are bonded on both sides of the specimens with an adhesive (CN adhesive, Tokyo Sokki Kenkyujo Co., Ltd, Japan) to measure the percent bending
Finally, the specimens are grounded with a white paint (AERO COLOR® Professional 28101) and subsequently a black random speckle pattern (AERO COLOR® Professional 28702, H. Schmincke & Co. GmbH & Co. KG, Germany) is applicated on the side of the specimen using an airbrush system. The water-based paint is chosen for its high elongation to avoid paint cracking under compression loading.
Pearson correlation
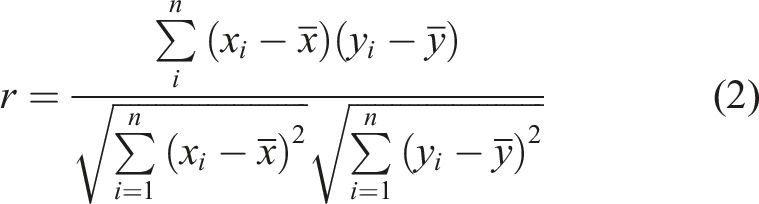
The Pearson correlation coefficient measures a linear relationship between two variables by identifying their relation. It is used in this work to interpret the relation between mechanical properties and amount manufacturing defects. The values of the Pearson coefficient ranges from −1 to 1. When
Dynamic compression testing
The dynamic compression tests are performed at four nominal strain rates up to 200 s−1 (namely 0.1 s−1, 10 s−1, 100 s−1, and 200 s−1). As shown in Figure 4, an Instron® VHS 100/20 high-speed servo-hydraulic test machine is used together with a piezoelectric load cell (Kistler-9317B, Kistler Instrumente GmbH, Germany). The force signals are amplified with a Kistler type 5011B charge amplifier. Additionally, these signals are recorded simultaneously with a transient recorder (Krenz-PSO 8160 from Krenz® Messtechnik, Germany) as backup measurements. Dynamic compression test set-up for end loading configuration.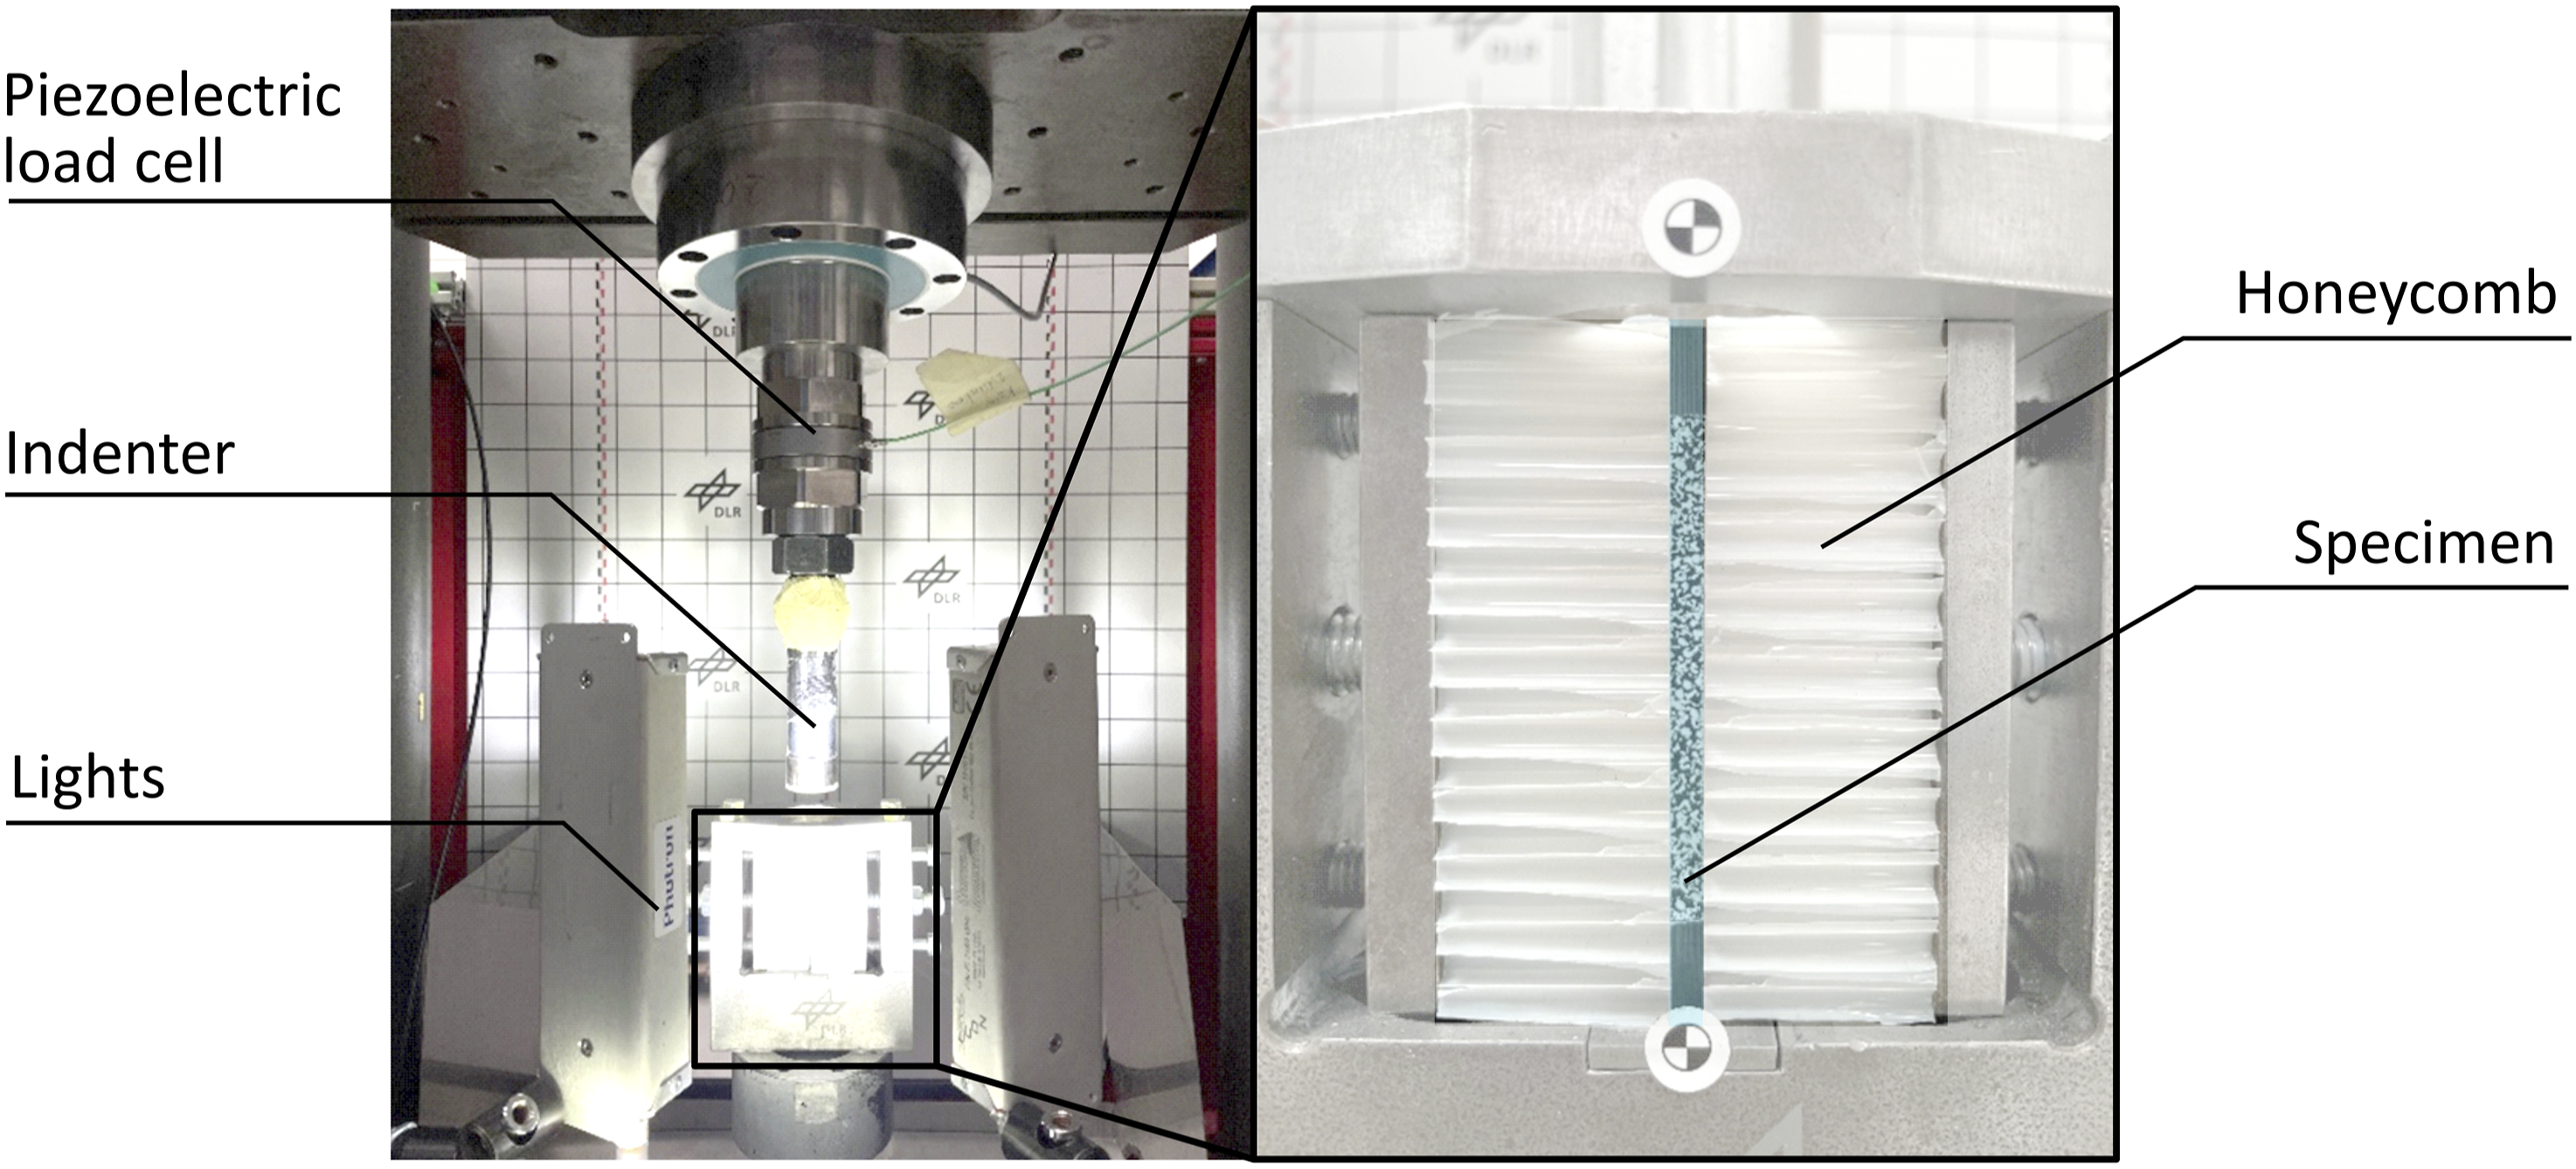
Summary of testing condition for dynamic compression testing, and corresponding parameters for digital image correlation (DIC).
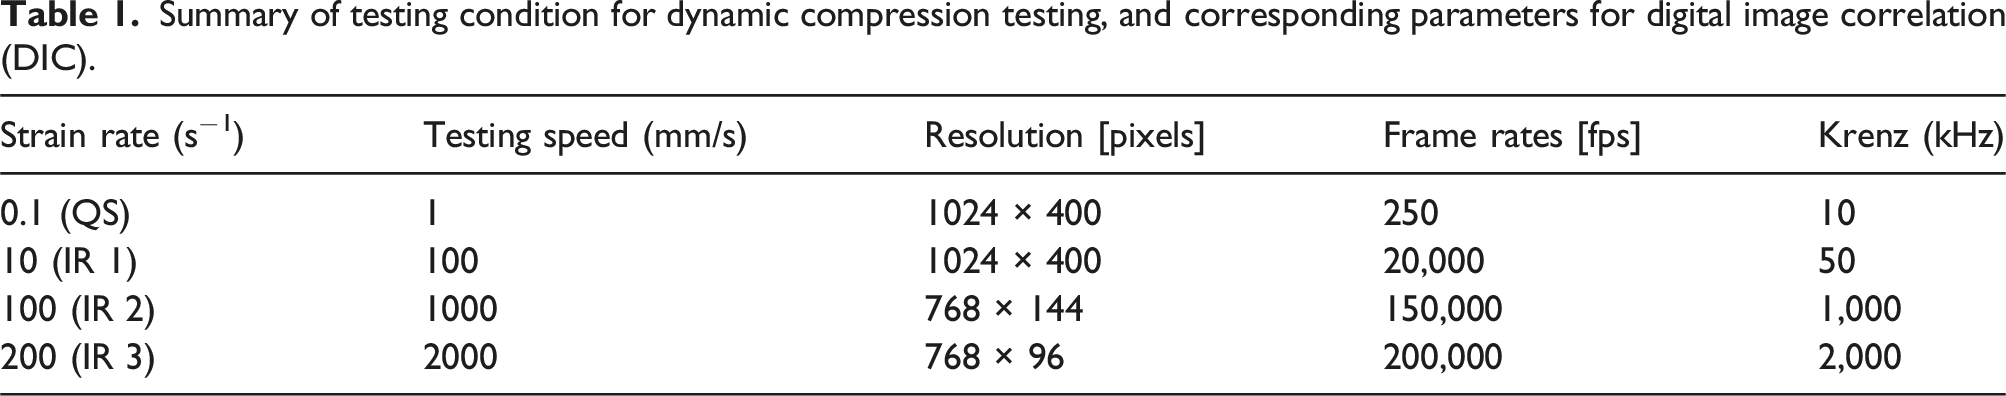
The output voltage was acquired using a strain gauge amplifier (SGA-2 MK2, Elsys AG, Switzerland), and strain was calculated from the output voltage with a full bridge configuration. The output voltages were filtered with a radial basis functions (RBF) interpolation to eliminate the white noise caused by digitalisation. 17 In addition, aforementioned signals such as the high-speed images and strain gauges, were synchronised with the force signals through NI-DAQ (USB-6251 BNC, National Instruments™, USA).
Results and discussion
Microscopy
Figure 5 shows schematic of a through-the-thickness view and microscopic images of the manufactured laminate with and without gap defects. No visible defects such as delamination or voids are apparent in Figure 5(b), indicating excellent consolidation quality in in situ AFP. On the other hand, Figure 5(c) shows a ply waviness of approximately 6°, although no apparent gaps are noticeably observed. This observation suggests that the adjacent fibres from the tapes fill any potential gaps during the in situ consolidation process. It can be inferred that the material is broadened by the process itself, leading to a local reduction in fibre content and crimp formation. (a) Schematic of through-the-thickness view; (b) Microscopic through-the-thickness view of as-manufactured Carbon/LM-PAEK laminate without gap defects and (c) with gap defects.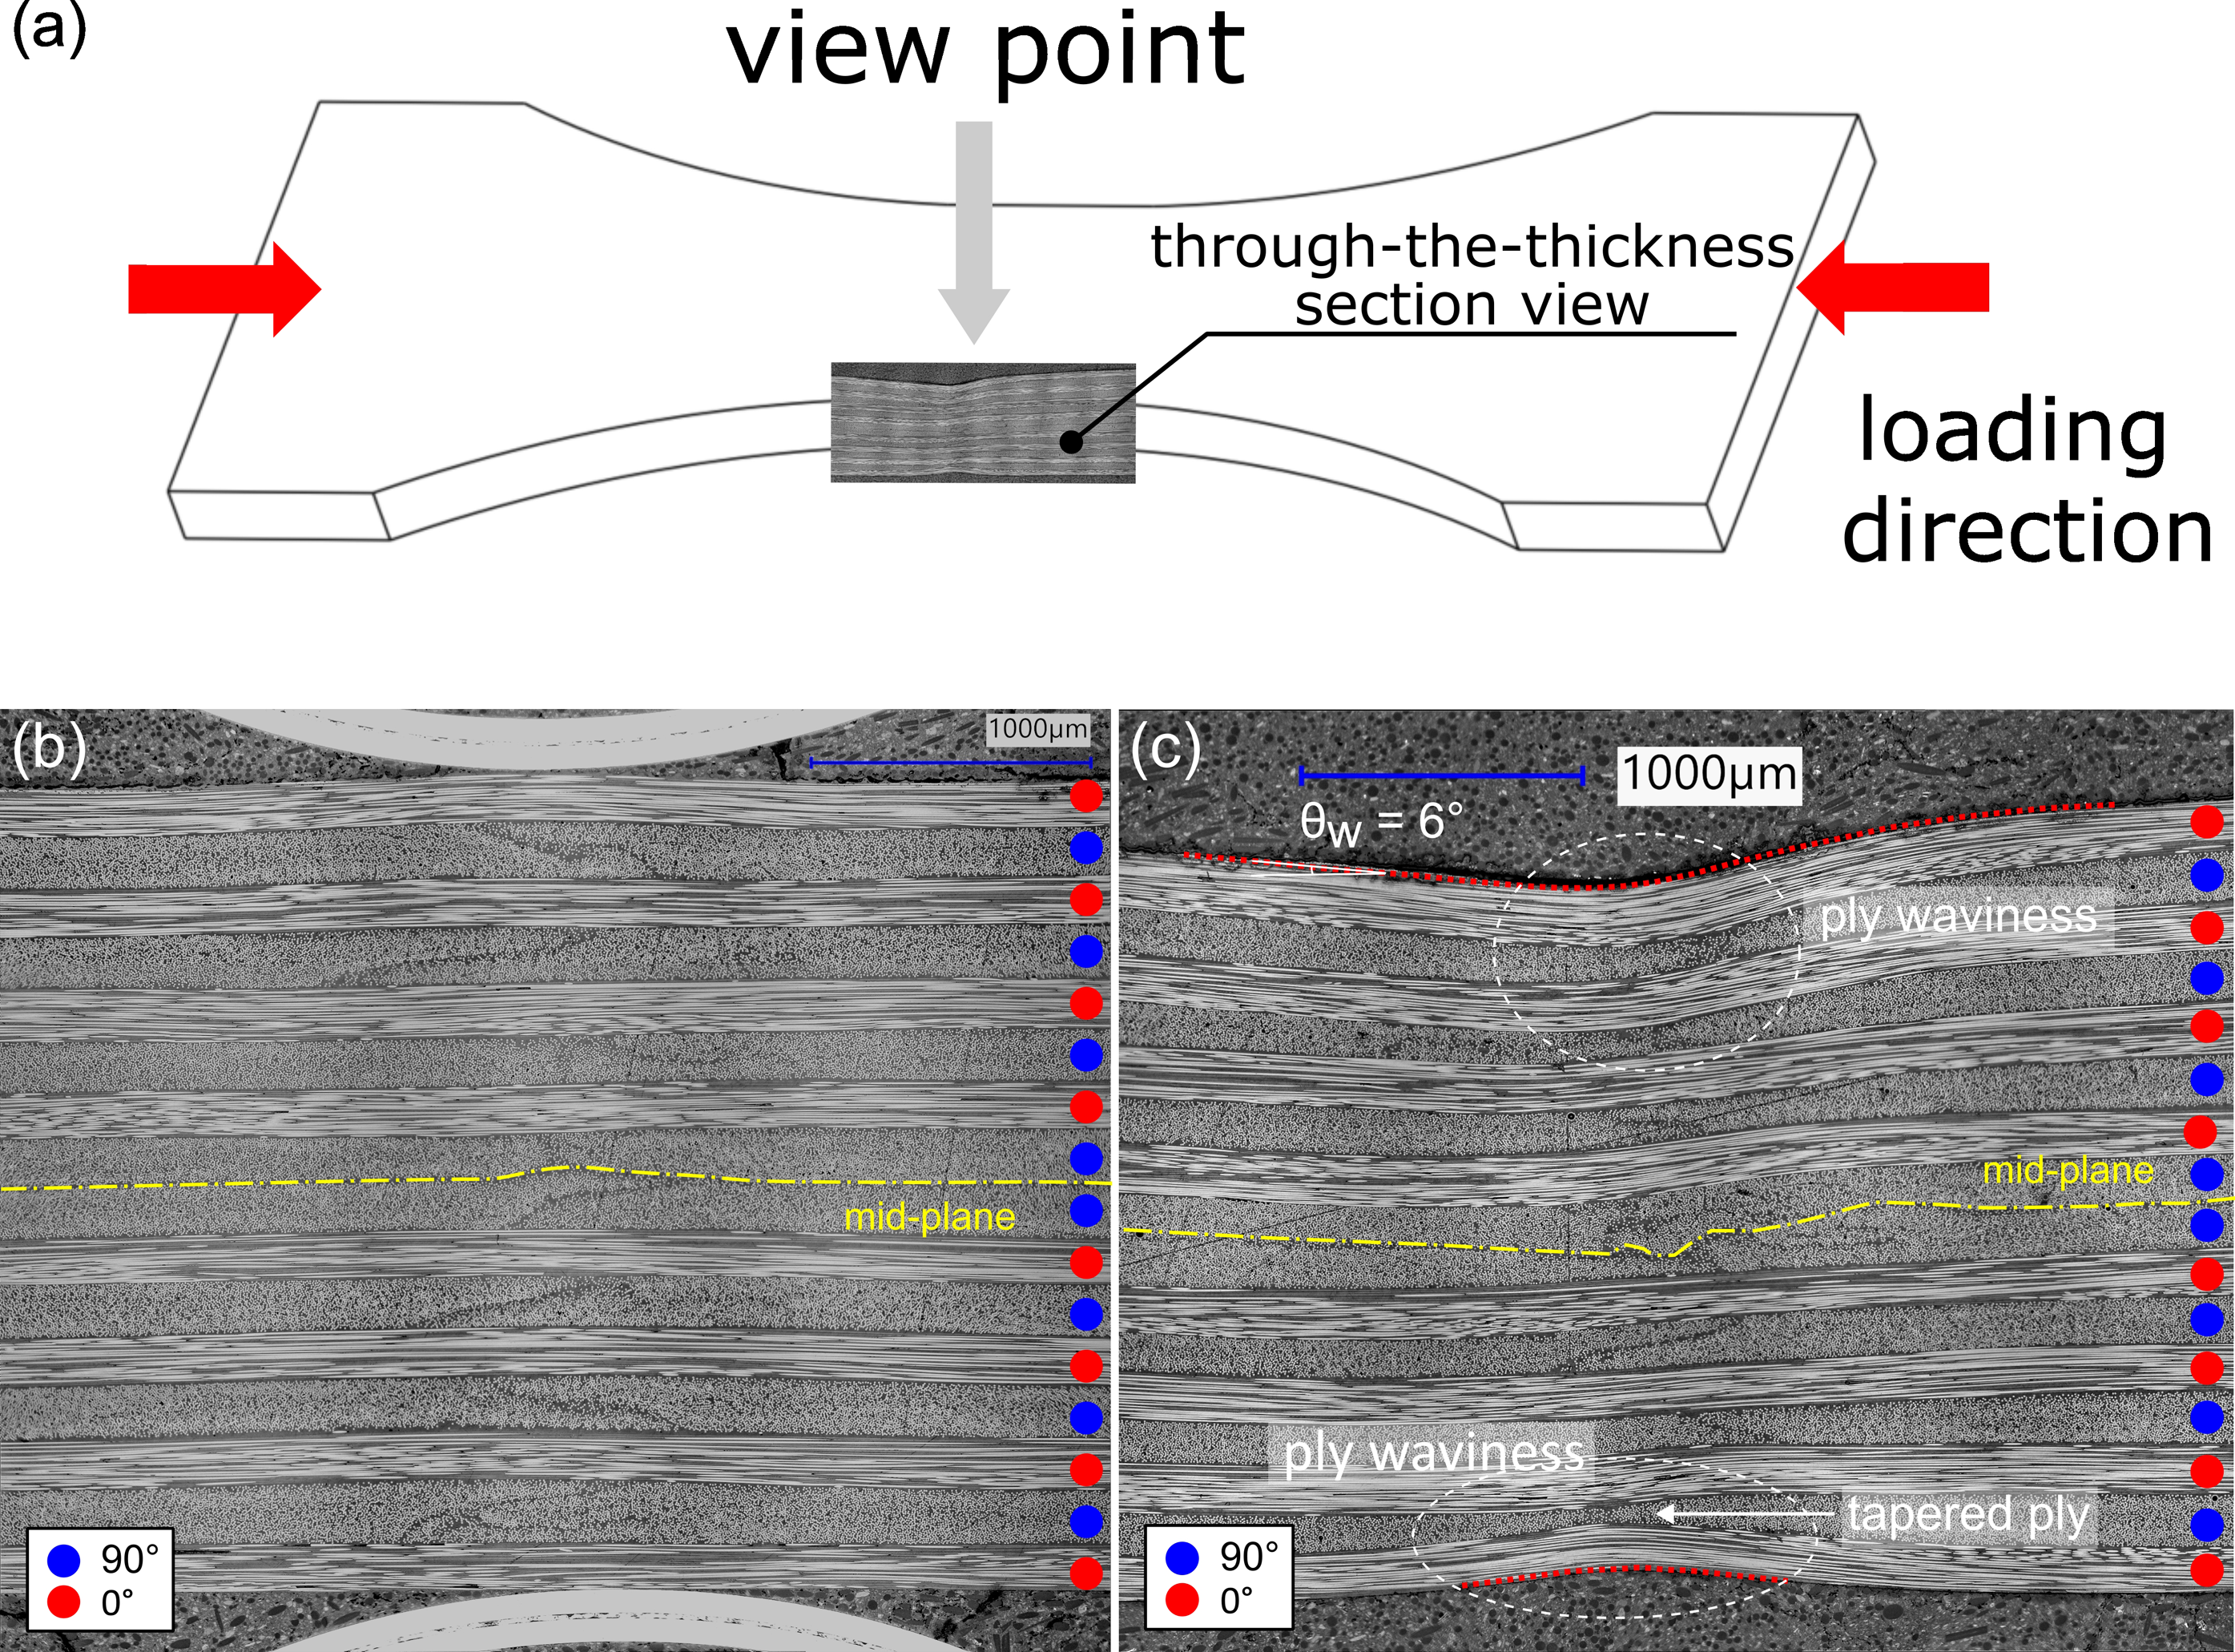
Furthermore, those images are post-processed via grey level analysis to extract the local fibre volume content in the 90° plies (Figure 6). For purpose of clarity, the 0° plies have been removed from the image. The surface of the fibres at 90° are extracted with a threshold value of 100 on a grey scale ranging up to 255. Those images visualise the local fibre volume content in the micrograph samples. In addition to the geometric deformation of the plies in the vicinity of the gaps, a clear drop of the fibre volume content from 55% to 20-30% is observed, which results from the sliding of fibres in the gap. This drop further reduce the load bearing capacity of the material under compression. The width of the incoming tape is significantly influenced by various manufacturing parameters, such as consolidation pressure and time.
16
The paper presents the first observation on variations of the local fibre volume content resulting from the gap formation and out-of-ply fibre movement. Post-processed microscopic through-the-thickness view of as-manufactured Carbon/LM-PAEK laminate: (a) local fibre volume contents without gap defects; (b) local fibre volume contents with gap defects.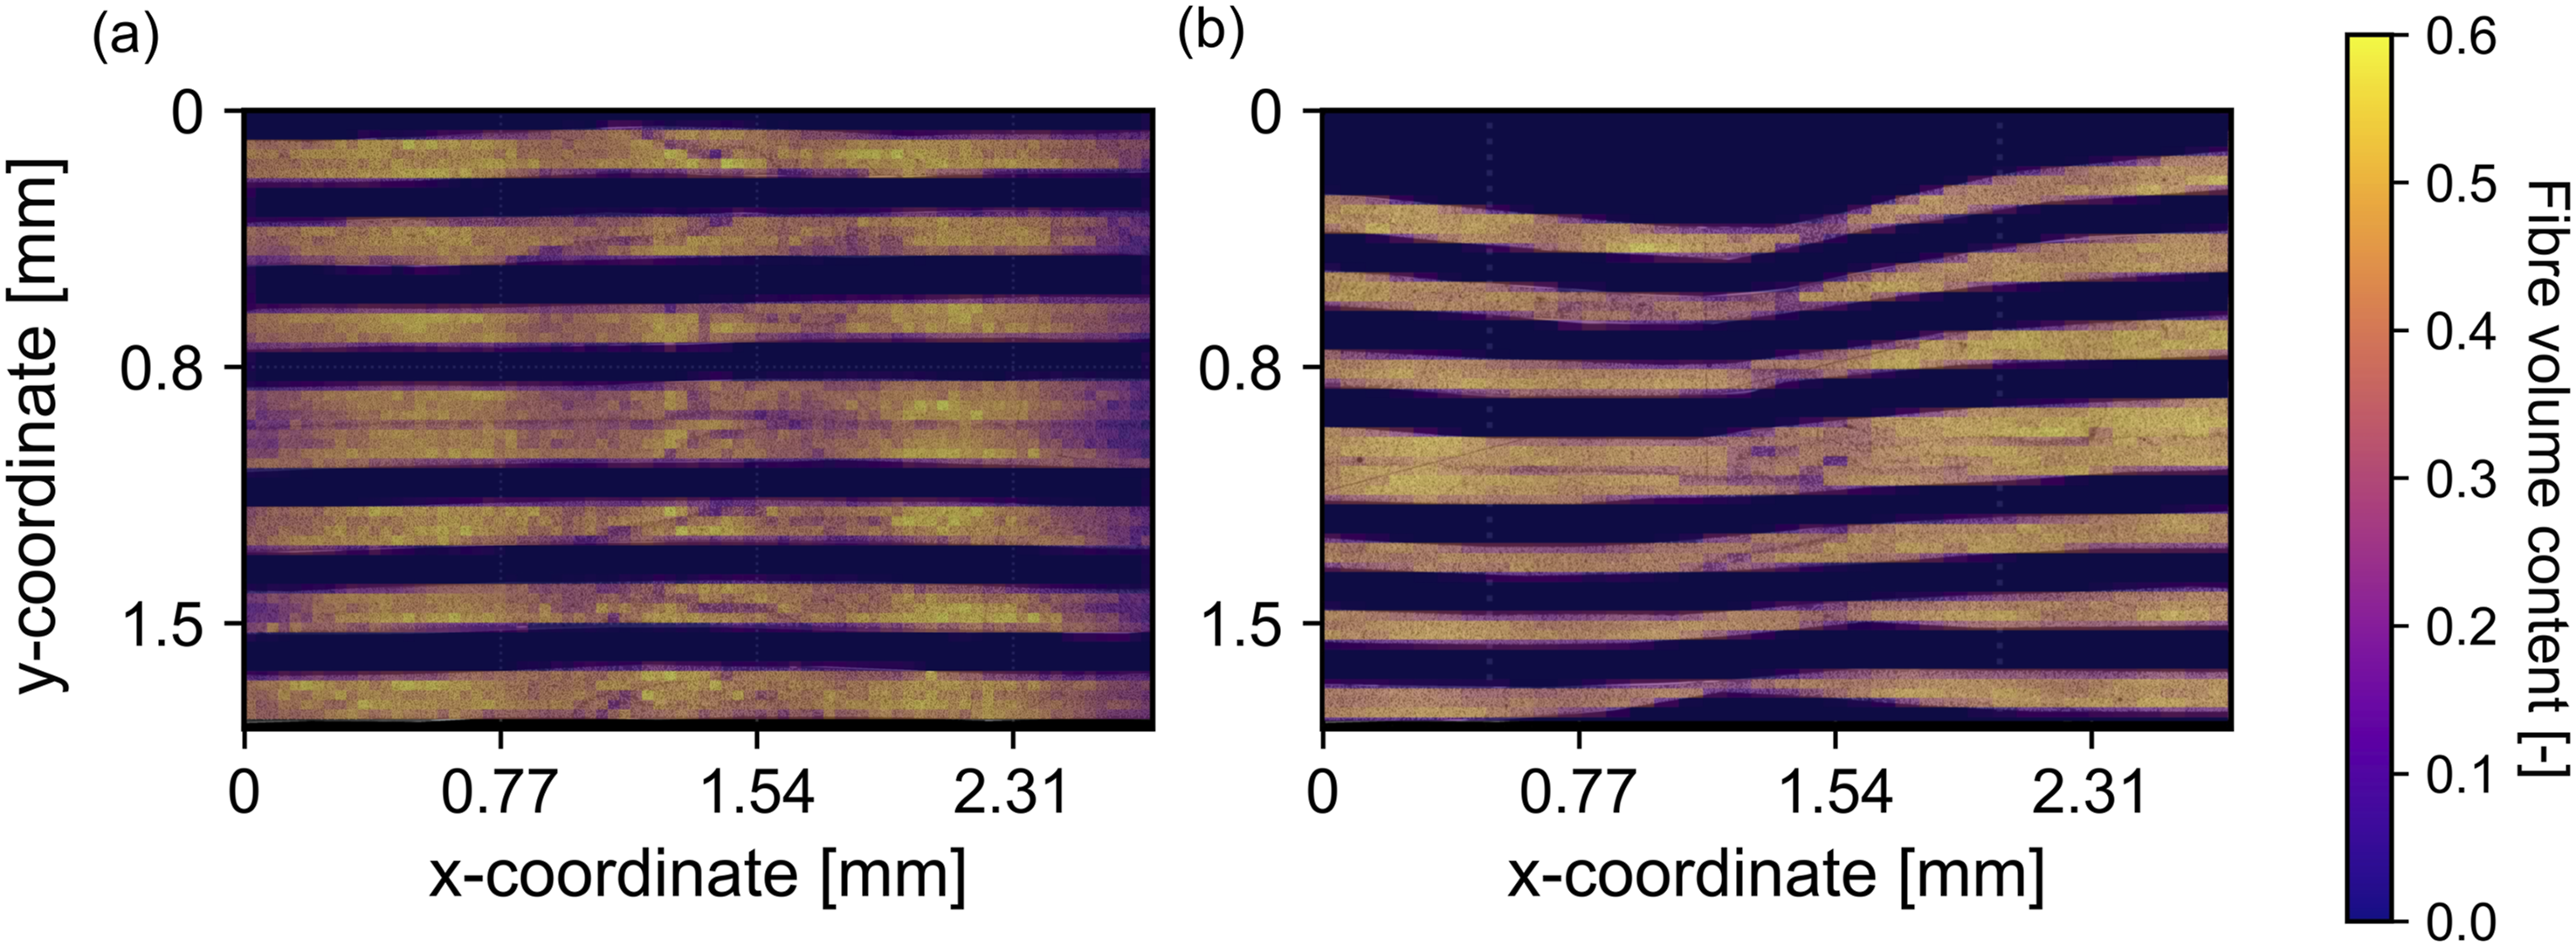
Ultrasonic testing (C-scan)
Figure 7 shows a C-scan image of as manufactured plate in a colour scale that ranges from blue to red. The colour gradient represents the loss of the backwall signal in amplitude attributed to defects and porosity in the samples. In this figure, blue indicates a low backwall signal, while red indicates a high backwall signal. The pulse-echo system successfully detects gap defects with low backwall propagation in blue and shows the waffle-like imperfection patterns, which corresponds to the intended gap design. An amplitude pulse-echo C-scan of as-manufactured Carbon/LM-PAEK composite plate.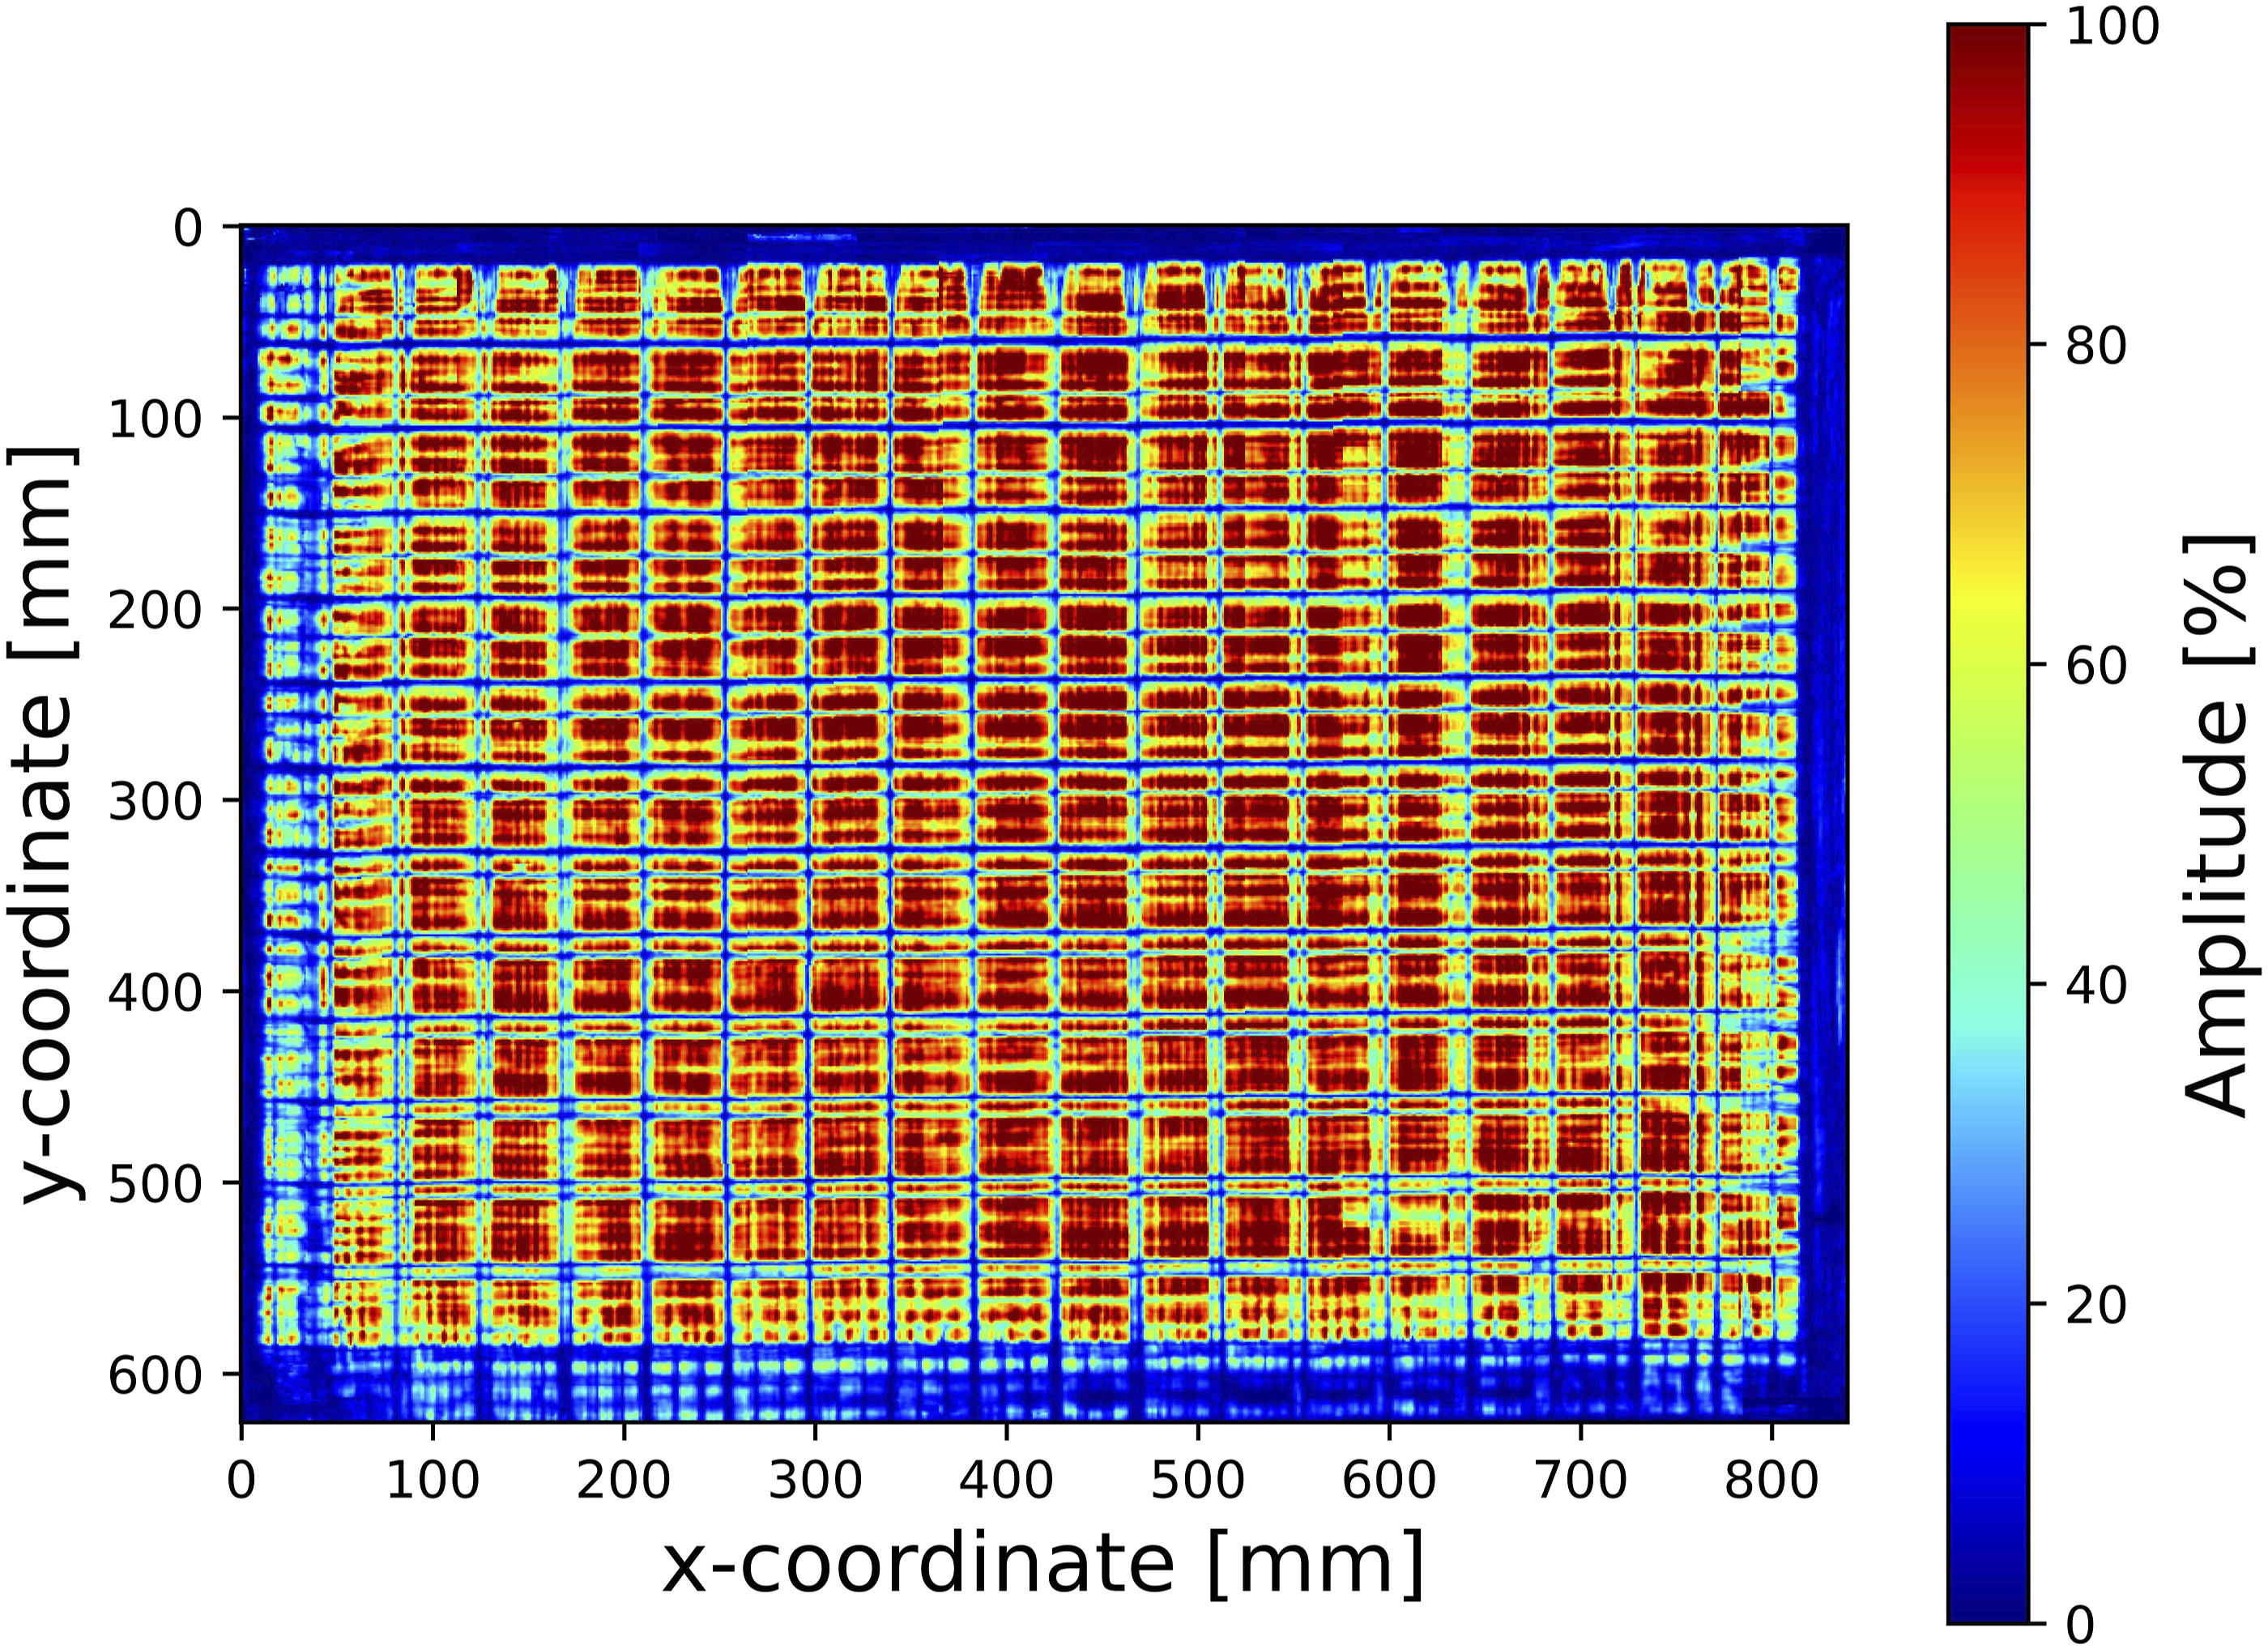
Testing at intermediate strain rates
Figure 8 presents the results of dynamic compression tests conducted at strain rates up to 200 s−1. No filters are applied to the force signals and the axial strain are obtained using the strain gauge signal. Under compressive loading, the CF/LM-PAEK material shows a linear elastic behaviour at all strain rates and fails in a sudden manner. The stress versus strain curves (Figure 8(a)) show a clear strain-rate dependency of the compression strength. While the compressive modulus moderately increases by 3% between quasi-static loading and 200 s−1, the compressive strength increases by 56% in the same range. Similar observations can be found from dynamic compression results of carbon fibre-reinforced PA6 composites.
18
The results show longitudinal compressive strength increases of approximately 60% when the strain rate increases to 82 s−1. This is consistent with other studies on thermoplastic composites where the polymer matrix exhibits significant viscoelastic behaviour.
19
Experimental data: (a) Compressive stress-strain data of carbon/LM-PAEK composites; (b) Percent bending; (c) Power spectral density of compressive stress-strain data; (d) Application of a low-pass filter on dynamic compressive stress-strain at strain rate of 200 s−1.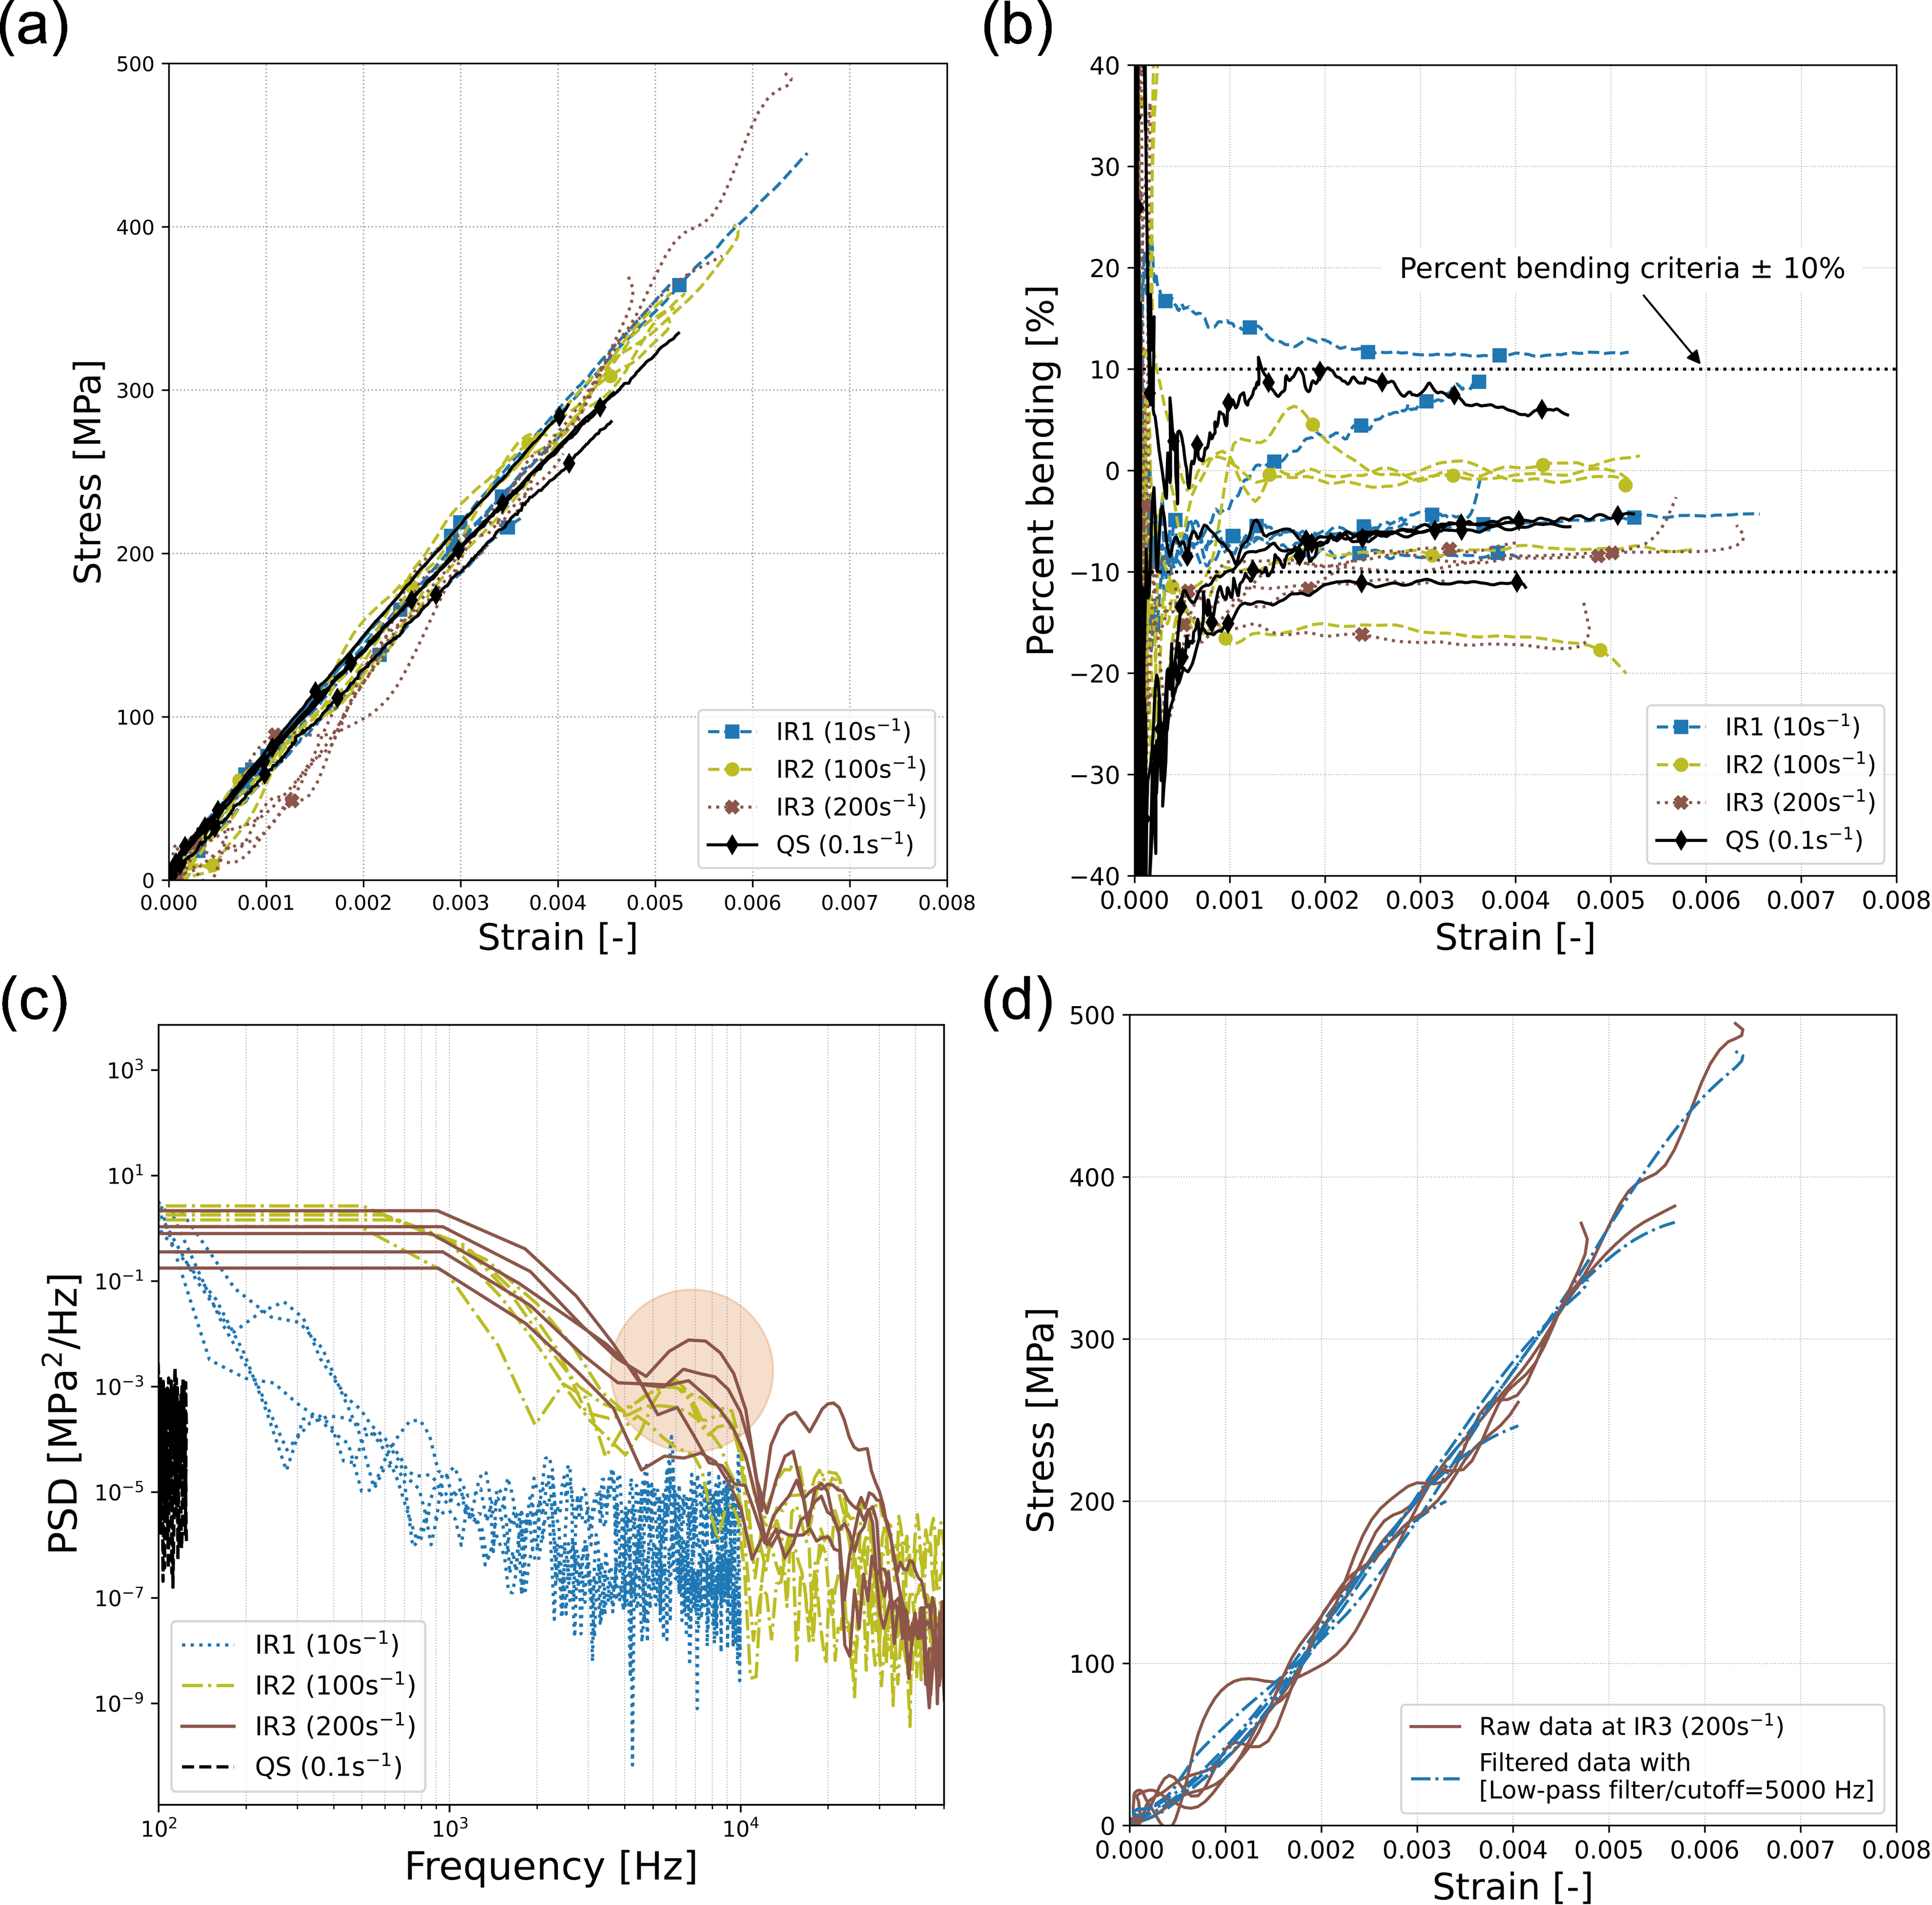
The validity of the experiments is assessed by measuring the percent bending in the specimen. The ASTM standard outlines the acceptance criteria for static compression testing, specifying that the acceptable range for percentage of bending is ±10%. Even higher values can be accepted without any significant differences in the measured modulus or strength. 18 As shown in Figure 8(b), the percent bending measured in several tests is slightly beyond the ASTM criteria, approximately by 15%. However, these failed specimens do not show any significant signs of localised failure or buckling. Therefore, all specimens are considered valid and considered in evaluation.
Additionally, it is noteworthy that the effects of force oscillation become noticeable at a strain rate of 200 s−1. Figuer 8(c) presents the power spectral density (PSD) of stress signals at various strain rates, offering valuable insights into the frequency components of the stress measurements and the characteristics of oscillations. A distinct peak in PSD at strain rate of 200 s−1 appears in the 6000-7000 Hz range, indicating that these frequencies may be associated with force oscillations observed at a strain rate of 200 s−1. This information guides the selection of the cut-off frequency. When a low-pass Butterworth filter with a cut-off frequency of 5000 Hz is applied, the filtered data with minimum distortion as shown in Figure 8(d) compared to the raw data. The filtered data at strain rate of 200 s−1 is only used to calcuate Young’s modulus.
Figure 9 illustrates the dynamic compressive strength normalized against quasi-static conditions across a wide range of logarithmic strain rates. This figure incorporates both published experimental data from the literature17,18,20,27,28 and values obtained in the current work. Additionally, a 95% confidence interval is included to accesses the uncertainty associated with the fitting parameters. It is important to note that the strength measured at a strain rate of 0.1 s−1 is considered as the upper limit of the quasi-static condition.29,30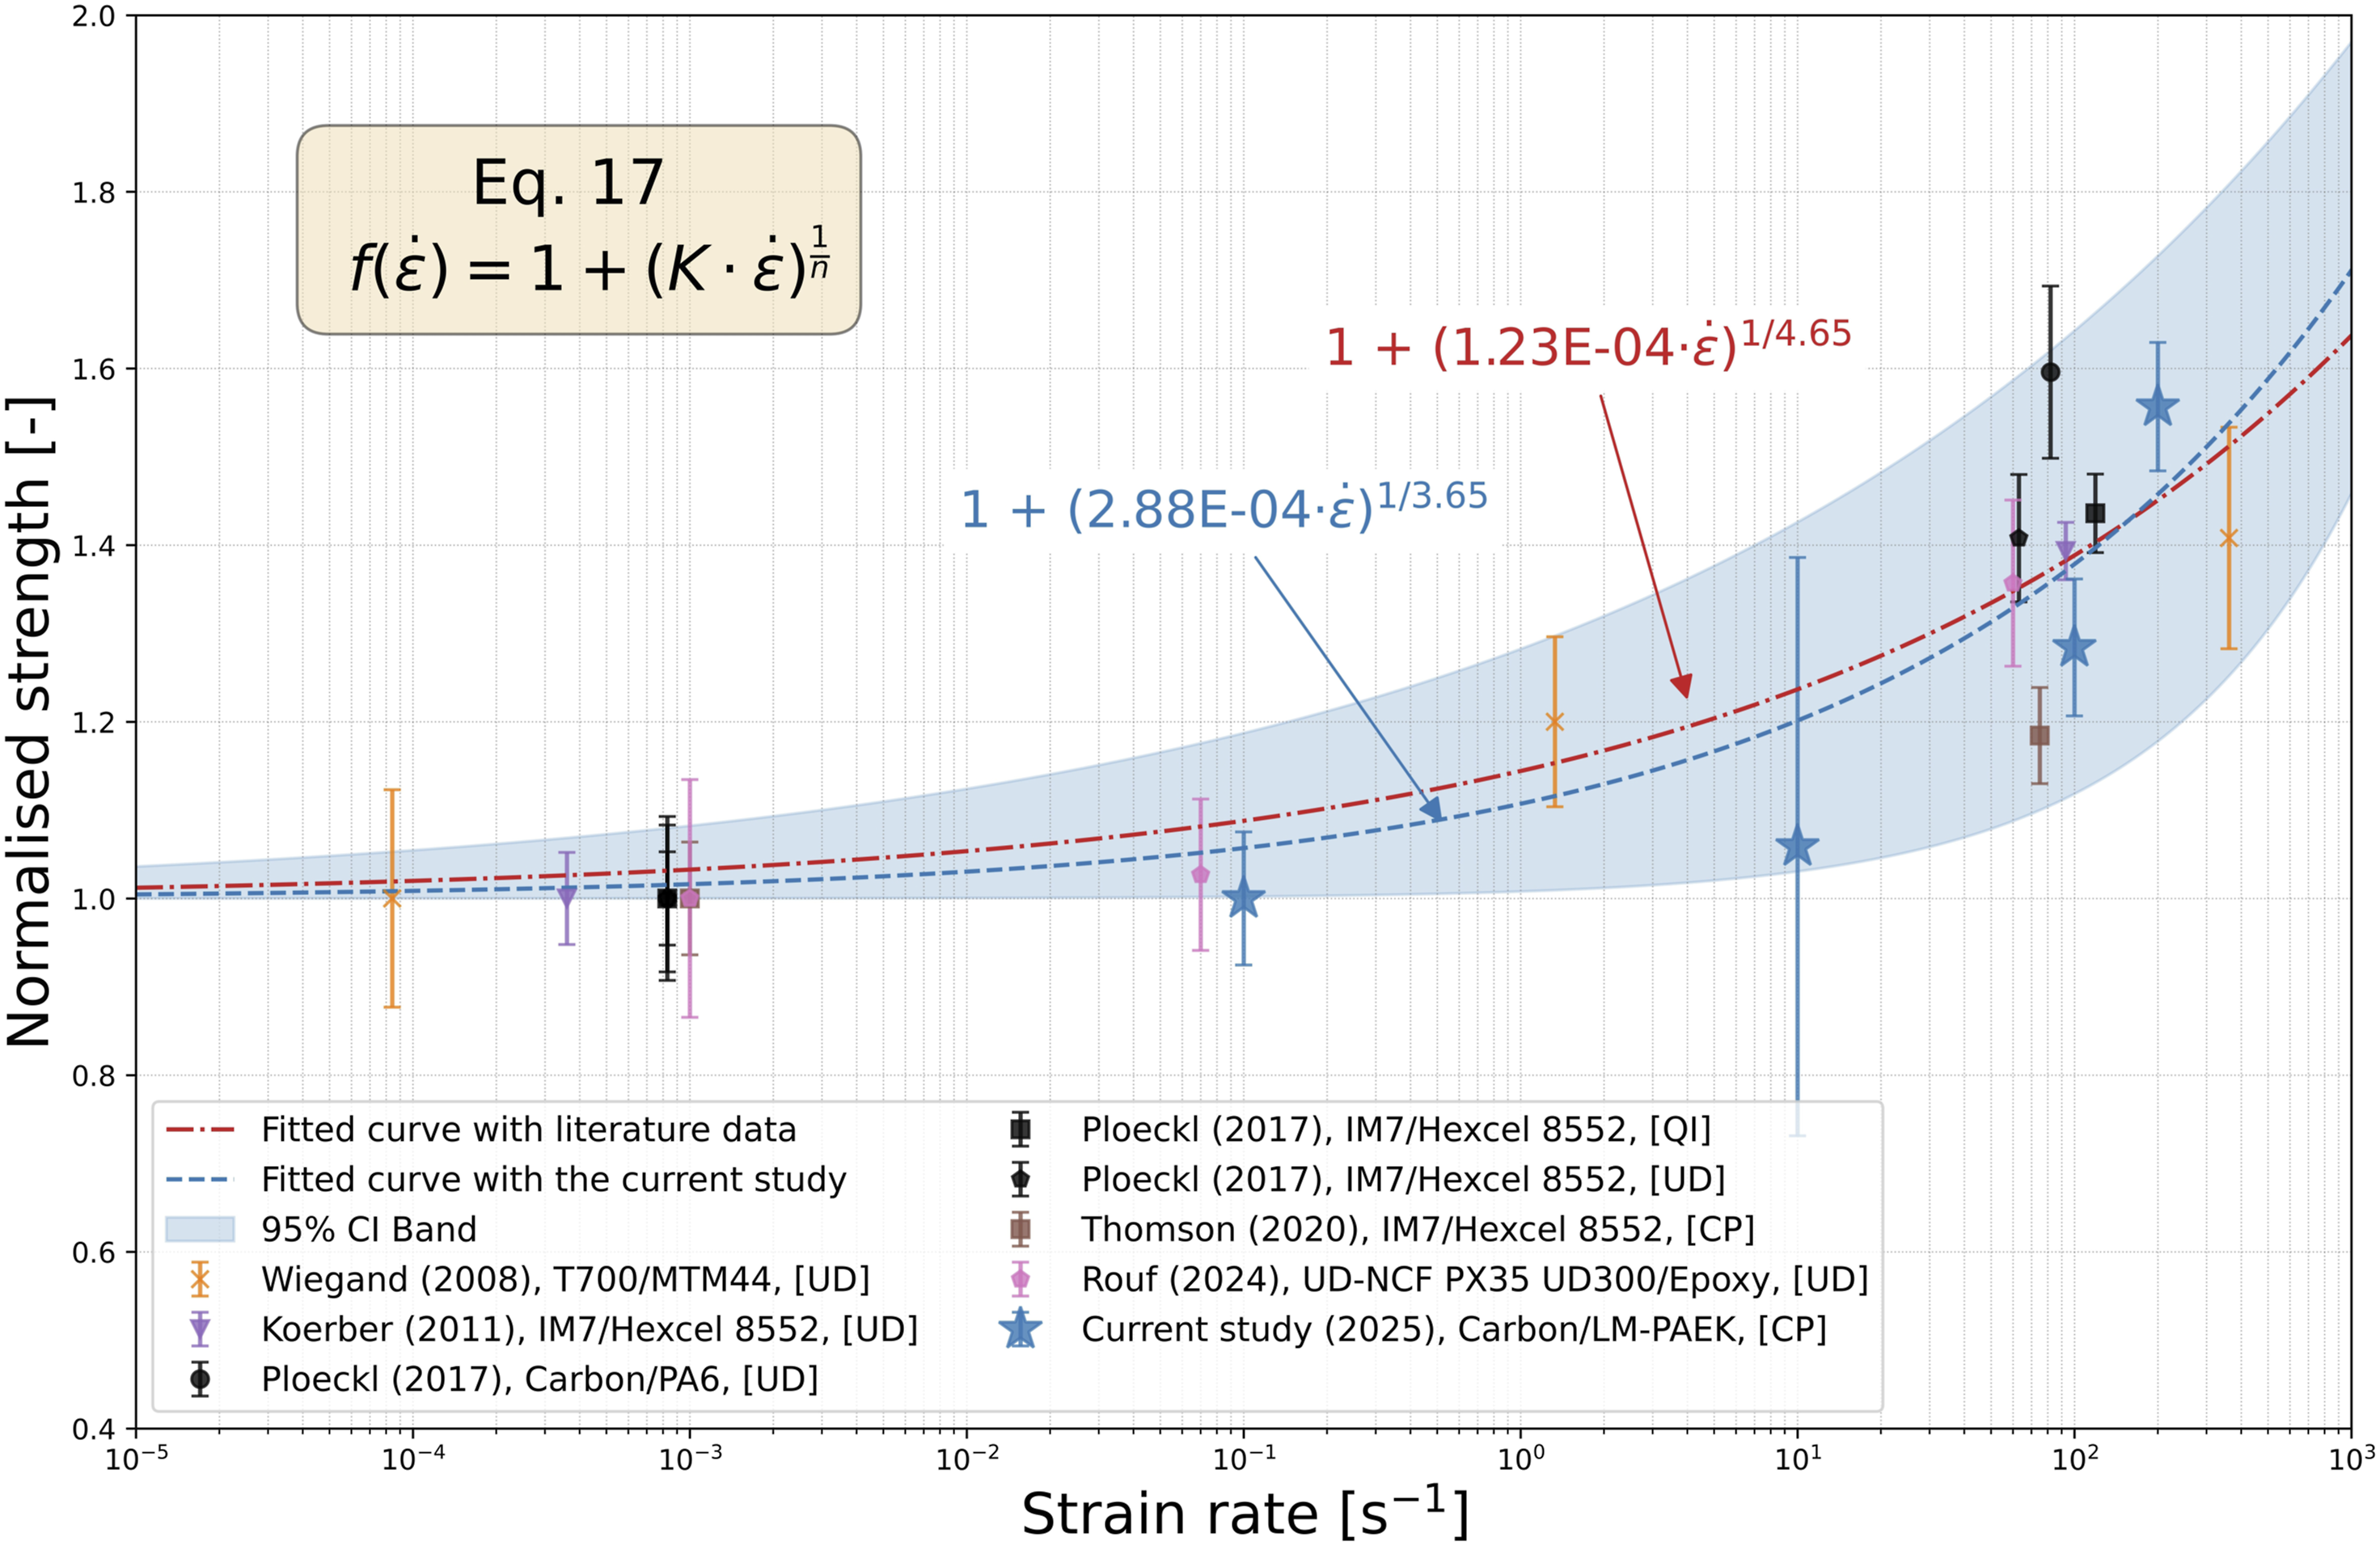
The results indicate a clear rate dependence of the experimental data from the end-loading compression testing. For a comparative study, the Cowper-Symonds model
31
is utilised to generate the fitted curves with and without the current experimental results, and the model is defined as:
The Mean Squared Error (MSE) is a metric that evaluate the differences between the predicted and observed data and is defined as follows:
The observed rate dependency of compressive strength in the range of applied strain rate is in adequacy with collected literature data. Furthermore, the fitting parameters
Effect of gaps
Figure 10 shows C-scan images of single test specimens obtained from ultrasonic testing and represented in a colour map. The colour scale is based on the values of backwall wave propagation. A blue colour indicates a low level of backwall propagation and suggests the presence of defects such as voids or gaps within the manufactured composite plate, while the red colour signifies an absence of defects. Additionally, the progression of failure in high-speed image sequences is illustrated alongside the C-scan images depicting three stages: (a) at initiation of the test, (b) at the peak force, and (c) after failure. Failure modes are categorised into two distinct types: kink band failure is denoted as mode 0 and wedge splitting failure is denoted as mode 1. Ultrasonic images of test specimens tested and its corresponding failure at: (a) strain rate of 0.1 s−1; (b) strain rate of 10 s−1; (c) strain rate of 100 s−1; (d) strain rate of 200 s−1. (*red lines in high-speed images indicate a failure in the samples.).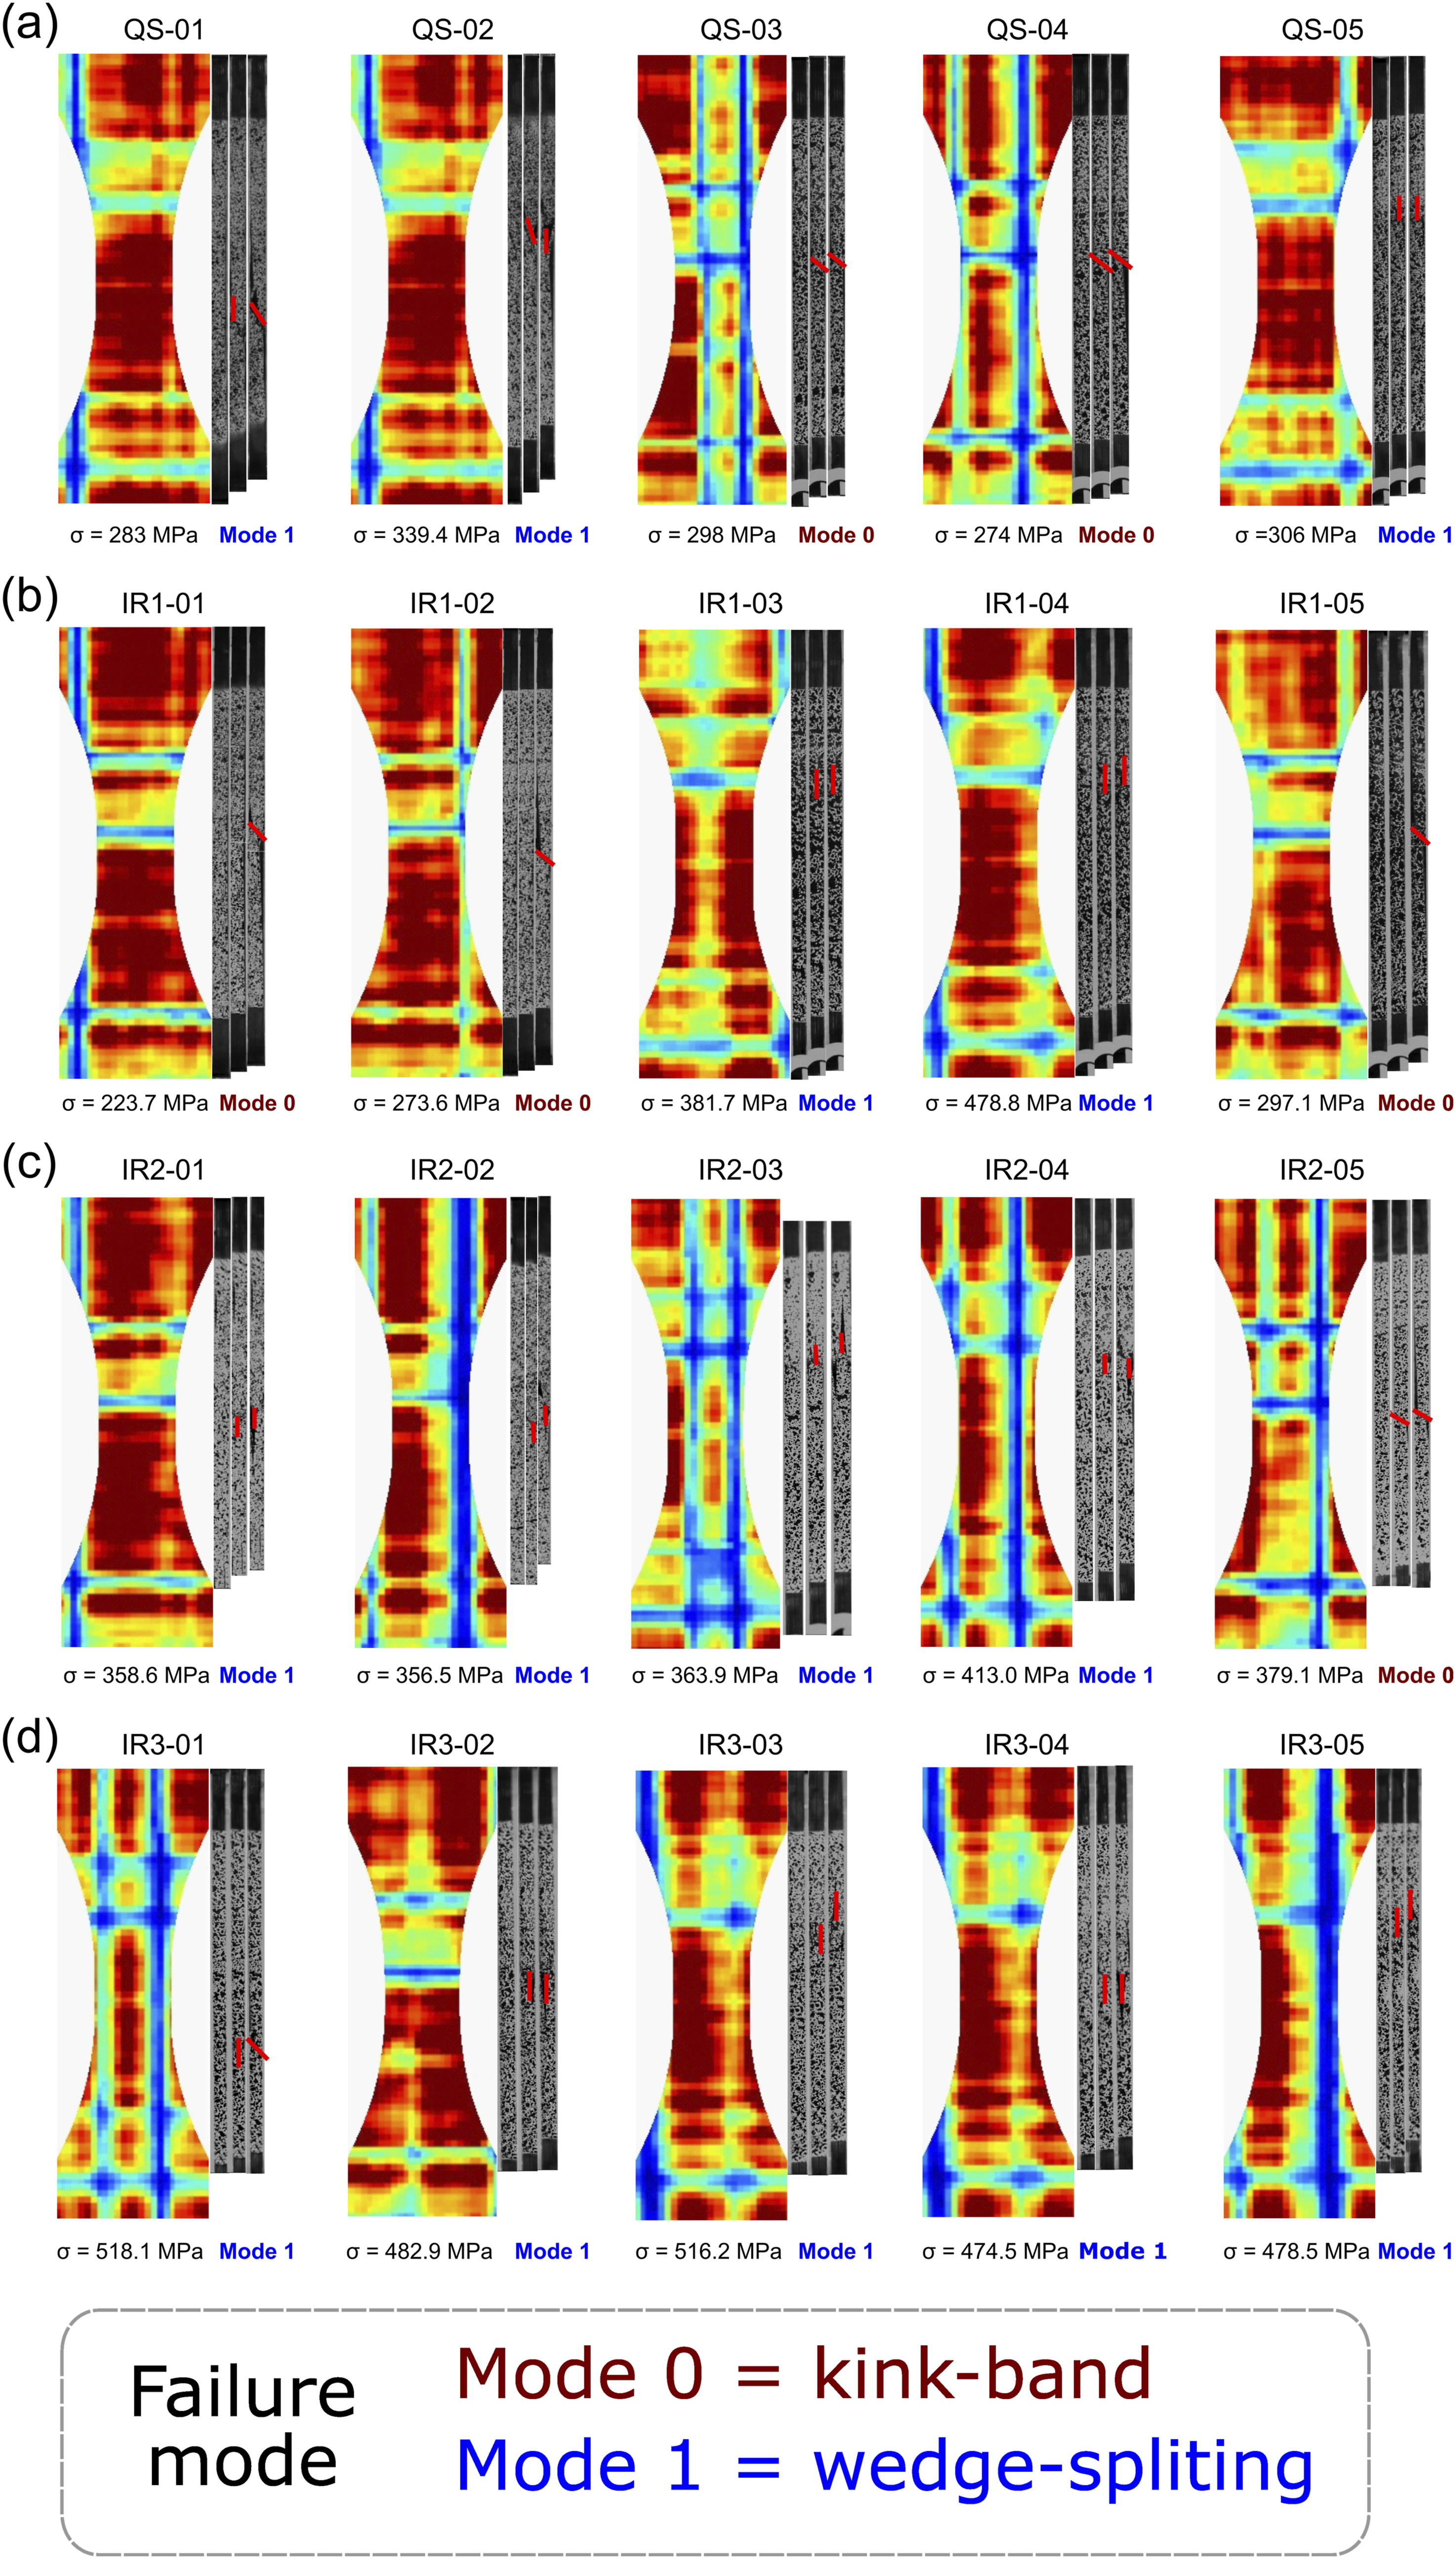
Summary of compression properties in mean and standard deviation values.
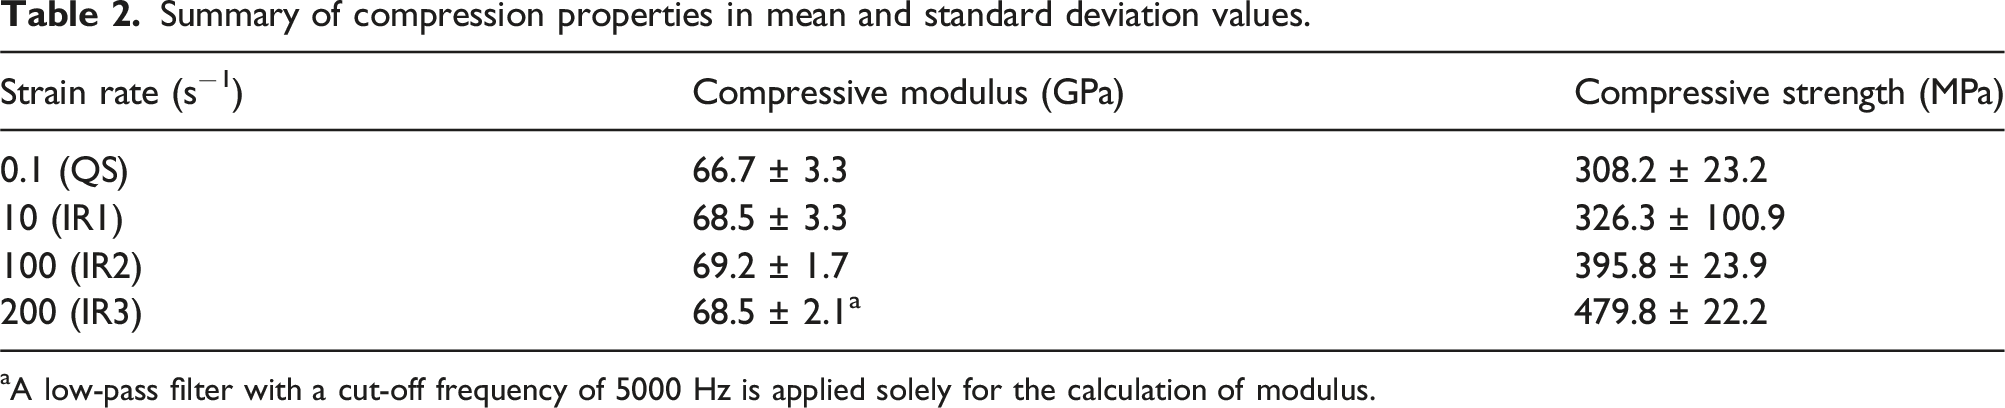
aA low-pass filter with a cut-off frequency of 5000 Hz is applied solely for the calculation of modulus.
Upon examining high-speed images of two specimens representing the lowest and highest strengths, it can be observed that the failure mode in the specimen with the lowest strength exhibits shear and delamination failures, while the specimen with the highest strength displays wedge spitting (Figure 11). The low compressive strength has been attributed in previous literature work to the initiation of delamination at the resin-rich interfaces.
34
Furthermore, the observed variability at IR1 can be attributed to the distribution of manufacturing-induced defects. The consolidation process can influence how gaps are filled by the surrounding fibre architecture with varying localised resin flow. This could influence the temperature evolution in manufacturing and the cooling rate and lead to changes in the fibre/matrix or interlayer interface characteristics due to changes of the crystallinity. The precise nature of the localised geometrical differences and the resultant failure mode at the gaps can vary. This is evident from the differences in failure modes between specimens, even those with same defect patterns, as demonstrated by the failure modes of specimens tested at a strain rate of 10 s−1. The different failure modes can be associated with variations in the fibre/matrix interface, as discussed by Kim and Jang.
35
They reported that wedge-splitting, also known as brooming fracture, provides strong evidence that buckling phenomena do not occur during compressive tests. In contrast, kink-band failure is attributed to fibre micro-buckling.
33
However, further work should be performed to precisely link the interface strength to the failure modes. (a) strain rate dependency of compressive strength on a logarithmic scale; (b) Corresponding C-scan image of the lowest compressive strength measured at strain rate of 10 s−1; (c) Corresponding C-scan image of the highest compressive strength measured at strain rate of 10 s−1.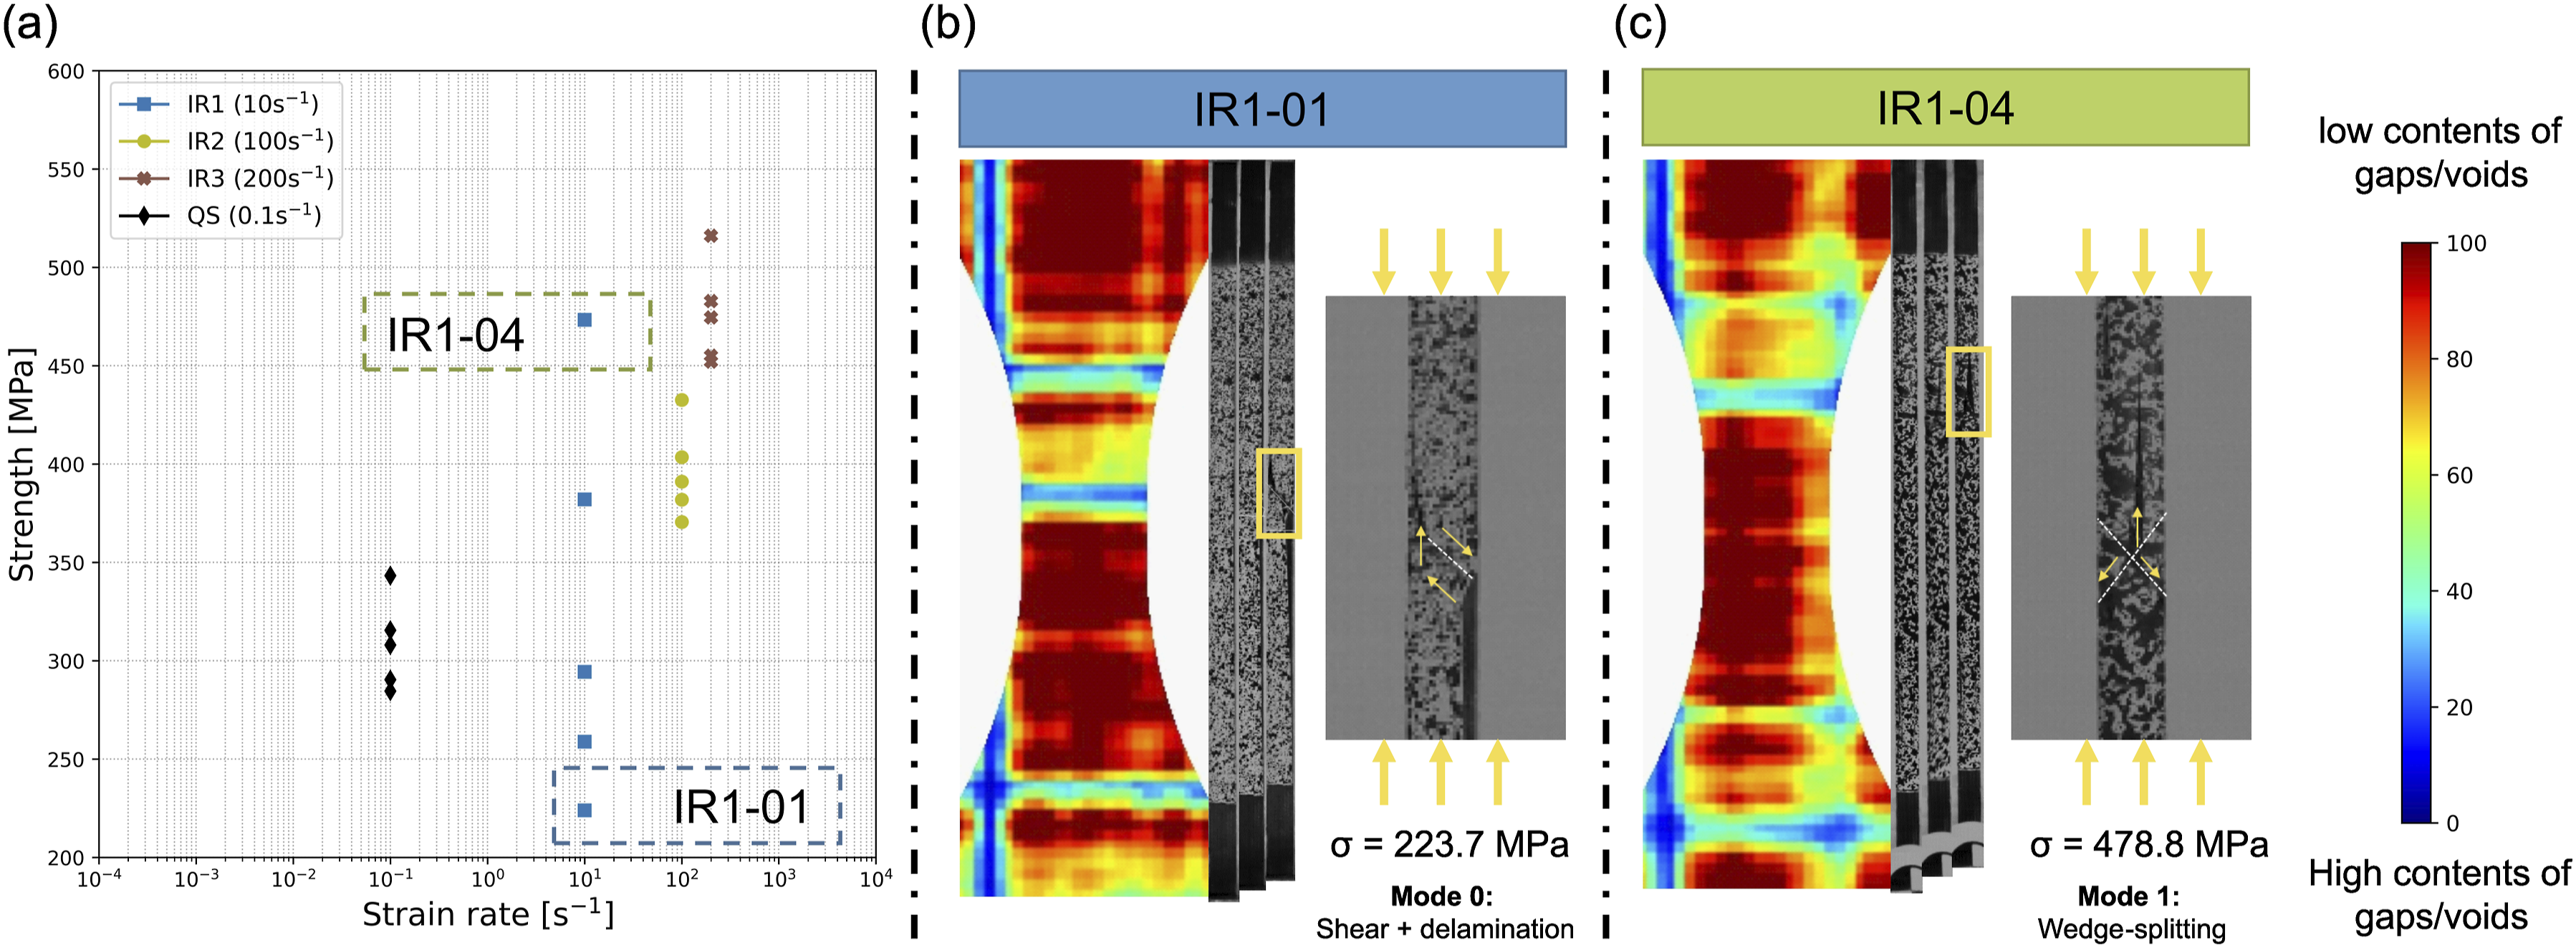
Figure 12 Illustrates the strain-rate dependency of the compressive strength on a logarithmic scale and highlights the influence of the two distinct failure modes observed in the tested specimens. Kink band failure occurs due to local micro-buckling when the matrix experiences high shear deformations. This type of failure is closely associated with local fibre misalignment and resin-rich regions. On the other hand, wedge splitting develops from fracture initiation at the outer layers of the specimen, which is followed by significant delamination. This deep delamination forms along the loading axis when fractures occur on both sides, leading to concurrent shear fractures. The classification of compression failure modes is complex and a more detailed classification of these failure modes is available.14,33 Correlation between failure mode and measured compression strength in compression testing at strain rates up to 200 s−1.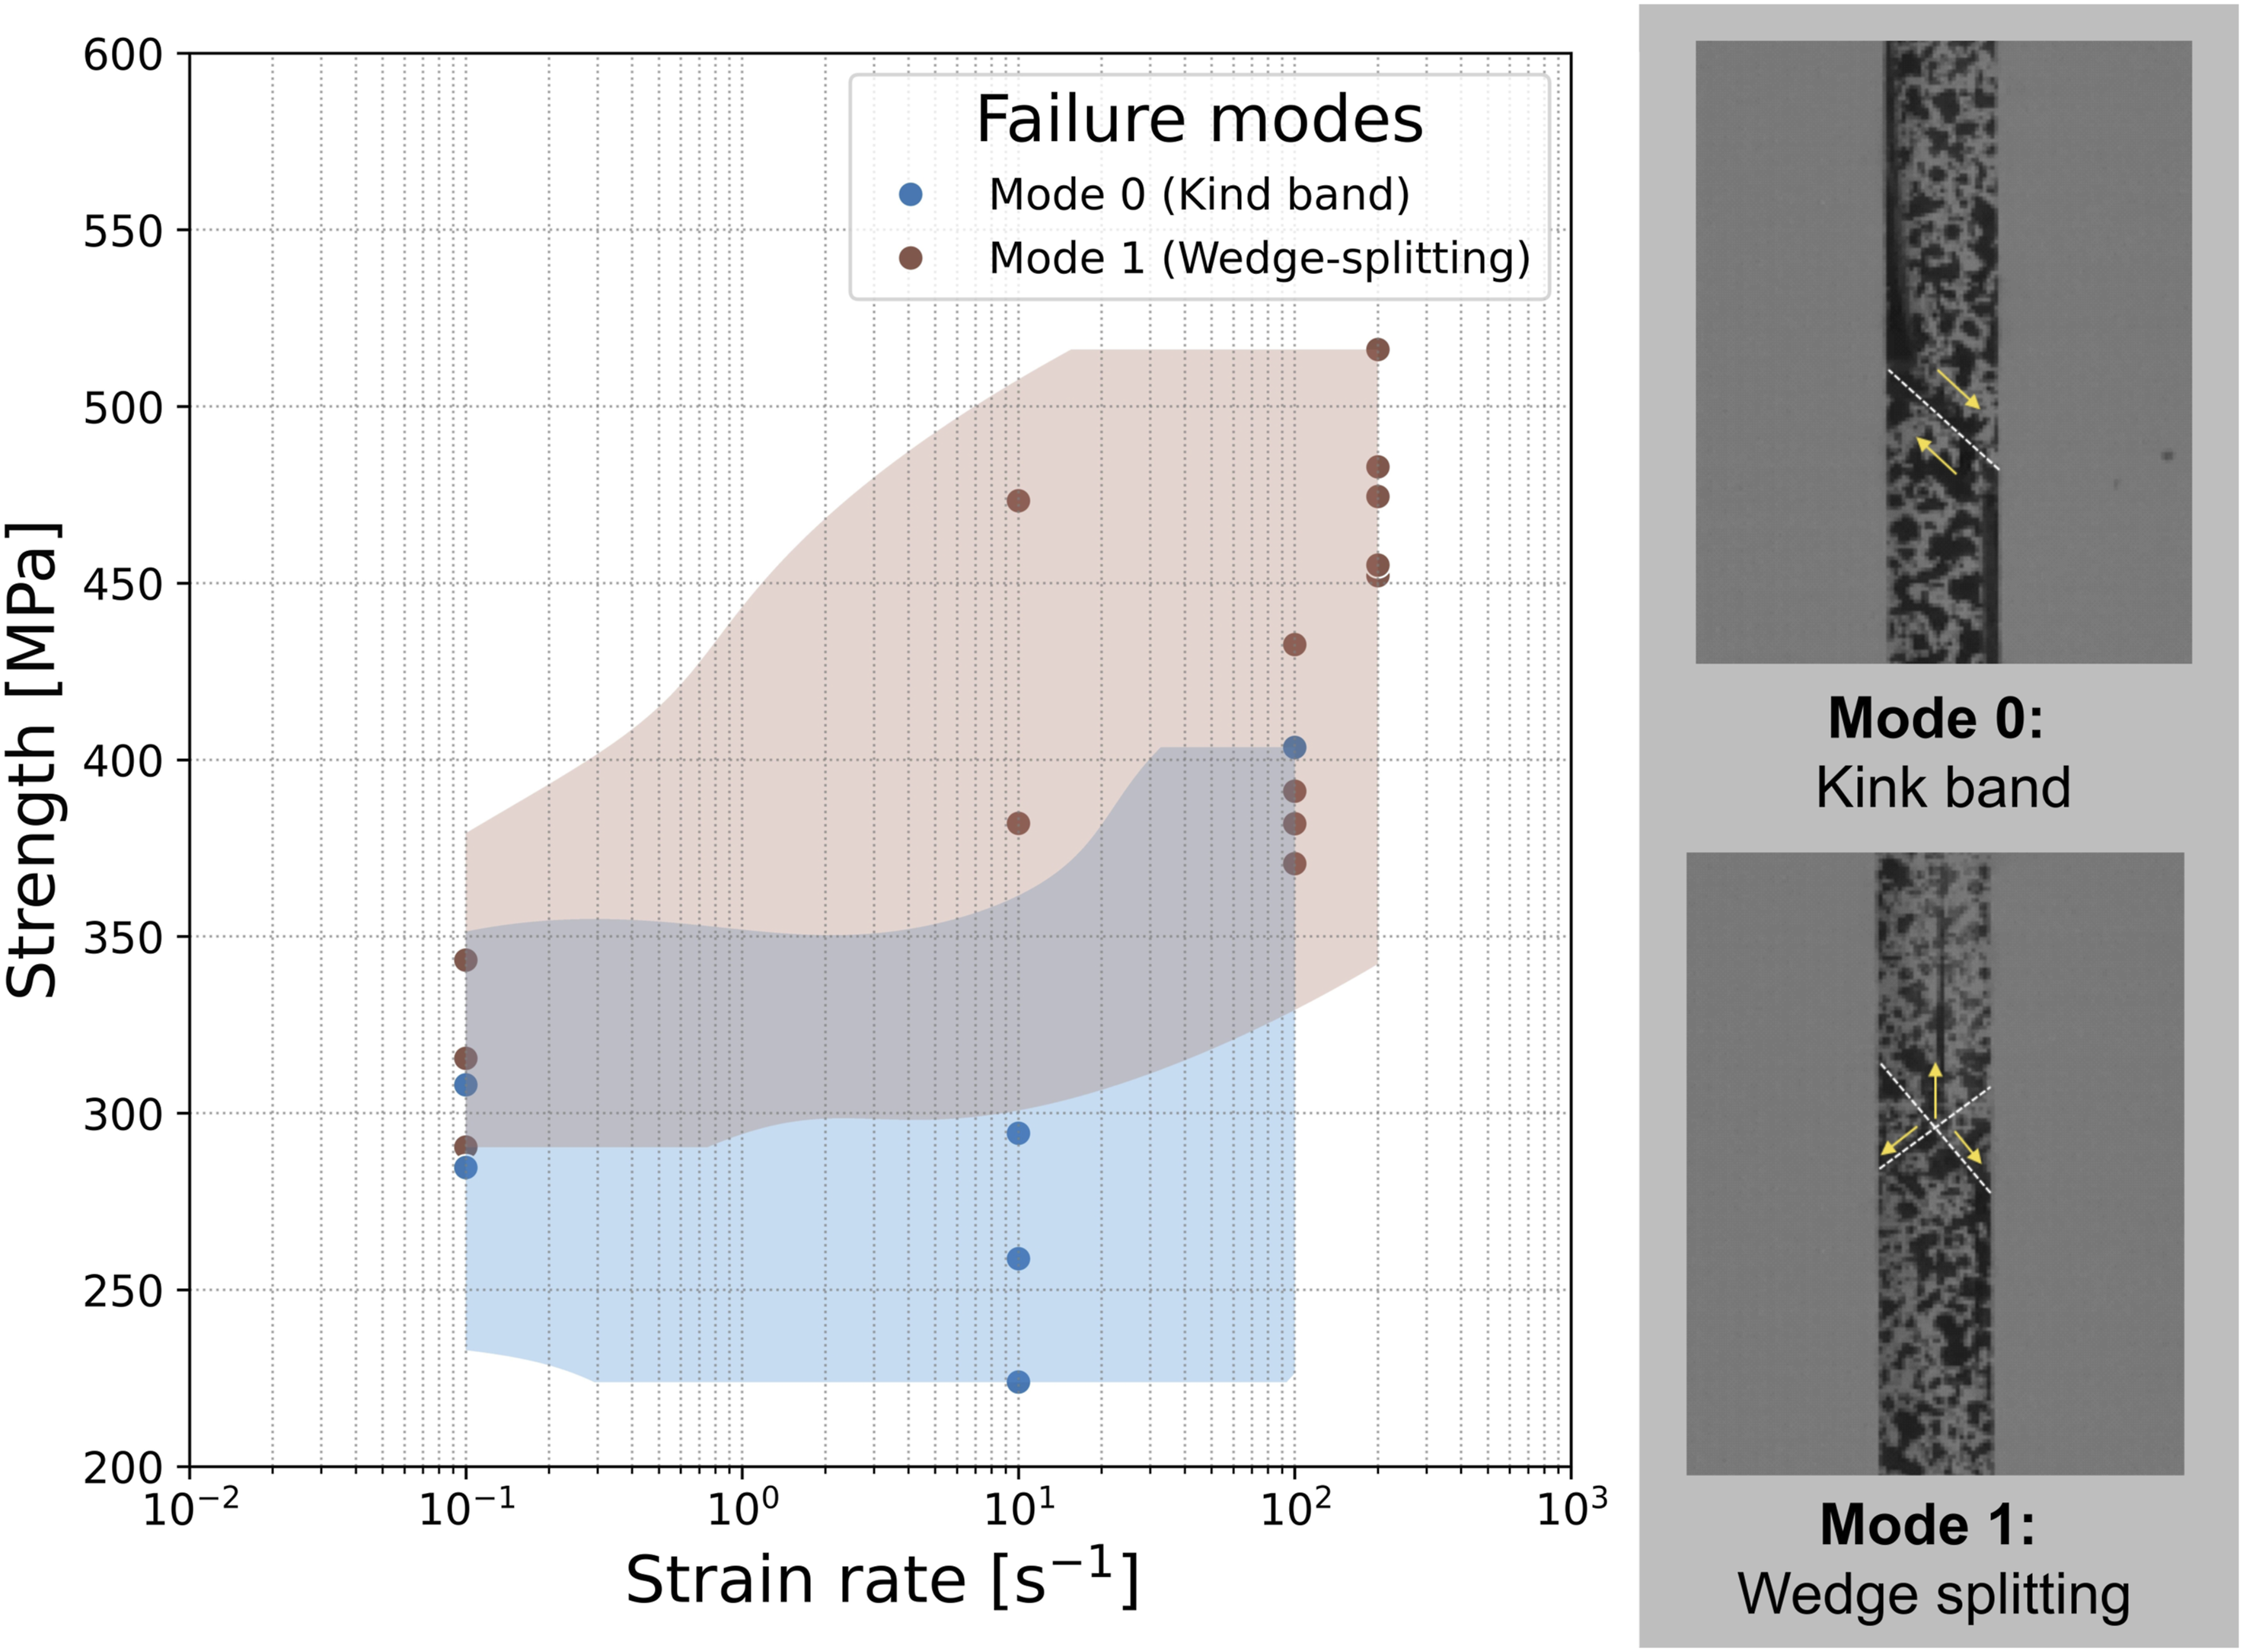
Based on the observation from this study, the increasing compressive strength is influenced not only by the rate-dependent properties of the LM-PAEK matrix but also by the fibre-matrix interface. The observed shift in failure modes from kink-band failure to wedge-splitting with increasing strain rates indicates the significance of the fibre-matrix interface properties. As Lankford 36 pointed out, the fibre-matrix interface is crucial in the kinking initiation. Also, the kink-band failure is closely linked to interfacial shear strength (ISS). 33 For example, Madhukar and Drzal 37 reported that increases in ISS lead to changes in failure modes, transitioning from delamination to kinking and then to fibre compressive failure. Thus, further investigation into the shifting failure modes could be a valuable research topic, particularly regarding the role of the fibre-matrix interface in the rate dependence of thermoplastic-matrix composites.
Pearson correlation
Figure 13 presents the Pearson correlation coefficient in a heatmap to visualise the strength of the relationships between the investigated variables. Each element in the heatmap represents the correlation between two specific variables. The gap contents can be divided into the two main laminate directions: longitudinal and transverse. Although the same number of gaps is placed in both directions as shown in Figure 2, the resulting geometrical differences will affect the specimens differently depending on the loading direction. The ply waviness in transverse direction should have a greater impact and strengthen instability modes, while the gaps in longitudinal direction may have a lower impact on compression loading. The results indicate a strong positive linear correlation between strain rate and compressive strength ( Pearson correlation coefficient between the mechanical properties and the gap contents.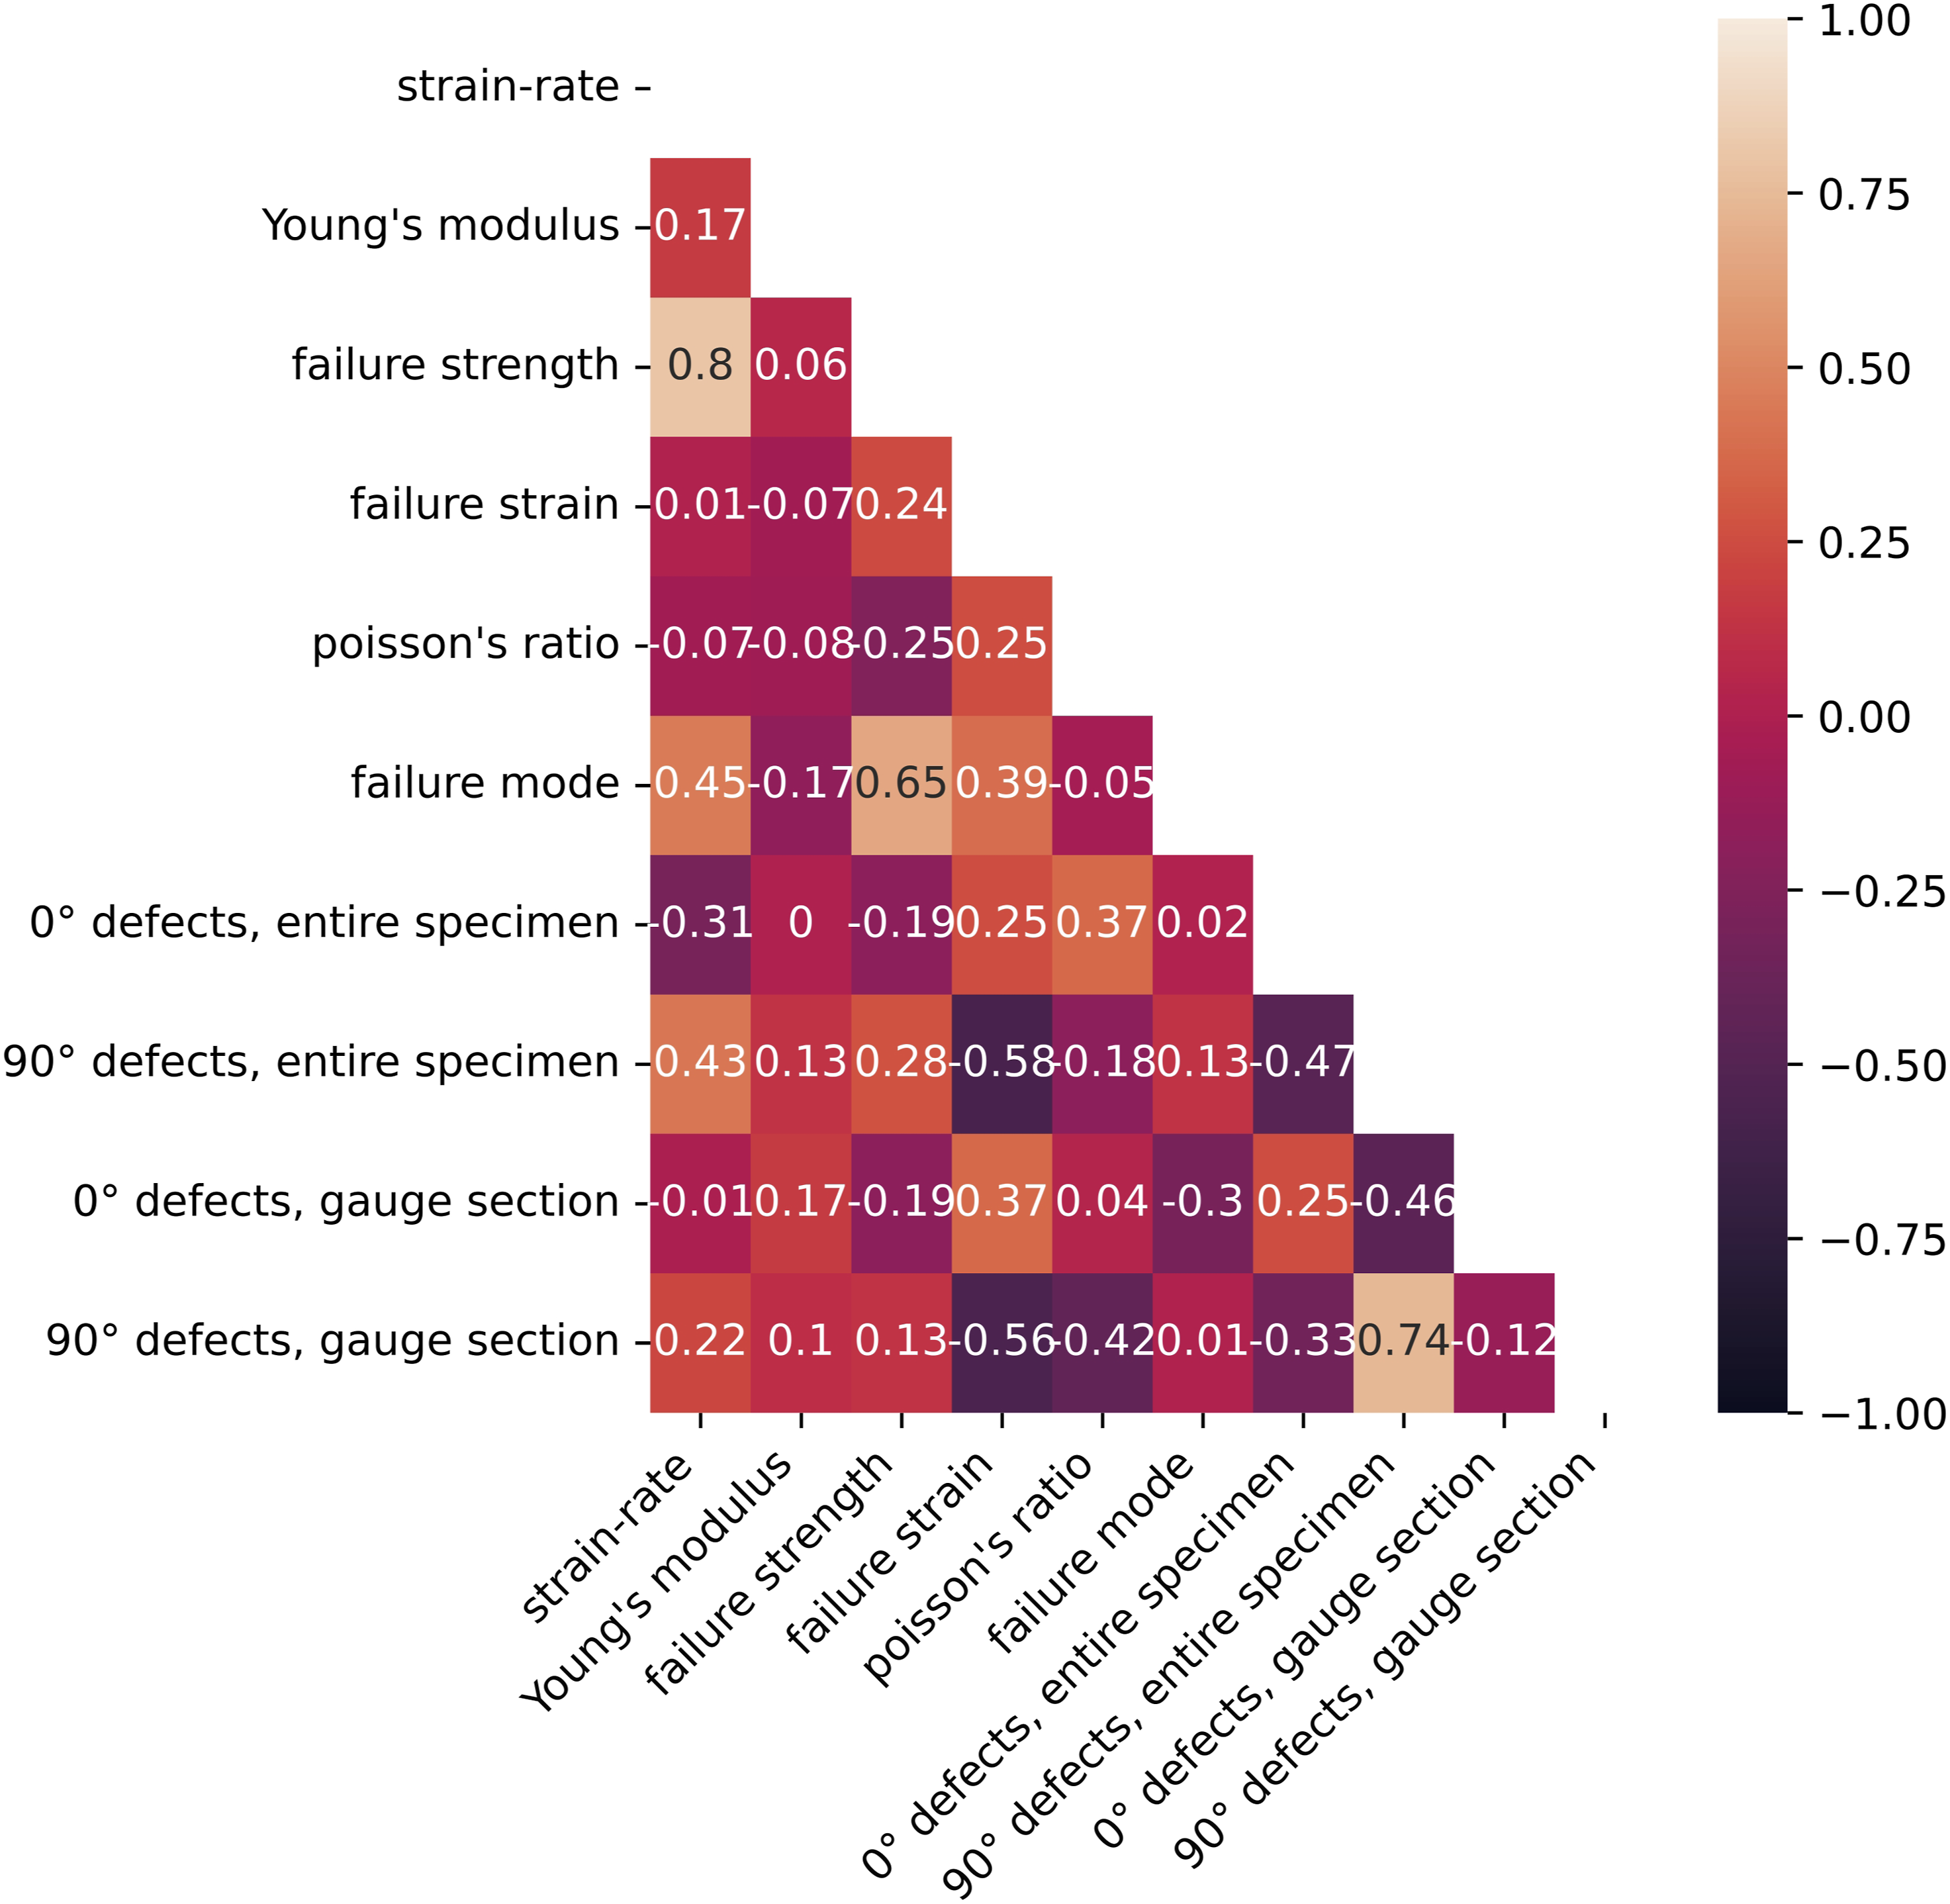
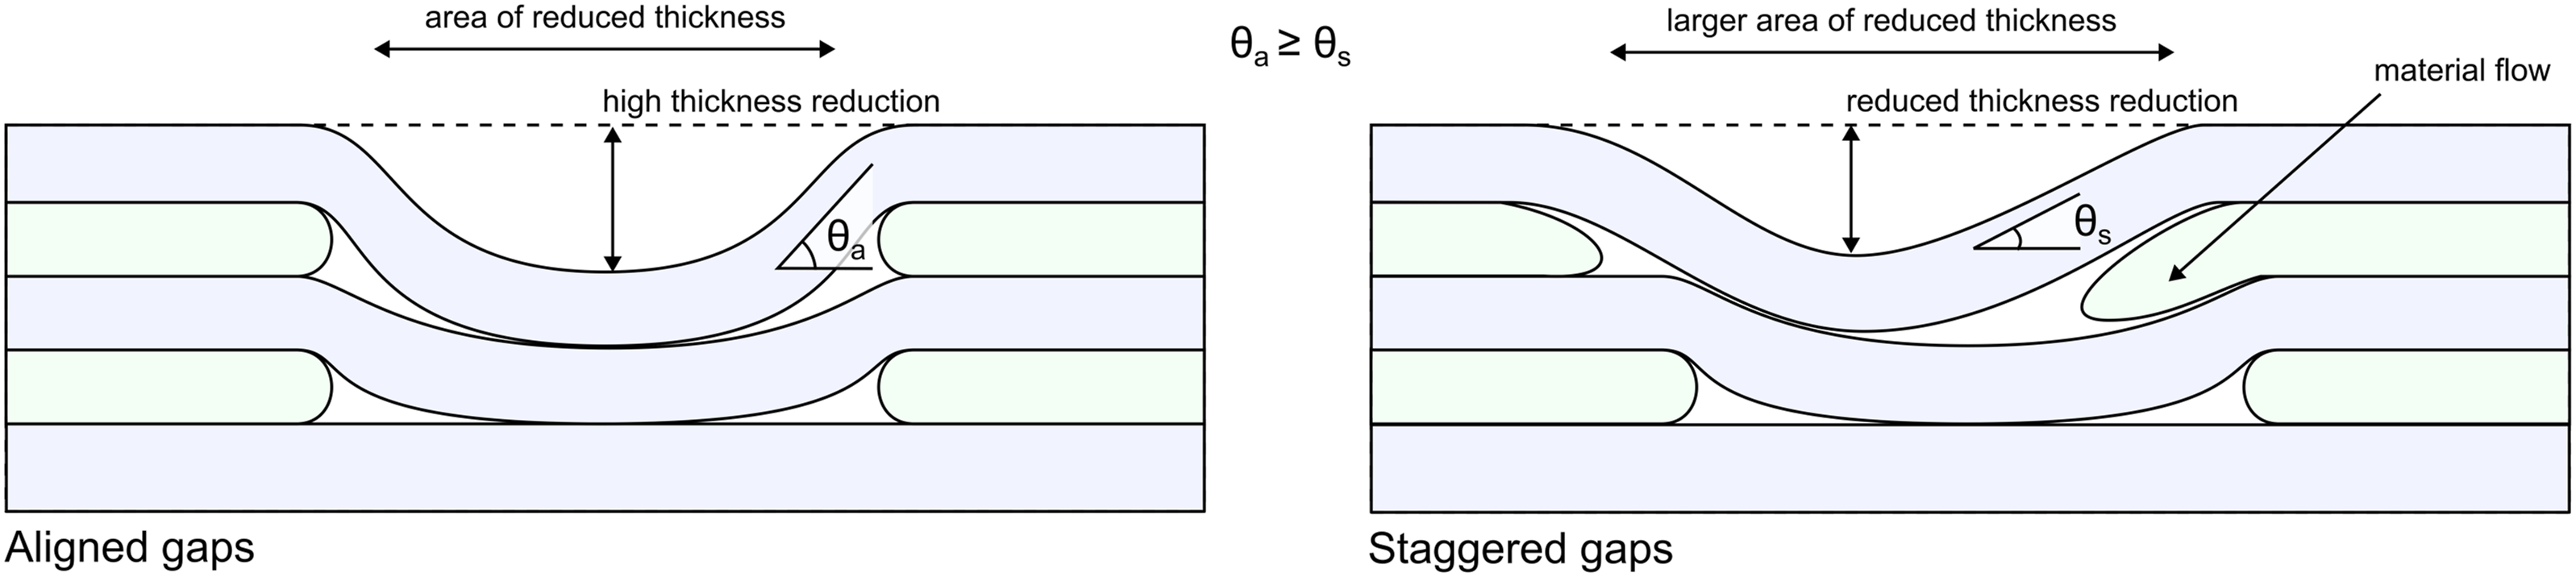
Figure 14 illustrates the particular relationship between the compressive strength and the gap contents in the specimens. The dotted lines indicate a perfect negative correlation ( The relationship between compressive strength at strain rates up to 200 s−1 and gap contents in test specimens: (a) 0° longitudinal gap contents in an entire specimen; (b) 90° transverse gap contents in an entire specimen; (c) 0° longitudinal gap contents in a gauge section; (d) 90° transverse gap in a gauge section. (*0° = parallel to the loading direction and 90° = perpendicular to the loading direction). Schematic of aligned and staggered gaps.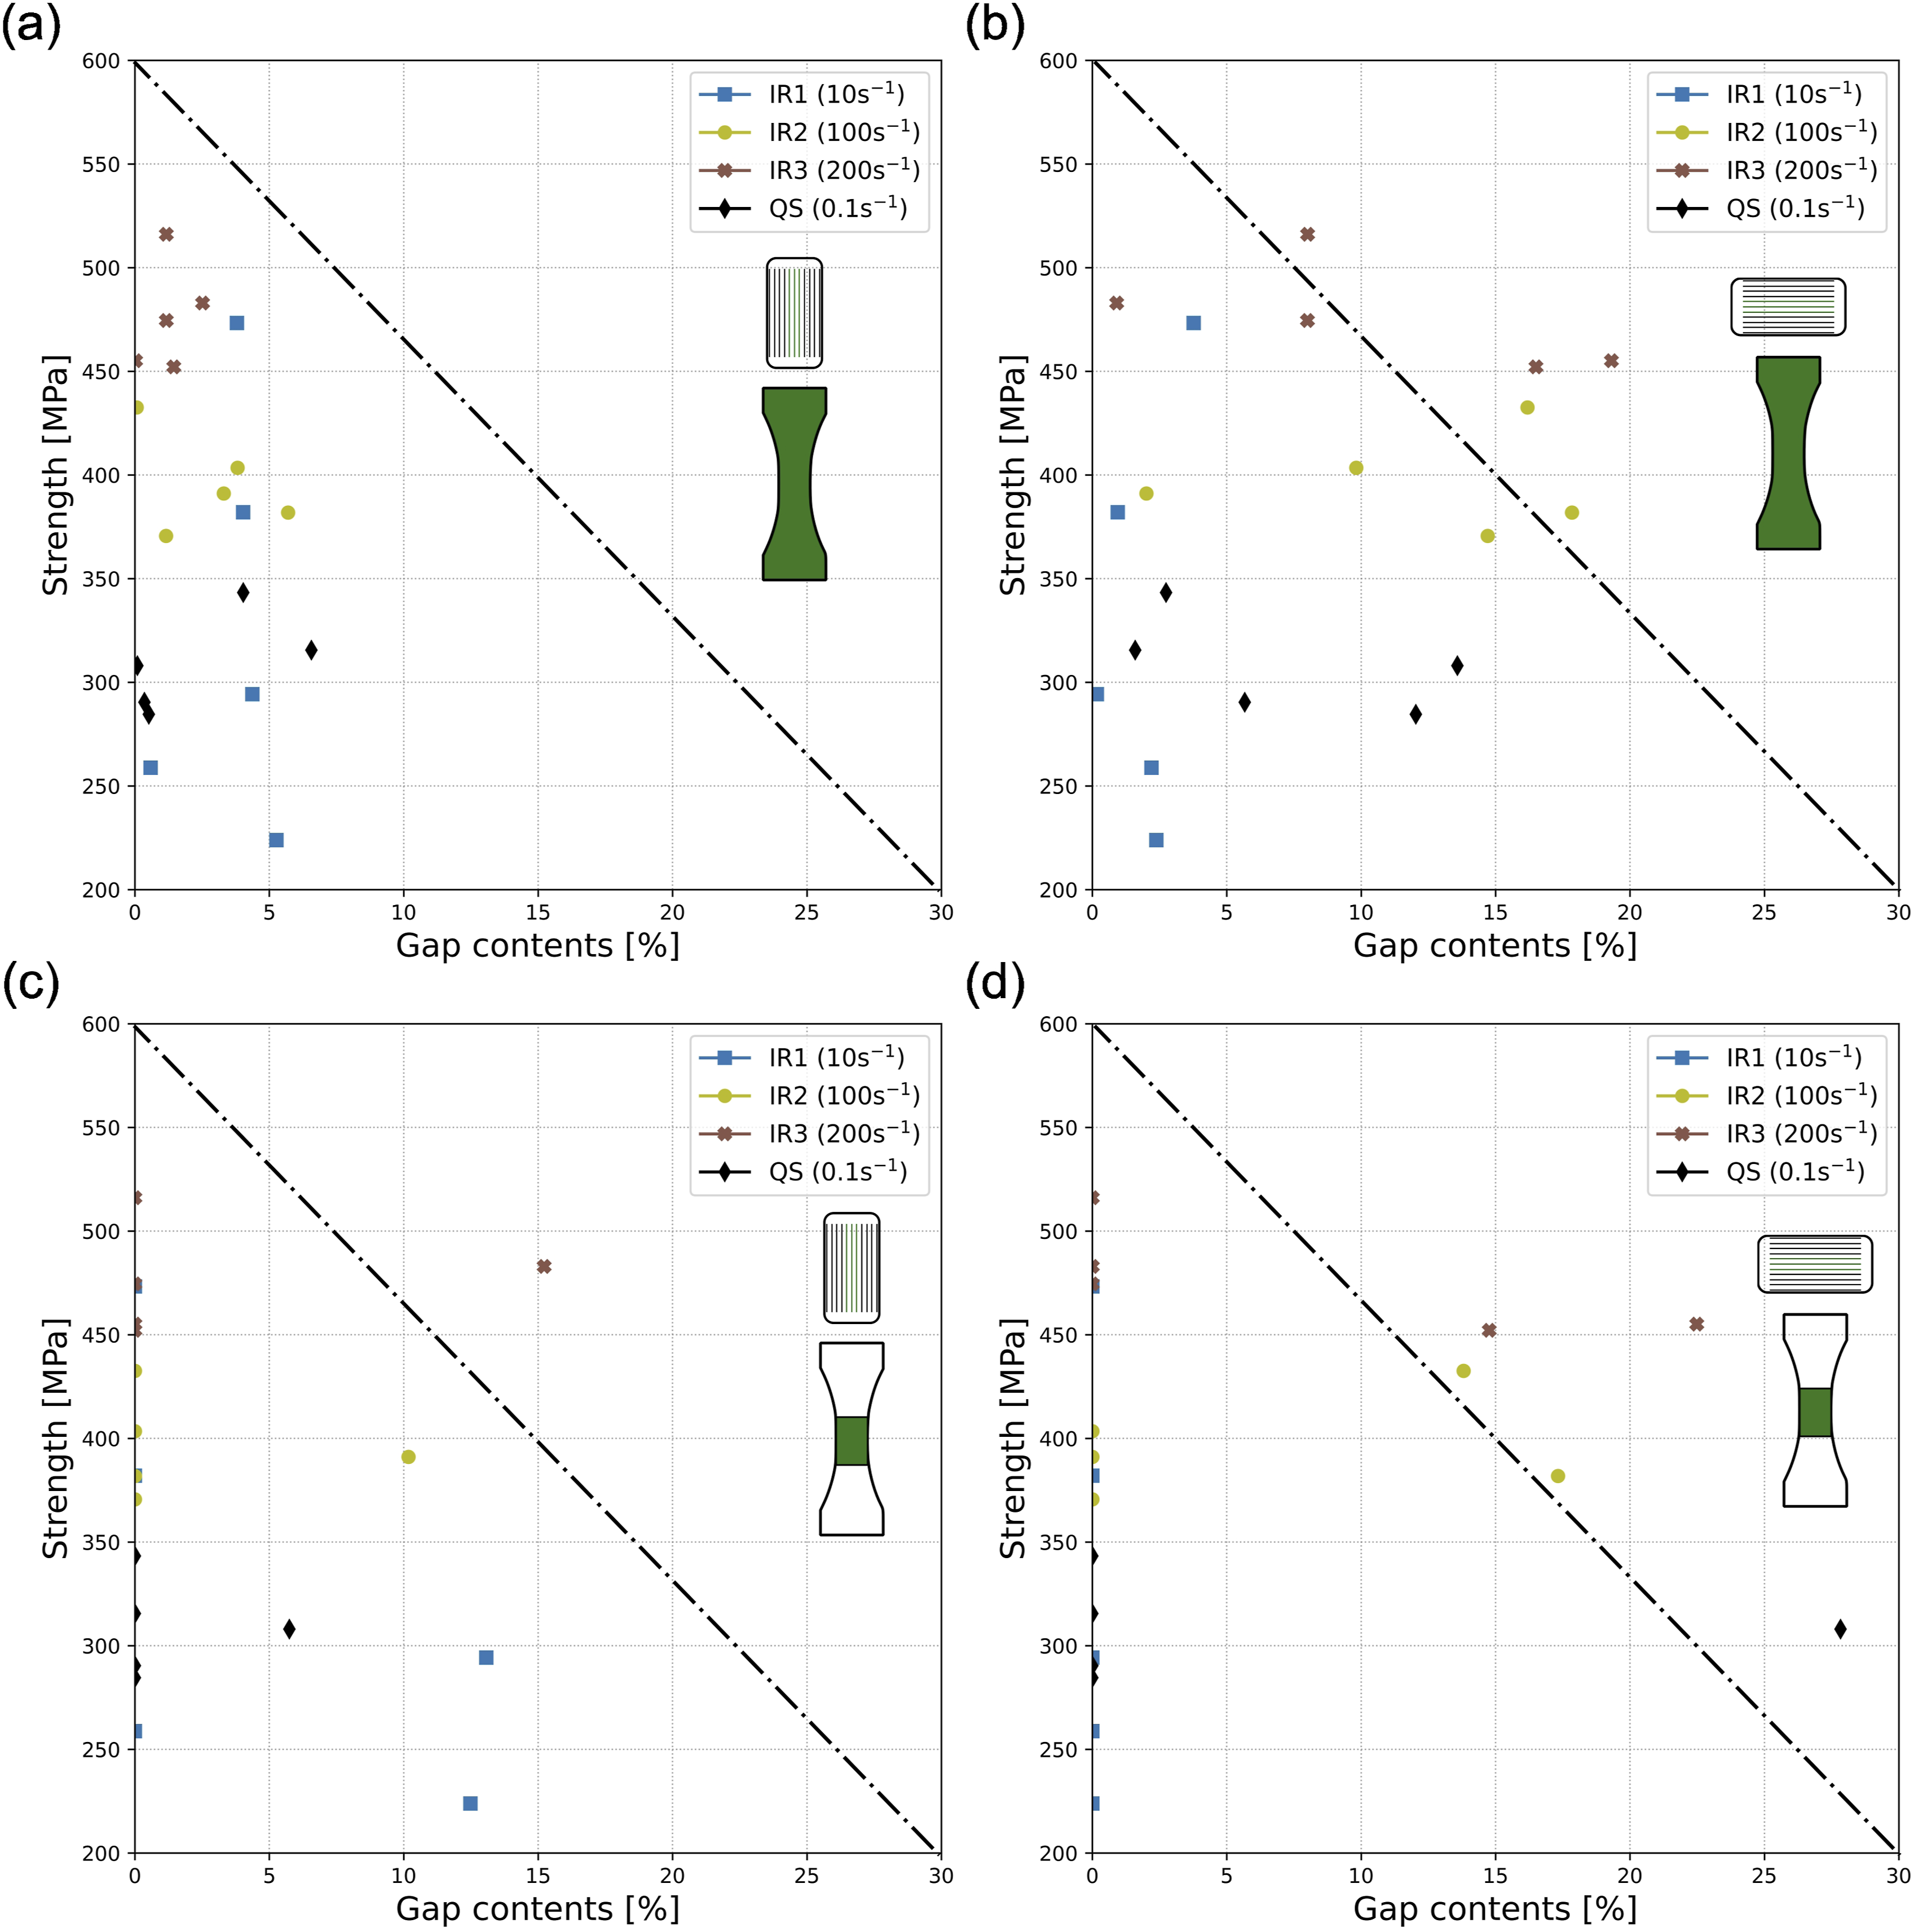
Furthermore, as thermoplastic matrices, unlike thermosets, undergo significant viscous flow during consolidation, the molten polymer effectively infiltrate small gaps and voids as shown in microscopic images in Figures 5 and 6. The gaps are filled with thermoplastic matrix, which creates a continuous load path compared to thermoset where voids are remaining. Meanwhile, the change of local thickness can act as stress concentration and initiation point for failure or instability, which is demonstrated in high-speed imaging.
In this current study, the Pearson correlation coefficient has been calculated and presented in a heatmap. This coefficient illustrates the correlation between the experimental data and the defects, highlighting the impact of manufacturing. However, a limitation of this interpretation resides in the fact that the Pearson coefficient only indicates relationships between two variables without accounting for interrelated correlations with other variables. Nevertheless, it provides valuable insights into the importance of each parameter, which can be utilised to improve production techniques. A potential cross-relation between several variables will be investigated in further work.
Conclusion and outlook
This paper reported the detailed experimental study of dynamic compression testing at intermediate strain rates and discussed the impact of AFP process induced defects, particularly the gap defects. The experiments were carried out using an end-loading compression fixture with honeycomb as a lateral support. The fixture allowed a simple but efficient test method for dynamic compression testing. The test results showed that specimens failed in the gauge sections and the compression tests were validated using the ASTM acceptance criterion of percent bending. Furthermore, an increase of the compressive strength of CF/LM-PAEK composites up to approximately 56% has been observed within the range of tested strain rates from 0.1 s−1 to 200 s−1.
The combined investigation with C-scan images found that the location of the gaps in the test specimens closely coincide with the points of failure. However, no clear correlation could be asserted between the average number of gap defects introduced in this study and the resulting compressive strength. To accurately assess the influence of gap locations, further investigations will be needed to determine precise locations and severity of the gaps utilising Computer Tomography (CT) imaging or pre-test microscopy inspection prior to testing.
Footnotes
Author contribution
Declaration of conflicting interests
The author(s) declared no potential conflicts of interest with respect to the research, authorship, and/or publication of this article.
Funding
The author(s) received no financial support for the research, authorship, and/or publication of this article.
Data Availability Statement
Data sharing not applicable to this article as no datasets were generated or analyzed during the current study.