
Abstract
This work presents an alternative to studying and determining the torsion modulus, G, in composites. For this purpose, a measuring system used a rotational motion sensor coupled to a torsion pendulum. The determination of the angular position as a function of time and an equation derived from studies of mechanical spectroscopy, allowed to determine the value of G, so experiments focused on samples of different quantities of hollow glass microspheres (HGMs) in unsaturated polyester resins. The G results show that the addition of HGMs (16.67 %W) reduces the value of torsion modulus by 31% when compared to the unsaturated resin (100 %W). On the other hand, considering the same two samples, there is a material density reduction of approximately 43% with the addition of HGMs, which makes these materials lighter, and of great practical interest. The relationship between G and material density shows that it is possible to change the amount of HGMs for optimal torsion resistance. The advantage of this technique, compared to other dynamic methods, is that it is not necessary to know the Poisson’s ratio of the material.
Introduction
Today, material science researchers need to choose the most appropriate material for each purpose. Within a wide variety that already exists or produced on a day to day basis, the tendency is to develop them with increasingly specific goals. In the case of composites, they can meet these new requirements.1,2 This type of material has shown astonishing growth, conquering a wide market range, used in various applications, in aerospace,3,4 automotive,5,6 naval, 7 civil,8,9 electrical, 10 and biomedical. 11 In order to predict the behavior of materials when subjected to stresses or loads, it is necessary to know their characteristics, such as rigidity. The elastic modulus is a measure of the rigidity of the material. It represents an essential property in materials that could potentially use as a possible choice for implants11–15 or in structures subjected to torsion or traction (compression).1,2,8,16,17 The elastic modulus, reporting to metals and their alloys depends on the atomic bonds and the distances between the atoms in the crystalline lattice. Therefore, it is sensitive to the addition of elements, thermo-mechanical treatments, and deformation processing. In case of composites, materials that have amorphous and crystalline parts and can form with different additives, it should not be simple to establish a general pattern of the influence of these same factors that take into account metals and their impact on the elastic modulus. For this reason, this work proposes to study the influence of fillers such as hollow glass microspheres (HGMs) on unsaturated polyester resins. The goal is to establish a relationship between G and the quantity of HGMs, to obtain the lack of data or information about the rigidity of this material and its final weight. 18
Inorganic fillers are inert minerals, such as calcium carbonate (CaCO3), which reduce part cost without affecting properties. Some publications19,20 state that, lately, engineers have expressed concern about the increase in density in products due to the inclusion of this type of agent in the resin. These engineers are in search of increasingly lighter products to achieve better performance of those products: faster means of automotive transport, higher load capacities, and reduction in energy consumption. The hollow glass microsphere has a low density, and when it is used as an additive in unsaturated polyester resins, resulting in a lighter material.
Traditionally, the elastic modulus is obtained by static (stress-strain curves) and dynamic (ultrasound or vibration) methods.21–23 This paper reports on the effects of the use of hollow glass microspheres (HGMs) as fillers in unsaturated polyester resin. It uses a specially designed system to determine the torsion modulus (G) that is different from traditional methods. Then, the behavior of the torsion modulus G was possible to study HGMs as fillers in a matrix polymeric by an alternative technique and nondestructive. The advantage of this technique when compared to other dynamic methods is that it is not necessary to know the Poisson’s ratio of the sample.
Materials and methods
Materials
Ashland manufactured the resin that was used for the manufacture of the specimens and which was classified as the unsaturated polyester resin under trade reference Arazyn 13.0. 3M from Brazil made the hollow glass microspheres under trade reference Glass Bubbles S-22. The raw material used for its construction is Sodium Calcium Borosilicate, with density 0.22 g/cm3 and an average diameter of 65 μm. For a better fit for the torsion test equipment, the specimens were made in the form of round bars with a diameter of 5.0 mm and a length of 130 mm.
The device for making the samples constructed from a glass fiber reinforced polyester resin mold with an isophthalic gel coat surface to provide a smooth surface on the samples and to ensure the dimensional standardization of the specimens. This mold has dimensions 120 mm × 220 mm x 80 mm and has a hole diameter of 5.0 mm. It has guides for opening in two parts for the removal of the specimens, as shown in Figure 1. (a) - Matrix for making the samples and photos of a specimen. (b) - Samples: CP-00 reference with 100 %W resin. CP-01 to CP-10 addition of hollow glass microspheres, ranging from 2 to 2 parts by weight for every 100 parts of the resin.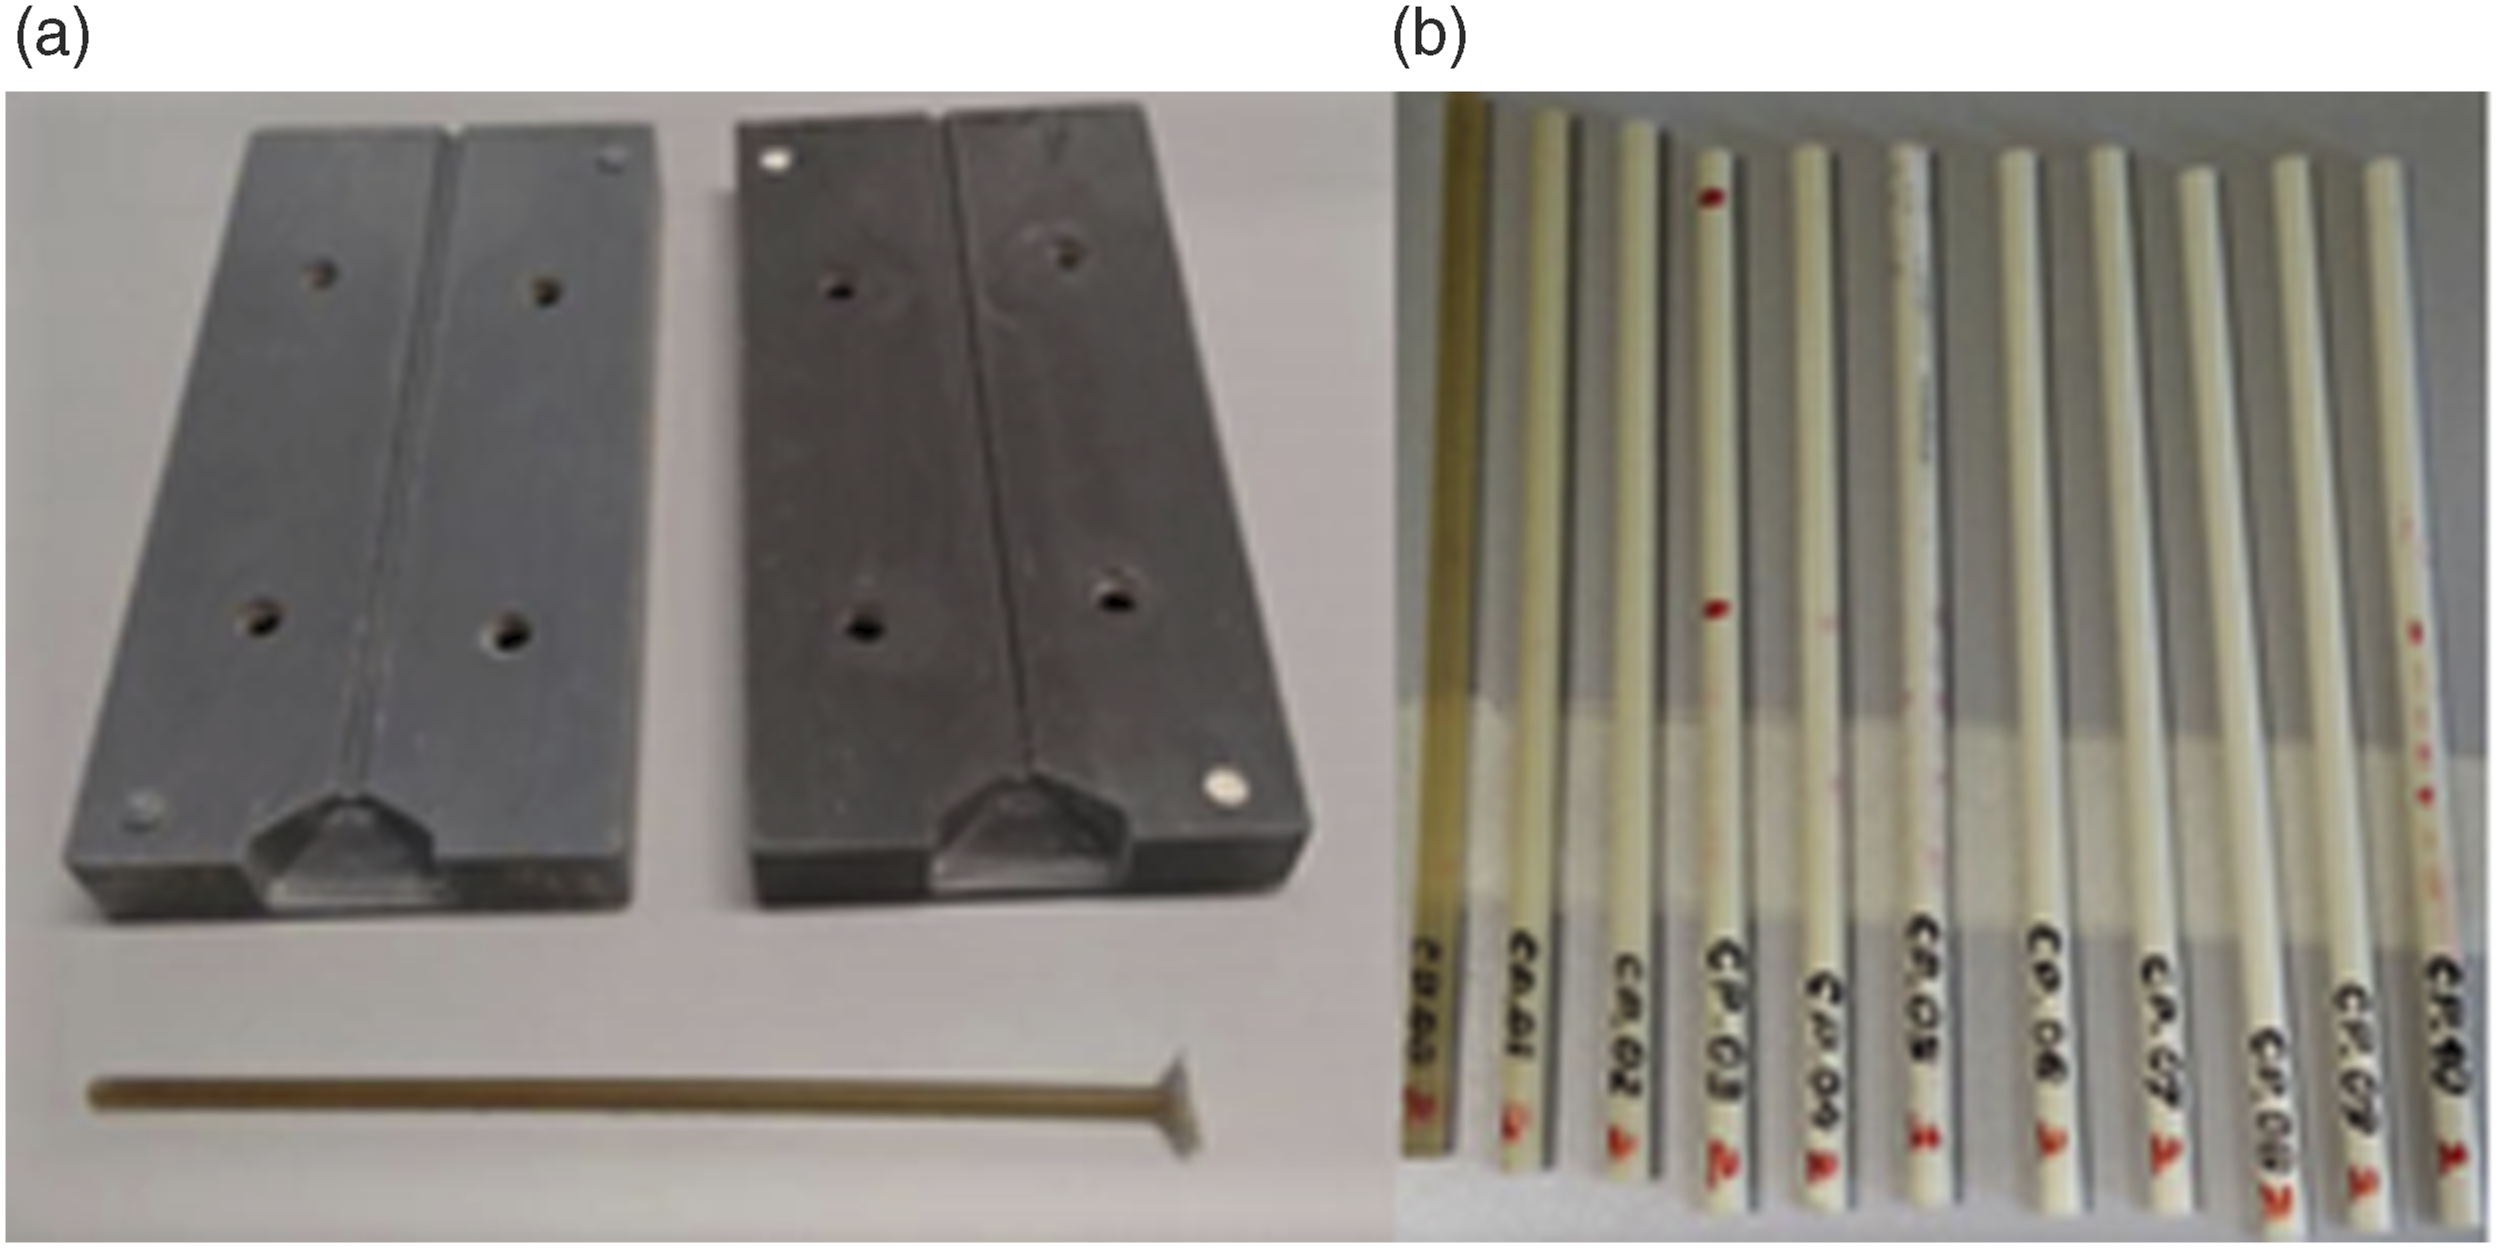
Characteristics of the body-of-proof.
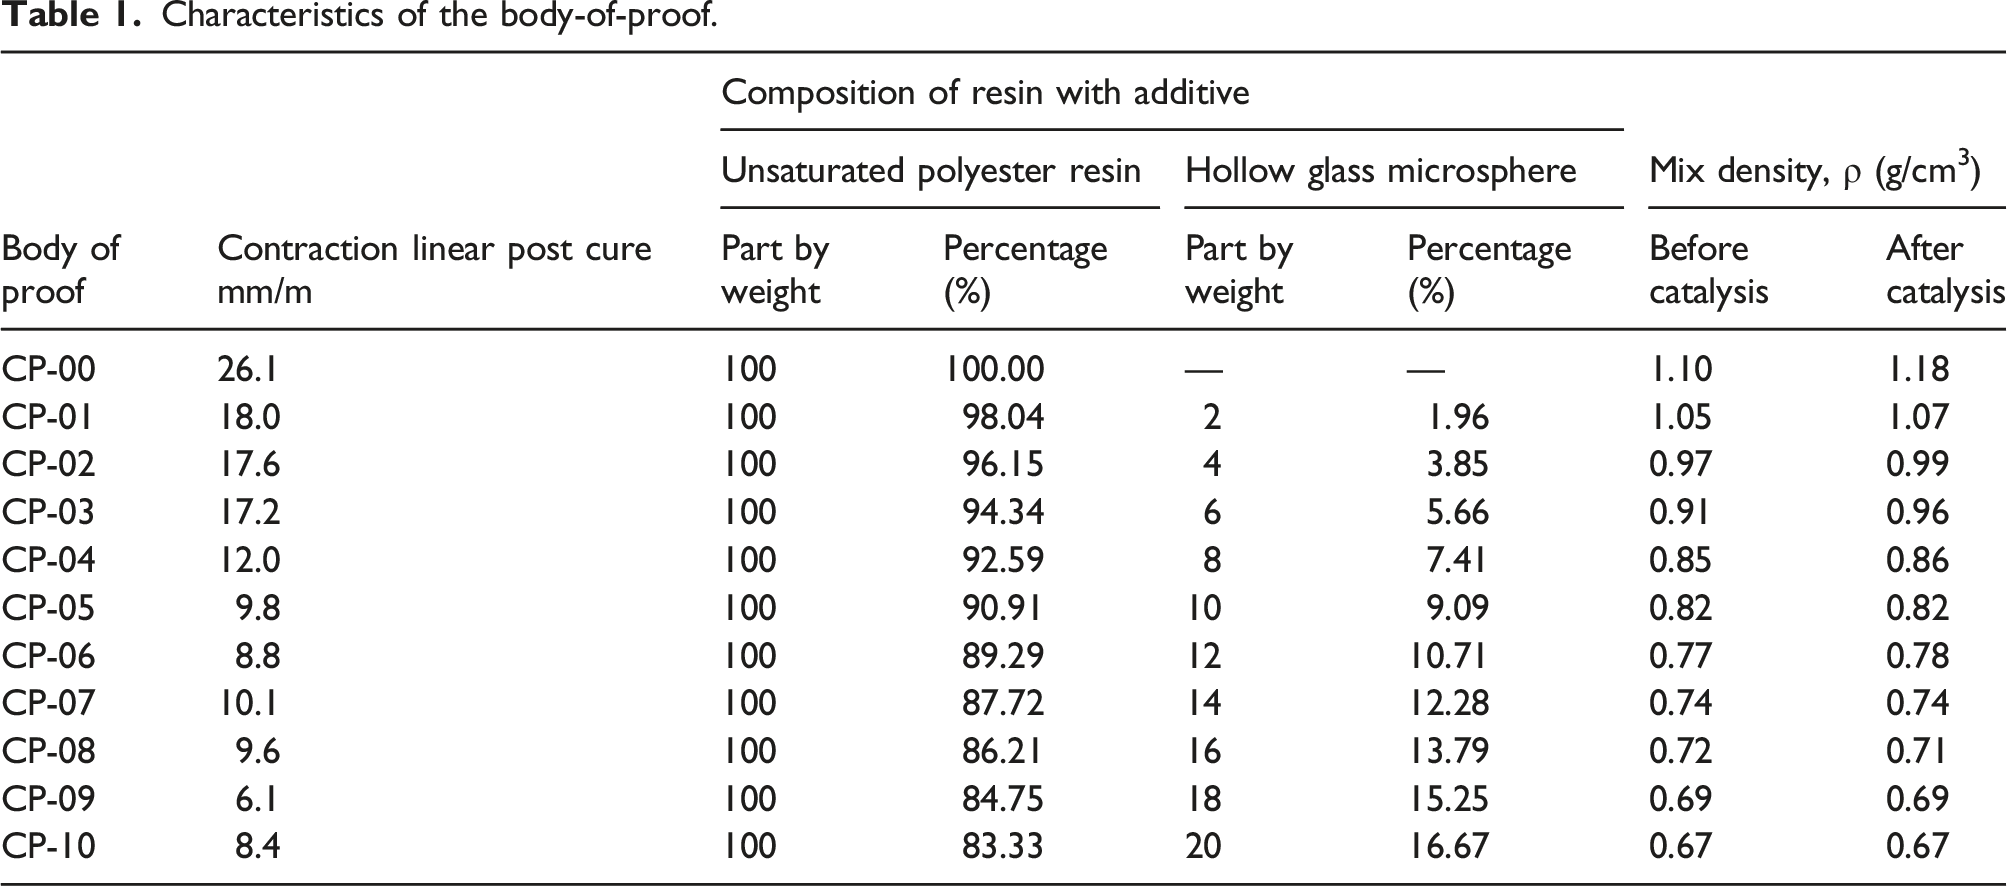
After the timely preparation of the specimens, the test was performed to verify the linear contraction of the mixture after its catalysis. An equilateral triangular sheet steel container was constructed with one face open and upwards to form a rail with the face dimensions at 50-mm wide and 1000-mm long. Triangular shape adopted is due to proportionality in the geometry of the sample section, regardless of the volume of the mixture collected for catalysis. By pouring 400 mL of each mixture into this leveled metal trough, it was possible to verify the linear contraction after its catalysis. With the aid of a caliper, the dimensional difference due to the contraction was verified.
For each specimen, the linear shrinkage test was performed, resulting from the catalysis of the mixture, and the density of the mixtures in the post-cure condition was surveyed. Using the same equipment mentioned above and based on the Archimedes principle, the volume of distilled water corresponding to the volume of each specimen was measured. It was adopted to measure the water mass corresponding to the volume of each specimen, to obtain greater precision in the determination of water volume, and to divide by the density of distilled water in the test environment. The environmental condition in the laboratory was 25°C, with a relative humidity of 60%. The water density was 0.9970479 g/cm3. Dividing the body of water by its density gave the volume of each specimen. Then, the mass of each specimen was obtained and divided by its corresponding volume, thus determining the density after catalysis.
Table 1 shows linear shrinkage values for each meter of the catalyzed mixture and the densities of the mixture both before and after catalysis, that is, in the post-cure state.
Methods
Method for measurement torsion modulus, G
The mechanical spectroscopy technique to determine the value of G has been studied in our laboratories and can be used to investigate changes in the mechanical properties of materials. We have used it for determining G, as is described succinctly here. To register angular position (θ) as a function of time (t), in relation to an axis of rotation, a rotational movement sensor (RMS) has been used; see Figure 2. Measurement system: (a) complete view of the system without electromagnets; (b) the complete drawing of the artistic design of the system in 3D; (c) electromagnets set up (d) detailed view of the SMR; (e) sample fixation.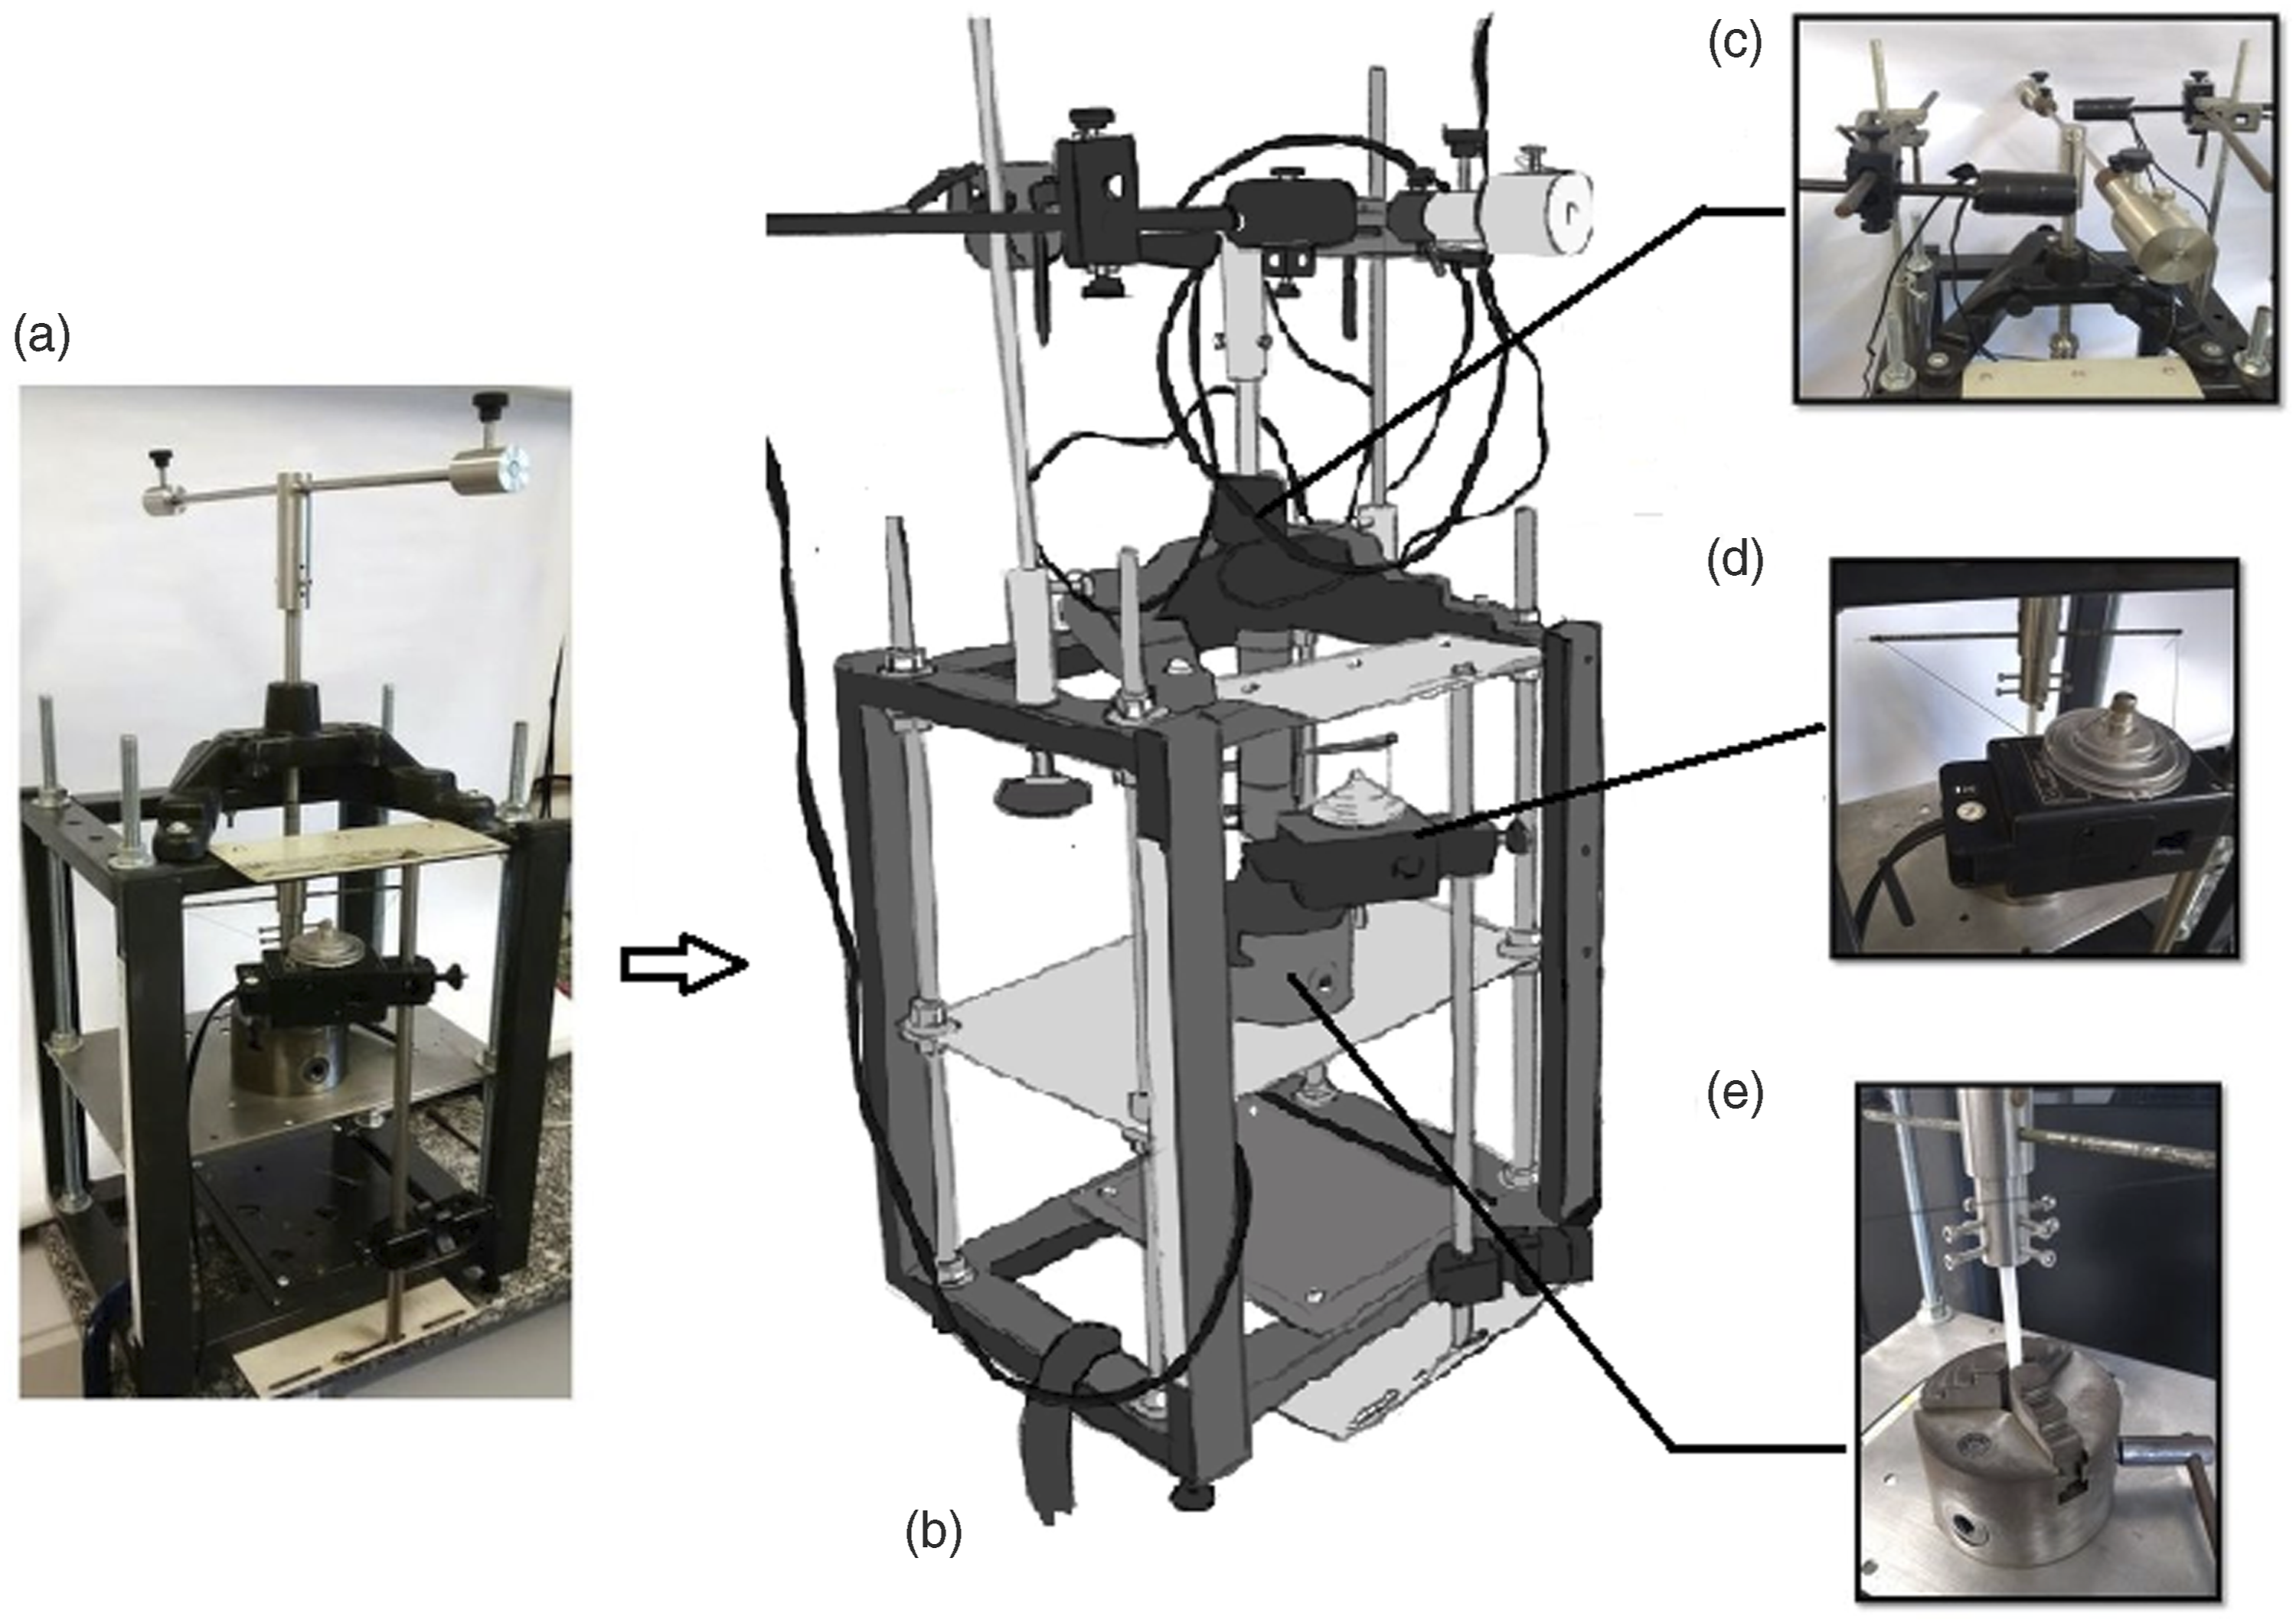
Mechanical spectroscopy,
23
that is, the torsion motion of the pendulum, is described by the following equation:
The symbols I, G0, and i represent the rotational inertia, the torsion constant of the sample fixed to the pendulum, and the imaginary number, respectively. In this case, we assume that air resistance and the friction of the bearings of the rotational motion sensor and rotational system (RS) are negligible because they should not significantly influence movement.
24
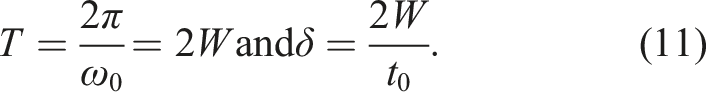
The solution to the above equation takes the form 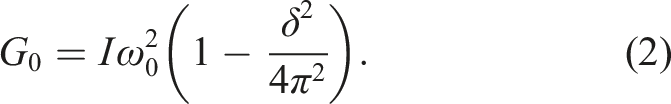
This equation suggests that the moment of inertia of the pendulum I, the angular velocity ω
0
, and the term δ/2π can be used to obtain G
0
. It is possible to alter the masses and their position on the torsion rod of the pendulum, which changes I and thus modifies the value of ω
0
. Then, G
0
can be obtained with the frequency of the oscillation system, and we can get a dynamic measurement. For small angles of oscillation, in which the measuring system has a linear behavior, G
0
can be determined as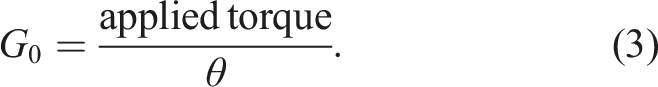
The main objective is to determine the torsion modulus G for a sample of a uniform circular with diameter d section and length L.
Therefore, when considering problems that take into account the resistance of the material,25–27 we can calculate the resistive torque to which the sample is submitted, when the sample undergoes torsion through an applied torque by a pendulum (see Figure 1). The following equation calculates this torque: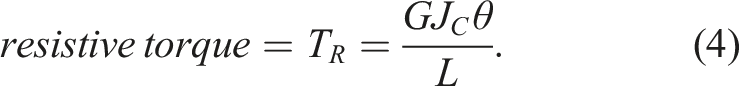
If there is static equilibrium, that is, the applied torque is the same as the resistive torque, equations (3) and (4) can be combined to give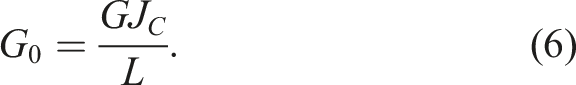
Thus, the magnitude of G obtained by substituting equations (2) into (6), and, as a result: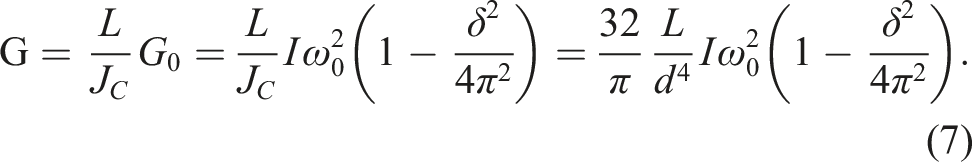
The validation of equation (7) is presented in an article, 28 where we show that G can change with the length (L) and the diameter (d) of the sample, yet the experimental values found for CP-Ti are practically the same as those in the literature.29–31
However, though equation (7) was validated by the authors,
28
now it is applied to another kind of material, which is a different situation than that of a homogeneous material (CP-Ti). So, it is necessary to validate it for this case. If it replaces 
In equation (8), taking the real part gives the following equation:
The rotation sensor used to study the relaxation curve to get a record of angular position as a function of time. The values of the parameters δ and ω 0 are obtained from the experimental θ versus t curve, which is obtained using the rotational motion sensor software and the Pasco interface for given values of L, d, and I.
For this purpose, a fit function similar to equation (9) was devised with Origin 7.0 software, by selecting a “waveform” function such as the following: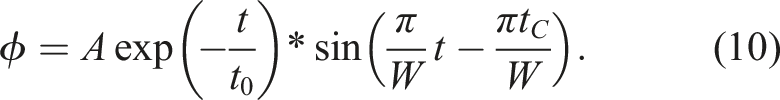
Acquisition method for the moment of inertia (I)
The rotational inertia of the torsion pendulum was determined, independent measurements were realized using a method developed in our research laboratory.24,32 This measurement is necessary to validate the equation designed to calculate G. Several techniques to determine the momentum of inertia of a body found in the literature; however, the one closest to the measurements performed stands out this work. 33 Four values of rotational inertia were fixed to obtain a frequency response.
We determined the inertia moment (I) of the torsion pendulum by removing the sample and the electromagnetic system (see Figure 1). Then, the same procedure was adopted as in references,24,32 where the authors considered the resulting torque (τ) to be responsible for the rotational movement of the measured pendulum system:
Scanning electron microscopy (MEV)
SEM was performed on a Zeiss model EVO LS1. Samples were coated with gold for visualization using the sputtering technique. 33 Measurements were made in a high vacuum (10−3 Pa) with a magnification of 500× of a transversal section of the internal region of the samples bar. The aim was to visualize the hollow glass microspheres (HGMs) incorporated in the samples: CP-00 reference with 100%W in resin. CP-01 to CP-10 of HGMs was added, ranging from 2 to 2 parts by weight for every 100 parts by weight of the resin.
Results and discussion
Initially, the values of I, which the authors previously cited, are presented, 28 since the measurement system, and the four configurations are the same in this work. Then, with the values of G for different concentrations of HGMs, the use of equation (7) is validated for the case of the composite. Finally, using the same results to G, the behavior of the samples as a function of different concentrations of HGMs and the response of their oscillation frequency and values of G, as a function of the moment of inertia are analyzed.
Measurement of the rotational inertia (I) of the torsion pendulum
Experimental result of the rotational inertia of the pendulum.
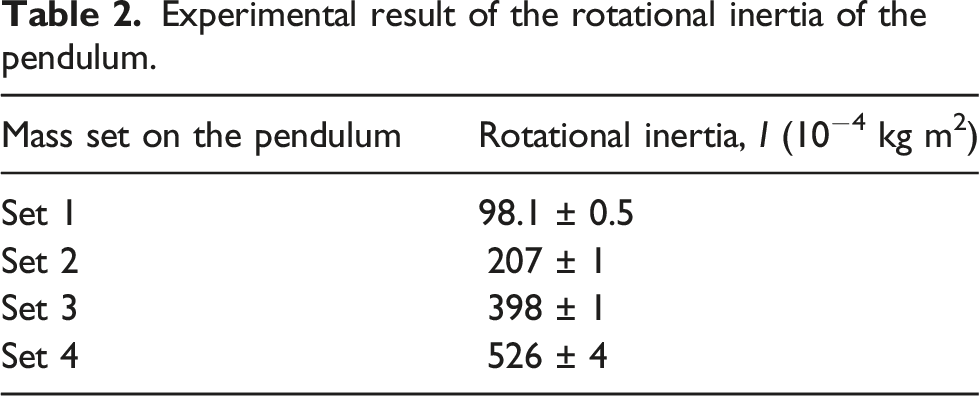
These values were found using a method independent of that used to determine G according to item 2.2.1.
Torsion or shear modulus results
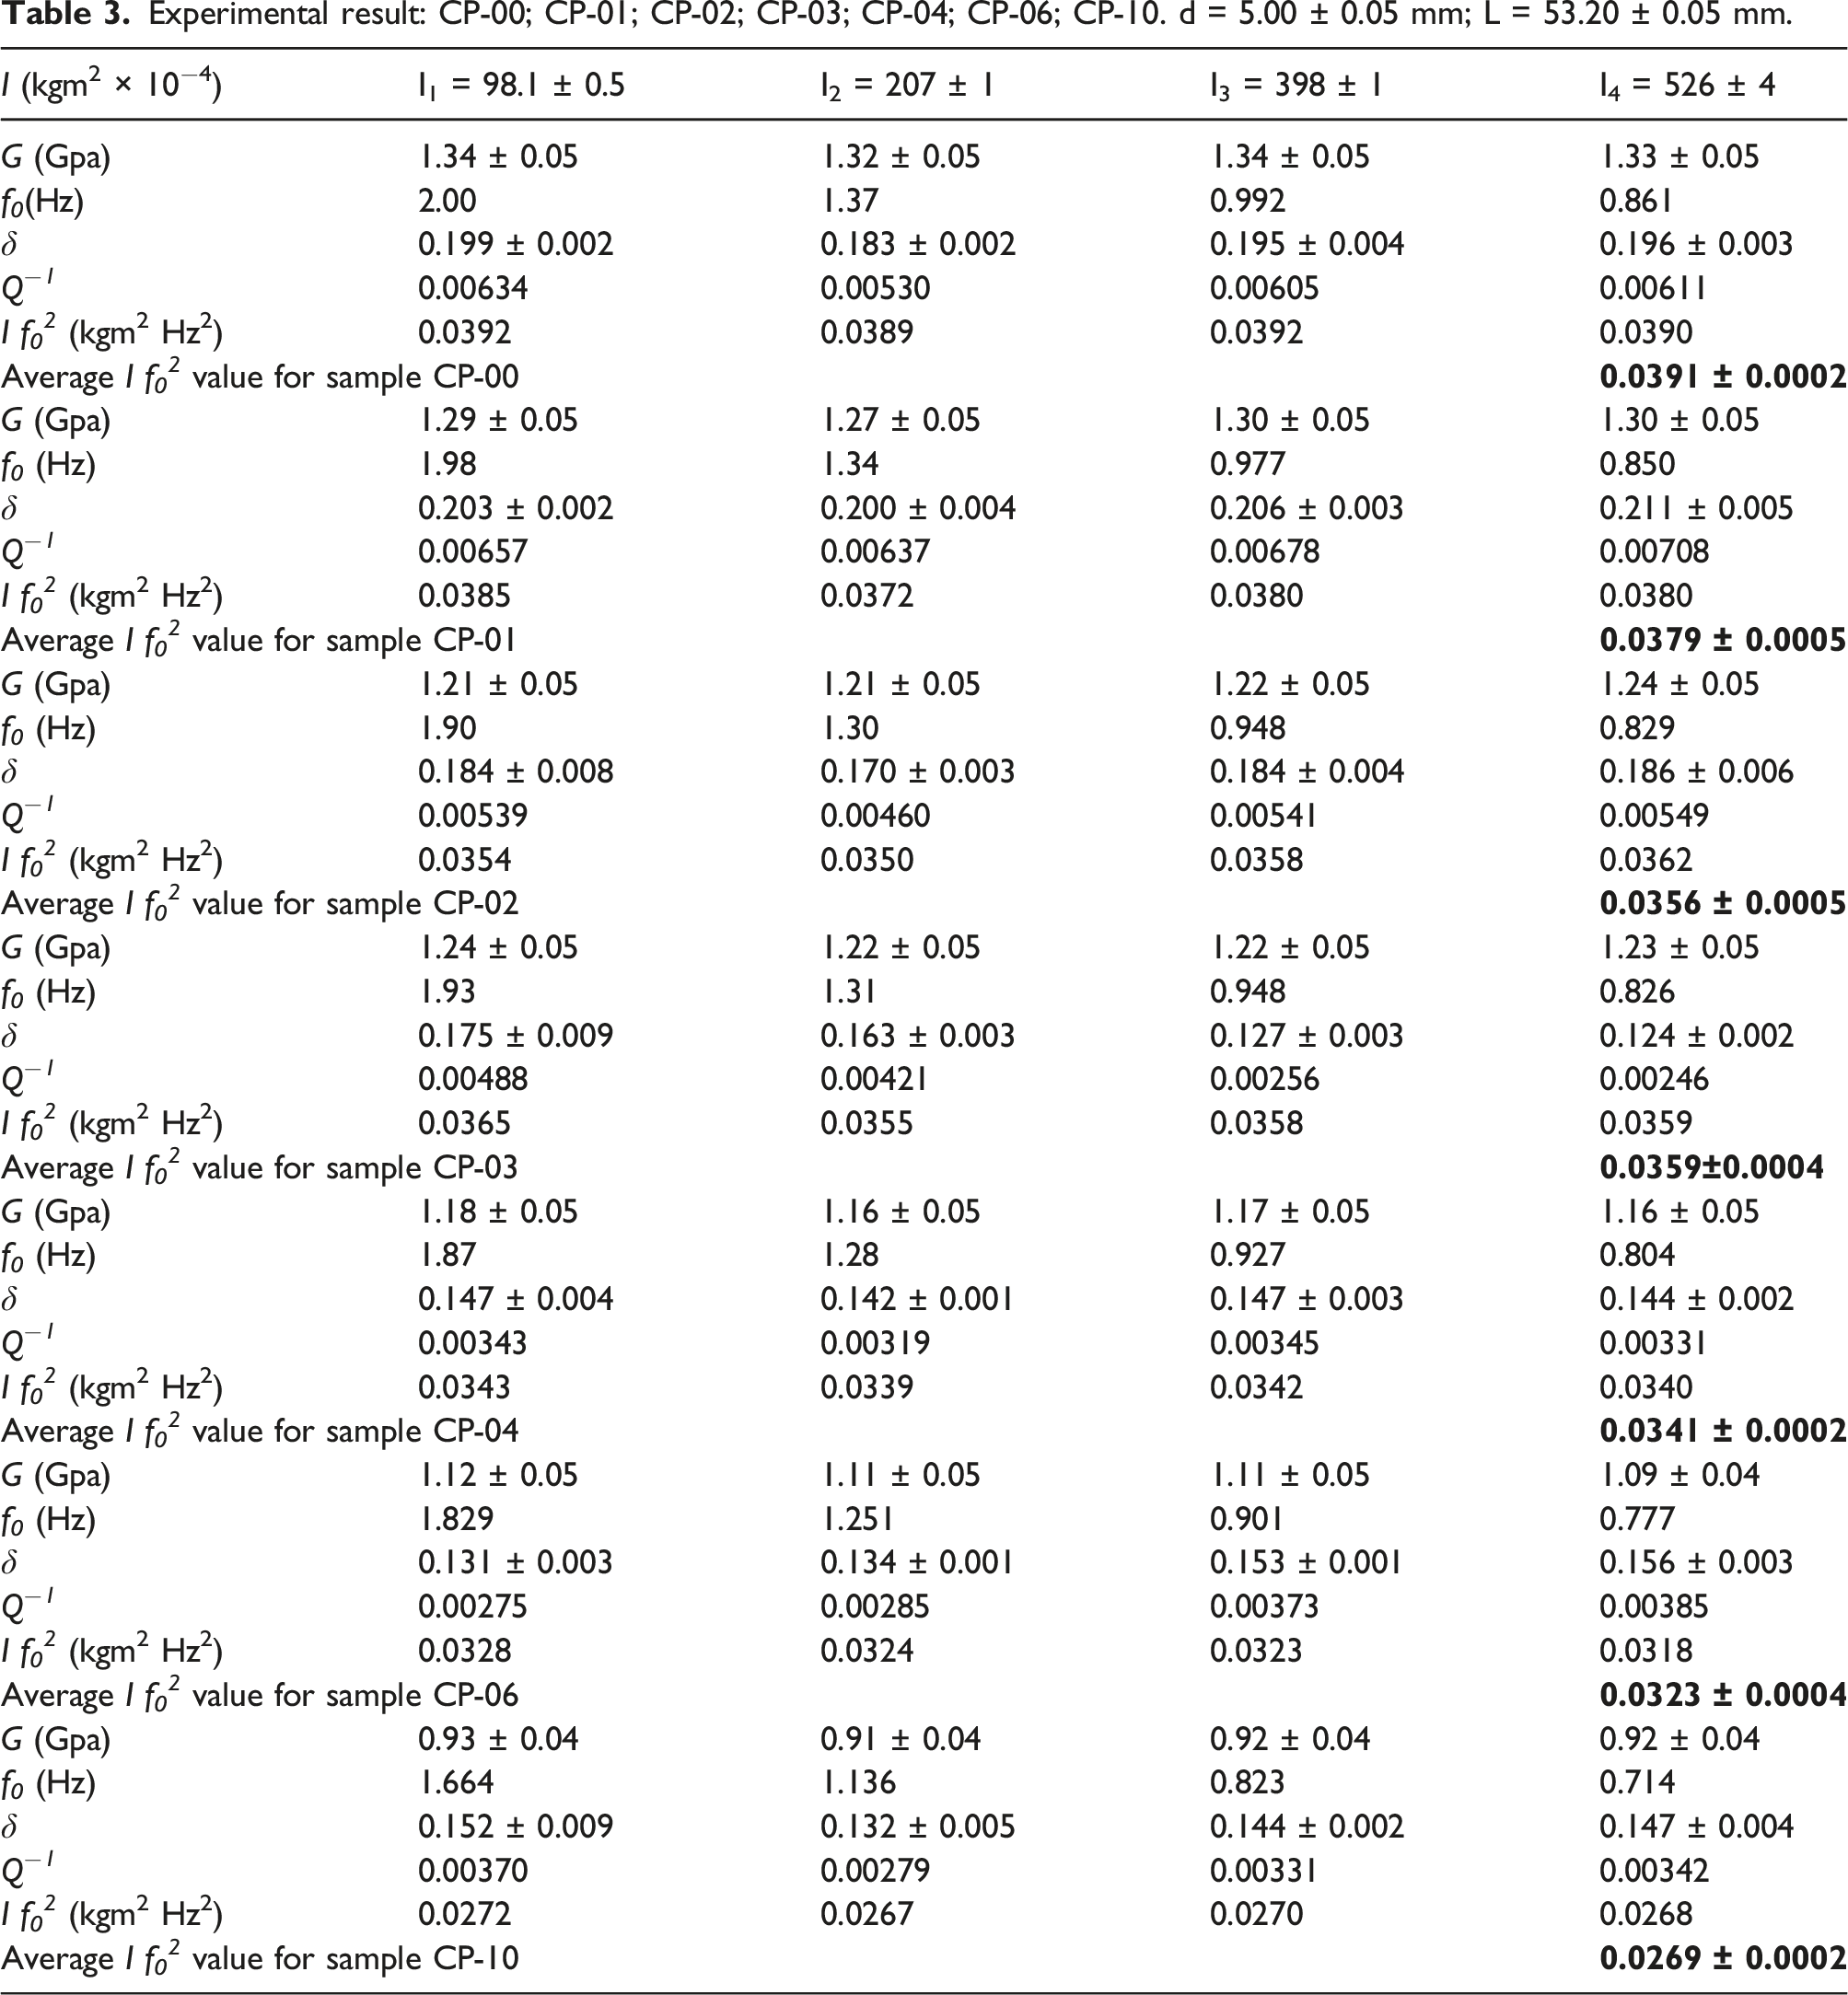
Experimental result: CP-00; CP-01; CP-02; CP-03; CP-04; CP-06; CP-10. d = 5.00 ± 0.05 mm; L = 53.20 ± 0.05 mm.
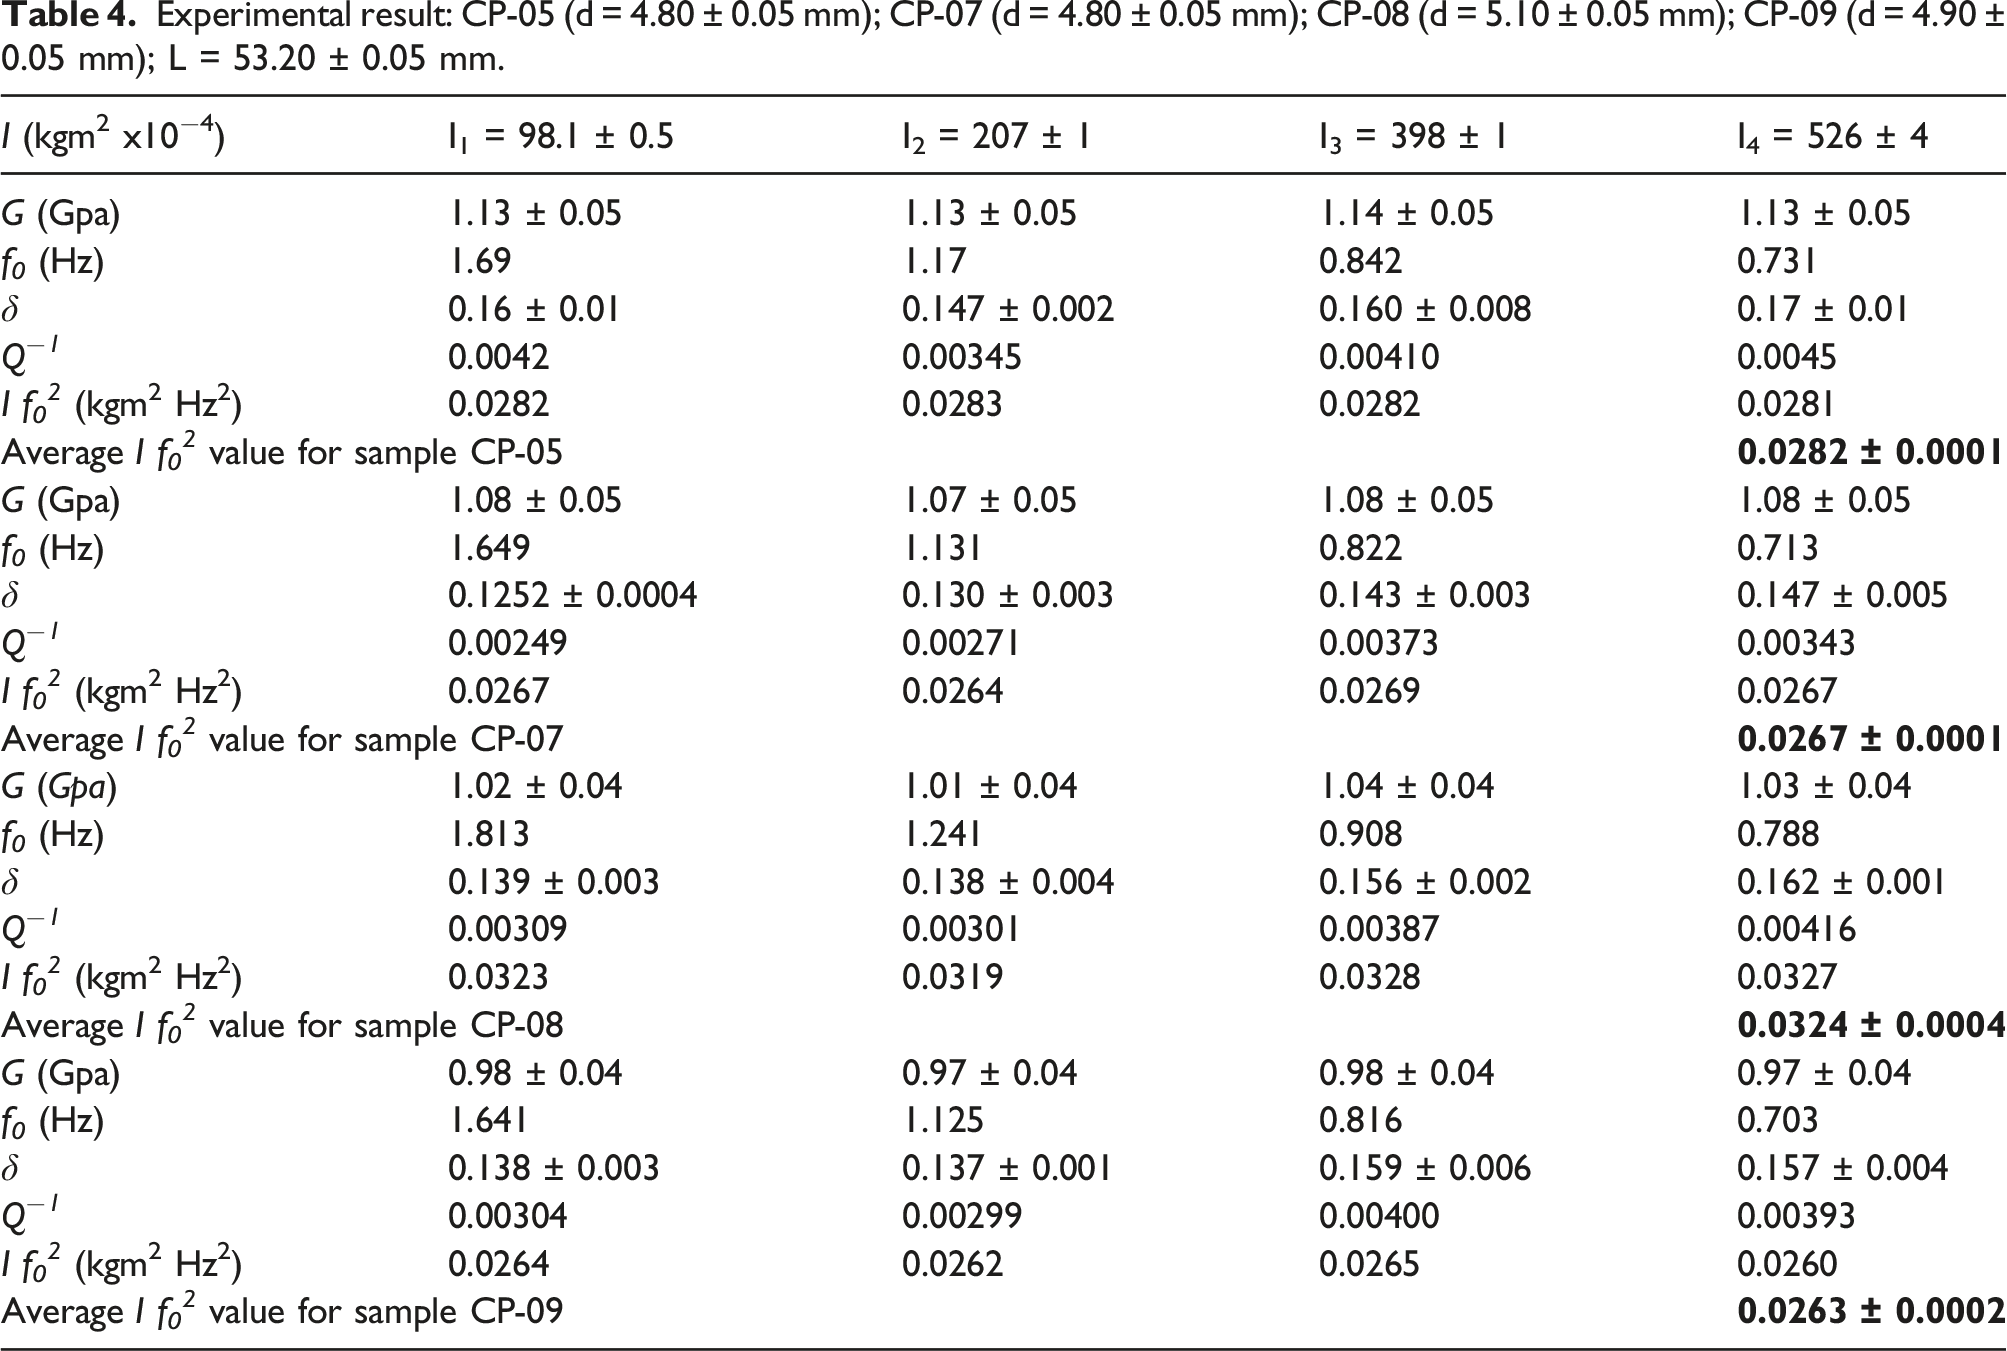
Experimental result: CP-05 (d = 4.80 ± 0.05 mm); CP-07 (d = 4.80 ± 0.05 mm); CP-08 (d = 5.10 ± 0.05 mm); CP-09 (d = 4.90 ± 0.05 mm); L = 53.20 ± 0.05 mm.
Validating the use of equation (7) for composite samples
In this work, G was determined for different concentrations of HGMs in unsaturated resin, and an essential question arose: If the samples used are different from those of metals that were considered homogeneous,
28
is the equation (7) valid to use when the internal structure of each of the specimens changed with the addition of hollow glass microspheres? To answer this question, Figure 3 was constructed, based on the experimental results of Table 3, considering only the diameters of values 5.00 mm. Small variations in diameter, due to a possible linear post-cure shrinkage in sample manufacture (see Table 1), are critical in the calculation of G. Equation (7) shows that this value is inversely proportional to d4.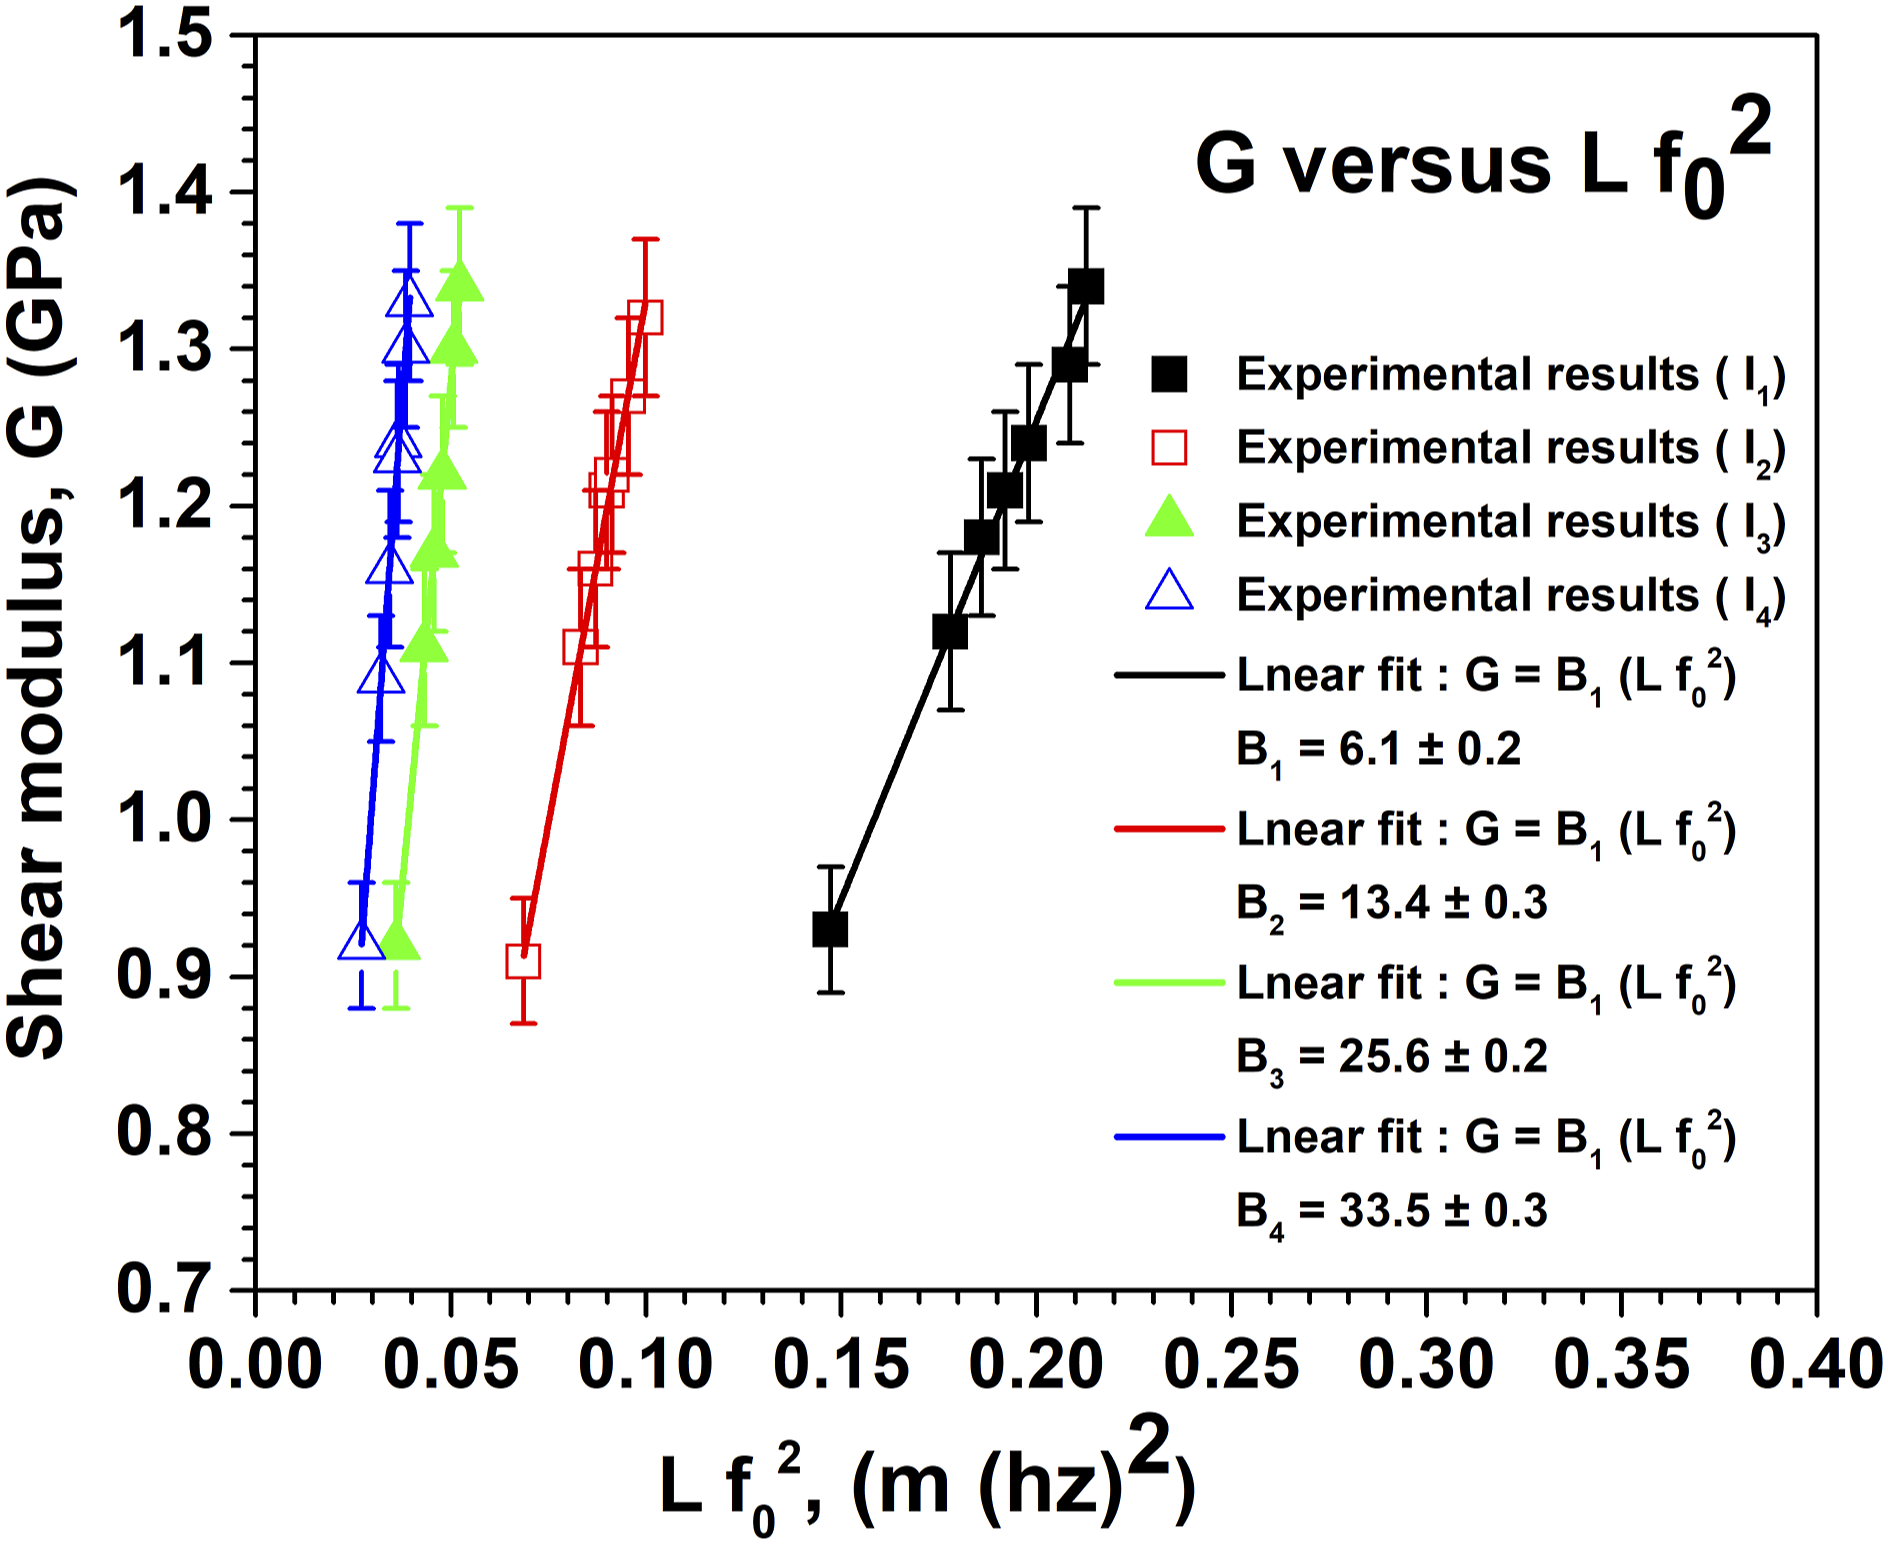
Proportions of experimental values of I and B with the respective percentage deviation between them, with d and L, fixed, varying f 0 through I.
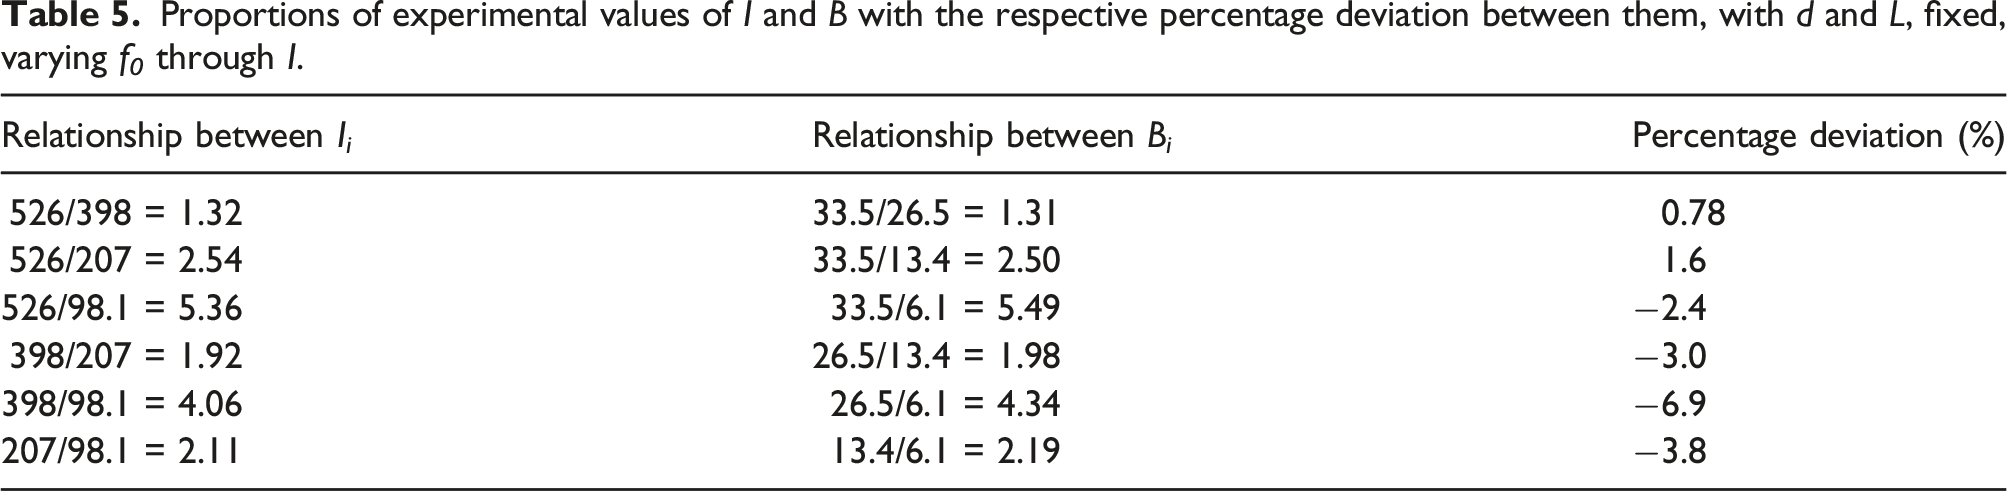
Based on Table 5, we note that the observed deviations are less than 7%. These results reinforce the use of equation (7) to calculate G for composites, and the value does not change the value of G significantly.
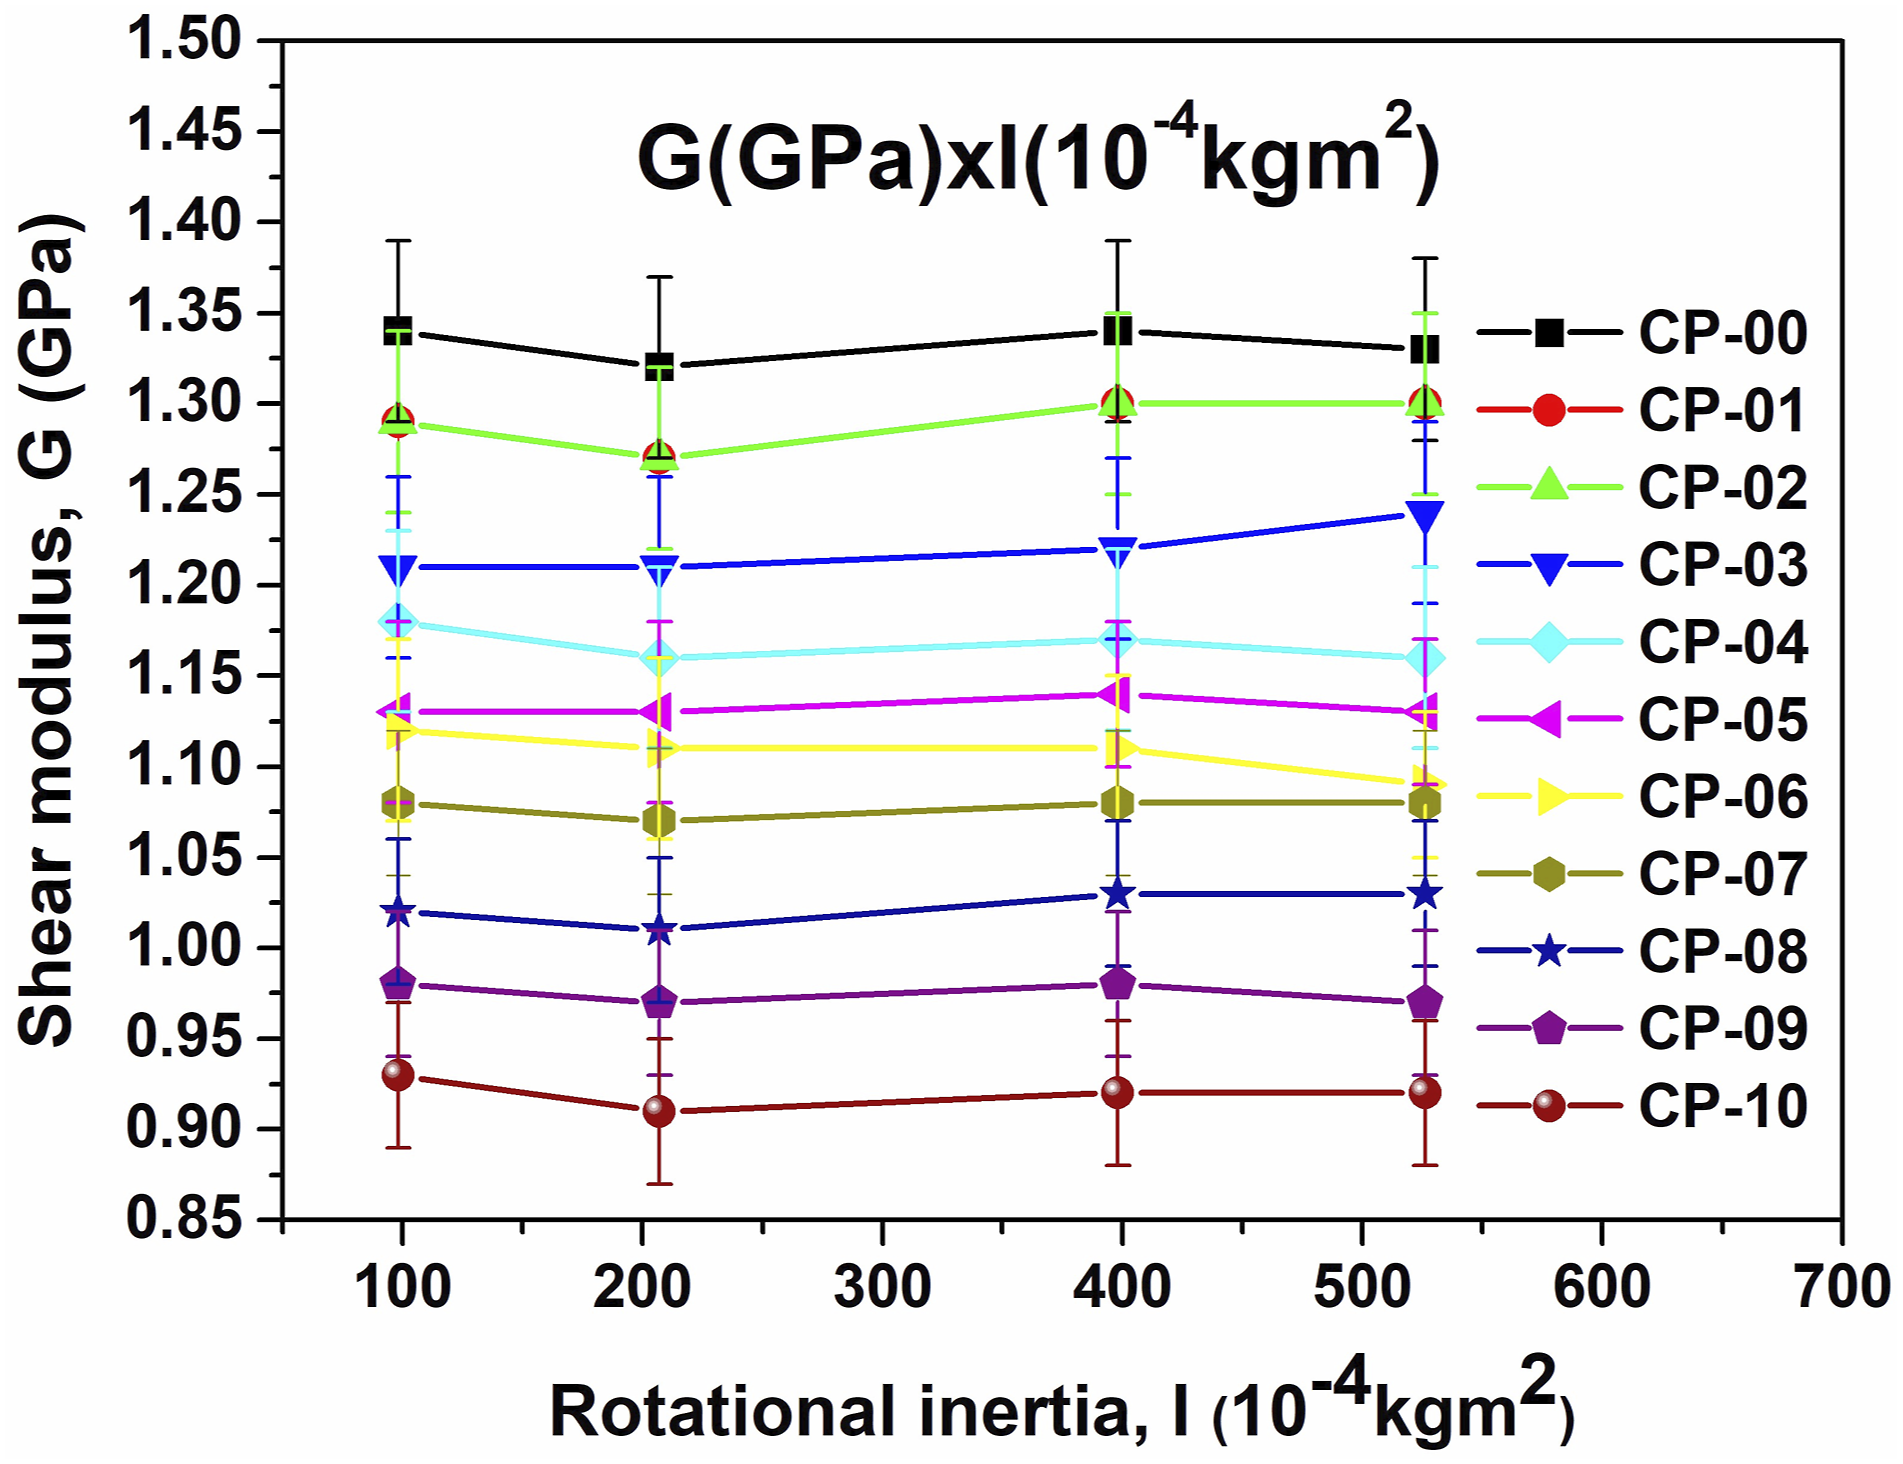
Influence of quantity HGMs on the shear modulus (G) and oscillation frequency (f 0 ) for four inertia values, I
The values of the maximum shear stress or angle-specific deformation,
34
according to,35,36 are: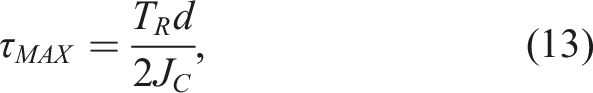
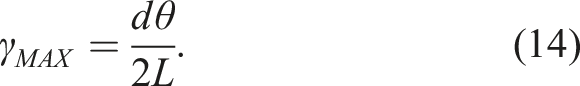
Therefore, the value of G can be expressed as: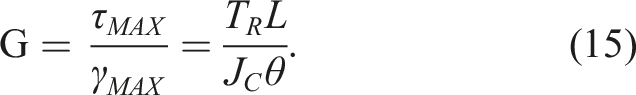
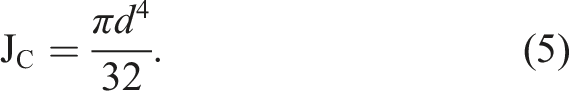
Concerning the value of G for a sample that has the same internal structure, in equation (15) it should be noted that, if we fix L and θ (as we did during the experiment), for each fixed d, the value of J
C
will not change and, consequently, the value of T
R
will not either. As we can see, when d and L/θ are kept fixed in equation (15) the value of J
C
does not change. Then, this means that T
R
(resistive torque) is equal in this situation and that G must have the same value for different inertias, see Figure 5. As Figures 4 and 5 show G values decreasing with the addition of additive microspheres, this means that T
R
is decreasing as d and L/θ are fixed. Then, from equation (13) it is possible to observe that the value of the maximum shear stress τ
MAX
, also decreases, and this value alters the oscillation frequency. The justification for the decrease in G is the choice of resin in relation to the increase in HGMs. The S-22 density is 0.22 g/cm3 and an average diameter (65 μm) relative to the density for pure resin (CP-00) is 1.18 g/cm3. In this way, the samples become lighter with more resin. In Figure 4, the value of G linearly decreases with the increase in %W of HGMs. The amount of resin compared to 12% W in HGMs shows that the interfacial bonding strength is greater as G/ρ increases. So, G/ρ the amount of HGMs above 12% W shows that the G value decreases and the bond resistance at the interface is lower unlike the previous case. Shear modulus curves, G, versus a percentage of HGMs, %W. G = 1.34–0.024 (%W), valid for 0 ≤ %W ≤ 16.67. Curves of shear modulus, G, versus rotational inertia. Samples: CP-00 to CP-10.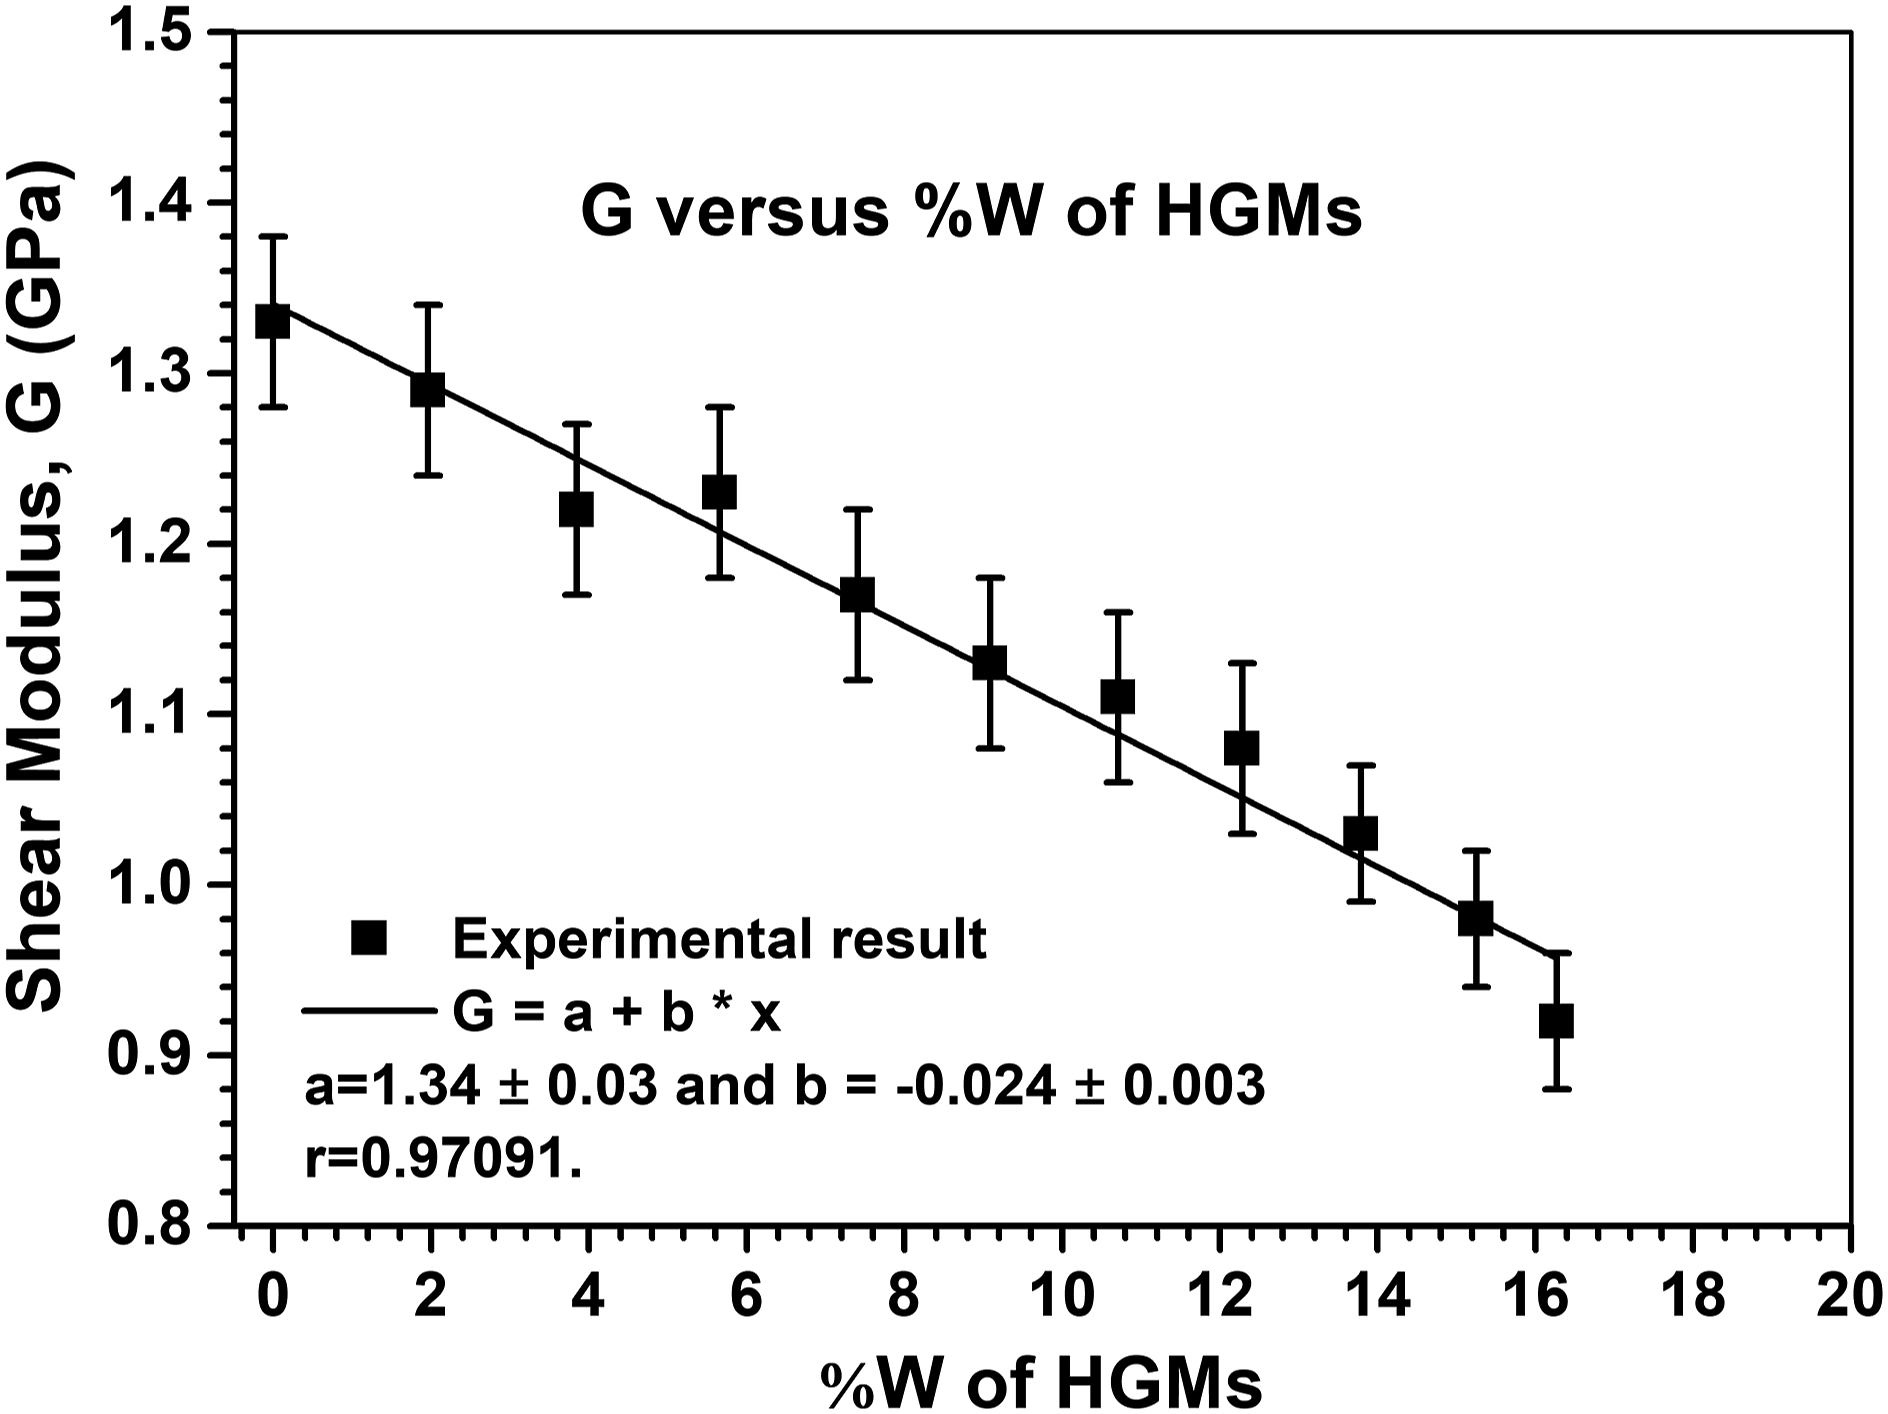
The results of Figure 6 show that for the same moment of inertia, the frequency values decrease as the number of HGMs increases, which means that τ
MAX
is decreasing. From the experimental results of Tables 3 and 4, we also observe that for each sample analyzed, If
0
2
is practically constant when the quantity of microspheres is the same. Thus, if the torsion pendulum inertia increases, the value of f
0
must decrease. Then, if I decrease, an increase of f
0
is expected (see Figure 6). Therefore, when the number of microspheres increases, the If
0
2
product decreases (considering only samples with a diameter of 5.00 mm; Table 3), corresponding to a decrease in kinetic energy (1/2 I ω
0
2
) and an increasingly smaller τ
MAX
. In Figures 4 and 5, as d and L/θ, are fixed, and G decreases with an increasing amount of microspheres, it is clear from equation (15) that T
R
decreases. This change in the internal structure of the composite provides a decrease in G values. However, the value of G was determined using equation (7). When we change the rotational inertia, by using the same experimental conditions above (d and L/θ fixed), it was observed that the product If
0
2
was constant for each sample. The product (If
0
2
) decreases with the increase of the microspheres number in the resin (see Table 3), considering samples with diameters of 5.00 mm. Curves of frequency versus rotational inertia. Samples: CP-00 to CP-10.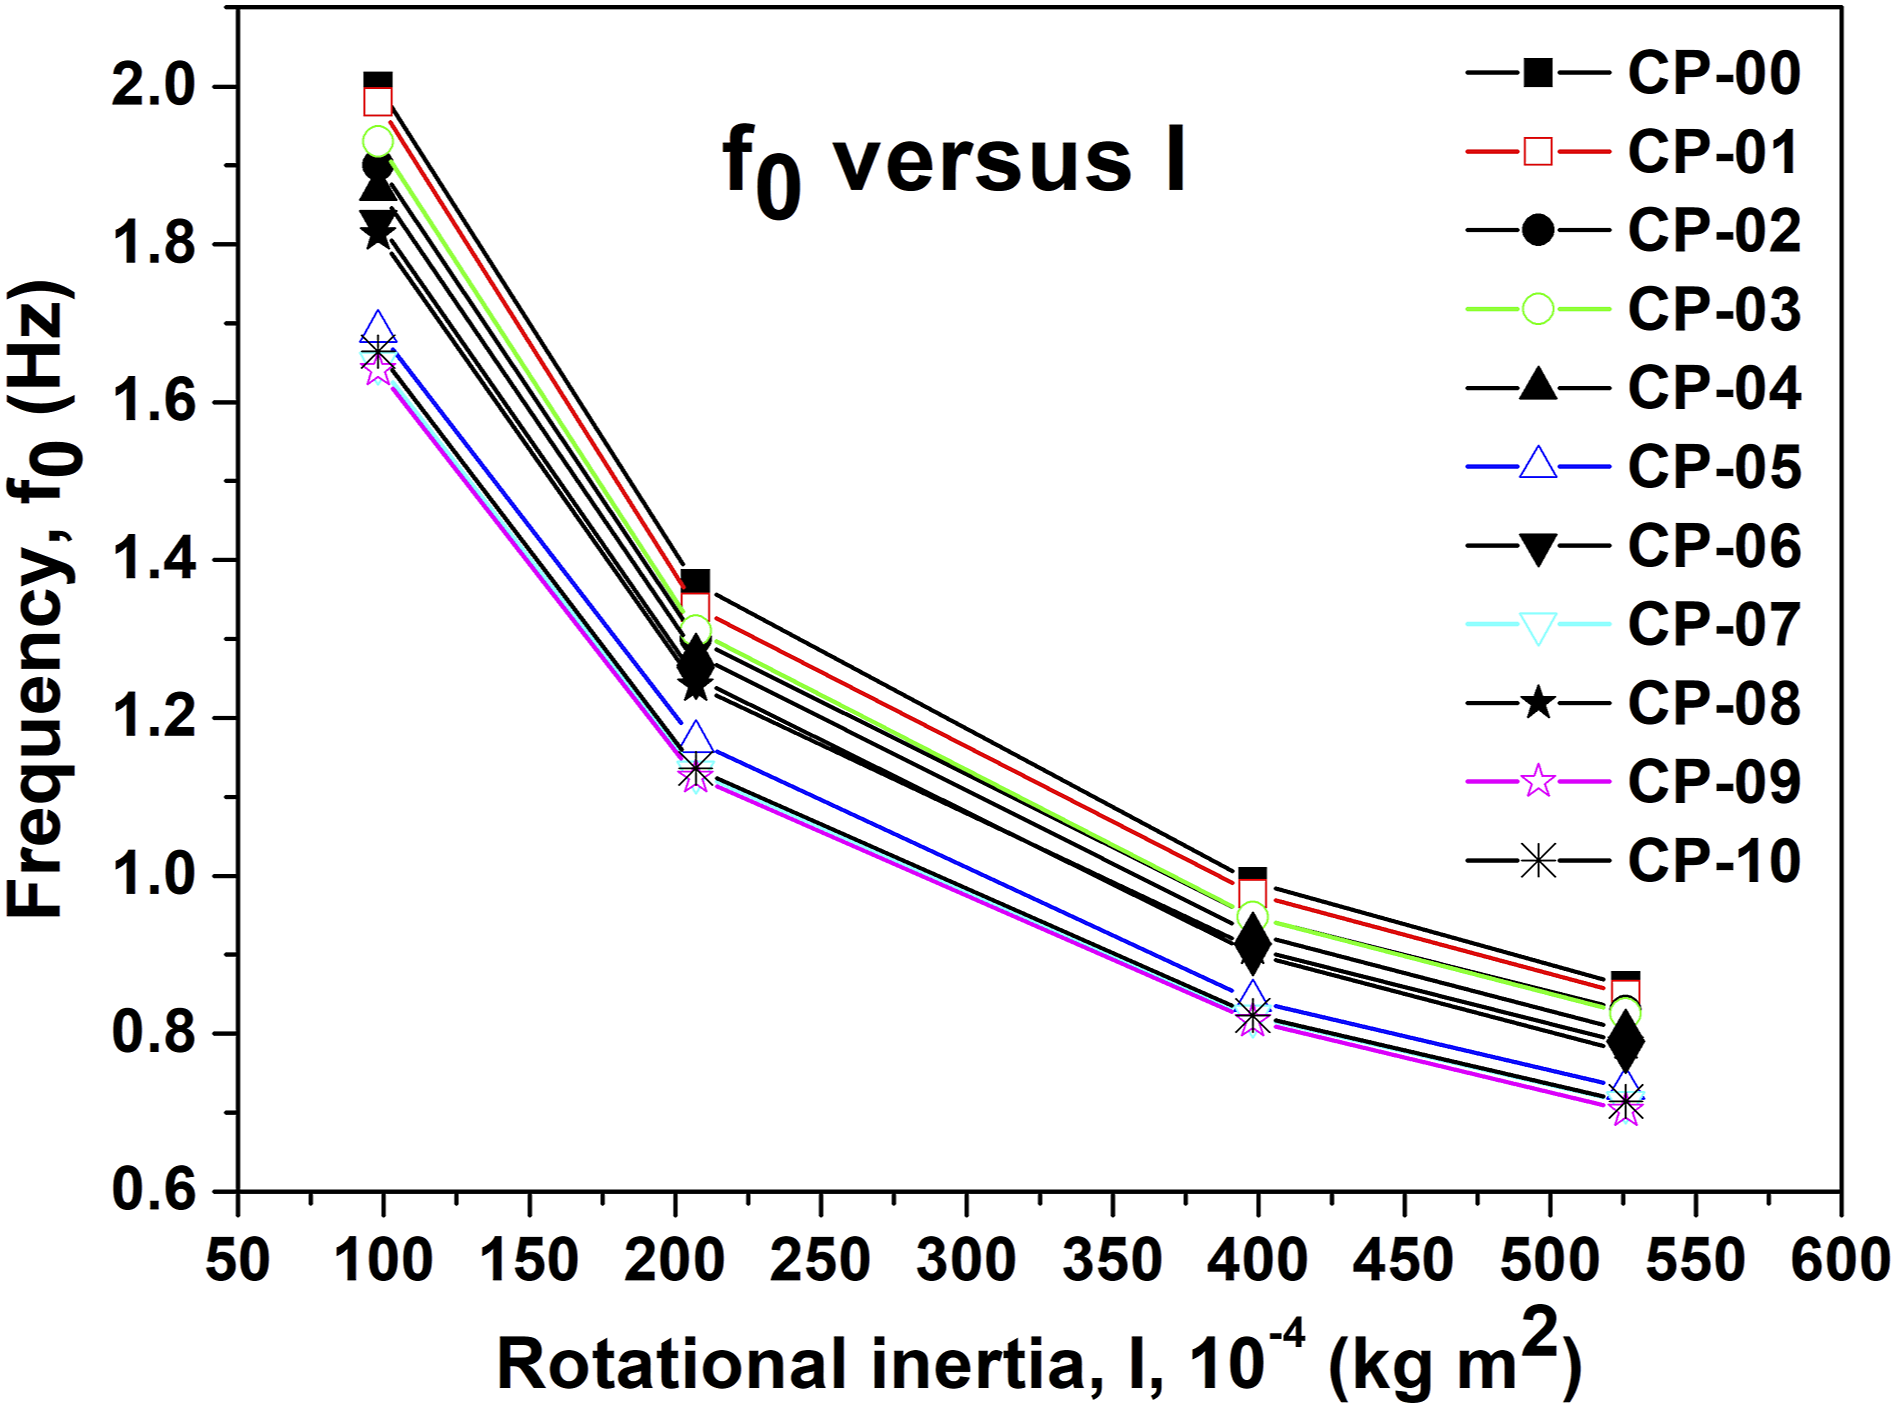
For this technique applied within the interval of the elastic range, we fixed a torsion angle of 1.78° in the sample (corresponding to 8° in the rotation sensor).
On the other hand, if the ratio between the torsion modulus and the density after catalysis of samples (G/ρ) are calculated and the respective percentages of HGMs considered Figure 7 results. It shows that G/ρ has a maximum point, thus defining the highest number of microspheres possible when looking for a lighter product without compromising its resistance. This study found a 12 %W percentage of HGMs for maximum G/ρ. With a large amount of resin relative to %W of HGMs, it is shown that G/ρ increases to less than G/ρ maximum. As G/ρ is greater than 12% W of HGMs, the amount of HGMs is large compared to the resin, as G/ρ starts to decrease. Curves of G/ρ versus a percentage of HGMs (%W). Samples: CP-00 to CP-10. At around 12% W, we have maximum G/ρ.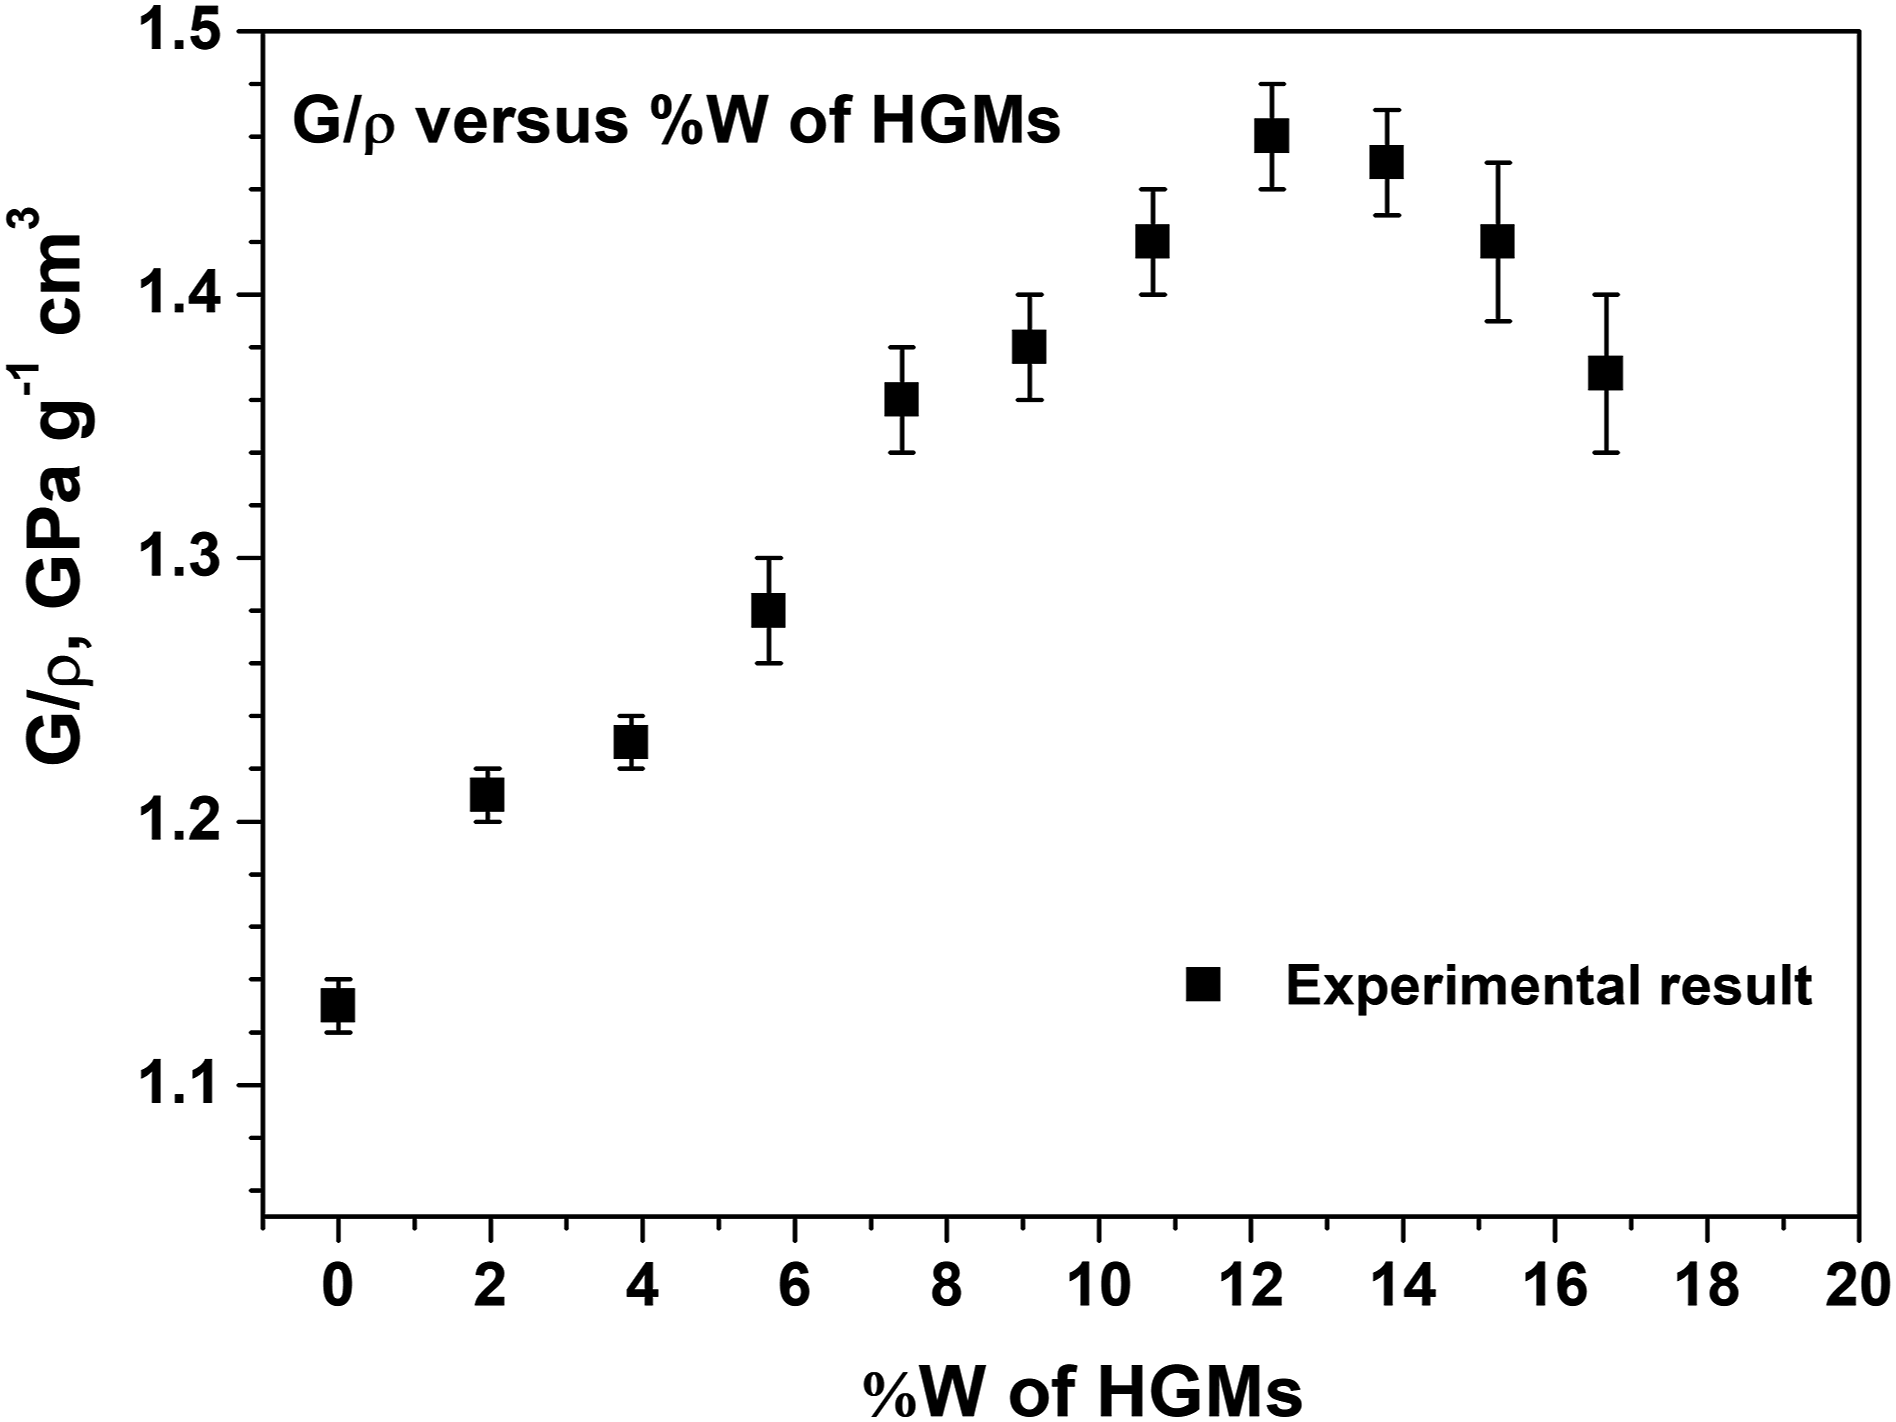
The influence of quantity HGMs to samples (MEV)
As the percentage by weight (%W) of HGMs increases, it fills a more substantial sample space, decreasing the amount of resin and its influence on the shear modulus G. This fact can be seen from item 3.2.1 when analyzing Figures 4 and 5, where the value of G decreases. The photos below show, at magnification scales of 500×, that the HGMs reduce resin volume, and which can change the G value. As G values were smaller than that with a less significant number of HGMs, it means CP-00, which has 100% W resin, is more torsion-resistant than other samples. Another fact observed in CP-00 is that it has higher total internal friction ((Q
−1
) than the other samples. Then, samples that have HGMs interfere with the material resistance so that the higher the %W of them, the lower the value of G Figure 8. Photos show, at magnification scales of 500×, that HGMs significantly reduce resin volume, which can change the G value. (a) CP-00: 100% W resin reference; (b) CP-02: 3.85% W HGMs; (c) CP-05: 9.05% W HGMs; (d) CP-06: 10.71% W HGMs; (e) CP-08: 13.79% W HGMs; (f) CP-10: 16.67% W HGMs.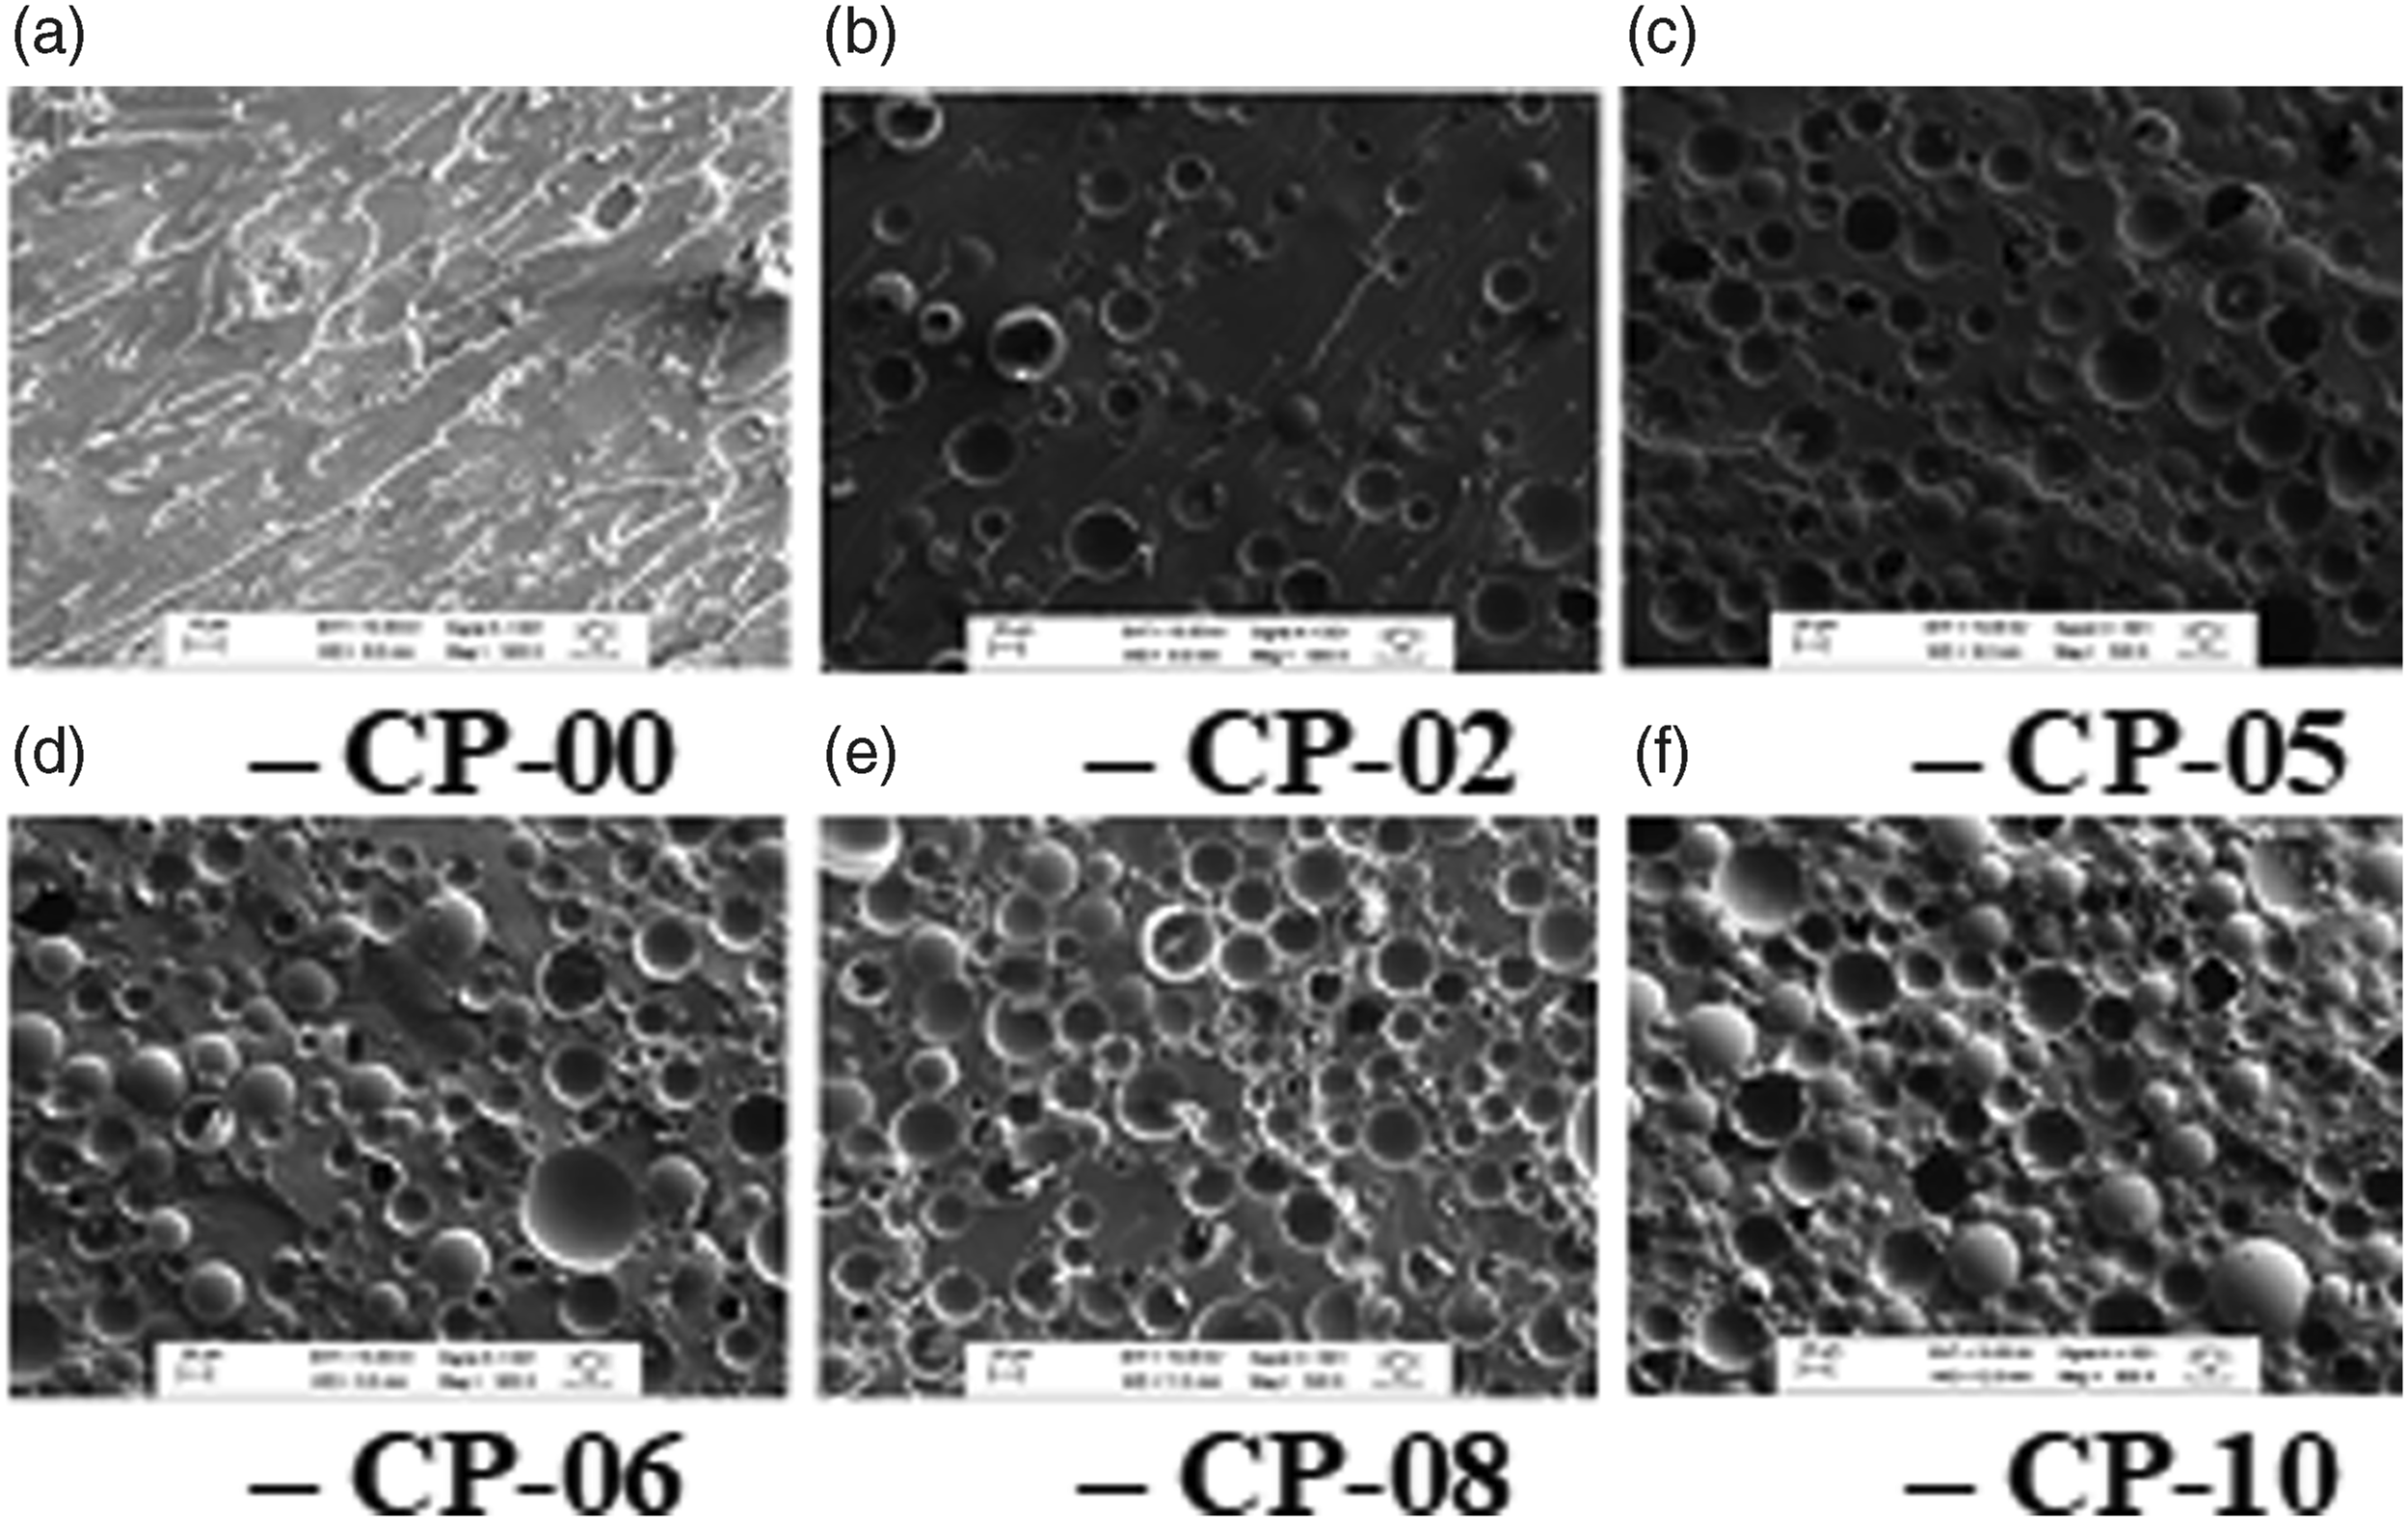
Conclusion
This study has found that the torsion modulus obtained for a 100% W unsaturated polyester sample has a value of G = (1.33 ± 0.05) GPa. As hollow glass microspheres were added, considering only diameter samples of 5.00 mm, the G values decrease. The lowest value found was for the sample with additive 16.67% W, whose value is G = (0.92 ± 0.04) GPa. Thus, a percentage variation in the G value of these two samples was observed at 31%. While the density showed a variation of 43% with the addition of HGMs for both samples. The dependence between G and the percentage by weight of HGMs is linear, considering the studied range from 0 to 16.67% W. G values are independent of the moment of inertia for each sample, considering the error associated with each of these values. As the results show, G values decrease with the addition of additive microspheres, which means that the resistive torque is decreasing since that the diameter (d) and the ratio of length to maximum torsion angle (L/θ), are fixed in the sample. Therefore, from material strength considerations, it can be observed that the value of maximum shear stress τ MAX , also decreases, and this value alters the oscillation frequency and the G value itself. Finally, we can conclude that there is a loss in weight of this material by 43% and a reduction in its torsion resistance of 31%. The G/ρ ratio has a value of a maximum of around 12% W of HGMs. Thus, we found studies of mechanical spectroscopy and strength of materials are beneficial, mainly because they use an equation to calculate G that does not require the Poisson’s ratio.
Footnotes
Declaration of conflicting interests
The author(s) declared no potential conflicts of interest with respect to the research, authorship, and/or publication of this article.
Funding
The authors acknowledge the Brazilian funding agencies FAPESP (grant #2015/00851-6; #2007/04094-9) and Capes (process number: BEX 6571/14-0).
Data availability statement
Data sharing not applicable to this article as no datasets were generated or analyzed during the current study.