
Abstract
Nano-reinforcements in carbon fibre-reinforced polymer (CFRP) have proven to enhance the mechanical properties considering quasi-static, as well as fatigue load and, are a promising option with regard to CFRP performance optimisation. While general knowledge about the nanofiller content and its influence in CFRP is well documented, the use of alignment techniques for a specific orientation of the nano-reinforcements is still insufficiently studied. In this work, the influence of oriented carbon nanofibres (CNF) on the mechanical properties of bidirectional CFRP is investigated. CFRP was produced CNF-reinforced with and without orientation using a hot press, where an electric field was applied during curing. The laminates were characterised with respect to dispersion quality, pore volume, quasi-static properties (tensile and bending tests) and dynamic properties (fatigue tests). Electrical resistance measurement was applied together with digital image correlation and in situ computed tomography to generate knowledge about the fatigue-related damage evolution and evaluate the sensors for viable use of condition monitoring. Results show that the orientation of CNF has a significant impact on both quasi-static and fatigue properties, increasing the strength while reducing and slowing down the introduced damage. Orientation of nanofillers thus shows large optimization potential of mechanical properties of CFRP components.
Keywords
Introduction
Carbon fibre-reinforced polymers (CFRP) are an advanced lightweight material, where high modulus and high strength carbon fibres are embedded in a thermoset matrix e.g., epoxy, finding applications in various fields.1–3 Due to their composition, these materials provide exceptional weight-to-strength properties, but also show anisotropic behaviour and possible failure due to delamination. 4 Various nanofillers, like carbon nanotubes (CNT), carbon nanofibres (CNF) or graphene have proven to enhance the mechanical properties of CFRP.5,6 Applications of CNF nanomaterials reach from electrical and thermal applications 7 to the general enhancement of composites e.g., for particle or fibre-reinforced multi-phase composites 8 or specifically e.g., for wind turbine blades. 9 The addition of 0.67–1 wt% CNF showed e.g., an increase of 9–12% of the interlaminar shear strength and 10–13% in compressive strength in the reinforced polymer. 10 Adding 2 wt% CNT to the epoxy matrix of CFRP enhanced the tensile strength and the elastic modulus by 26 and 19% respectively. 11 The amount of CNF in the CFRP is also a relevant factor: Katagiri et al. 12 have shown that the introduction of CNF up to around 2 wt% increases bending strength and flexural modulus, but the more brittle material behaviour leads to a decrease of the mechanical properties. In general, the use of CNT, 13 CNF and short carbon fibres 14 enhances the fracture toughness of the composite significantly. The interaction between filler and matrix determines the failure mechanisms: in conventional CFRP the matrix transfers and distributes the forces to the carbon fibres, 4 while the addition of nanofillers can bridge cracks and enhance the matrix–fibre interface and can thus enhance the ultimate strength of CFRP. 15 Therefore, good dispersion of the nanofillers is paramount to allow good interaction of filler and matrix. There are several methods for good dispersion of nanofiller in the matrix:16,17 most of the time, calendaring with a three-roll mill (TRM) is used for dispersing CNT and CNF in the matrix breaking up agglomerates by shear forces and distributing the particles. 18 Usually, for proper dispersions, several runs with decreasing gap sizes are needed.17,19 Further, several methods to monitor dispersion quality can be applied, e.g., rheology20,21 and light microscopy.20,22 Also pores at the fibre matrix interface are highly relevant for CFRP performance.23,24 CT enables detailed short-time analysis of entire laminate volumes with sufficient pore volume resolution and localization,25–27 making it a suitable technique to show that the formation of pores also depends on the resin flow direction and laminate structure.27,28 At fibre bundles in resin flow direction the least pore formation occurs, while at fibre bundles located in 45° and 90° directions it is much more pronounced (both in number and size) due to flow obstruction. Furthermore, pores accumulate at the interfaces of laminate layers. For high fatigue performance of FRP, pores need to be reduced as much as possible, since with increasing pore size fatigue life decreases 29 and matrix cracks dominantly occur near pores. 30
Advanced concepts, like a combination of different classes of fillers,31,32 or orientation of nanofillers33,34 proved to further enhance material properties. The combination of carbon nanotubes and graphene nanoplatelets in epoxy composites can enhance the thermal properties (e.g., increase of glass transition temperature by 13 K). 31 Rodriguez-Gonzalez et al. found, that the hybrid combination of multiwalled CNT and graphene oxide lead to enhanced mode I and mode II interlaminar fracture toughness of unidirectional carbon fibre/epoxy laminates. 32 Singer compared neat epoxy specimens with various oriented specimens (multiwall carbon nanotubes (MWCNT), functionalised MWCNT and CNF) and showed an improvement in both, mechanical and electrical properties. 34 Further, it was shown e.g., that the orientation of nanofiller inside the specimen can enhance the conductivity and the mechanical properties of the composite: Addition and orientation of 0.3 wt% CNT lead to an increase of the interlaminar shear strength of the CFRP composite of 19.7% and the through-thickness conductivity increased by 38%. 33 While quasi-static mechanical properties of nano-modified composites were investigated extensively,10,12,35–38 much less is known about the performance of nano-reinforced CFRP under cyclic loading.
It was observed, that the influence of nano-reinforcements on fatigue lifetime is larger than on quasi-static properties, e.g., Kostopoulos et al. 39 showed for 0.5 wt% MWCNT doped CFRP that the fatigue life increases compared to the neat CFRP, while the quasi-static tensile strength decreases due to the presence of agglomerations. Ni et al. 40 found that CNT in ply interfaces of CFRP laminates can improve the fatigue life under short beam shear stress across across all load levels by 60 %, up to 250 % for high-cycle fatigue, while the static strength was not increased. 40 The addition of CNT suppresses delamination and shifts the damage to the intralaminar region: Khashaba et al. have shown that CNT are especially efficient in terms of fatigue performance at room temperature, while higher temperatures (i.e., 50°C) lead to similar results compared to neat CFRP. 41 The addition of 1 wt% CNF was also reported to increase the fatigue life, tensile strength and Young’s modulus of CFRP. 42 The reasons reported are fibre bridging as well as fibre pull-out. Similar results are present for cellulose nanofibre reinforcement in CFRP. The implementation of cellulose nanofibre reinforcement increased the fatigue lifetime by a factor of 10–30 for tension-loaded CFRP.43,44 Shao et al. found an optimal range of 0.3–0.8 wt% cellulose nanofibres to decelerate the stiffness decrease and enhance the lifetime of the CFRP. Further, the addition of 0.8 wt% led to an enhanced carbon fibre/matrix adhesion, which caused carbon fibres in warp bundles to break earlier due to ineffective stress reduction compared to 0.3 wt% added nanofibres. 44 In addition to the used wt % of reinforcing nanofillers, also their length is a primary factor, which mainly affects the fatigue life behaviour. Obunai et al. have shown that comparatively short cellulose fibres (6 μm) lead to no significant improvement, while lengths higher than e.g., 22 μm can lead to 10 times higher fatigue life. 45 This can again be directly related to increased delamination resistance and fibre pull-out behaviour.
The effect of the orientation of CNF in CFRP with regard to fatigue life during tension–tension loading is less known. Ladani et al. investigated CNF orientation in CFRP and its influence on fatigue performance, where CNF were oriented in CFRP joints (perpendicular to the crack plane), leading to increased fracture and fatigue resistance with increasing CNF concentration and orientation. 46 Regarding the monitoring of fatigue cracks, the addition of CNF leads to conductive networks, which enabled the use of electrical resistance measurement for damage detection. This approach was already successfully applied for condition monitoring during tension–tension loading of CNT-reinforced CFRP.39,47 Two main phases of the electrical resistance change during fatigue load were identified: below 10% of the fatigue lifetime, the electrical resistance decreases, which has been attributed to the self-alignment of the material’s conductive network with new electrical fibre contacts forming after initial interlaminar matrix cracks. After the conductive network reaches a new equilibrium, the resistance increases continuously until failure, mainly due to the greater damage accumulation.
In this study, the effect of CNF orientation on the quasi-static mechanical and fatigue properties of carbon fibre-reinforced polymer is investigated. TRM was used to disperse the nanofiller in the matrix, and light microscopy was used to analyse the dispersion quality. CNF-reinforced CFRP with and without orientation of CNF was examined initially considering their condition after curing as well as quasi-static properties. Afterwards instrumented fatigue tests were conducted. Electrical resistance measurements were combined with digital image correlation, and in situ computed tomography was applied to generate knowledge about fatigue-related damage evolution.
Experimental procedure
Specimen manufacturing
Materials
A bisphenol-A-epichlorohydrin resin (Sika Biresin CR172) with a dinitrotuol-based hardener (Sika Biresin CH172-6) was used with a mixing ratio of 100:19. As nanofillers carbon nanofibres (company Merck KGaA, conical platelets, dimensions: D x L: 100 nm x 20–200 μm, graphitised (iron-free)) were used. Carbon fibre plain weaves (3k, 200 tex) were purchased from Carbon-Werke Weissberger GmbH & Co KG.
CFRP manufacturing
Overview of the applied TRM gap size parameters during the milling process.
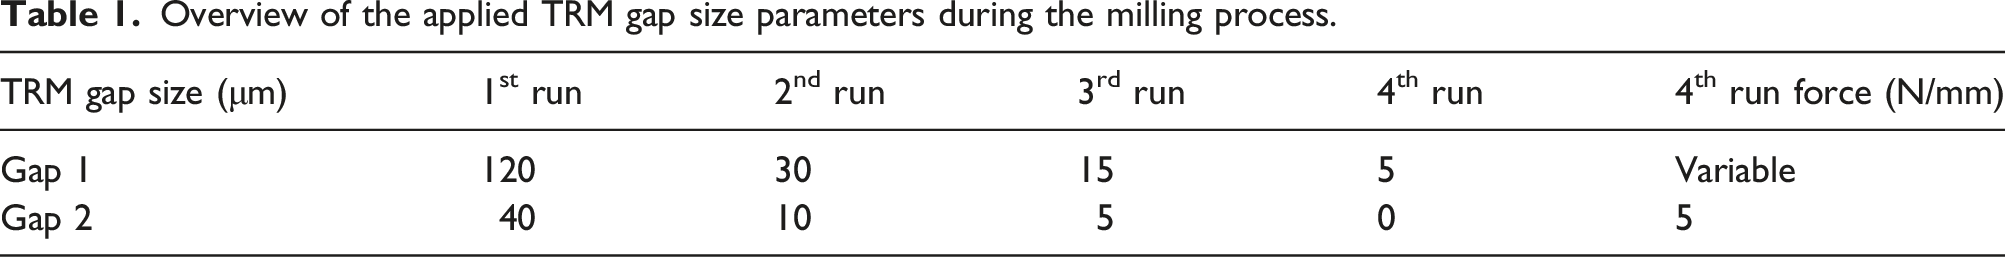
The CNF-modified resin was mixed with the hardener in a weight ratio of 100:19. The final amount of nanofiller with respect to the epoxy mixture was 0.59 wt%, calculated by the ratio of weight of the applied nanofiller and the total weight of resin and hardener. The components were mixed with a mechanical stirrer at 300 rounds/minute under a vacuum, to get rid of air bubbles enclosed inside the dispersion and to avoid the formation of new bubbles during the mixing process. The dispersion quality was monitored by investigating small amounts of the mixture directly after the TRM runs and again after mixing with the hardener in the optical microscope (Keyence VHX 5000) with respect to agglomerate size.
CFRP plates were produced in a hand-layup process including 12 layers of the carbon fibre fabric, then pressed and hardened in a hot press at 3 MPa and 140°C for 1 h. The process resulted in a CFRP plate of 2 mm thickness with dimensions of (400 mm × 400 mm x 2 mm). The thickness of 2 mm was chosen to keep the volume for in situ CT small. The final fibre-volume content Vf of the produced CFRP was calculated by weighing from the area weight (200 g/cm2) and density (1.8 g/cm3) of the carbon fibre fabric and the density of the epoxy matrix (1.12 g/cm3). Vf was determined as Vf = (72 ± 2)%.
Three CFRP plates were produced as described above, one with random orientation of the CNF, and the other two with the additionally induced orientation (short alignment of 5 s and long alignment of 1 h – full curing duration) of the CNF. Orientation was realised by an electric field applied during curing in the hot press in the following way, described previously in detail: 34 Two Cu-coated electrode plates (500 mm × 500 mm) wrapped in PTFE foil for isolation were placed beneath and above the impregnated carbon weaves. The plates were connected to an AC voltage source providing 300 V at 2000 Hz. This setup was placed in the press and the source was turned on when the pressing procedure started to ensure that the electrical field was applied parallel to the start of the curing of the matrix. By application of the electrical field, the CNF are oriented orthogonal to the carbon fibre weaves. From the three plates, several specimen geometries have been cut by micro water jet for quasi-static and fatigue testing. Specimens are denoted as 0 V (no orientation), 300 V SD (short duration of electrical field) and 300 V LD (long duration of electrical field) throughout the manuscript.
Quasi-static testing procedure
Quasi-static tests included tensile, four-point bending, and apparent interlaminar shear strength (ILSS) tests – specimen geometries are depicted in Figure 1. The specimen geometry and testing procedure follow ISO 527-4 for the tensile tests (with deviation in the specimen length), and ISO 14125 for the four-point bending tests (scaled for a shorter specimen geometry). Due to geometrical restrictions of the specimen material, the short beam shear testing specimens for ILSS determination do not strictly follow a standard but are oriented on ASTM-D2344. Specimen geometries (left) and photographs of produced CFRP (right).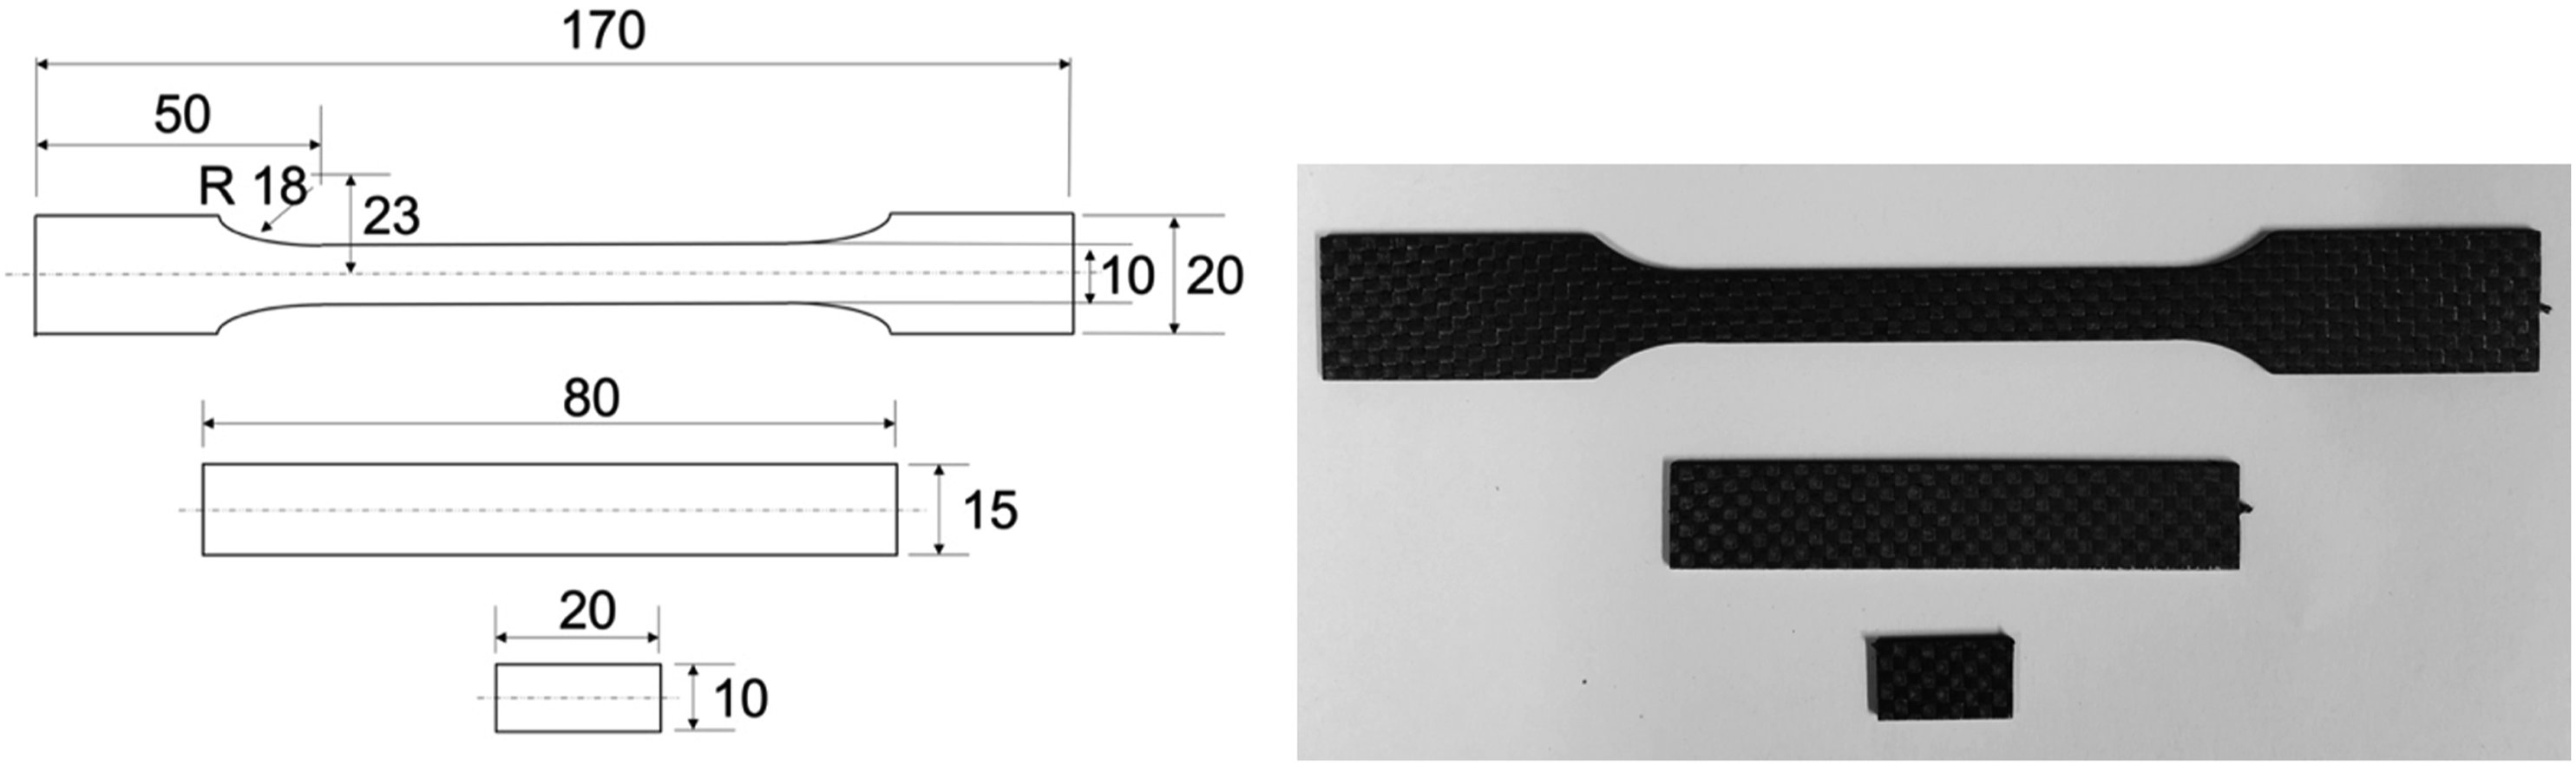
Tensile tests were carried out on a servo-hydraulic testing system (Zwick/Roell 810 MTS) by the use of a strain clip gauge, which was fixed to the specimen’s gauge length and a 100 kN load cell. The tests were performed at a constant deformation speed of 2 mm/min, strain measurements were corrected by the gauge offset.
Four-point bending and apparent interlaminar shear strength tests were carried out on a Zwick/Roell spindle-driven testing system with a 10 kN load cell, deformations were measured by a digital image correlation (DIC) system (Dantec Dynamics, Q400) and evaluated with the Istra 4D data evaluation/image processing software (Istra, Version 4.4.4.69). Therefore, a stochastic pattern was spray-painted with white spray on the surface of the specimen’s length side.
The deformation rate in four-point bending tests was reduced to 0.5 mm/min compared to the specification in ISO 14125 to accommodate for a higher number of DIC images at a image sampling rate of 1 Hz during these tests. The support and loading span were adapted to the specimen geometry and set to 64 mm and 23 mm, respectively. Loading nose and supports had a radius of 10 mm. For the apparent ILSS test (short beam shear test) the speed of testing was set to 1 mm/min, due to the testing machine limits, the support span had to be adapted to 9 mm, with the loading nose and supports having a diameter of 4 mm.
Fatigue testing procedure
Figure 2 shows the used specimen geometry, suitable for in situ computed tomography (CT) measurements48,49 and a tested specimen. For measurement of electrical resistance conductive silver lacquer was applied to the lower and upper edges of the specimen for optimised electrical contacting of the carbon fibres. Regarding optical deformation measurement using DIC, a stochastic pattern was spray painted onto the surface of the specimen’s measuring length. In situ CT specimen dimension (left) and tested specimen (right) with applied conductive silver lacquer at the edge areas for electrical resistance measurement; specimen thickness 2 mm each.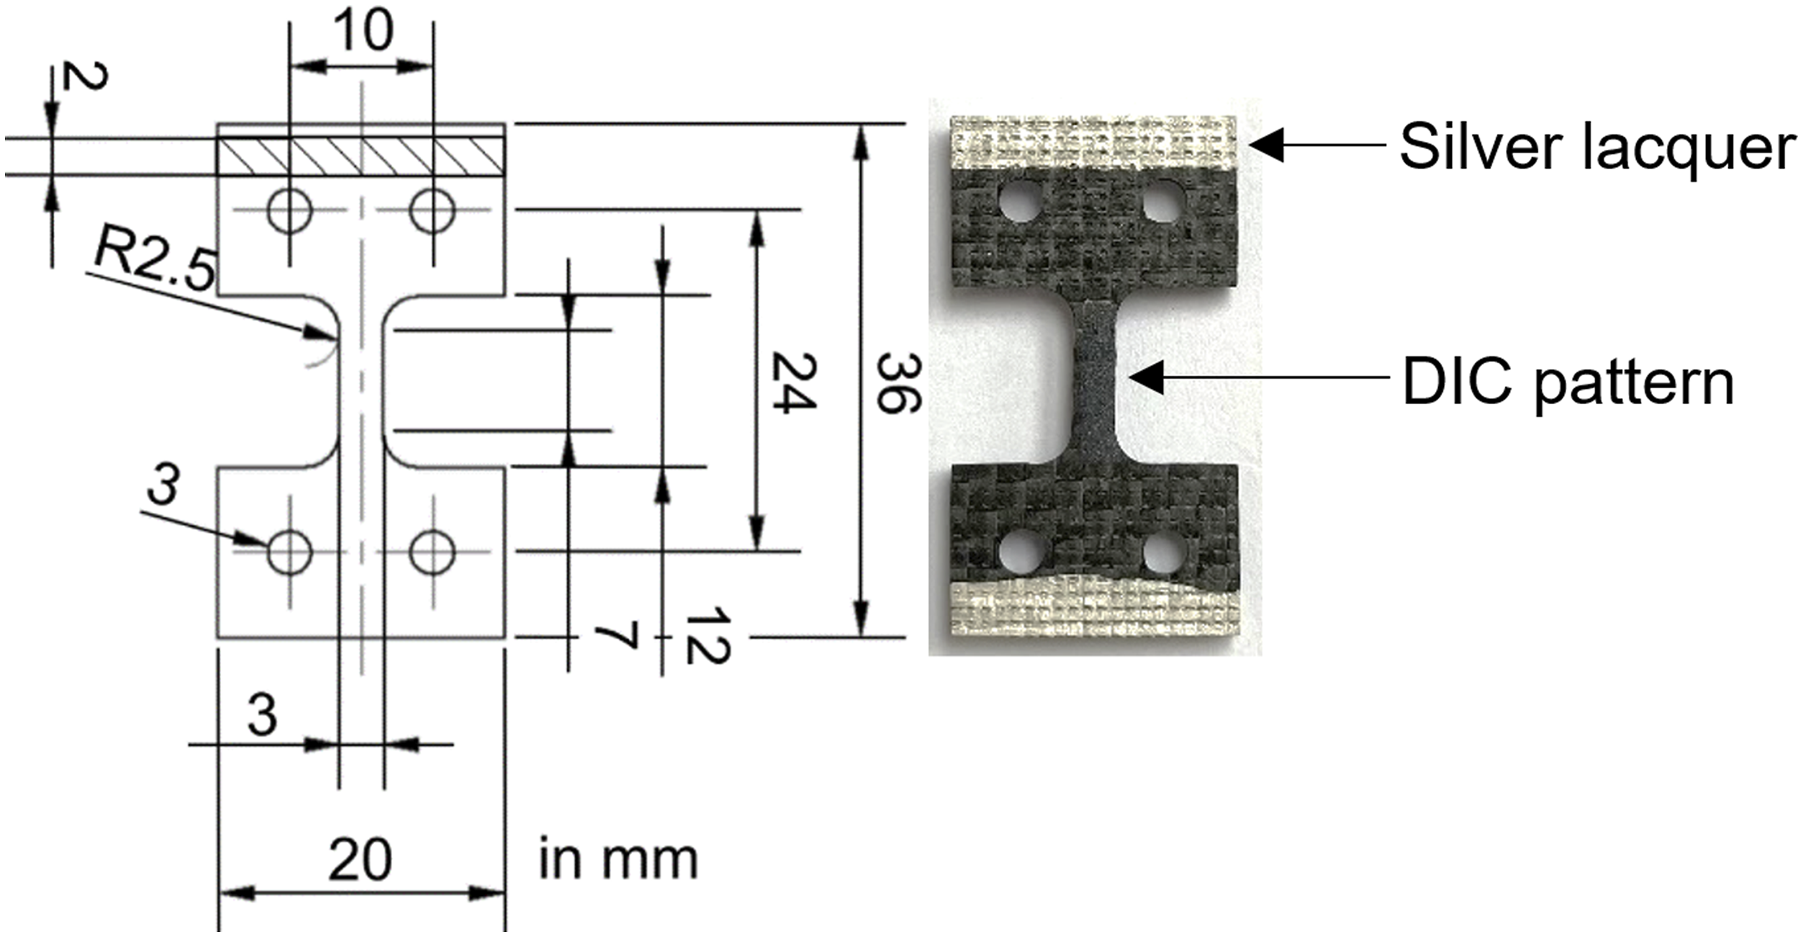
The fatigue tests were carried out on a servo-hydraulic testing system (MTS 858 Mini Bionix II, Fmax = ±25 kN, MTS Systems, Eden Prairie, USA) following ISO 13003. For clamping of the CT specimen geometry, a custom-made clamping adapter was used (see Figure 3(a)). To ensure that the tests were conducted below a maximum change in temperature of 10 K, as specified in ISO 13003, the specimen surface was recorded using a MicroEpsilon TIM 160 (Micro-Epsilon Messtechnik, Ortenburg, DE) thermography camera. Further, microstructural changes in specimen state were evaluated using the dynamic stiffness Cdyn, representing the change of force divided through the change of piston displacement: (Fmax – Fmin)/(smax – smin), and digital image correlation for strain recording. In this case a GOM Aramis SRX 3D DIC system with 12 MP cameras (Carl Zeiss GOM Metrology GmbH, Braunschweig, DE) was used. The total strain was extracted with the system manufacturer’s software GOM Correlate Professional 2020 (Rev. 144376) from the DIC measurementsJCM_1150496_gs_f1 using 5 mm virtual gauge line elements in the central section of the specimen. Fatigue testing setup containing a servo-hydraulic testing system instrumented with temperature, digital image correlation, and electrical resistance measurements.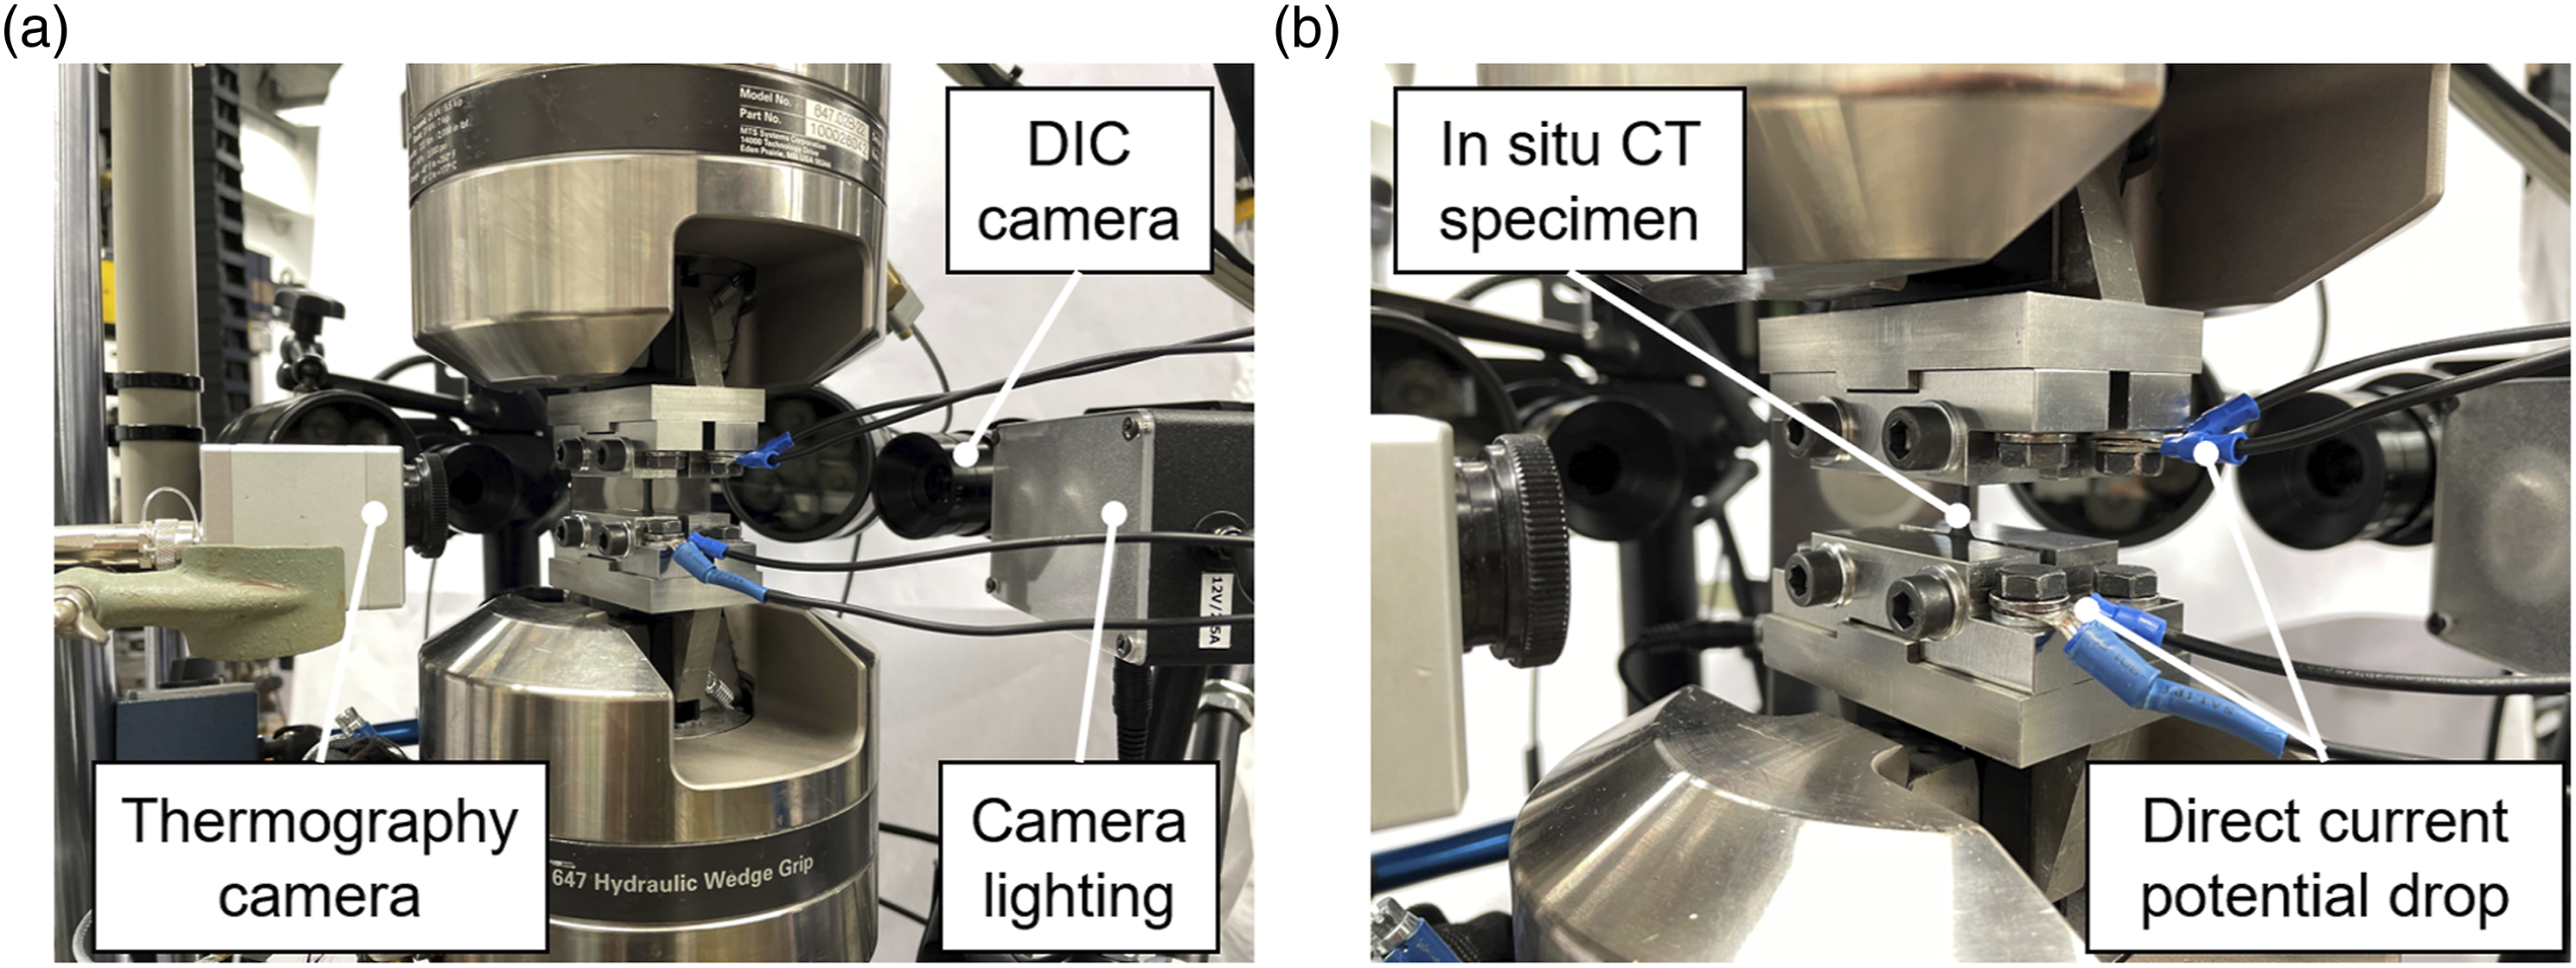
The four-point conductor principle was applied to determine the direct current potential drop of the specimen and evaluate its change concerning the microstructural changes related to occurring damage. The electrical conductivity of the clamping adapter was used (see Figure 3(b)) to contact the specimen using its silver lacquered edges to an electric direct current source (Sorensen XG 100–8.5 power supply, AMETEK Programmable Power, San Diego, CA, USA) in combination with a National Instruments cDAQ 9174 and NI 9238 module (National Instruments, Austin, TX, USA) for voltage measurement. The direct current used to determine the electrical resistance was limited to 200 mA following the procedure of 50 to avoid electric current-induced specimen heating.
As fatigue testing methods multiple amplitude tests (MAT) and constant amplitude tests (CAT) were carried out with a sinusoidal tension–tension load-time function at a stress ratio of R = 0.1 for the MAT and 0.01 for the CAT. For the MAT a starting maximum stress of σmax,start = 100 MPa was chosen, followed by stepwise increases of Δσmax = 25 MPa per ΔN = 5 × 10³ cycles until specimen failure. σmax,start = 100 MPa was chosen with regard to the tensile strength, since it was expected to be tensile stress that can be endured by the specimen for the investigated numbers of cycles without measurable damage. The initial material responses measured during the σmax = 100 MPa were used for comparison with the material responses measured at the following later stress levels. For CAT, one representative maximum stress level (σmax = 300 MPa) was derived from the MAT test results using the measurement information regarding events of characteristic microstructural changes to get information about the fatigue-related damage evolution with regard to the orientation of the nanofibres. The CAT were conducted on individual specimens up to 5E4, 5E5 and 2E6 cycles (N). Afterwards, the specimens were unloaded and dismounted from the testing machine, provided with a contrast agent by utilizing the capillary effect, and examined for damage using in situ CT (Figure 4(a)). In situ CT scans of the specimens were performed under load (90% of σmax to avoid crack closure effects), which was applied by a CT5000 testing stage (Deben UK, Bury Saint Edmunds, UK). The CT scans were produced using an XT-H 160 system (Nikon Metrology, Tokyo, Japan) with the following parameters: 60 kV beam energy, 114 μA beam current, 1 s exposure time, 1583 X-ray projections, 4-fold X-ray superimposition and 7 μm voxel size. VGStudio Max 2.2 (Volume Graphics GmbH, Heidelberg, DE) was used for the CT scan evaluation. Figure 4(b) shows the procedure: A defect analysis detects the existing damage and enables the evaluation of the defect volume and type of defect. For a simplified representation, the results show the front and side view of the damaged sections in the specimen’s measuring length, representing the overlay of damage of all laminate layers.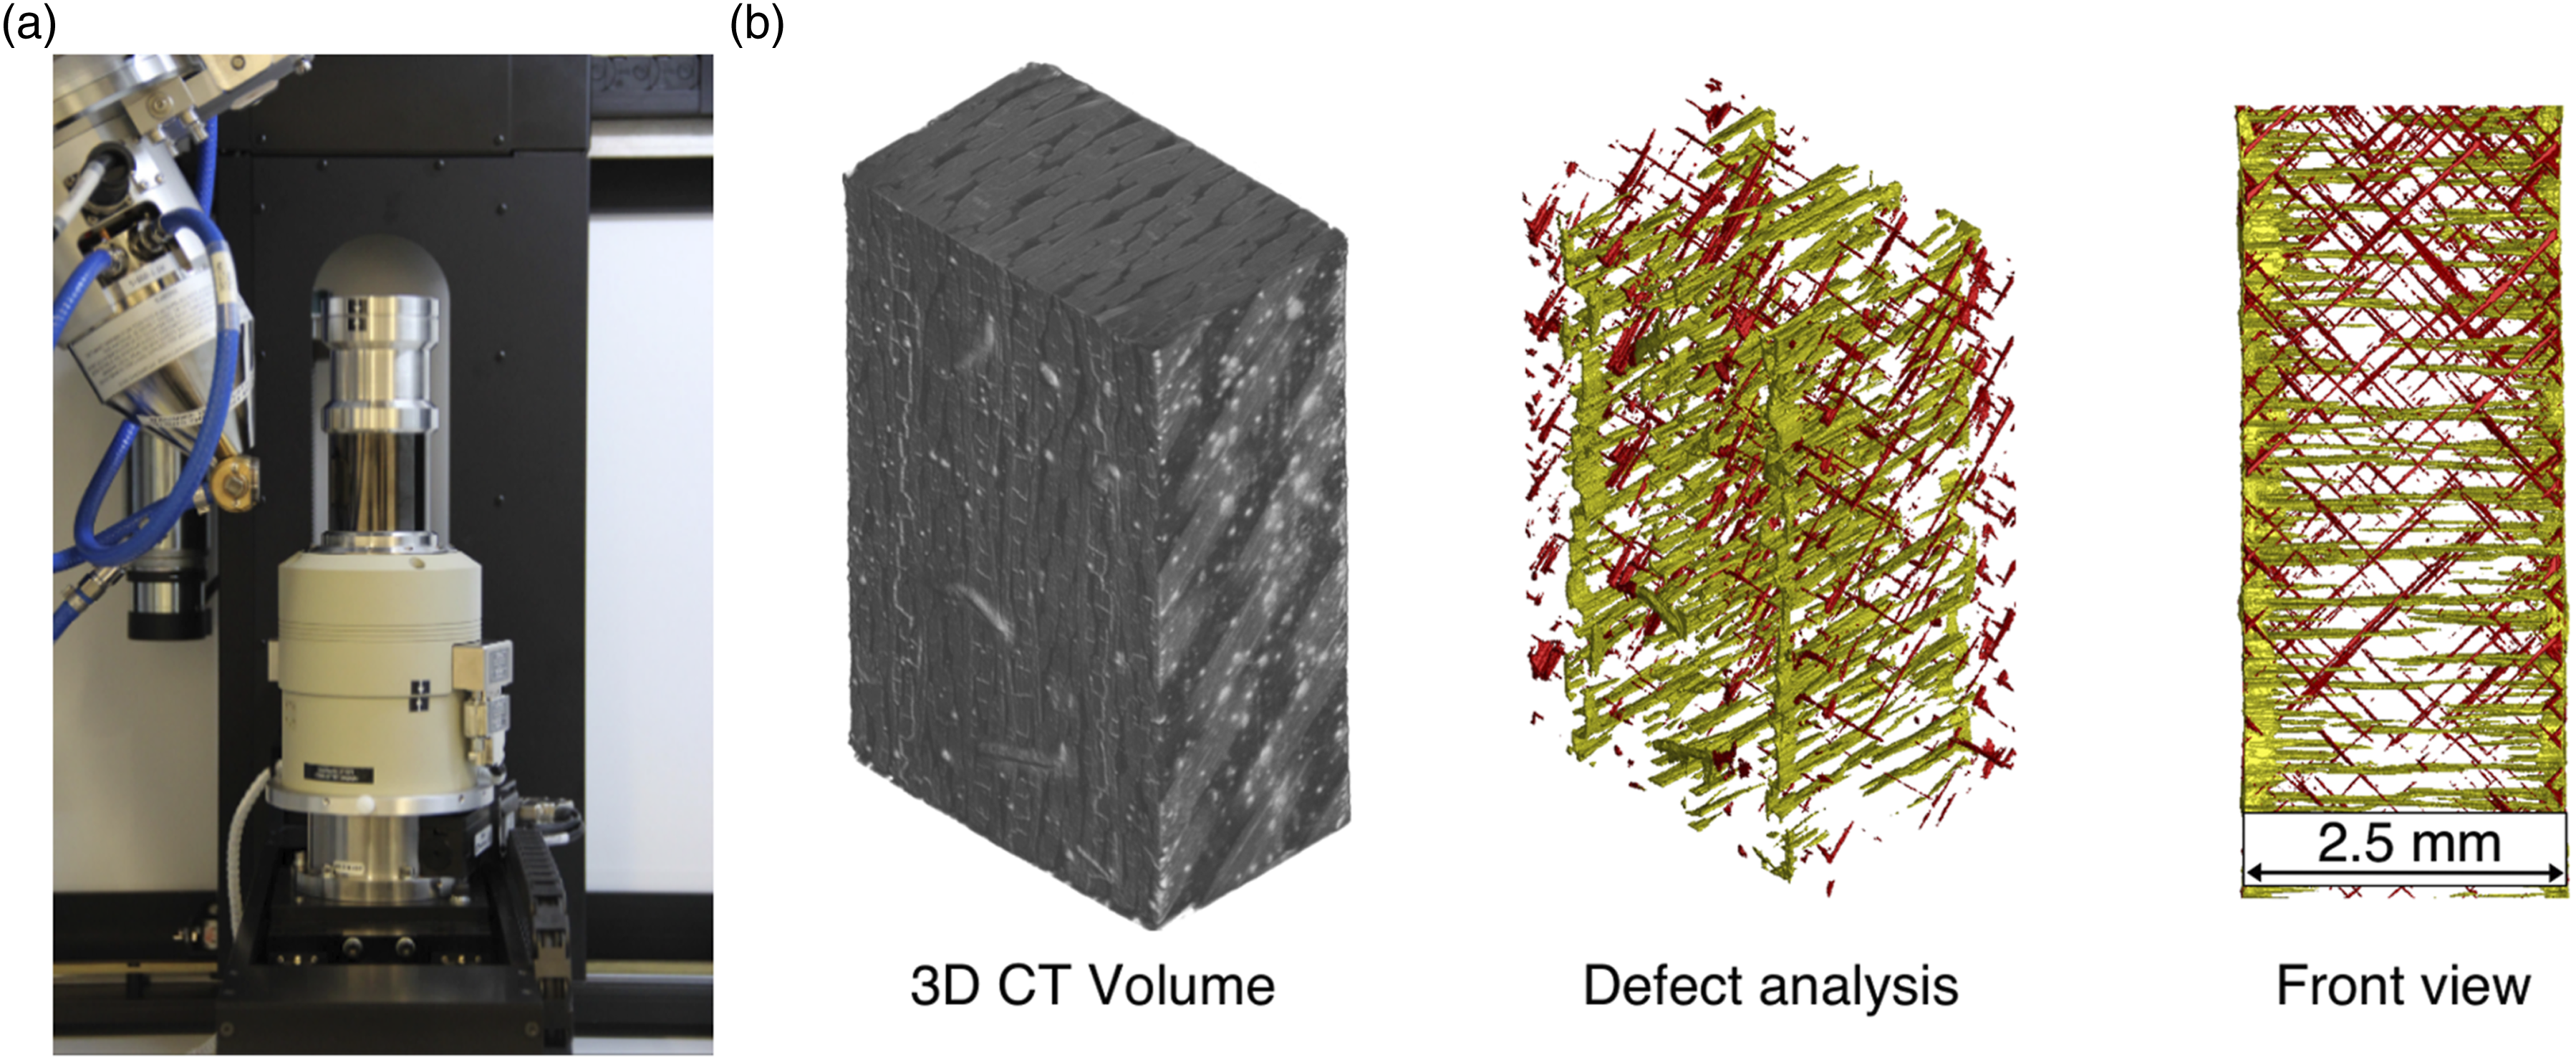
Results and discussion
Dispersion quality and orientation measurements
The quality of the dispersions was monitored by light microscopy after the TRM dispersion process and after the mixing process with the hardener, i.e., before lamination. A thin layer of the mixture on a glass slide covered with another glass platelet was investigated in transmission light mode. From the images taken, the agglomerate sizes were evaluated by a self-written processing routine using Fiji based on Image J: Grey values of an 8-bit microscopy image were set to a threshold and the initial image was converted to a binary image, where agglomerate sizes and circularity values are fitted and evaluated, described previously.
20
The results of the dispersion analysis are depicted in Figure 5. The microscopy image of the resin after the TRM processing (Figure 5(a)) shows in black the small well-distributed agglomerates – light grey shaded areas are out of focus of the microscope. The according histogram of the analysis (Figure 5(c)) displays most agglomerate areas below 5 μm2, and the biggest agglomerate below 10 μm2. Evaluation of the circularity index featured a value of 0.89 (±0.11) i.e., nearly circular agglomerates. Thus, the area values of 5 μm2 and 10 μm2 can be related to agglomerate sizes of below 2 μm by the area formula of a circle. This shows the good dispersion of the CNF after the TRM step. Figure 5(b) displays the final batch after mixing resin and hardener. The final mixture shows a slight re-agglomeration. Most agglomerate areas are below 10 μm2, and the biggest agglomerate is below 26 μm2, which corresponds to agglomerate sizes below 3 μm. The nanofibres are still optimally dispersed after the final mixing step. Evaluation of agglomerate sizes: microscopy image after (a) TRM dispersion process (b) after mixing the nano-modified resin and the hardener; Corresponding evaluation and distribution of agglomerate sizes of (c) the nano-modified resin (d) the final mixture.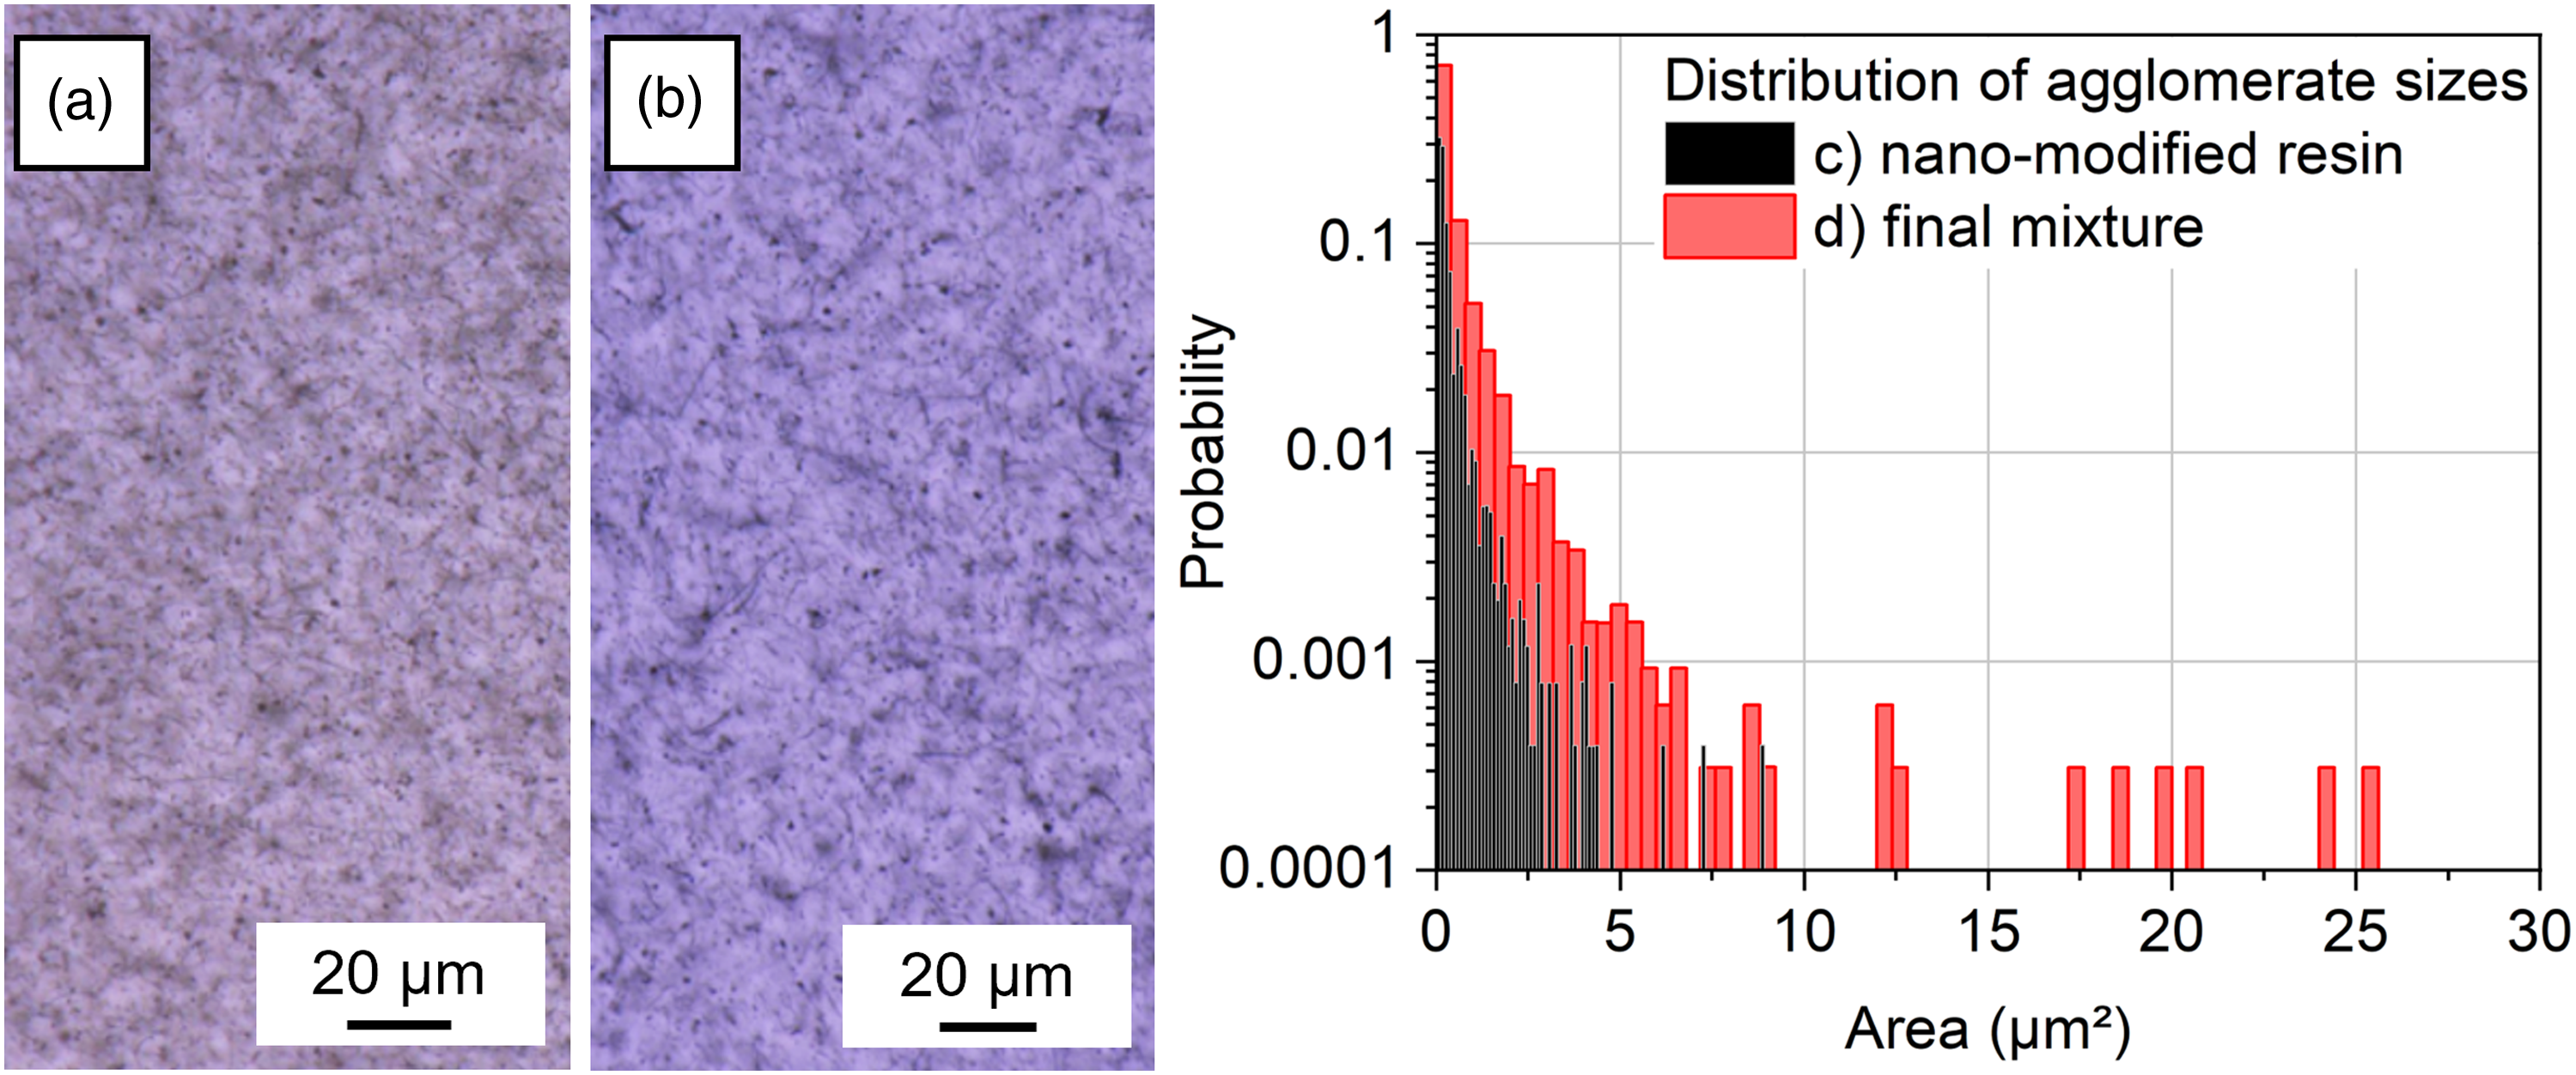
To investigate the orientation of the carbon nanofibres after applying the electrical field for different durations we qualitatively investigated the fracture surfaces of all specimens by scanning electron microscopy (SEM) (Figure 6). A successful orientation of CNF results in an alignment along the electrical field lines. The SEM images were taken perpendicular to the layup (which is oriented in the image plane, denoted as the x-y plane) allowing for orientation determination along the optical axis, which is parallel to the electrical field, denoted as the z-axis. There is a clear difference in the microscopy images, comparing not-oriented and oriented specimens. Figure 6(a) shows a randomly distributed CNF on the fracture surface, with CNF oriented as well in the x-y plane and along the z-axis. In contrast, Figure 6(b) and (c) show the CNF mainly aligned along the z-axis and hardly in the x-y plane. CNF aligned along the z-axis are detected as spots and ellipses or appear as short fibres. Thus, microscopy shows a clear indication of the successful orientation of the CNF. Overview of carbon nanofibre orientation in (a) unoriented specimen, (b) short-time oriented specimen, (c) long-time oriented specimen.
In addition, capacitance measurements were performed on parts of the CFRP plates. The orientation of the CNF could not be determined by a difference in electrical conductivity in the z-axis, all three specimens (0 V, 300 V LD, 300 V SD) featured similar low values, which is because of the relatively low filler content.
51
Thus, the orientation of the CNF was determined by a change in the static relative permittivity εr of the CFRP plate if acting as a dielectric medium in a plate capacitor. For this purpose, 100 mm × 150 mm CFRP plates of the specimen material were put between two thin Cu layers, deposited on polymer PTFE plates of the same dimension, and isolated from the CFRP by a thin polymer foil. The capacitance C of the plates was measured with a Normameter 930 and εr was calculated by equation (1):
Pore volume
Selected specimens for fatigue testing were examined before the tests using CT, to determine the initial pore volume. For this, the measuring length (shown in Figures 2 and 4(b)) was scanned. Figure 7 shows the resulting total pore volumes Vp,t for the different voltages (0 V, 300 V SD and LD), with an additional subdivision of the specimens used for the MAT and CAT. The specimen designation for the CAT specimens is complemented by the number of cycles until which the CAT were conducted. 0 V and 300 V SD alignment voltages feature higher total pore volume than 300 V LD alignment. Percentage of total pore volume in CFRP with nanofibres oriented under 0 V and 300 V SD and LD determined by computed tomography.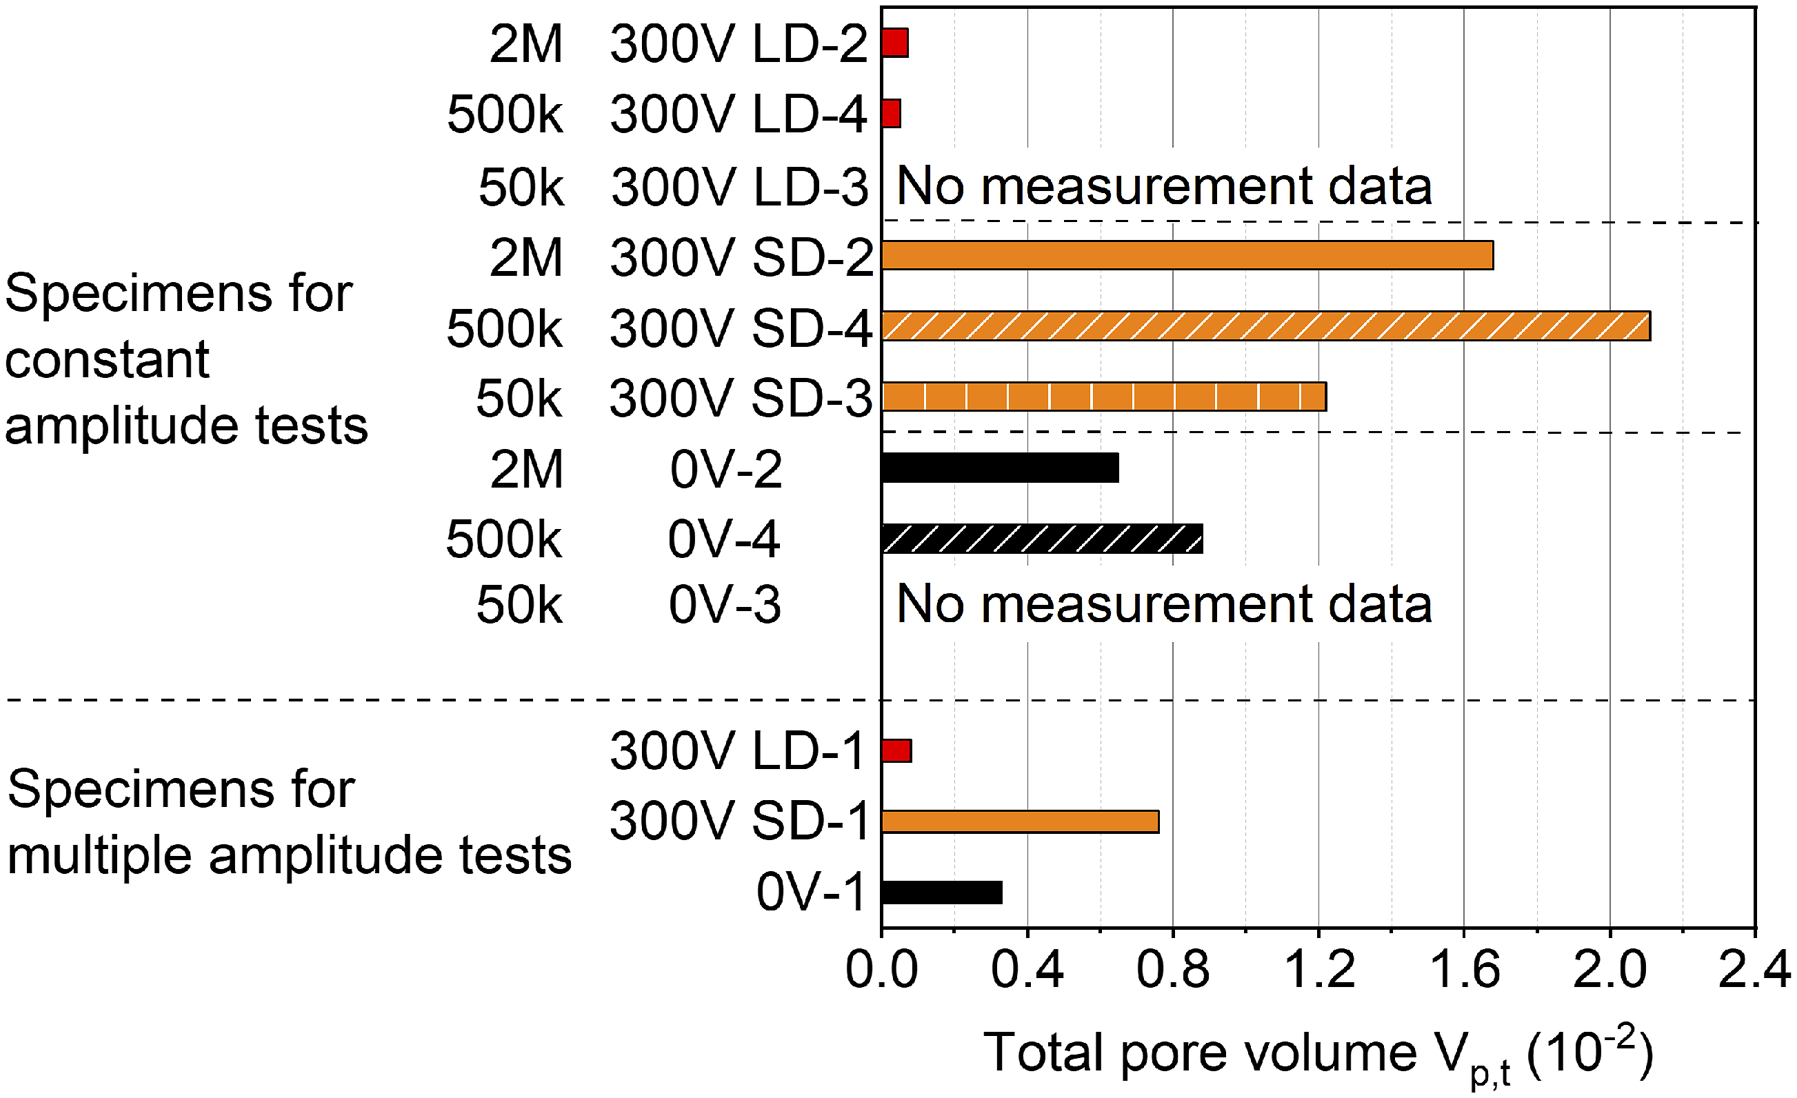
The distribution of the number of pores over a single pore volume for investigated specimens of each orientation intensity is shown in Figure 8. Figure 8(a) contains information for the specimen with the lowest measured total pore volume and Figure 8(b) for the specimen with the highest measured total pore volume. Interestingly the characteristics of the numbers of pores are similar between the specimen with the lowest and highest measured total pore volume, even though the absolute volume is significantly different. The absolute differences may occur due to process-related deviations, while the general observation of smaller and fewer pores for longer orientation duration (300 V LD) is consistent. Distribution of number of voids over single pore volume for specimens of each orientation intensity with (a) lowest measured total pore volume and (b) highest measured total pore volume.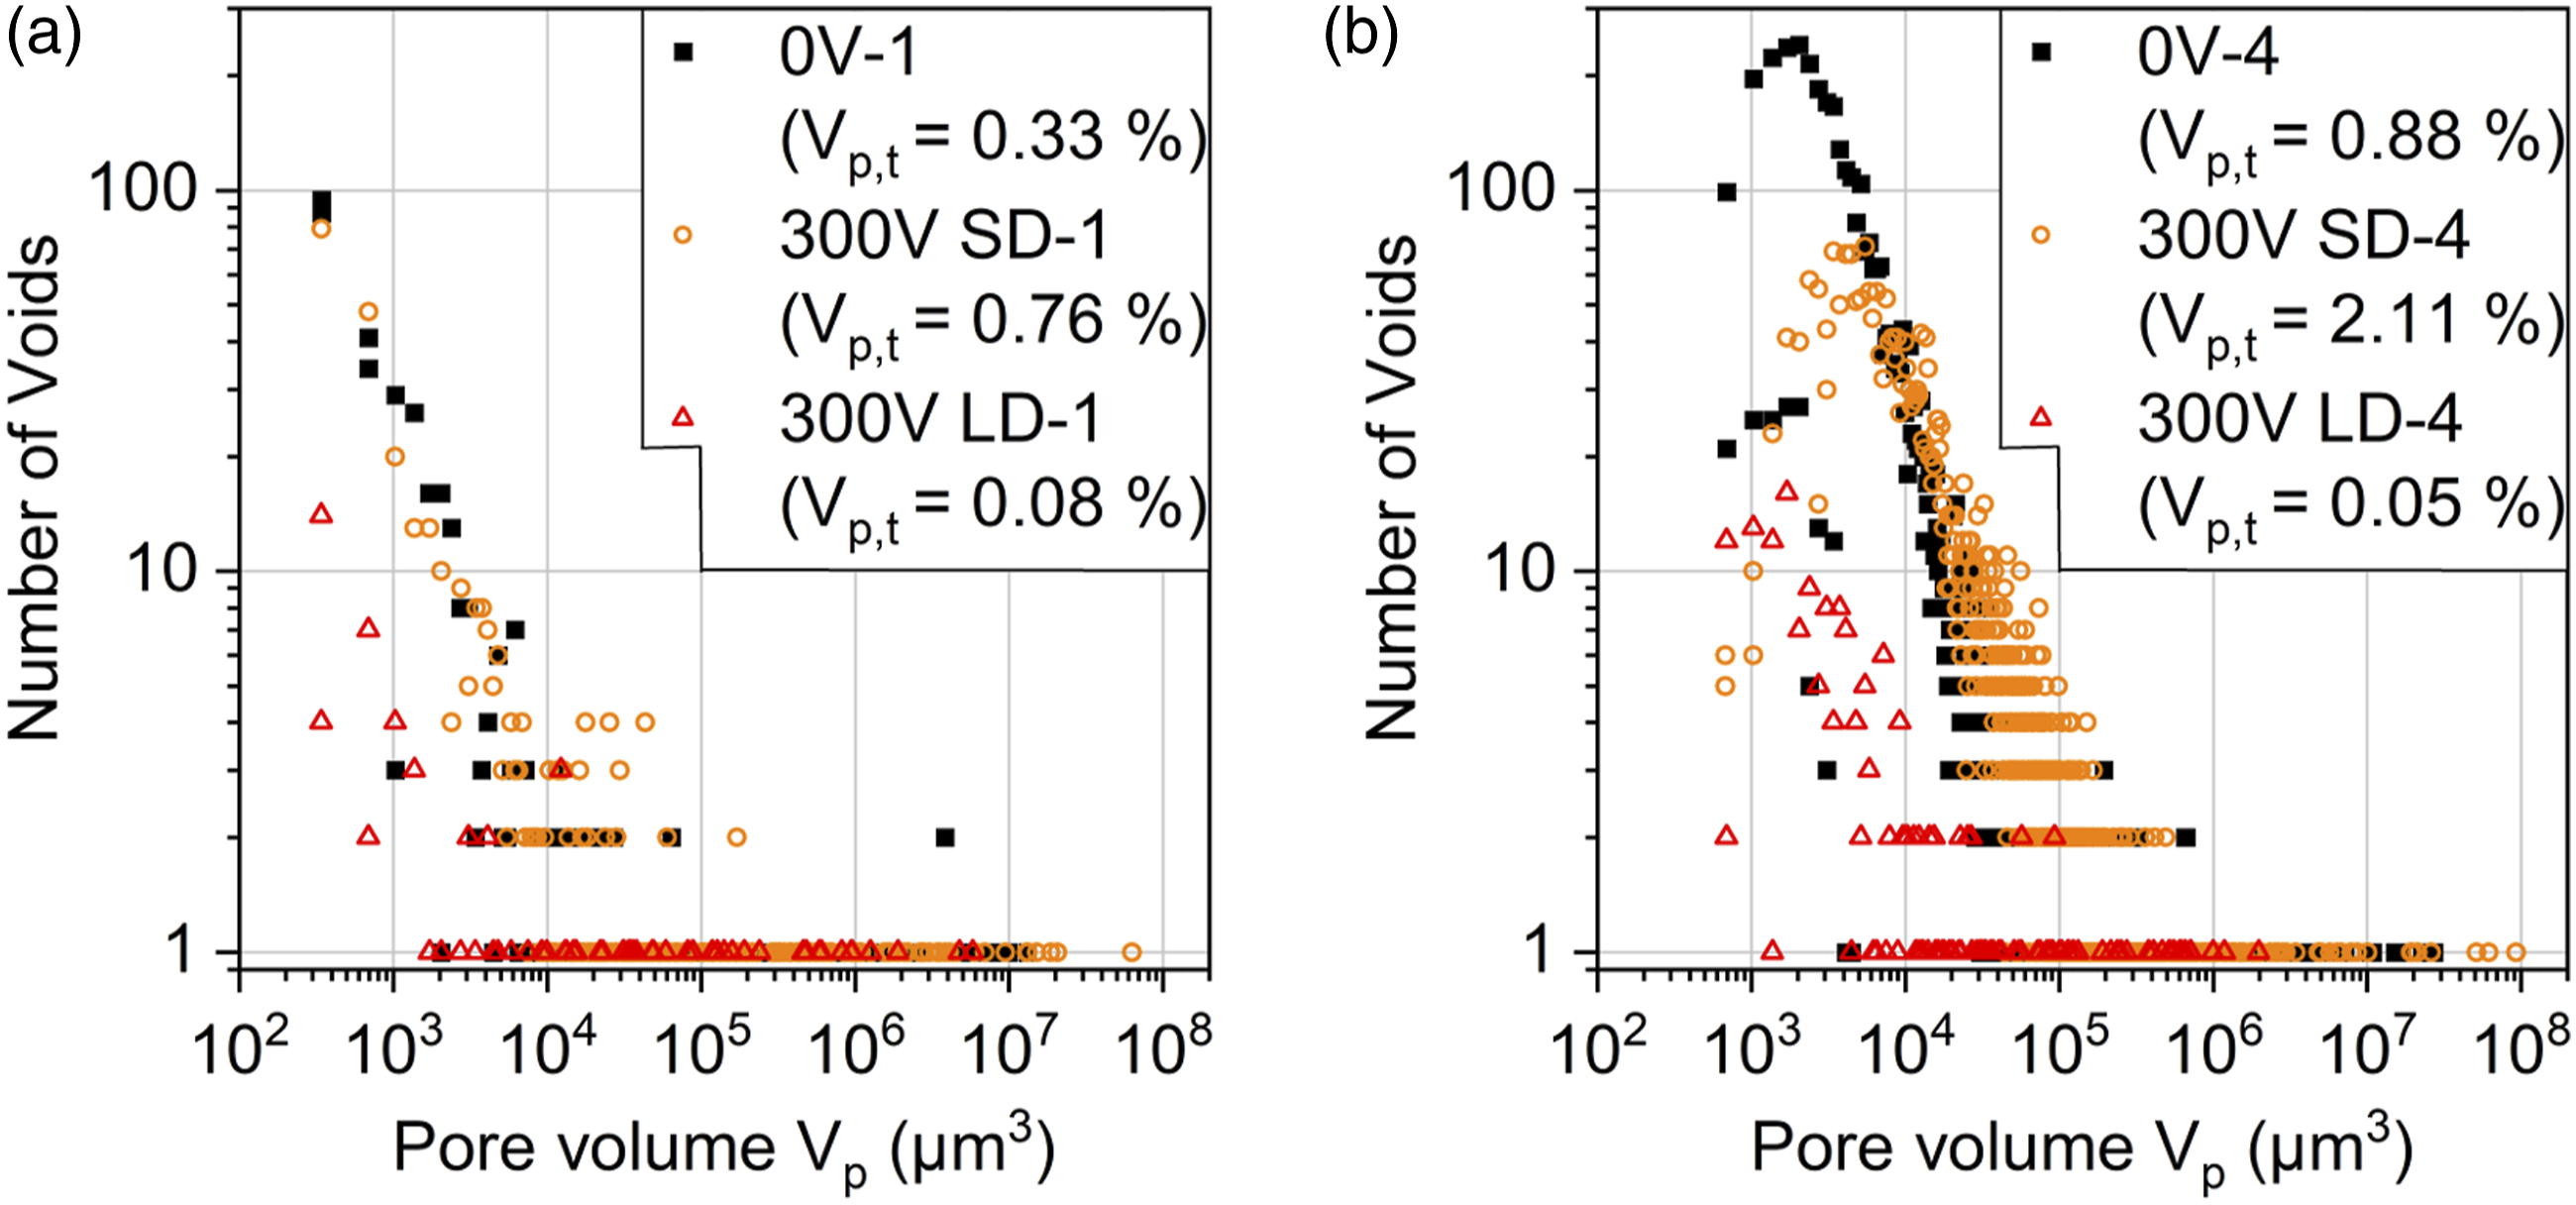
Figure 9 shows the CT-determined volumes of the measuring length with visible pores (highlighted red) for the specimen with the highest measured total pore volume (corresponding to Figure 8(b)). Not just the pore volume, but also the pore distribution is found different between specimens with different alignment voltage: While large local pores are visible for 0 V, especially at areas with fibre bundles crossing, with 300 V SD smaller but increased numbers of pores in-between fibre bundles are present. 300 V LD reduces the pore volume and distribution dramatically, as determined by the measurements shown in Figure 8(b). Therefore, it can be assumed, the orientation of CNF perpendicular to the laminate layers has a positive effect on the laminate curing in terms of air disposal, reducing the pore content both, locally and totally. It has to be acknowledged, that, although taken all precautions during production, also differences in lamination could be the origin of different pore content. Computed tomography detected pores (highlighted red) in CFRP with nanofibres oriented under (a) 0 V (specimen 0 V–2, 0.88% initial pore volume), (b) 300 V SD (300 V SD – 4, 2.11% initial pore volume) and (c) 300 V LD (300 V LD – 4, 0.05% initial pore volume).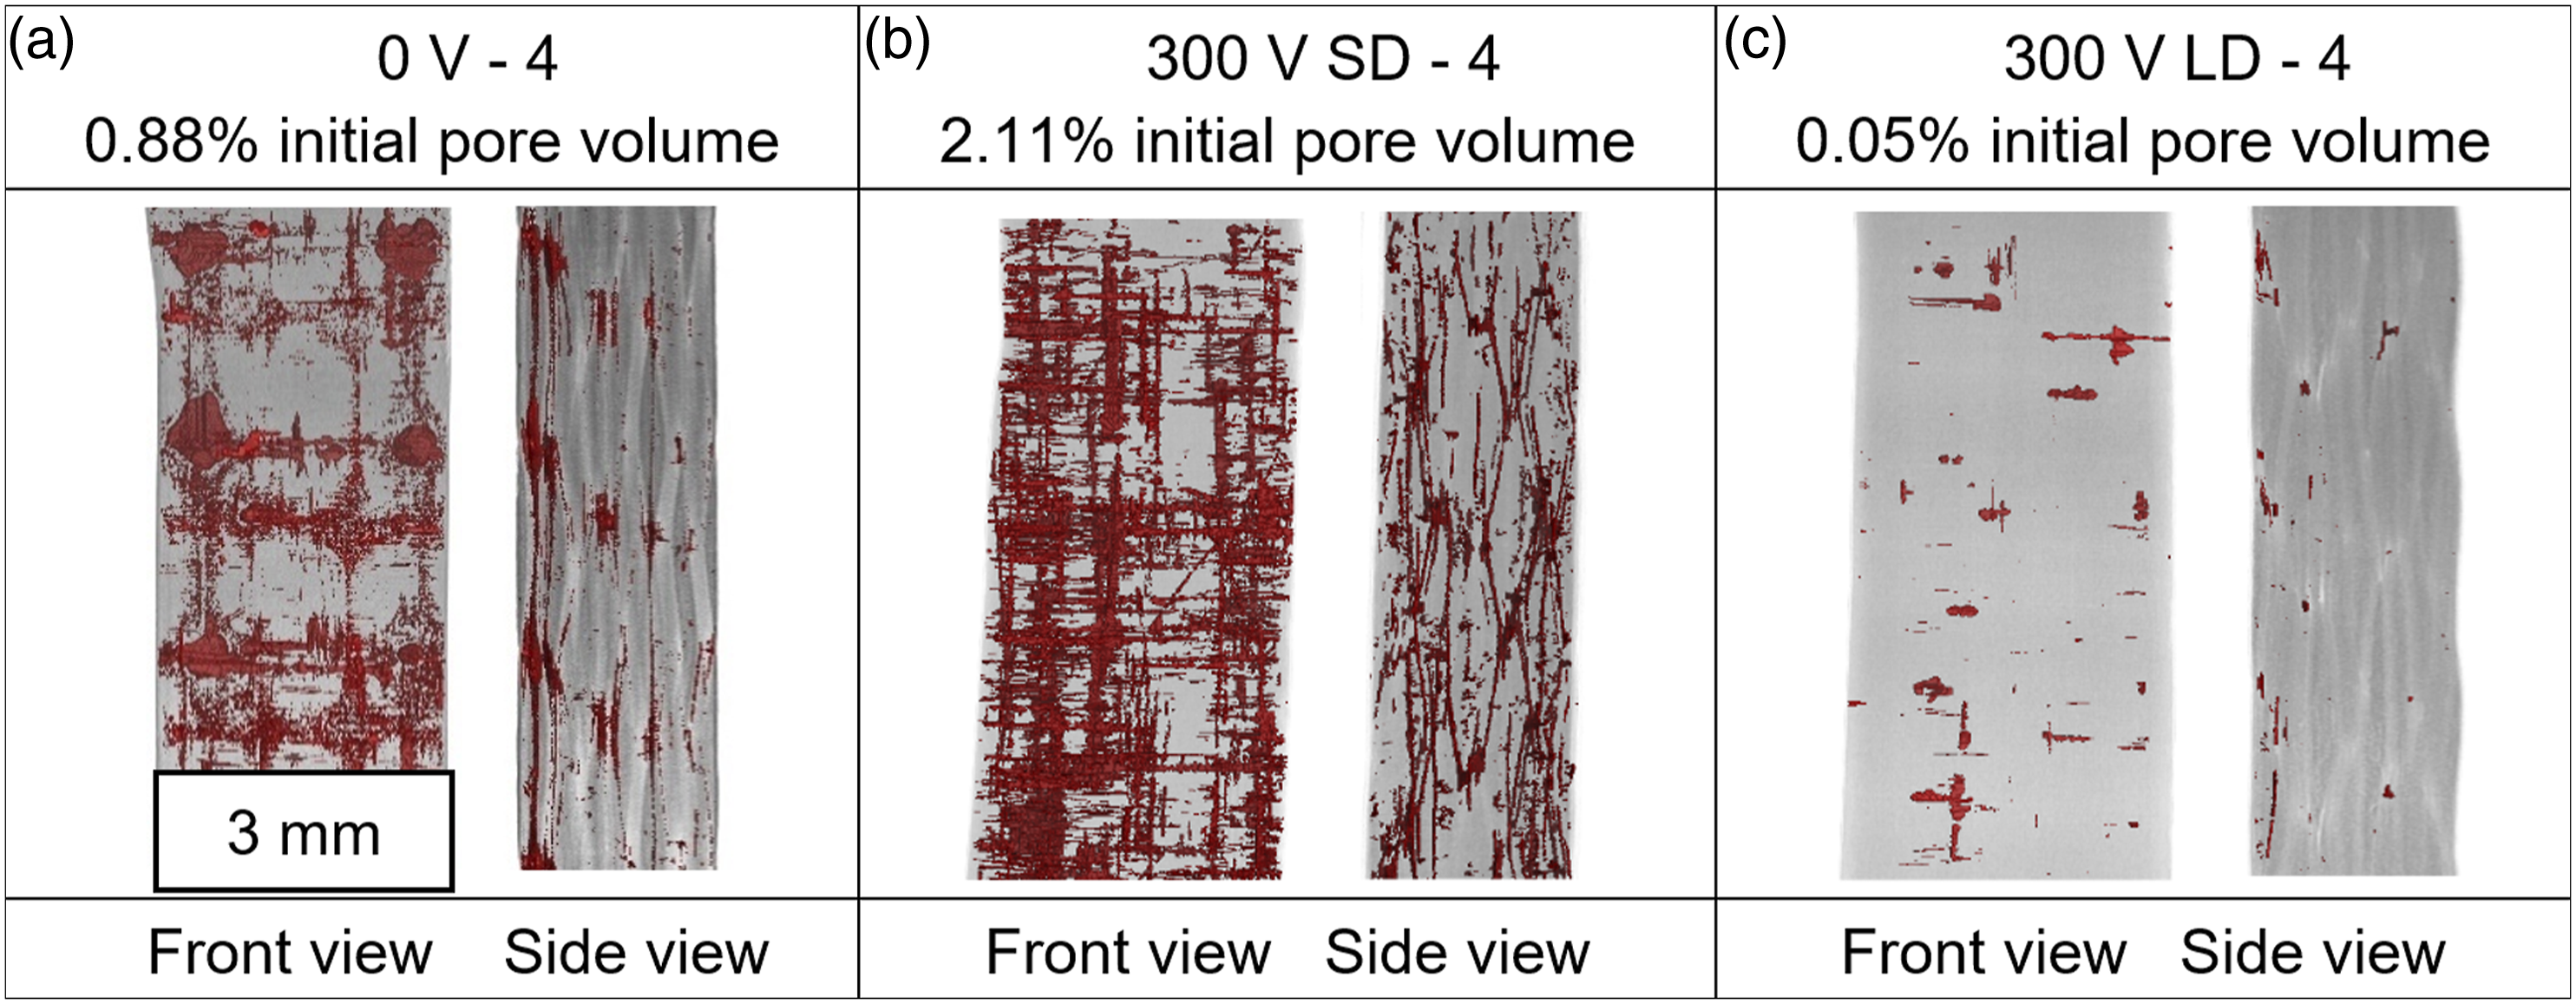
Quasi-static behaviour
Results of quasi-static tests, Young’s modulus E, tensile strength σ, specific strain energy SSE, flexural modulus and strength Ef and σf and the interlaminar shear strength τm.
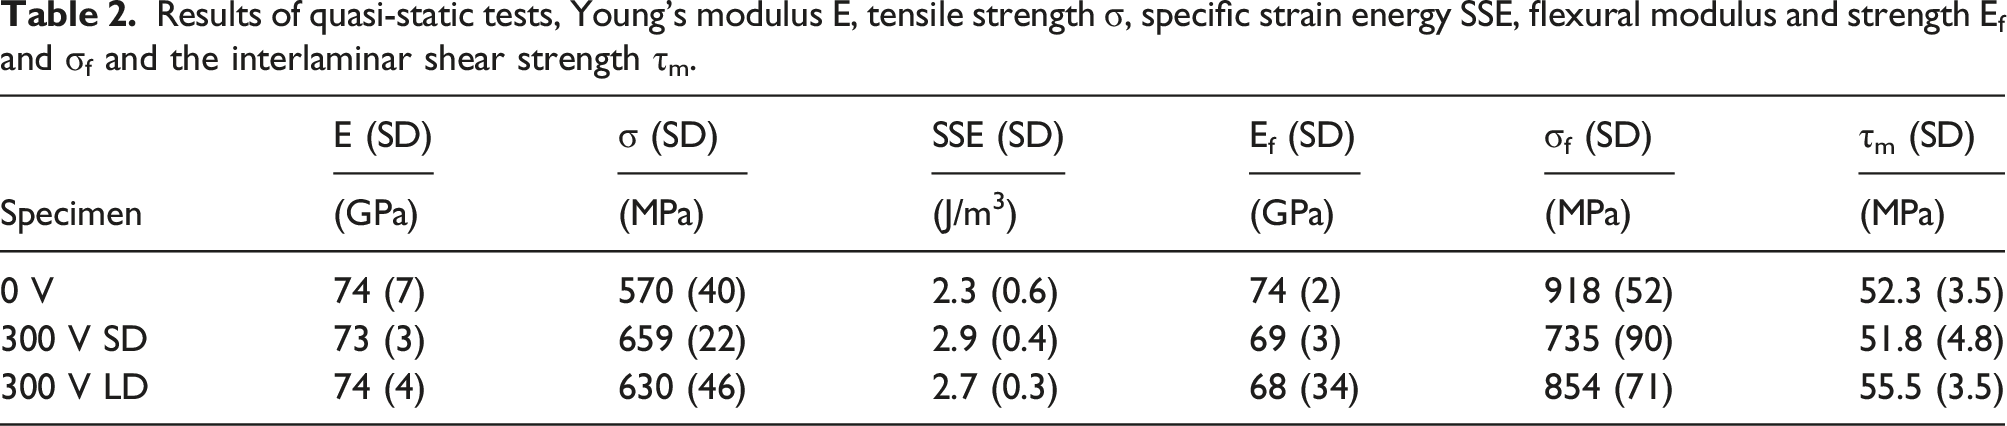
Typical tensile and four-point bending curves for all three specimen types are depicted in Figure 10(a) and (b). While the Young’s modulus stayed unaffected by the orientation of CNF, the tensile strength was significantly enhanced: the strength of (570 ± 40) MPa, measured for the reference specimens increased to (630 ± 46) MPa for the long-time orientation and to (659 ± 22) for the short-time orientation, which is an increase by 11% and 16%, respectively. Also, the elongation at break and thus the specific strain energy (SSE) is increased for both orientation times. The 0 V specimens displayed fractures at about 0.65% strain, and the oriented specimens at approximately 0.8–0.9% strain. Three typical (a) tensile and (b) four-point bending curves with the specific strain energy indicated; for randomly oriented CNF specimens (0 V, black line) and oriented CNF specimens (300 V SD orange line, LD red dashed line).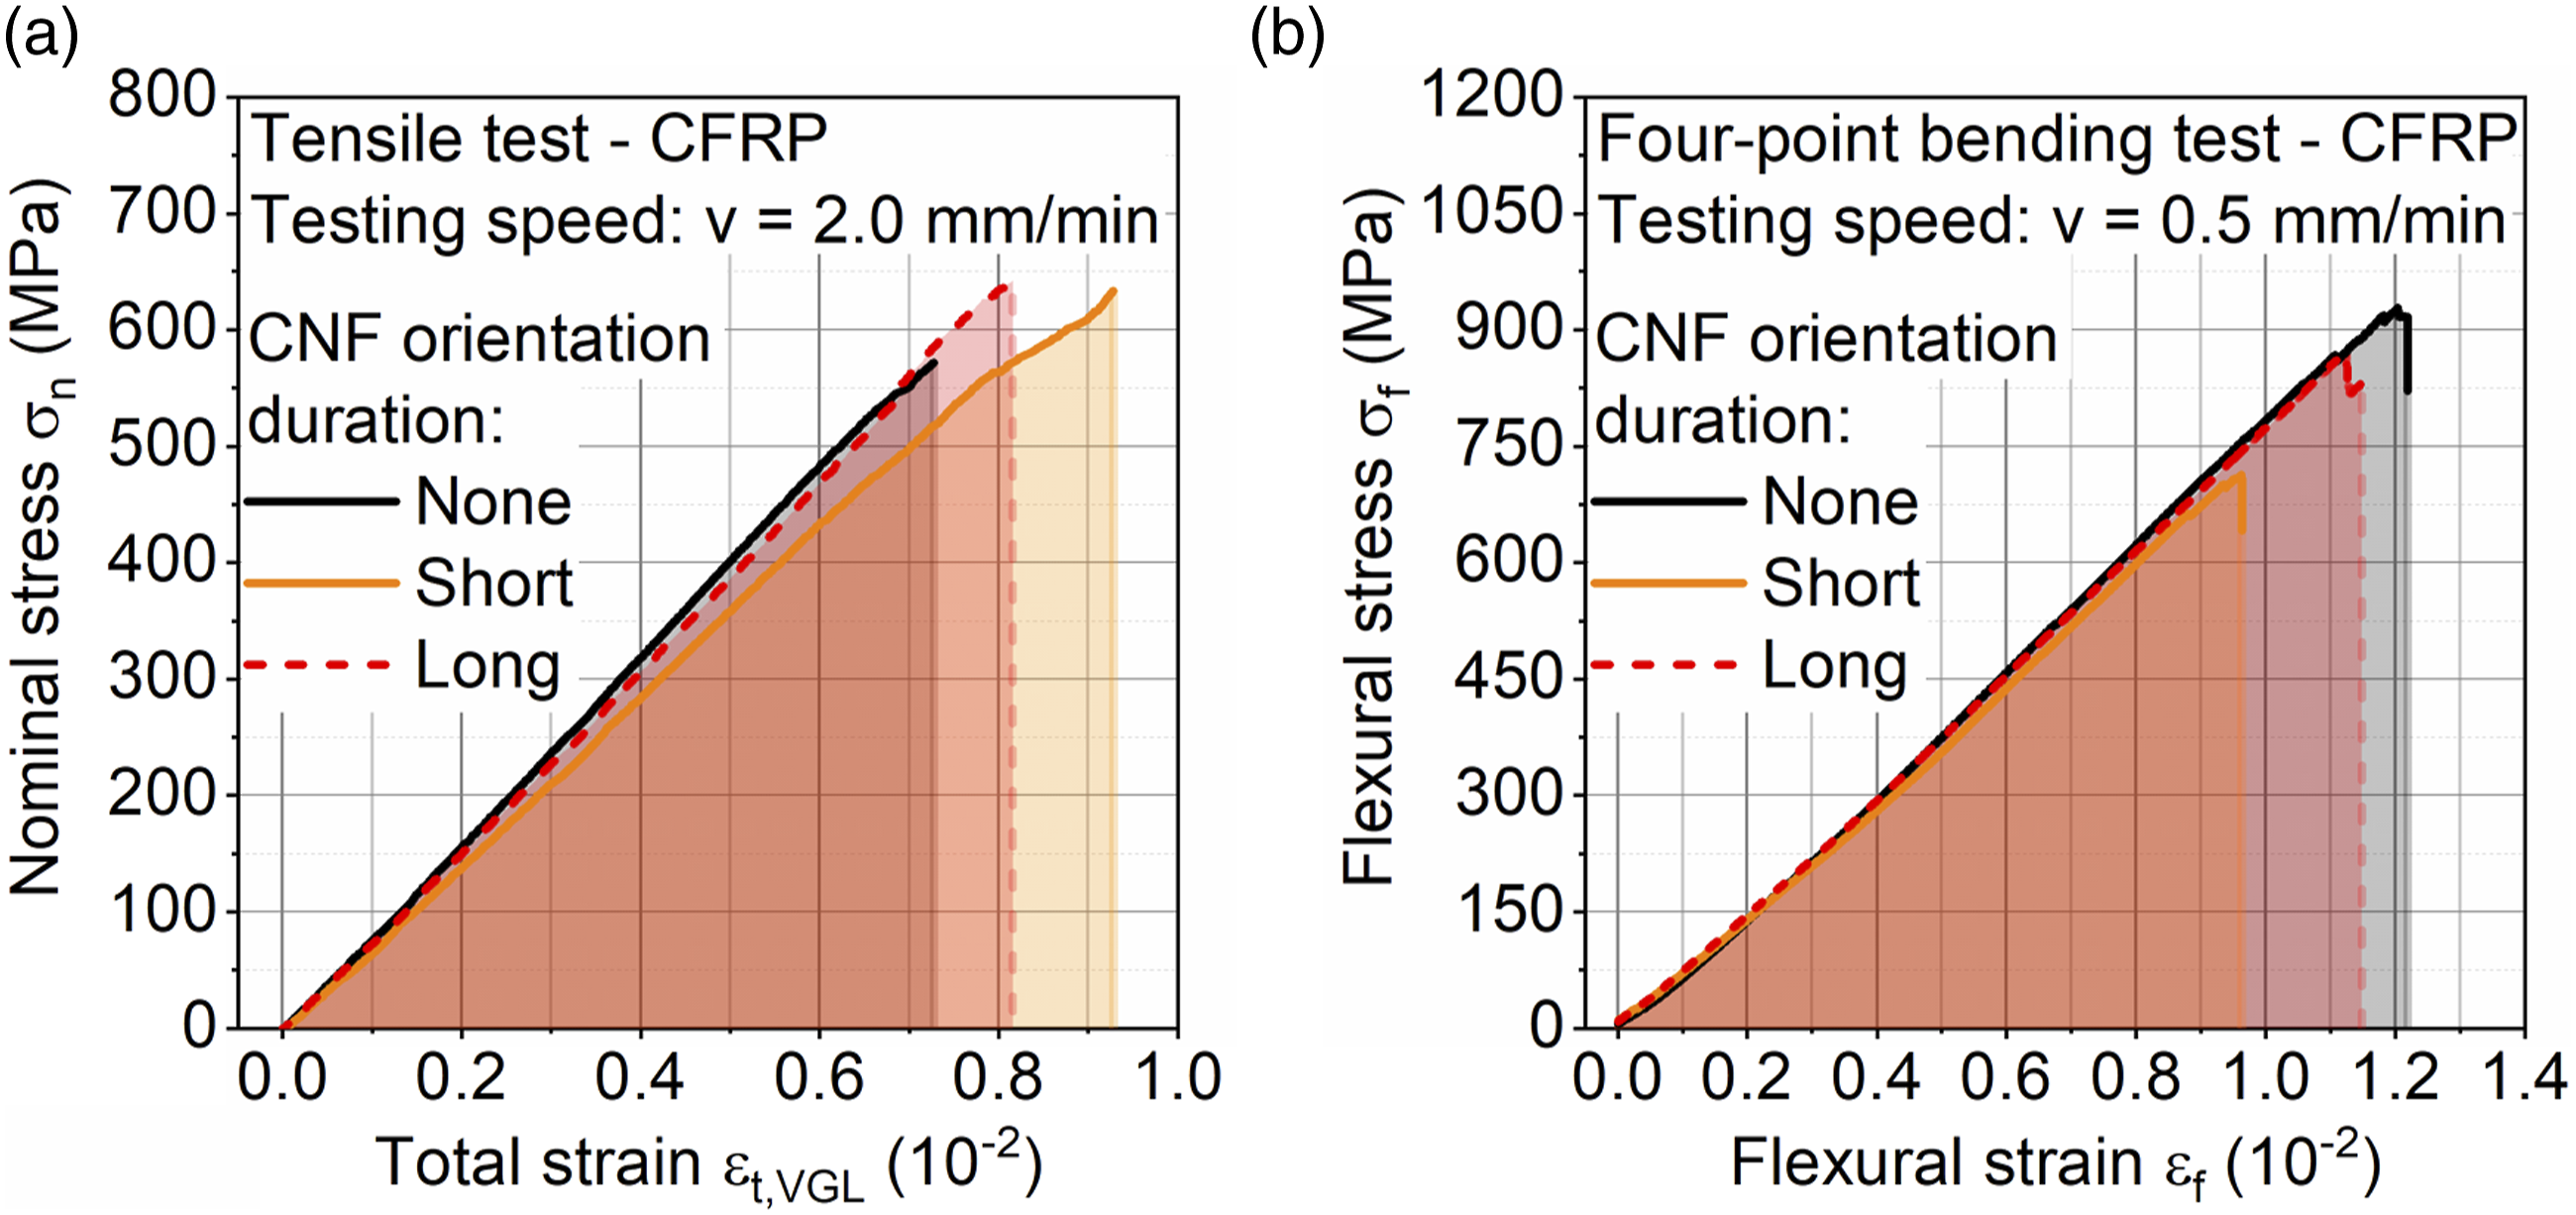
Thus, the orientation of CNF effectively improves the interlaminar binding between the epoxy matrix and the carbon weaves and reduces delamination. In general, the use of nanofiller significantly strengthens the fibre-matrix interface: When under load, the CNF can deflect the arising crack, enhance the crack branching effect, and thus defer delamination of the composite.14,53 The enhanced performance by orienting the nanofibres inside the composite is visible in Figure 10: higher ultimate strength in combination with an improved maximum elongation behaviour before failure occurs.
The flexural modulus and flexural strength both decreased somewhat when CNF were oriented inside the specimen (see Figure 10(b)): Ef decreased by 8% (300 V LD) and 7% (300 V SD) and σf was reduced by 7% (300 V LD) and 20% (300 V SD). Taking the error into account the decrease can be measured but is hardly significant for the 300 V LD specimen. The reduction of the flexural strength of the 300 V SD specimen can be explained by the higher initial pore volume compared to the other specimen. In four-point bending tests, plastic deformation and failure occur mainly due to arising shear forces and fibre buckling.
54
Thus, especially after leaving the elastic regime, fibre-buckling is the pre-dominant mode, where the orientation is not important anymore.
34
Additionally, Figure 11 shows the tangential strain distribution for the 0 V (Figure 11(a)), the 300 V SD (Figure 11(b)) and the 300 V LD specimen (Figure 11(c)) during the four-point bending test for the same experienced deflection of 2 mm. The four-point bending curves shown in Figure 10(b) relate to the same specimens depicted in Figure 11. It can be seen that different specimens show similar stress–strain behaviour under bending. Combining this with the values for flexural modulus and flexural strength (Table 2) the influence of the initial pore size is much more decisive for the quasi-static bending behaviour than the orientation of CNF inside the specimen. Tangential strain distribution (x-direction) in (a) 0 V, (b) 300 V SD and (c) 300 V LD bending specimen at 2 mm deflection. Scale colour-coded relative to major strain, red indicating tensile load, blue indicating bending load.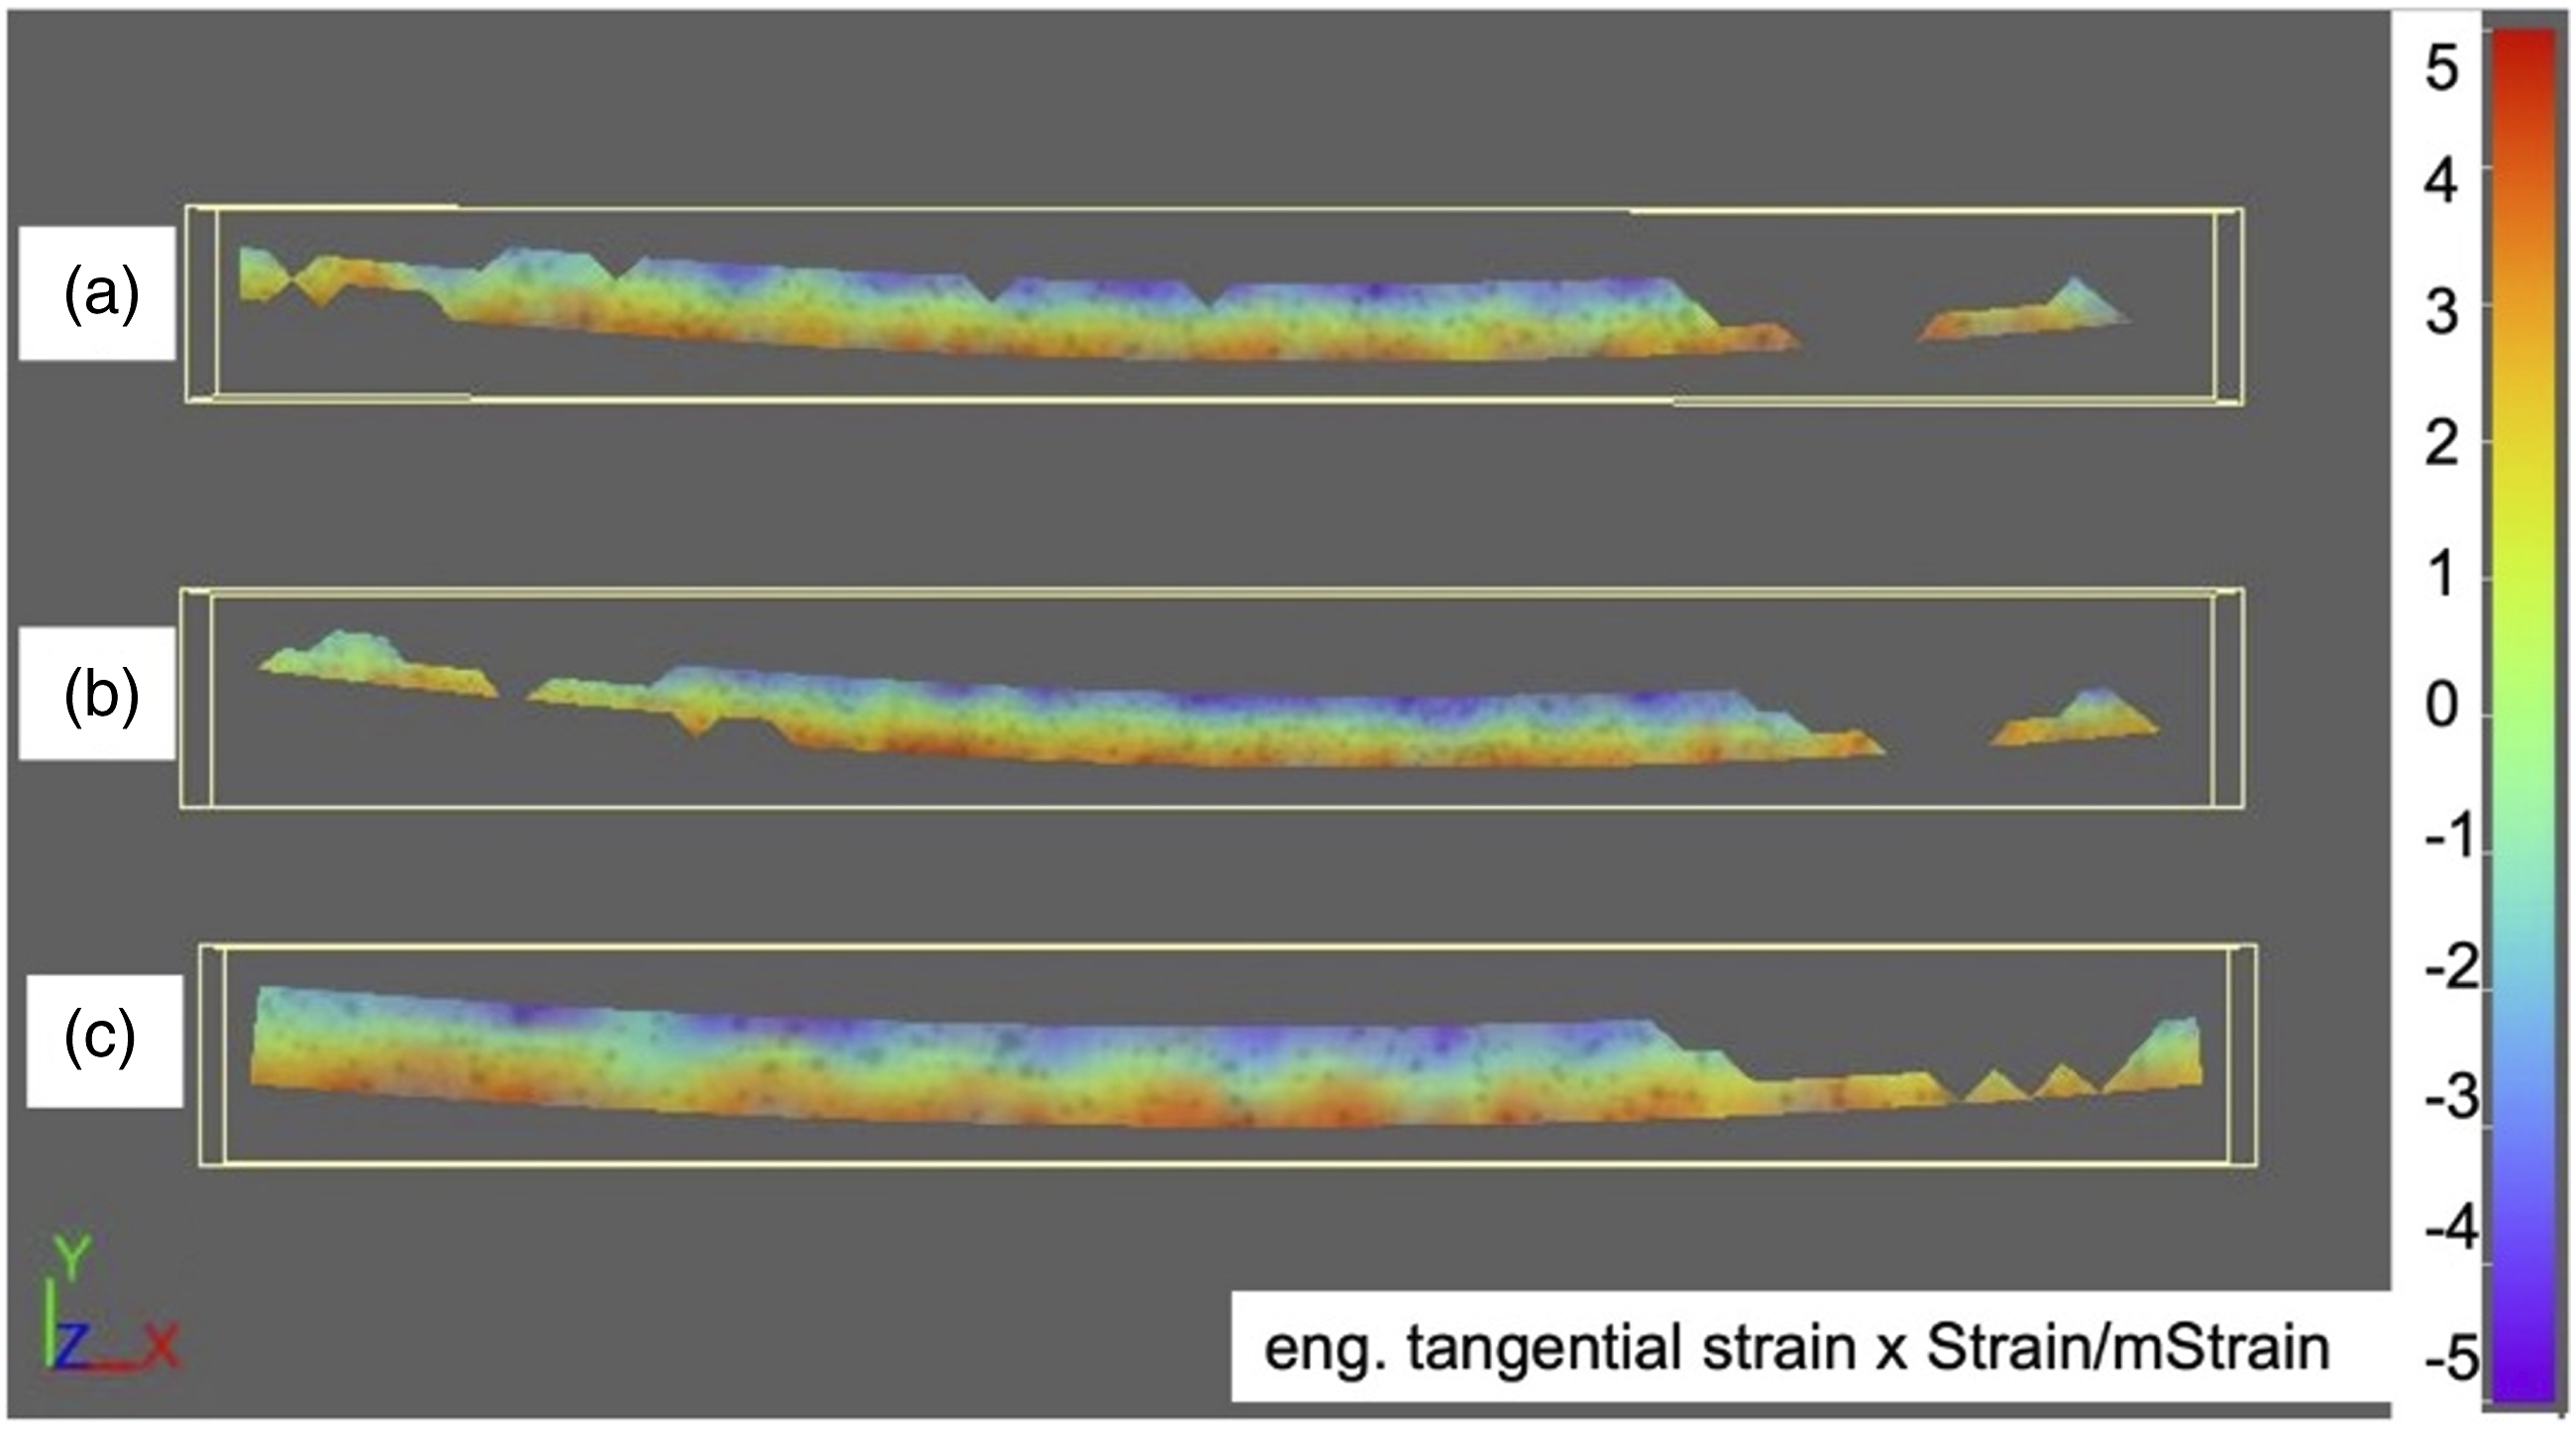
Similar results for reinforced CFRP concerning the enhancement of mechanical properties were found in various studies: Iwahori et al. used CNF to enhance the properties of CFRP and found increased values for tensile strength, but a reduced elastic modulus. In contrast to our study, both, flexural modulus and strength were increased, but it has to be mentioned that Iwahori et al. used very high filler grades i.e., 5 and 10 wt%, respectively. 55
ILSS measurements showed similar values for all specimen types, taking the measurement error into account (Table 2). Although not significant, we found slightly increased values for 300 V LD (+6.2% to 0 V) and almost identical values for 300 V SD (−0.9% to 0 V) with respect to the 0 V specimen. One could expect a slight increase of ILSS also for the 300 V SD, but the 300 V SD showed the highest initial pore volume of all specimens (0.76%–2.11%), which would decrease the ILSS. This assumption is strengthened by the findings of Costa et al.: They analysed CFRP with different pore volumes (up to 5.6%) and found a decrease in the interlaminar shear strength with increasing pore volume ranging from 13.1% to 43.7% compared to the reference specimen. Further, they stated that the ILSS is decreasing only for a pore volume above 0.9% for CFRP laminates. 56 In our study, the 300 V LD and the 0 V specimen had pore volumes of 0.05%–0.08% and 0.33%–0.88%, respectively with both showing values beneath this threshold. These considerations indicate a possible strengthening of the 300 V SD by the oriented CNF, compensating for the higher pore volume. The increase in ILSS for the 300 V LD can be connected to the orientation of the CNF also.
Similar results were found for CNF-oriented specimens considering the ILSS enhancement: He et al. proposed a way to orient CNT and CNF via a multilayer resin film infusion-compressive moulding process with varying Z-infusion time. Increased values were found for ILSS for CNT- and CNF-specimen, but for the latter not significantly compared to the unoriented specimen (ILSS with oriented CNF increased by 4.3% compared to unoriented). This was explained by the higher degree of orientation, the more homogeneous dispersion of CNT and the better interfacial bonding of CNT to the epoxy matrix, compared to CNF. 33
Thus, the following can be concluded: Similar pore volume beneath a certain threshold leads to an increase of ILSS, whereas specific strain energy and ultimate strength were enhanced due to the orientation of the CNF regardless of the pore volume.
Fatigue behaviour
MAT were used to evaluate the testing setup about the sensitivity considering material reaction and to get an impression of the nanofibre orientation-dependent fatigue performance. Figure 12(a) shows an exemplary test result. The change in resistance (R/R0) and stiffness development (Cdyn/Cdyn,0), initial values denoted with lowercase zero, show a good correlation and can be attributed to specimen elongation and damage. The DIC-based deformation measurement and derived total strain values are consistent with these observations and show the potential of the used methodology in terms of structural health monitoring. At maximum stress of about 300 MPa, significant changes in microstructure are visible, indicating increasing damage development. Figure 12(b) shows the MAT numbers of cycles to failure (Nf) for the alignment voltages of 0 V, 300 V SD and 300 V LD. Results show that with increasing alignment voltage and duration the fatigue strength increases. Even though 300 V SD features higher pore volume compared to 0 V, the orientation still increases the fatigue life. (a) Multiple amplitude test (MAT) on CFRP with nanofibres (specimen 0 V-1). Measurement of electrical resistance, stiffness and total strain measurement. (b) MAT fatigue strengths of CFRP oriented with nanofibres under 0 V, 300 V SD and 300 V LD (specimens 0 V - 1, 300 V SD -1 and 300 V LD -1).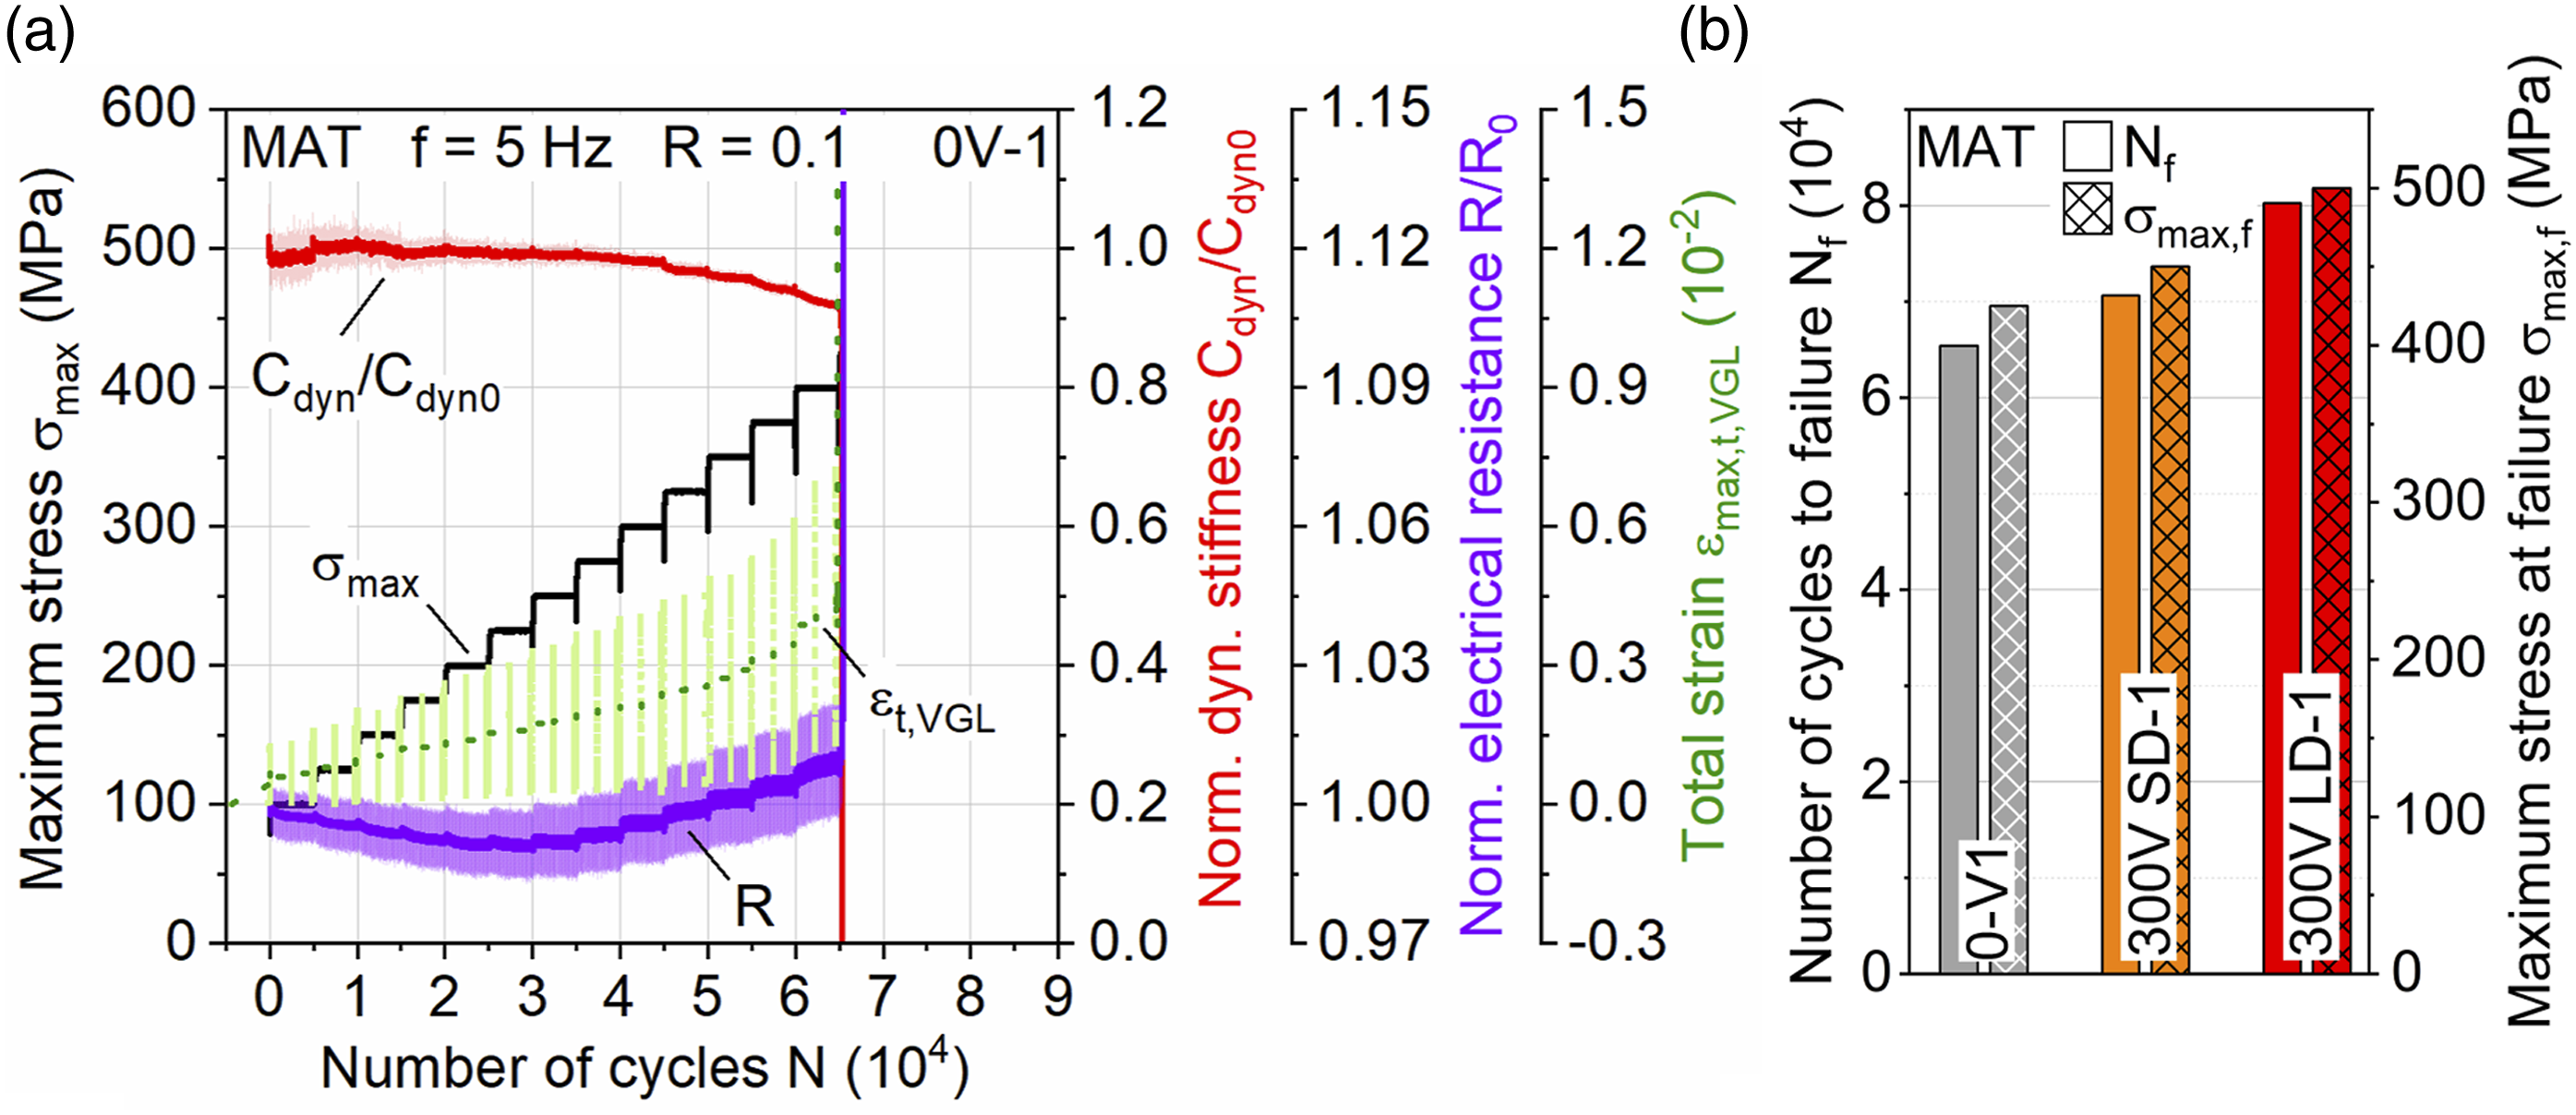
Considering the larger changes in microstructure starting at maximum stress of about 300 MPa, CAT were conducted at this stress level up to 5 × 10⁴, 5 × 10⁵ cycles and 2 × 10⁶ cycles to compare the material reactions under constant load amplitude and to subsequently examine the damage evolution using in situ CT. Figure 13(a) and (b) show the test results for 0 V and 300 V LD alignment voltage, respectively. As for the MAT, detection of the material reactions is possible by resistance measurement and the correlation to the stiffness reduction is given. For 0 V stronger and longer-lasting stiffness reduction, as well as resistance and elongation increase, can be seen compared to 300 V LD, confirming that the CNF orientation improves the overall fatigue performance. Similar to39,47 for 300 V LD an initial drop in electrical resistance is measured, after which it increases. This is not visible for 0 V, which is attributed to the higher initial stiffness decrease related to higher damage accumulation, overwhelming the self-alignment of the material’s conductive network with new electrical fibre contacts forming after initial interlaminar matrix cracks.39,47 While the latter cannot be microstructurally proven with the results gained in this study, the afterwards continuous increase in electrical resistance until failure can be related to damage accumulation, as the following CT analysis results show. Constant amplitude tests on CFRP with nanofibres under (a) 0 V (specimen 0 V-1), (b) 300 V LD (300 V LD-1).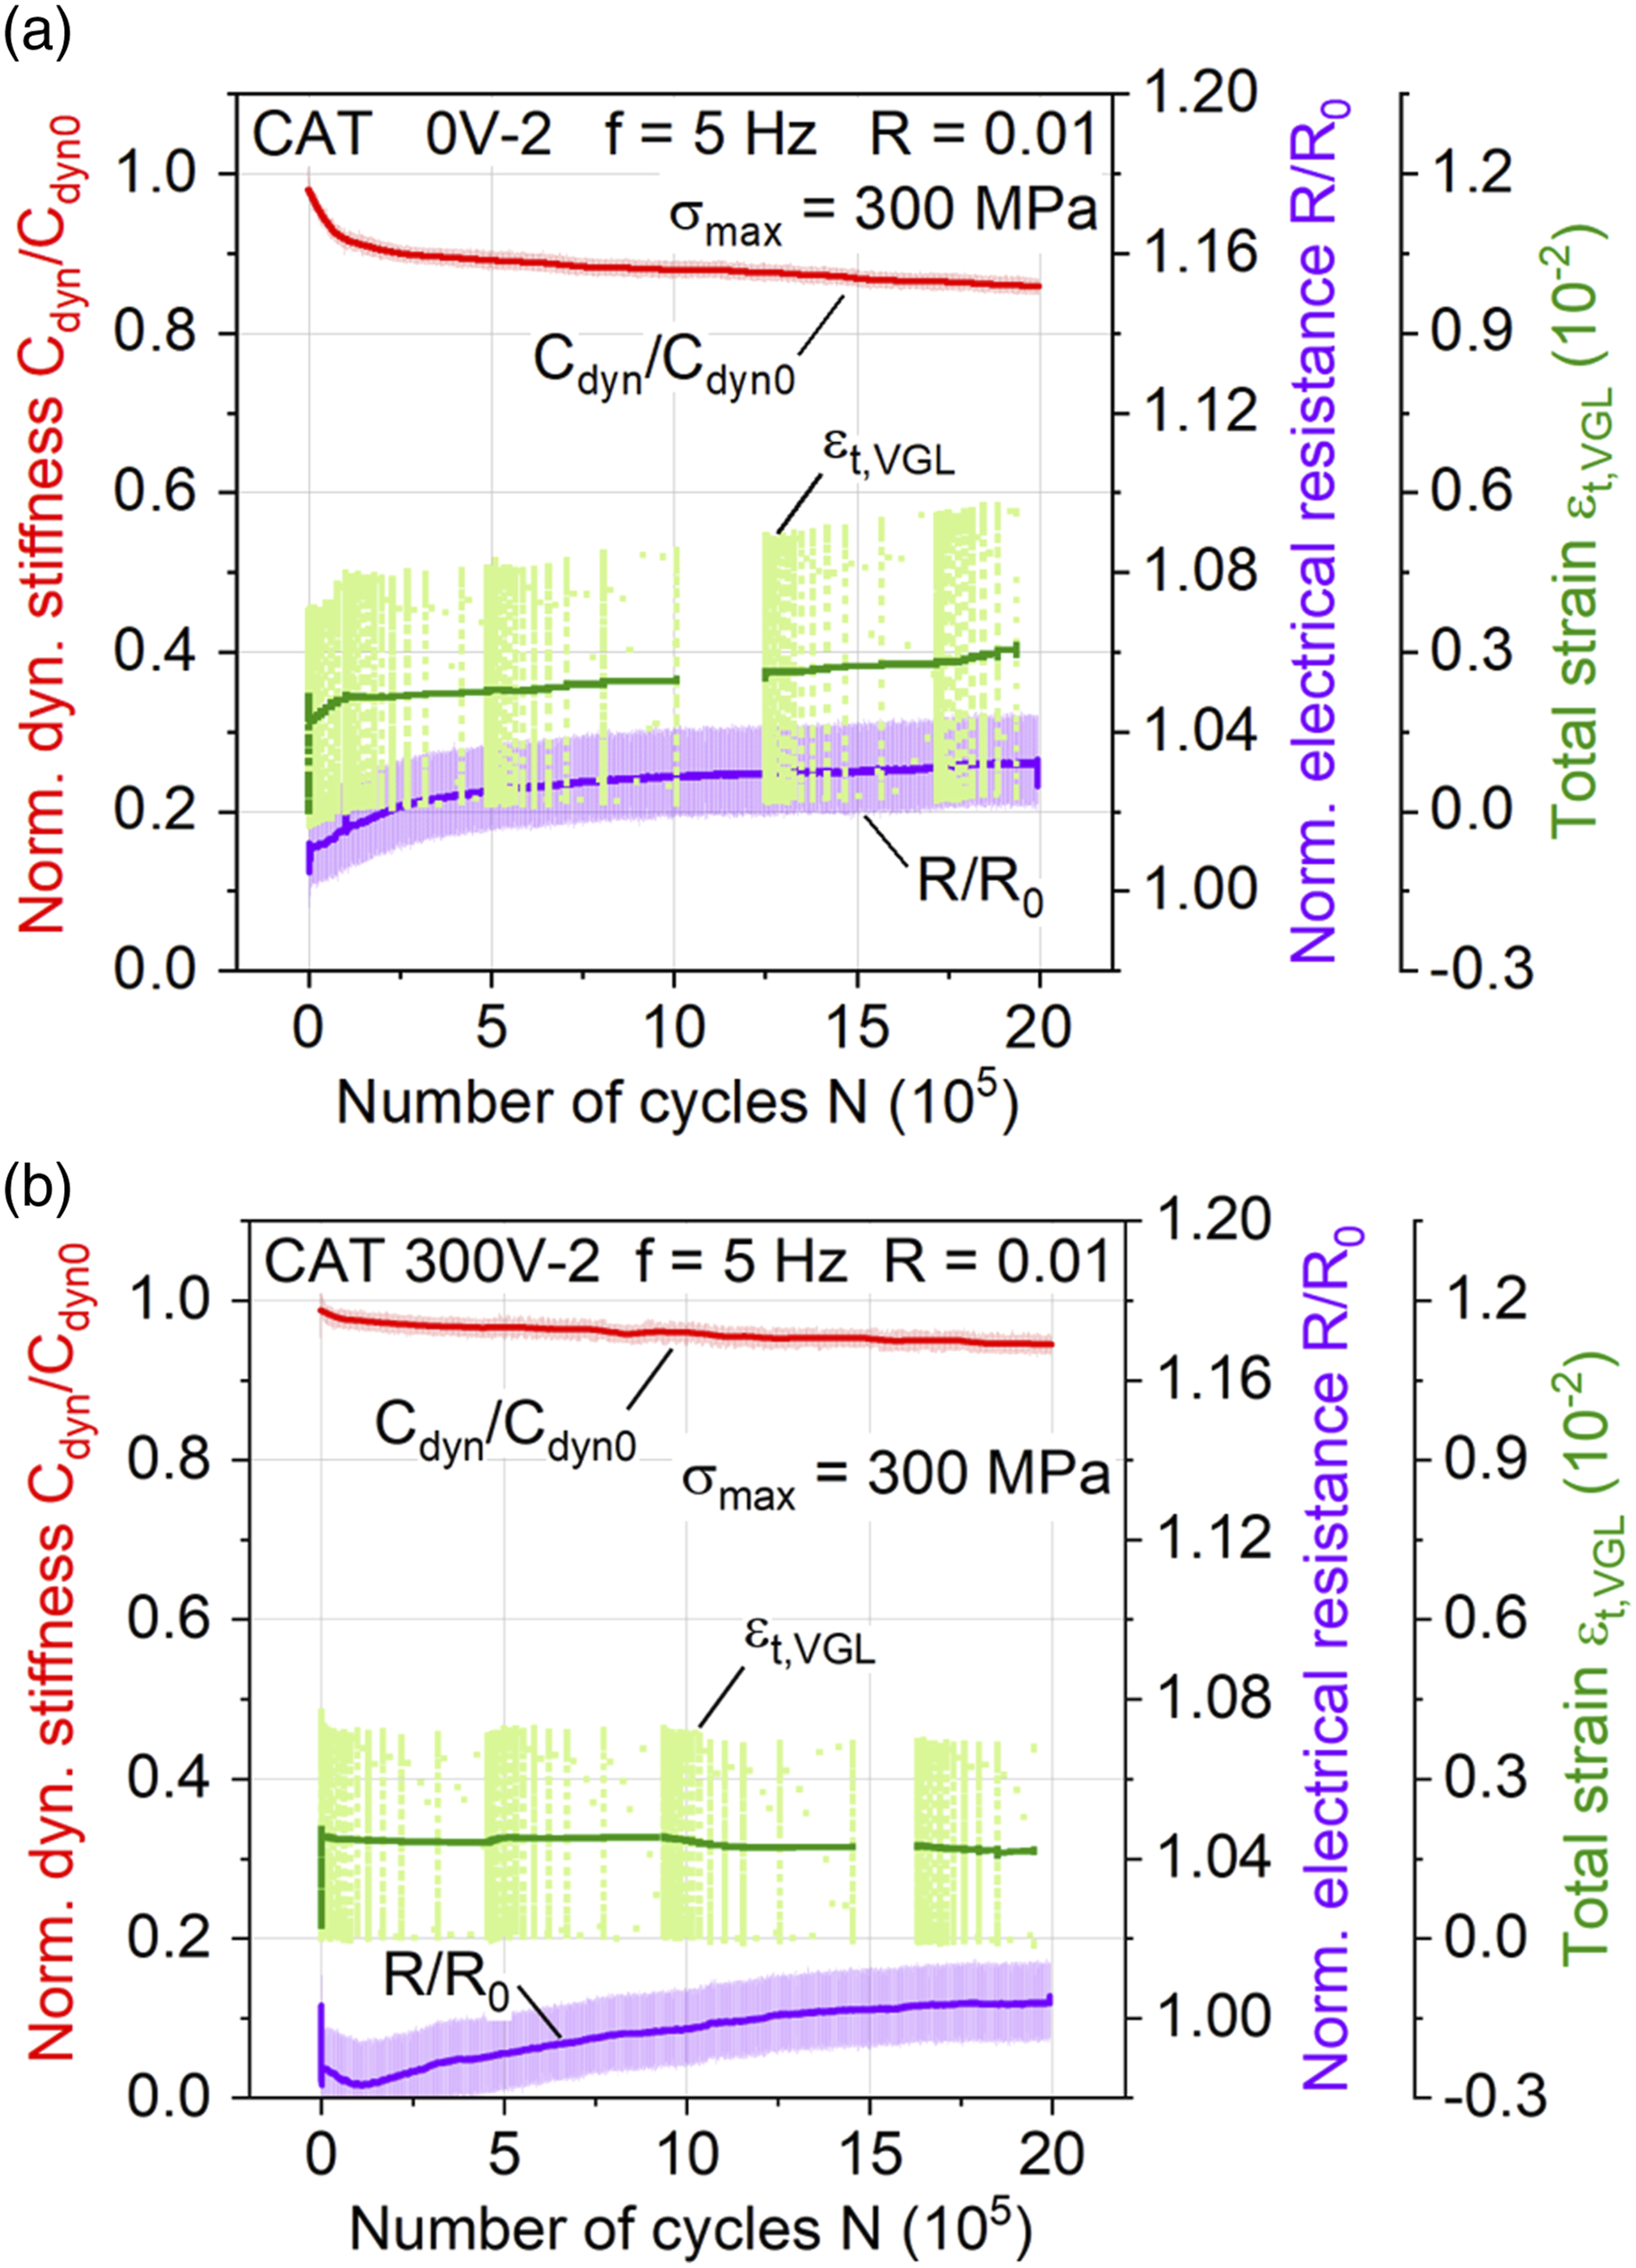
Figure 14 shows the strain distribution and crack formation on the front of the 0 V specimens determined by DIC immediately before the test stop as well as the corresponding defect volumes and distributions detected by in situ CT for the front and side view. Figure 15 shows the defect volumes and distributions detected by in situ CT for the front and side view of 300 V LD specimens. Considering the CFRP without CNF alignment (0 V) the evolution of the local strain detected by DIC, including crack development, can be transferred to the detected damage determined by in situ CT. The decrease of the initial stiffness results from intermediate fibre cracks in the 90° fibre direction, which widen and develop into delamination with subsequent fatigue cycles. This is in accordance with the cellulose nanofibre-reinforced CFRP investigated by.
44
DIC measured strain on the specimen and CT measured defect volume visualised as an overlay from the specimen front and side for 0 V alignment voltage (a) N = 5 × 10⁴, (b) N = 5 × 10⁵, (c) N = 2 × 10⁶. CT measured defect volume visualised as an overlay from the specimen front and side for 300 V LD: (a) N = 5 × 10⁴ (b) N = 5 × 10⁵ (c) N = 2 × 10⁶.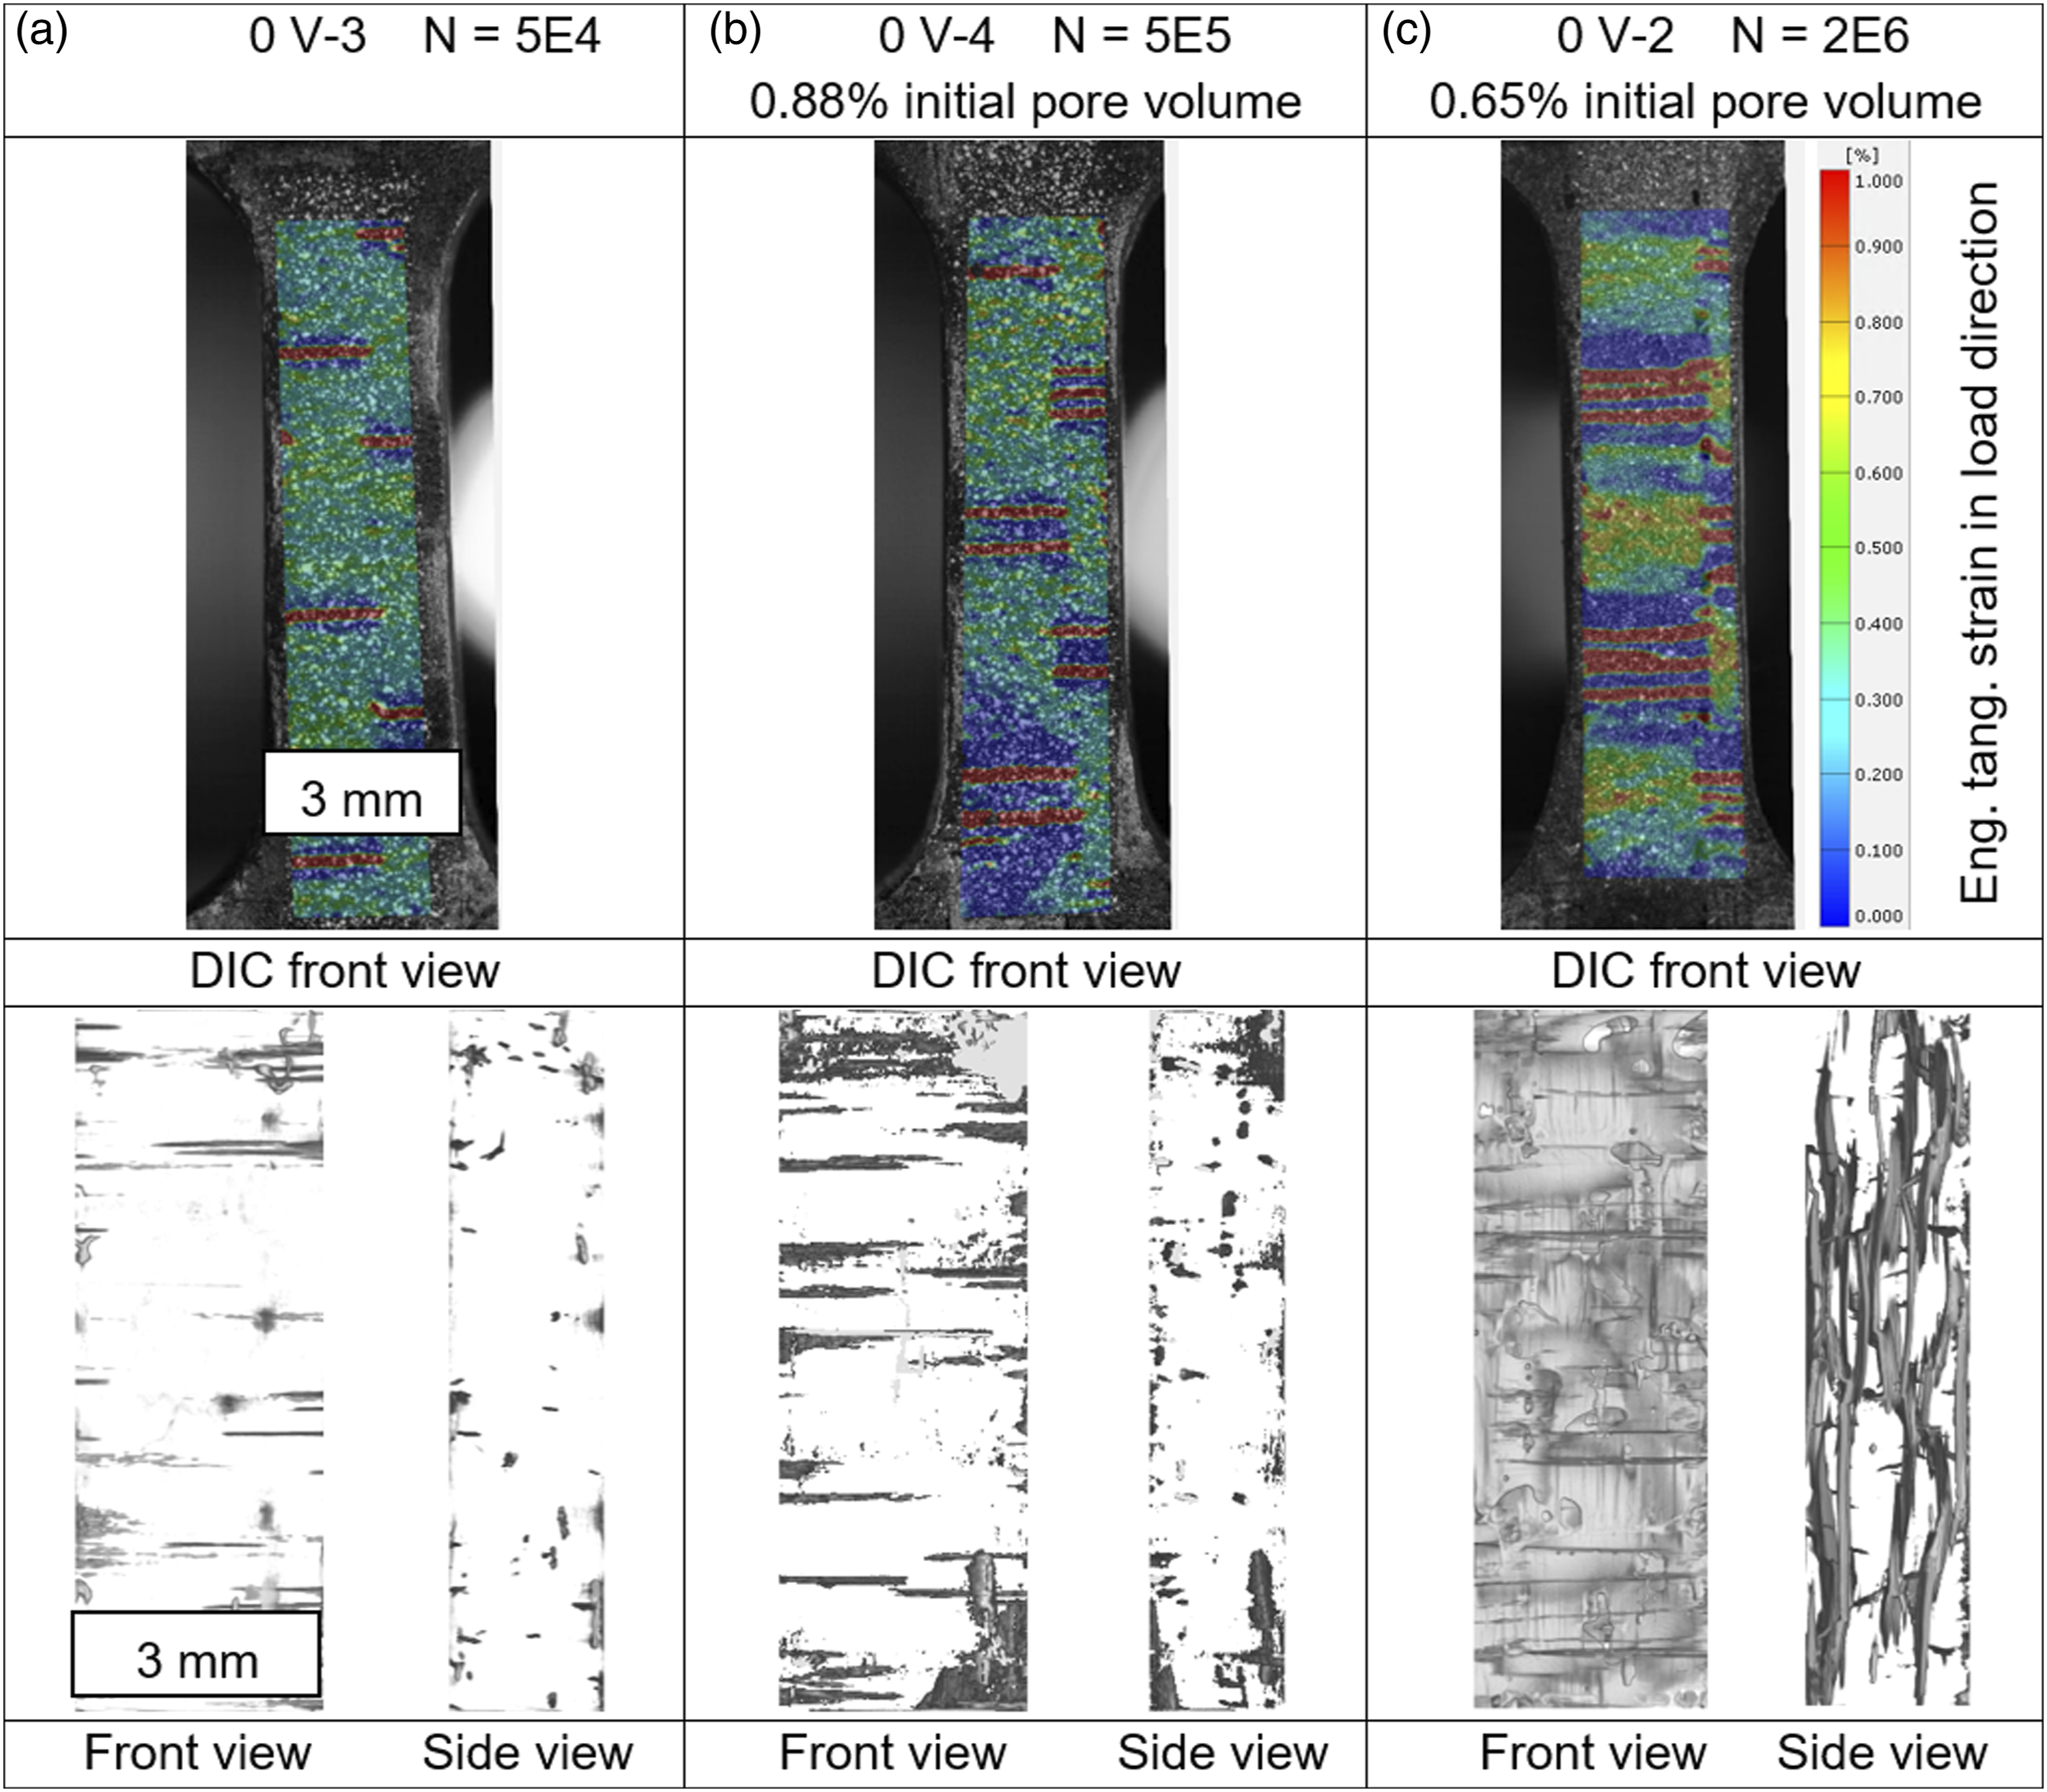
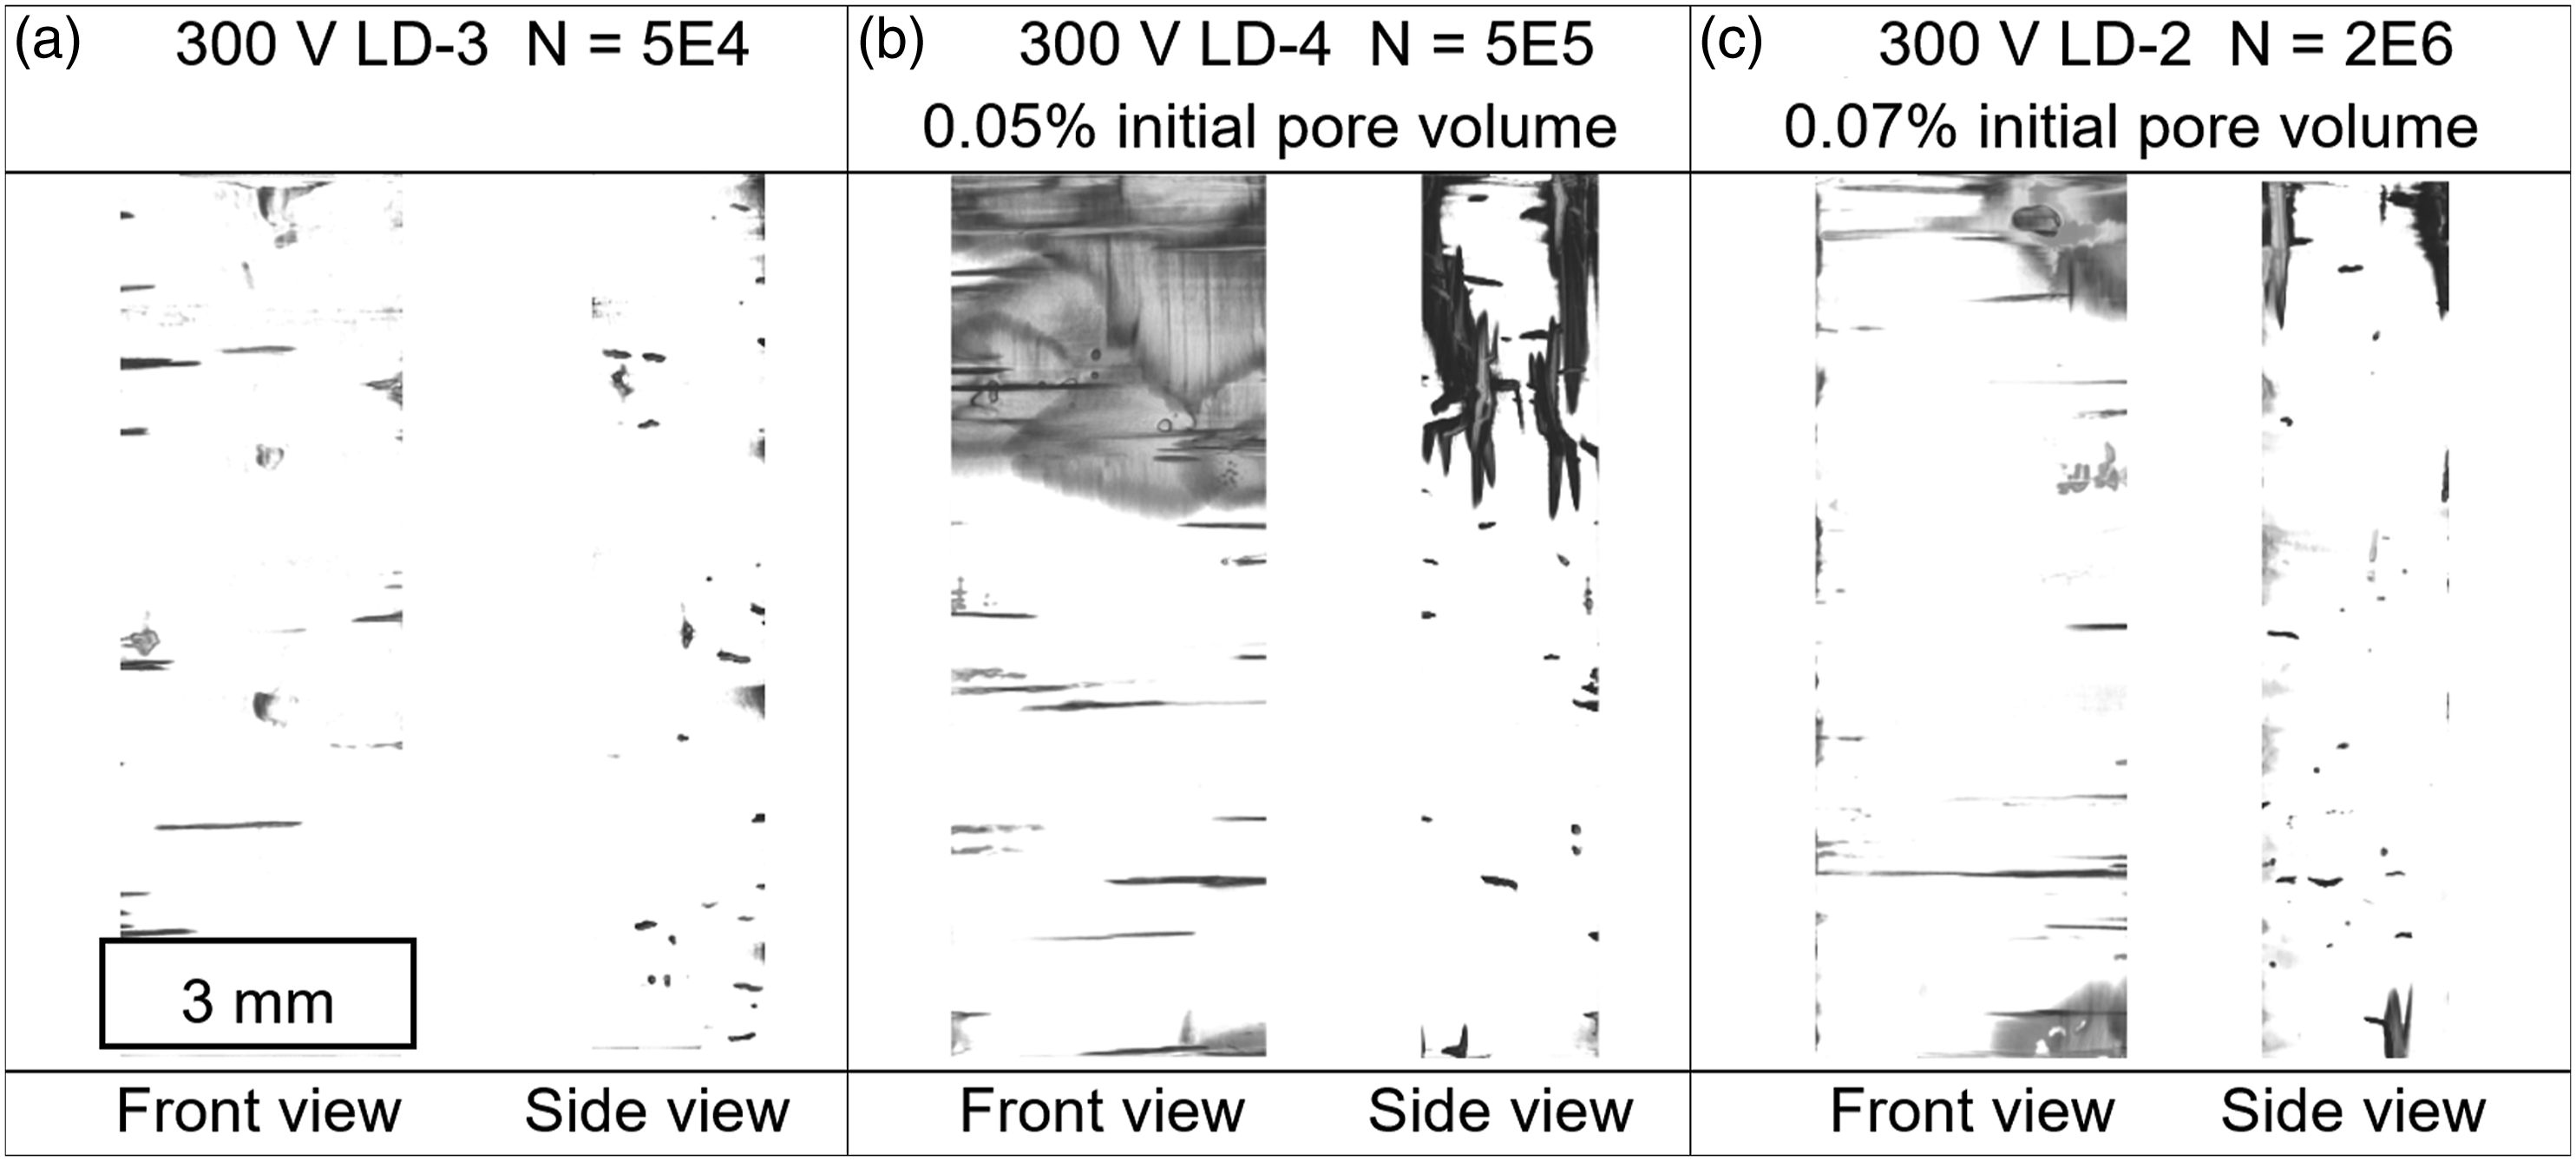
The orientation of the nanofibres, using 300 V LD alignment voltage, provides noticeably lower damage occurrence (Figure 15), proving the impressions gained over the measured microstructural changes (lower and slower stiffness decrease). Both the number and extent of inter-fibre cracks are reduced, showing a deceleration of crack development and postponed delamination compared to 0 V. Therefore, the results from 46 generated with double cantilever beam testing, which revealed increased fracture and fatigue resistance due to CNF orientation perpendicular to load direction, seem to be partly transferrable.
Conclusions and outlook
These conclusions can be drawn from the investigations on the effect of carbon nanofibre orientation on fatigue properties of carbon fibre-reinforced polymer:
The application of an electrical field for different durations leads for both specimens to the orientation of the CNF, both for short exposure and for long exposure to the electrical field. The orientation was qualitatively shown by scanning electron microscopy where the alignment of single nanofibres inside the CFRP was analysed. The effect of orientation on static relative permittivity was shown. To analyse the quasi-static mechanical behaviour of oriented CNF in CFRP several tests were performed. Depending on the initial pore volume, the orientation of nanofillers leads to enhanced quasi-static mechanical properties: the interlaminar shear behaviour and the strength under tension were (dependent on the initial pore volume) improved and thus the possible occurrence of delamination was reduced or slowed down for similar pore volumes, respectively. For flexural properties, the initial pore volume is the major criterion for failure, even when the nanofillers are oriented to strengthen those properties, while tensile properties are rather unaffected by the pore volumes and are significantly improved by CNF-orientation. Thus, the mechanical performance of CFRP with a certain amount of pores can still be enhanced by nanofibre alignment.
To assess the influence of oriented nanofibres in the matrix material of CFRP considering fatigue properties for cyclic tension–tension load, a fatigue testing procedure was successfully applied. With the use of electrical resistance measurement and digital image correlation, the onset and development of microstructural damage were detected under fatigue load. Computed tomography enabled the determination of initial pores and evaluation of mechanically introduced damage evolution. Significant differences could be identified between the orientation intensities investigated in terms of applicable fatigue load capacity and the occurring damage. The overall fatigue behaviour of the CFRP was comparable between the multiple amplitude test (MAT) and constant amplitude test (CAT), showing the applicability of MAT considering its short-time application to gain an impression about the material properties. With help of digital image correlation and in situ computed tomography a detailed distinction between the orientation-related damage development was possible: The orientation of the nanofibres at 300 V, especially for longer durations, leads to significantly reduced damage. Those specimens show less and decelerated inter-fibre cracks and delamination while maintaining the stiffness for a longer time showing the positive impact of nanofibre orientation for applications involving cyclic tension–tension loading. Electrical resistance measurement proved to be applicable for damage monitoring, where the nanofibre orientation led to two main phases of changes: Rather than just a continuous increase of the resistance observed for unoriented specimen, the initial characteristic resistance decrease in the oriented specimen may be a potential parameter for future estimates of damage evolution and fatigue life.
To understand the material behaviour in more detail and to describe the influence of the nanofibre orientation on the fatigue load capabilities in a model-based manner, taking different pore volumes into account, additional investigations in the future, with complementary microscopy and statistical validation, will be necessary. In-depth correlations between measured electrical resistance and occurring microstructural changes, conducted for several CNF orientations and orientation intensities, are a necessary basis for this.
Footnotes
Acknowledgements
We thank Christian Weichhart for support in specimen production and Michael Fitzka and Ulrike Karr for support during mechanical tests. This research was partly funded by the Austrian Research Promotion Agency (FFG) in the course of the Production of the Future project “NanoPul” with the grant no. 871434.
Declaration of conflicting interests
The author(s) declared no potential conflicts of interest with respect to the research, authorship, and/or publication of this article.
Funding
The author(s) disclosed receipt of the following financial support for the research, authorship, and/or publication of this article: This work was supported by the Österreichische Forschungsförderungsgesellschaft, 871434.