
Abstract
During catalytic cracking of methane reaction, different carbon nanostructures can be formed. This paper shows the results of a characteristic nanostructured carbon deposit obtained during cracking of methane reaction over nanocrystalline iron catalysts with or without cobalt addition. The properties of the carbon deposit were determined by X-ray diffraction, scanning electron microscope with energy dispersive spectrometer equipment, thermogravimetry-differential thermal analysis coupled with mass spectrometry, time-of-flight secondary ion mass spectrometry analysis and surface area analysis (Brunauer-Emmett-Teller isotherm [BET]). Significant differences in the morphology and properties of the obtained carbon were found. The mechanism of the formation of carbon nanostructures for both iron catalysts is proposed.
Introduction
The formation of carbon is well known and takes place in every process where hydrocarbons undergo thermal decomposition (Ahmeda et al., 2009; Kim et al., 2015; Leroi et al., 2005; Shih et al., 2004; Solovyev et al., 2009; Vieira et al., 2004; Wang et al., 2005).
In the case of catalytic processes, carbon deposit may confine the activity of the catalyst in different ways, for example, by strong adsorption on the active phase surface, by physically blocking the reactor or by clogging the pores (Amin et al., 2011). Carbon adhering to the surface of the catalyst can produce different forms, for example, filamentous, graphite or amorphous carbon. Dultsev et al., (2014) investigated the properties of amorphous carbon obtained in the supersonic gas jet. Podder et al., (2005) also investigated the properties of amorphous carbon but doped with boron and obtained by the plasma-enhanced chemical vapour deposition method. In both works, methane was the source of carbon. Land et al., (1992) investigated the growth and nature of a graphite layer during decomposition of ethylene. However, it seems that carbon filaments (nanotubes and nanofibres) (Anoshkin et al., 2014; Mizutani et al., 2012; Takenaka et al., 2004a; Teng et al., 2014; Willems et al., 2000; Zhang and Zhang, 2013; Zou et al., 2006) are the most often described and investigated group. The formation of carbon nanotubes/nanofibres on the catalyst’s surface is a desirable form. Due to their exceptional properties, they have many potential applications in technology, for example, as polymer reinforcements (Fan et al., 2013; Opelt et al., 2015), composites (Tofighy and Mohammadi, 2015; Wang et al., 2015), materials for hydrogen storage (Lin et al., 2009; Muthu et al., 2016), electronics (Peng et al., 2014) and catalysis (Ali et al., 2015; Serp et al., 2003; Shanahan et al., 2011).
The method which is most frequently used for the production of carbon nanotubes/nanofibres is catalytic chemical vapour deposition. The catalysts traditionally used in this process are Fe, Co or Ni (Colomer et al., 2000; Gulino et al., 2005; Kathyayini et al., 2004; Louis et al., 2005; Prasek et al., 2011; Tran et al., 2007). The diameter of the fibres depends on the dimensions of the metal nanoparticle used as a catalyst, while the shape, symmetry, dimensions, growth rate and crystallinity of the materials are influenced by the selection of the catalyst, carbon source, temperature and time of the reaction.
The aim of our work was to examine the forms of carbon deposit obtained in the cracking of methane reaction with the use of nanocrystalline iron catalysts with or without cobalt addition. We tested a typical nanocrystalline iron catalyst commonly used in ammonia synthesis (Arabczyk and Narkiewicz, 2002; Kowalczyk et al., 1997; Lendzion-Bieluń and Arabczyk, 2013). Our intention was the create iron nanoparticles coated with a carbon layer that consists of nanotubes or nanofibres. The magnetic properties of these encapsulated nanoparticles give an opportunity to apply them in different branches of technology such as catalysis and photocatalysis, gas sensors and biosensors, recovery and treatment of waste water and others (Gu et al., 2013; Jong-Min et al., 2010; Sancan et al., 2016; Sunny et al., 2010; Yao et al., 2016). The important application target of these structures is medicine where nanoparticles of ferromagnetic metals encapsulated by neutral materials can facilitate drug delivery (Harutyunyan et al., 2002; Masotti and Caporali, 2013; Wang et al., 2014). Therefore, it is extremely important to extend and share the knowledge of this topic.
Many efforts have been made to obtain this kind of materials with a simple synthetic procedure and easy processing for subsequent application. In our work, we decided to use iron-fused catalysts for the decomposition of methane to receive iron core nanoparticles with a protecting carbon shell. Iron-fused catalysts are commonly used in ammonia synthesis. This type of catalysts is rather rarely used for the decomposition of methane. Thus, using a catalyst for ammonia synthesis gives opportunities for their new applications. However, in literature, there are examples of investigations of the methane decomposition over iron-fused catalysts (Arabczyk et al., 2004).
This publication is the continuation of our previous work (Maj et al., 2015), where we described the way of direct methane decomposition with fused iron catalysts to receive hydrogen and the catalysts characteristics. We tested the process of methane decomposition in the temperature range of 200–700℃. Higher temperatures cause strong sintering of the catalyst and its deactivation. The best activity was achieved at 700℃; therefore, we use this temperature in our investigations.
Iron catalysts were a proper choice to be considered in the cracking of methane reaction. They have significant resistance to high temperatures and they are relatively inexpensive. However, they show rather low activity. In order to improve their activity, metals or metal oxides are used as various additives. Cobalt has intermediate properties (high activity in the cracking of methane reaction and considerable resistance to high temperatures), so it seems a good addition, improving the iron catalyst’s activity in this type of reaction (Abbas et al., 2010; Li et al., 2011).
The properties of the carbon deposit were determined by different physicochemical methods (X-ray diffraction, XRD; scanning electron microscope with energy dispersive spectrometer, SEM/EDS; thermogravimetry-differential thermal analysis coupled with mass spectrometry, TG-DTA-MS; time-of-flight secondary ion mass spectrometry analysis, ToF-SIMS and BET).
Experimental
Catalysts
Designation of samples:
S1 - nanocrystalline iron catalysts without cobalt addition; S2 - nanocrystalline iron catalysts with cobalt addition; SC1 - nanocrystalline iron catalysts without cobalt addition and with carbon deposit; SC2 - nanocrystalline iron catalysts with cobalt addition and carbon deposit.
The nanocrystalline iron catalysts were obtained by the method which includes a fusion of magnetite or wustite with small amounts of aluminum, calcium, potassium and/or cobalt oxides. These oxides were precursors for the catalyst. The process of melting was carried out in a laboratory plant, which consists of a feed block, a basin and water-cooled steel electrodes. The basin and steel electrodes created a kind of an electric furnace. The process of fusion was based on the conduction of electrical current with high current intensity through the bed of catalyst precursors. The lava after the fusion was cooled to room temperature, crushed and sieved. The grains between 0.2 and 0.6 mm were taken for further investigations. The detailed description of the catalyst preparation is presented in the works (Arabczyk et al., 1996, 2004). The presence of aluminum and calcium oxides prevents the sintering of the catalyst at high temperatures (Ahmeda et al., 2009; Leroi et al., 2005). Using the inductively coupled plasma, optical emission spectrometry method, the composition of the catalysts was determined.
The S1 catalyst contains iron as wustite as well as the following oxides:
3.88 %mas. Al2O3; 1.96 %mas. CaO; 0,41 %mas. K2O;
whereas the S2 catalyst contains iron as magnetite and also the following oxides:
3.35 %mas. Al2O3; 1.10 %mas. CaO; 0.10 %mas. K2O; 21.24 %mas. Co3O4.
Cracking of methane reaction
Cracking of methane reaction was carried out in a quartz reactor with a diameter ϕ = 6 mm, filled with 0.20 g of a catalyst, using a flow rate of pure CH4 (Air Products, 99.99% purity) of 20 ml/min−1 at a reaction temperature of 700℃. The activity of catalysts in the process of methane decomposition was tested in the temperature range of 200–700℃. The catalysts achieved the best activity at 700℃, and therefore, we decided to choose this temperature in our investigation. The reactor was situated in an electric furnace controlled by a temperature controller. Prior to the cracking of methane reaction, all catalysts were subjected to a reduction pre-treatment with a flow rate of pure hydrogen of 20 ml/min−1 for 10 h at 500℃ as recommended in the literature (Arabczyk et al., 2004).
The process of methane decomposition was conducted as long as the presence of hydrogen was detectable behind the reactor. The carbon species and hydrogen in the gas phase were formed according to the following reaction:

Due to the methane decomposition over the Fe-based catalyst, carbon nanocomposites species were formed on the surface of catalysts which were labelled as SC1 and SC2, respectively.
Characterization methods of carbon deposit
X-ray diffraction
X-ray diffraction patterns were collected using a PANalytical X’Pert Pro MPD diffractometer in Bragg-Brentano reflecting geometry. Copper CuKα radiation from a sealed tube was utilized. The generator was operated at 40 kV and 30 mA. Data were collected in the range 3–80° 2θ with a step 0.0167° and exposition per one step of 19, 6 s. A nickel filter on the receiving side was used to eliminate CuKβ radiation. Soller slits, both primary and secondary, reduced the asymmetry of the peaks at low diffraction angles.
Scanning electron microscope with EDS equipment
The morphological appearance of the deposited carbon was studied with a SEM Hitachi S-4700 (Japan) equipped with an EDS device Thermo Noran (USA). The SEM images were obtained with the use of a high vacuum mode and accelerating voltage of 25 keV.
Thermogravimetry-differential thermal analysis coupled with mass spectrometry
Thermal analysis data (SETSYS 16/18, Setaram (France) and mass spectrometer ThermoStar, Balzers (Germany)) were used for temperature-programmed oxidation of the carbon deposit and SC1 and SC2 catalysts in the air atmosphere. The measurements were taken from room temperature to 900℃ in the flowing air, applying a sample weight of about 50 mg in a linear heating rate of 10℃/min−1.
Surface areas analysis (BET)
The specific surface area and porosity of the catalysts and their supports were determined with surface area and porosity analyzer micrometrics Accelerated Surface Area and Porosimetry (ASAP) 2020. Samples were prepared at 350℃, followed by low temperature nitrogen adsorption–desorption measurements carried out with the use of BET and liquid N2 method.
Time-of-flight secondary ion mass spectrometry analysis
ToF-SIMS mass spectra of ions were obtained on the secondary ion mass spectrometer TOF-SIMS IV (ION-TOF GmbH, Münster, Germany) equipped with a high mass resolution ToF analyzer of a reflectron type.
Results and discussion
Thermogravimetry-differential thermal analysis
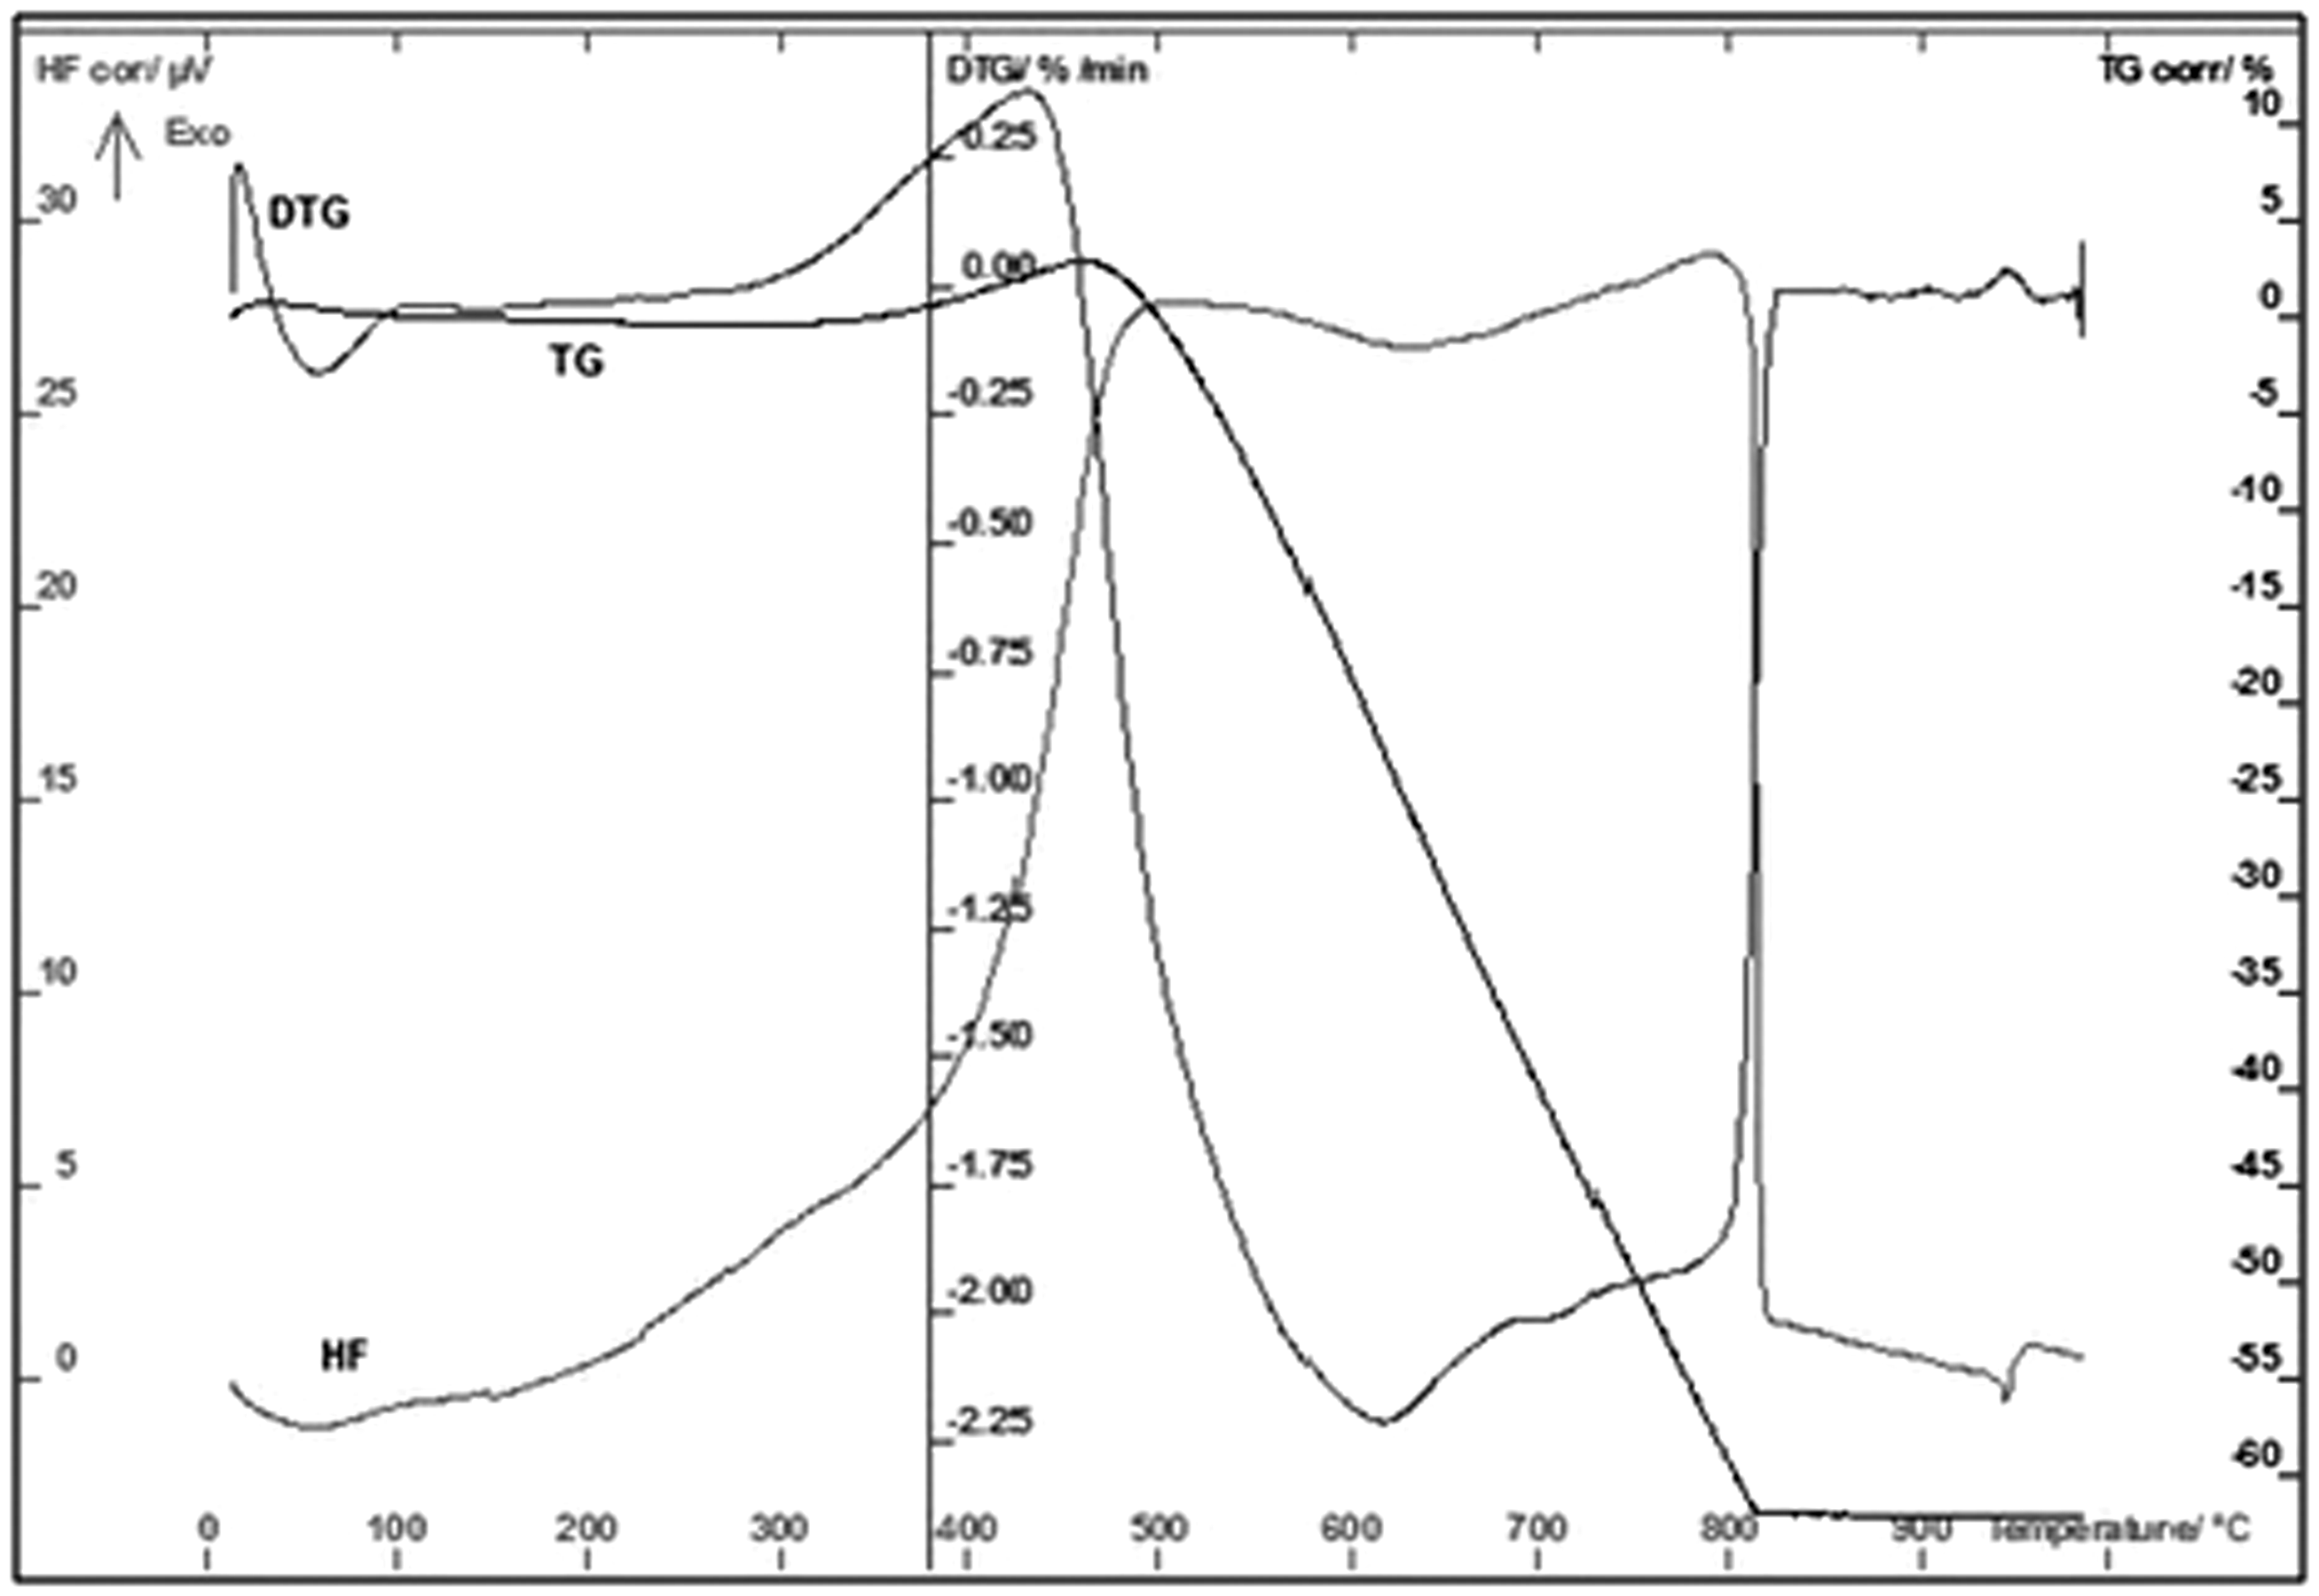
The resistance of carbon deposit to thermal oxidation was investigated by TG analysis. The results are given in Figures 1 and 2. From these figures, it is found that in both cases, the carbon deposit is resistant to thermal oxidation up to at least 450℃. At this temperature, a characteristic weight loss due to the carbon oxidation is observed. As shown in the TG curve, only a single clear step was observed for both samples, whereas the DTG curve (derivative of TG results) showed that the process consisted of at least four steps. The first shows a negative peak (decrease in the mass of the sample) at 80℃, which corresponds to the removal of moisture from samples; the second around 400℃ shows a positive peak and it is probably connected with the oxidation of cobalt or/and iron. It is worth noticing, that in the case of SC2 sample (Figure 2), this peak is clearly higher. These results show that both catalysts are probably not completely encapsulated by carbon. The third negative broad peak is observed at 600℃ and arises as a result of carbon oxidation. These peaks arise at 450℃. It means that oxidation of carbon deposit started just at that temperature. In the case of SC1 samples, four negative peaks can be observed at 700℃. This peak probably arises as a consequence of irons carbide oxidation. These compounds can be formed during the methane decomposition over the iron catalyst (Arabczyk et al., 2004). To summarize, the results obtained in this work reveal that the deposited carbon materials are fully oxidized in the temperature range of 450 to 700℃ for the SC1 sample and the range from 450 to 610℃ for the SC2 sample. The summary mass loss of the SC1 sample was 89.8%, whereas the SC2 sample lost only 65.1% of its mass. The obtained results also show that both catalysts are probably not completely encapsulated by carbon. Nevertheless, it should be stressed that over the both samples, carbon deposit is rather stable for thermal treatment in air up to the temperature of 450℃ (Crumpton et al., 1996).
Thermal analysis of carbon deposit over nanocrystalline iron catalyst without cobalt addition (SC1). Thermal analysis of carbon deposit over nanocrystalline iron catalyst with cobalt addition (SC2).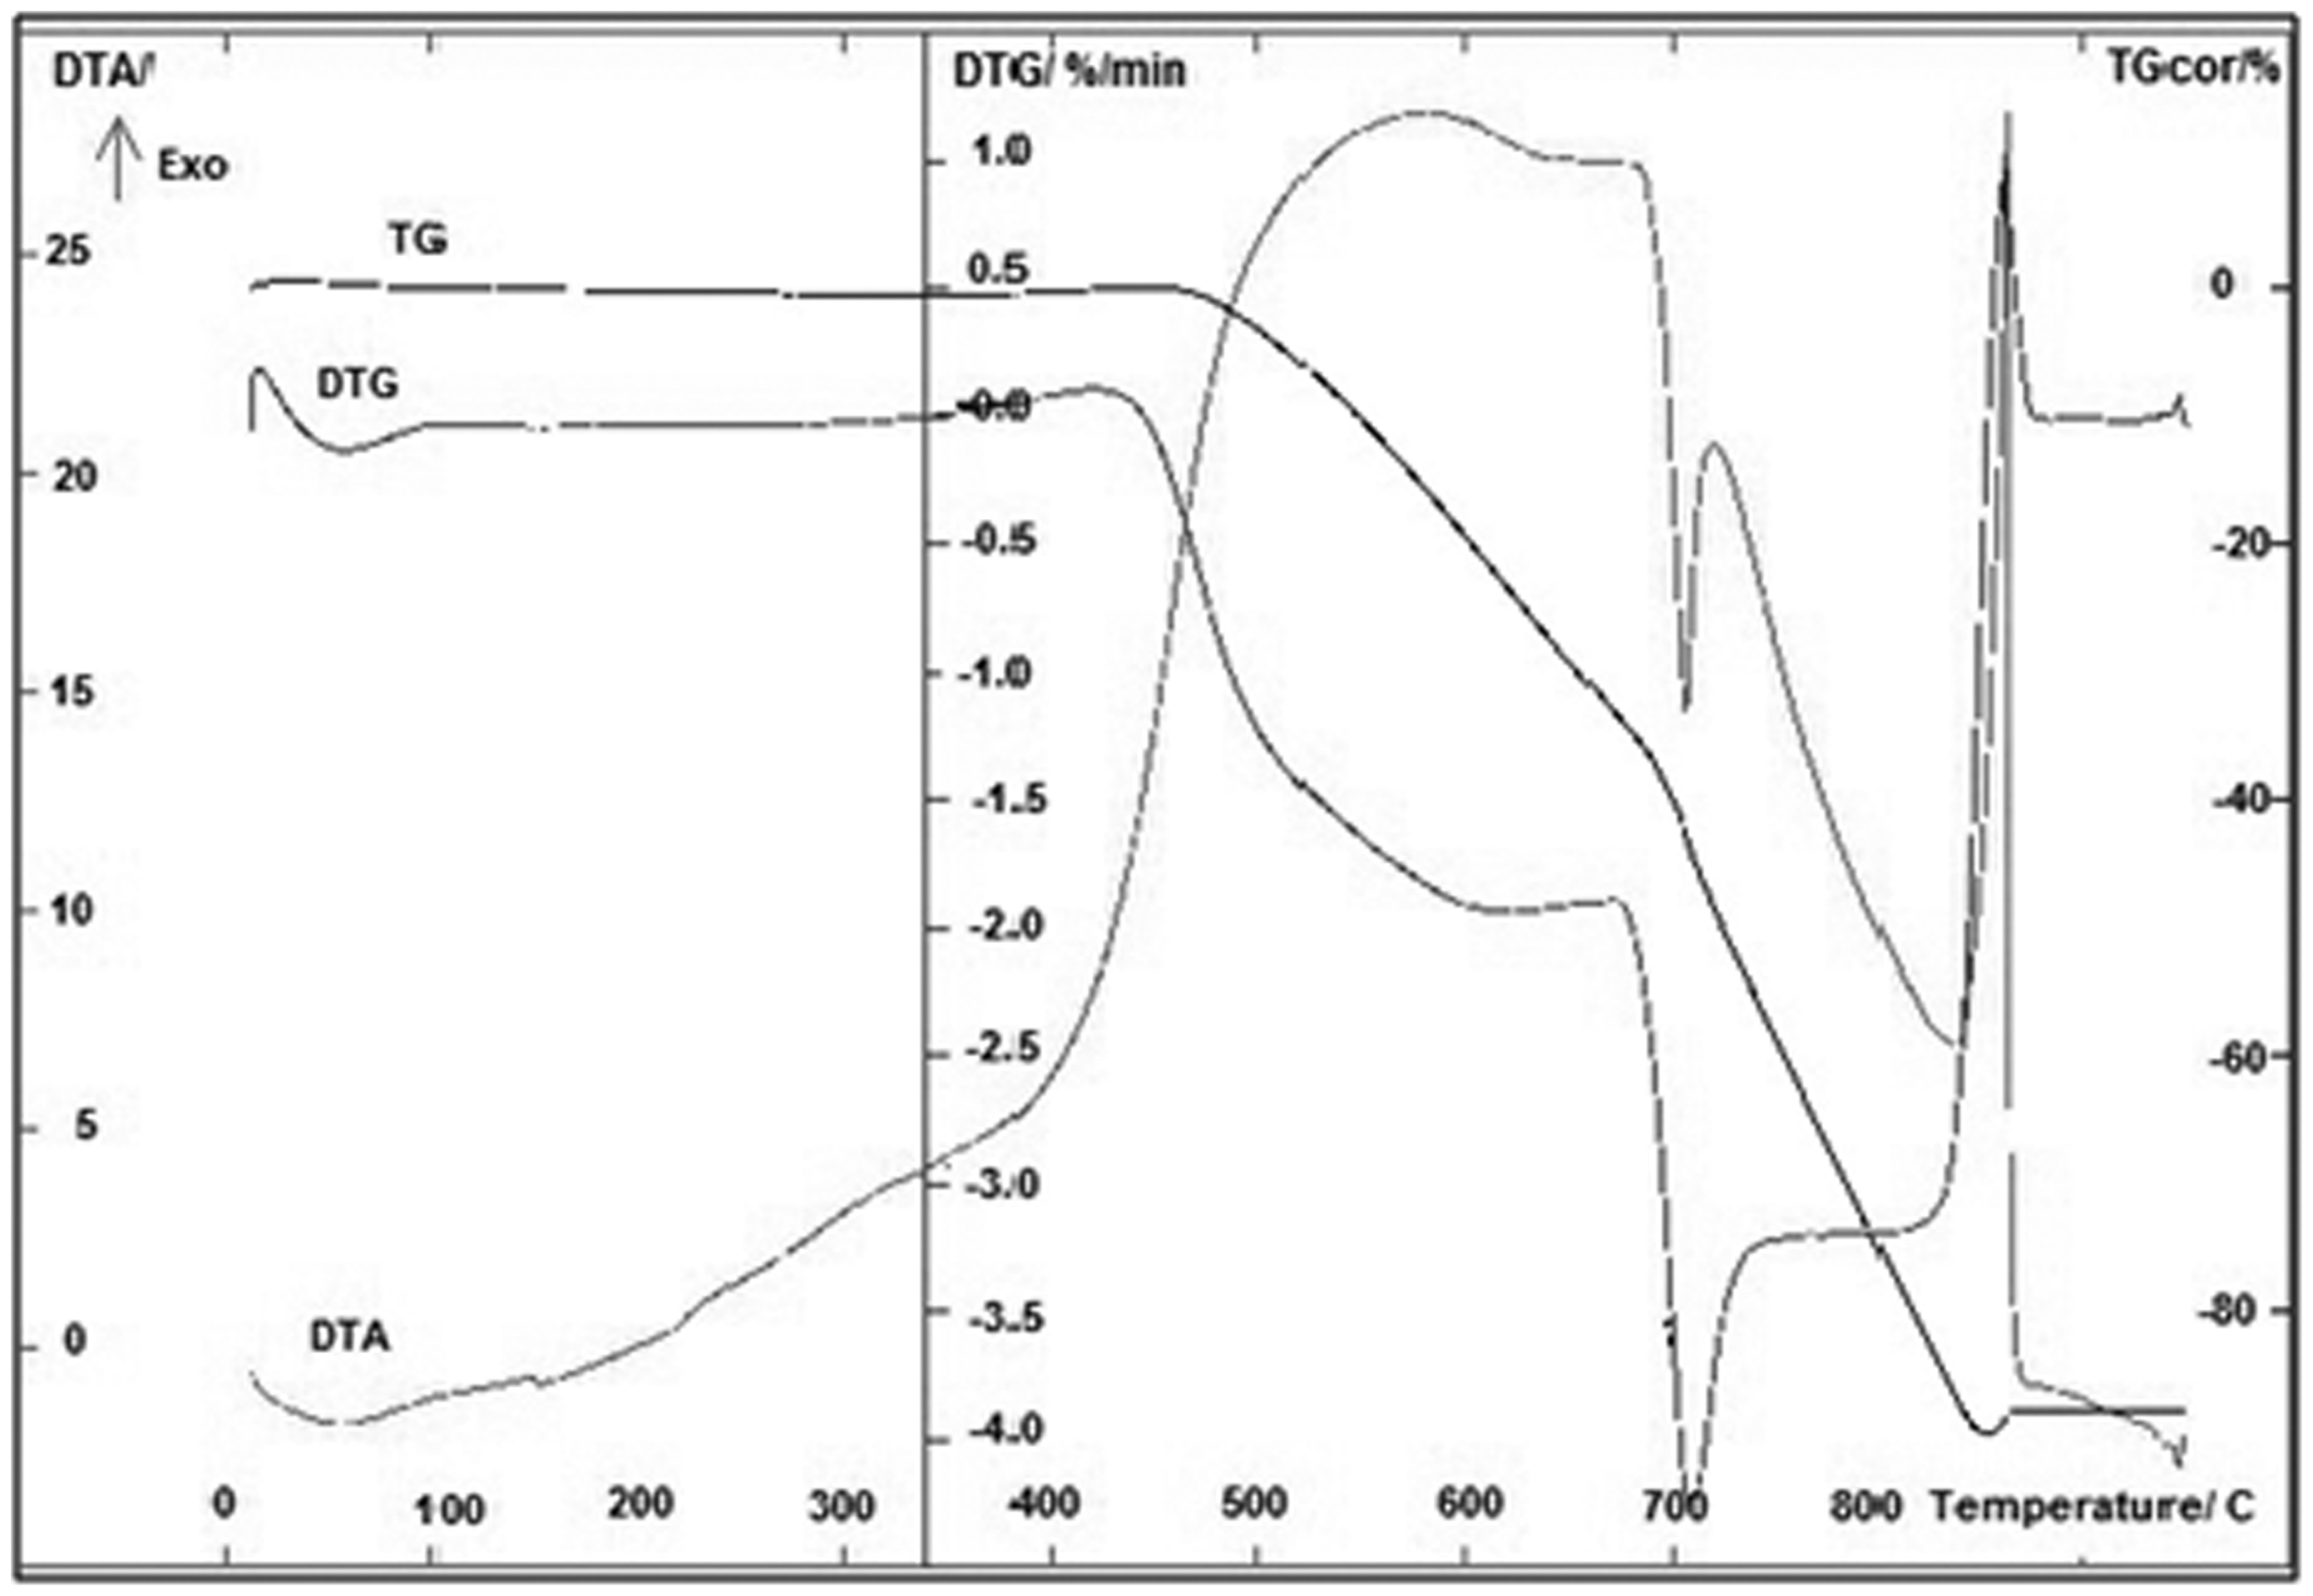
X-ray diffraction
The XRD tests were carried out for both catalyst samples of carbon deposit. Figure 3 shows a small pattern derived from graphite in the SC1 sample and a very high pattern in the SC2 sample. This indicates that the presence of cobalt initiates the formation of the graphite structure. For all the XRD patterns shown in Figure 3, the diffraction lines were found only from the graphite structure and metals from the catalysts. It indicates the absence of amorphous carbon in the samples. Also, the main graphitic carbon phase at 2θ = 26° in the SC2 sample is dominant compared to the other peaks that are attributed to the metallic phases. A similar effect is obtained in works (Awadallah et al., 2014), where the reflections at ca. 2θ = 26° and 44° are attributed to the graphitic carbon that appears in all used Co-based catalysts. The authors believe that this proves acquisition of carbon nanotubes.
XRD-patterns of carbon deposit over nancrystalline iron catalyst without cobalt (SC1) and with cobalt addition (SC2). XRD: X-ray diffraction.
The average size of crystalline (Table 1) was calculated from the Scherrer’s equation (1):

dhkl - average crystallite size in (nm),
k - constant dependent on the shape of crystallite,
λ - wavelength of X-rays dependent on the type of lamp (nm),
B - extension reflex two theta scale (deg)
b - instrument amendment given on a scale of two theta (deg),
The overage size of crystallite for S1, S2, SC1 and SC2 samples.

Surface areas analysis (BET)
Textural properties of carbon deposit obtained over an iron catalyst without the addition of cobalt (SC1) and with cobalt (SC2).
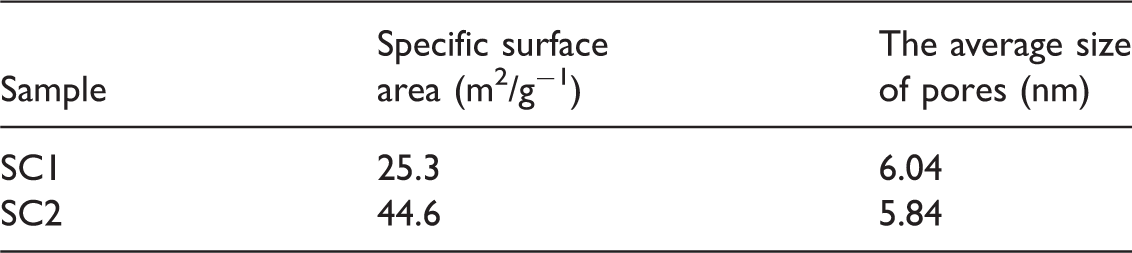
Ermakova et al., (2001a) tested textural and structural characteristics of filament carbons synthesized using different carrier iron catalysts and obtained similar results of the specific surface area (20–79 m2/g−1) and the pore volume (0.13–0.27 cm3/g−1) but 2–10 times larger size of pores.
The BET isotherms of SC1 and SC2 samples are shown in Figure 4. The shapes of isotherms suggest a type III adsorption isotherm according to the IUPAC classification (Sing et al., 1985). This type of isotherm is present in macroporus adsorbents with weak adsorbate–adsorbent interactions. It is worth noticing that no clear hysteresis is observed. The hysteresis of adsorption/desorption isotherms indicates the presence of macropores in the structure of obtained nanocarbon composites.
Isotherm of N2 adsorption/desorption for SC1 (a) sample and SC2 (b).
Time-of-flight secondary ion mass spectrometry analysis
Figure 5 shows the graphs of intensity of selected ions received by the ToF-SIMS method for samples of iron–carbon composites (SC1, SC2) and fresh catalysts as a pattern (S1, S2). Almost in every case, a clear difference between intensities of ions in a fresh sample and iron–carbon composite samples is observed. It indicates that the particles of the iron catalyst are totally covered by carbon. This is called the phenomenon of encapsulation of metal particles by carbon, which leads to the creation of iron–carbon composites. The fact that the quantities of basic ions are bigger in the SC2 than SC1 sample is worth noting. This, on the other hand, indicates the basicity of the sample’s surface.
Graphs of intensity (counts) of selected ions received from the ToF-SIMS method for S1, S2, SC1, SC2 samples. ToF-SIMS: time-of-flight secondary ion mass spectrometry analysis.
Scanning electron microscope with EDS equipment
Both catalyst samples after cracking of methane reaction coated with carbon deposit were examined with SEM/EDS.
The carbon deposit for the S1 catalyst takes the form of spherical carbon nanostructures (Figure 6(a)). The situation is different in the case of the S2 catalyst (Figure 6(b)). The images show that the surface is completely covered with carbon but it is formed in carbon nanofibres.
Representative SEM/EDS images of carbon deposited after cracking of methane reaction using a nanocrystalline iron catalyst without cobalt (a) and with cobalt (b). SEM/EDS: scanning electron microscope with energy dispersive spectrometer.
Both the type of catalyst and reaction conditions influence the morphology of the obtained nanofibres (Li and Li, 2011). The effect of temperature on the morphology of the carbon nanofibres was investigated by Snoeck et al., (1997). Based on their work, it can be concluded that at a low temperature full structures of carbon nanofibres are formed and at a high temperature the formation of hollow structures is dominant (Li and Li, 2011; Snoeck et al., 1997). Also, Takenaka et al., (2004b) described the process of obtaining hollow carbon nanofibres with the use of a cobalt catalyst at 600–700℃. The application of a higher temperature causes the production of spiral and bamboo-shaped carbon nanofibres.
Carbon nanotubes/nanofibres were first observed by Baker et al., (1972, 1973) in the 1970s. Two types of growth mechanism, tip- or base-growth model, were proposed in 1989 by Beker (1989). Both cases depend on the interaction between the metal and substrate materials. In the tip-growth model, where the interactions are weak, the metal particle is pushed at the top by carbon that diffuses down. The carbon nanotube/nanofibre is grown as long as the metal is free for hydrocarbon decomposition. The growth is stopped when the metal particle present at the top of the nanotube/nanofibre is completely covered by carbon. In the base-growth model, carbon forms a hemispherical dome on the surface of the metal particle. The catalyst–substrate interaction is too strong to push the metal particle at the top, so it extends up in the form of a graphic cylinder.
During the SEM/EDS tests, in several places of nanofibre (including at its tip), the spectrum of metal was formed. We did not observe more metal at the tip of the nanofibre. This allowed us to conclude that we are dealing with the base-growth model.
In the following part of this paper, we propose the mechanisms of nanofibres growth to explain the differences in the morphology of the obtained forms of carbon deposit.
Figures 7 and 8 show the mechanisms of carbon deposit formation during methane decomposition over an iron catalyst without cobalt addition (Figure 7) and with cobalt addition (Figure 8).
Schema of carbon deposit formation for catalyst without cobalt addition. Schema of carbon deposit formation for catalyst with cobalt addition.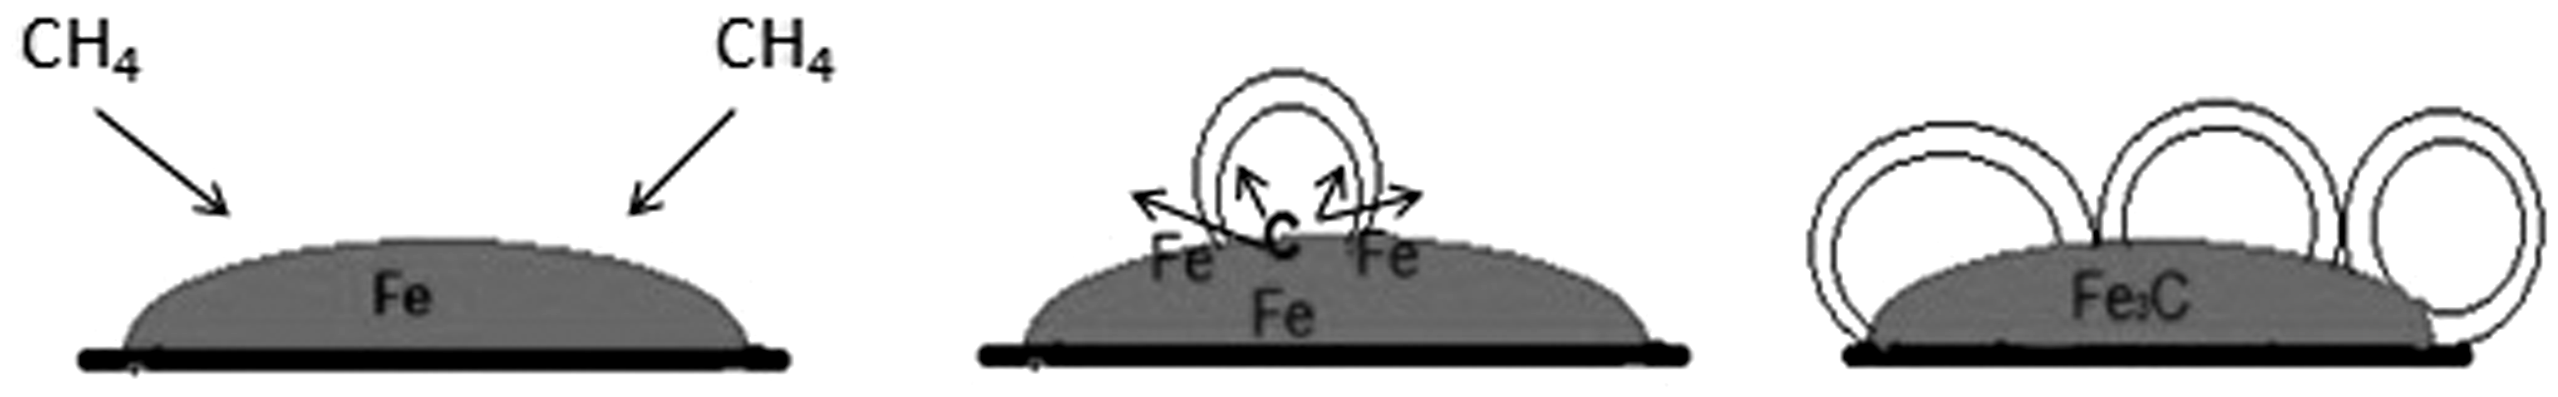

Both iron and cobalt form carbide phases. Iron forms five different carbide phases, which have all been widely examined, while CoxC has only two stable phases, Co3C and Co2C (Harris et al., 2010; Huba, 2014). Sówka et al., (2008) published that cobalt and iron with an acrylamide complex exhibit a different structure in the pyrolysis process at 600℃, which was confirmed by the X-ray phase analysis, Mössbauer spectroscopy and TEM observations. The sample polymer with cobalt matched the lines of metallic cobalt and the broad spectra suggested a nanocrystalline structure. A different situation was observed for the sample with iron and polymer where iron carbide was found. The TEM studies for the pyrolysed cobalt with polymer showed individual particles having the size of 12 nm but iron carbides were agglomerated and their sizes ranged from 10 up to 80 nm.
According to the literature (Ermakova et al., 2001b), Fe3C acts as an active phase in the formation of carbon nanotubes/nanofibres. Emmenegger et al. (2003) described that the graphite layers could also encapsulate the Fe3C particles before they reach the critical dimension and they are inactivated as possible active sites. We know too that iron creates carbides more easily and at a lower temperature (Sówka et al., 2008).
The nature/properties of the catalyst have a very big impact on the methane decomposition process. With absence of any catalyst, hydrogen and soot may be obtained from methane by pyrolysis in the temperature range 1000–1200℃. Consequently, several studies have been conducted in order to avoid such high temperatures, soot in the reactor and to improve efficiency of the reaction. The introduction of a selected catalyst to the processes causes the formation of various carbonaceous species (Fau et al., 2014).
Due to the above literature data and our observations, we suggested the following mechanism of carbon formation on S1 and S2 catalysts.
In our case, we do not observe forms of carbon nanotubes/nanofibres on the surface of an iron catalyst without cobalt addition. Spherical carbon nanostructure forms are observed on the surface of the catalyst as a result of encapsulation of the Fe3C particles. A similar situation can also be observed on the iron catalyst with cobalt addition. However, in this case, cobalt nanoparticle crystallites are present on the catalyst’s surface. They form active sites for the carbon nanotubes/nanofibres formation and enable their growth, which is shown in Figure 8.
Conclusion
We have presented the chemical and physical properties of the carbon nanofibres formed by the nanocrystalline iron catalyst with or without cobalt addition by XRD, SEM/EDS, BET, ToF-SIMS and TG-DTA-MS methods. The mechanisms of nanofibres growth explain the differences in the morphology of the obtained forms of the carbon deposit.
The structural characterization shows that carbon forms have various structures with a different specific surface area and a similar size of pores.
The results show that particle sizes are similar but the pore size is clearly larger for SC2 samples. Moreover, SEM pictures show that forms of carbon deposited on each catalyst have different structures. The carbon deposit for the S1 catalyst takes only spherical carbon nanostructure forms. On the S2 catalyst, carbon forms nanofibres which probably together with a larger pore size are responsible for a bigger surface area of the SC2 sample.
The ToF-SIMS made it possible to observe the fact that the quantities of basic ions are larger in the SC2 than the SC1 sample. This indicates the basicity of the surface of the carbon deposit sample with cobalt addition.
The SEM images clearly indicated the existence of nanostructured filaments in the SC2 sample and spherical nanostructured carbon particles on the SC1 sample. Also, both carbon deposit forms have a crystalline structure, which is confirmed by TG-DTA-MS and XRD methods. No amorphous carbon was observed.
Footnotes
Acknowledgements
Special acknowledgement to Prof. W. Arabczyk (ZUT Szczecin, Poland) for the preparation of catalysts.
Declaration of Conflicting Interests
The author(s) declared no potential conflicts of interest with respect to the research, authorship, and/or publication of this article.
Funding
The author(s) disclosed receipt of the following financial support for the research, authorship, and/or publication of this article: Research funded by the Young Scientists Fund at the Faculty of Chemistry, Lodz University of Technology, Grant W-3/FMN/9G/2015.