
Abstract
The piezoelectric vibration energy harvesting performance of an electrospun poly(vinylidene fluoride) (PVDF)/Barium Titanate (BaTiO3) nanocomposite piezo polymer nanogenerator was investigated in this study. To obtain the highest piezoelectric output value, electrospinning was performed using four distinct solvent volume ratios of Acetone/Dimethylformamide (DMF) of 0:10, 2:8, 4:6, and 6:4 and three different PVDF weight percent polymer concentrations of 10, 15, and 20. Additionally, three distinct BaTiO3 addition weight percents of 5, 10, and 15 were investigated. The optimal concentration of PVDF (15 wt.%) was combined with a 6:4 volume ratio of Acetone/DMF to form a nanocomposite piezo polymer nanogenerator. The morphology and crystalline structure of PVDF and PVDF/BaTiO3 were analyzed using Fourier-transform infrared spectroscopy (FTIR) and scanning electron microscopy (SEM) techniques. Nanocomposite piezo polymer nanogenerator was manufactured to harvest energy from vibration. A cantilever beam was developed without a tip mass type system for piezoelectric energy harvesting tests. The highest piezoelectric power output was obtained as 0.243 μW (15 wt.% PVDF and 5 wt.% BaTiO₃), Acetone/DMF (6:4 vol./vol.)) under 10 MΩ at the 15.7 Hz resonance frequency. The morphology of electrospun nanofibers has a significant impact on the piezoelectric performance of a nanocomposite piezo polymer nanogenerator at high-amplitude vibration.
Introduction
Energy is a critical need in the modern era. In recent decades, research has accelerated to determine how to operate micro-nano electronic structures without an external power source and meet their energy requirements.1–4 Piezoelectric materials can generate electricity from instantaneous deformations on them. They can also be deformed according to the applied voltage. 5 With these properties, piezoelectric materials can be used to convert vibrations existing in nature into useful energy. 6 Due to the brittle nature of piezo-crystals and piezoceramics, there is a limit to their use in situations where high amplitude vibrations or strains are present. 7 On the other hand, Piezo-polymers are more ductile and flexible so that they can perform well under high strain and vibrations. 8 In addition, piezo-polymers have low-cost manufacturing and low process temperatures compared to piezoceramics. 9
Poly(vinylidene fluoride) (PVDF) is a well-known and highly electroactive polymer. 10 The first, Kawai 11 demonstrated the piezoelectric properties of PVDF in 1969. The main reason for the widespread use of PVDF is due to the strong dipole moment (5–8 × 10⁻³⁰ cm) between monomer units. 12 There are five different crystalline phases of PVDF polymer, which are in semi-crystalline form. These phases differ according to their chain structures. These phases are named as α, β, γ, δ, ε.13,14 The β phase from the TTT (plane zigzag) format has the highest dipole moment per cell. 15 α and ε phases are non-polar phases due to the anti-parallel arrangement of dipoles in the cell units. 16
There are different techniques to produce PVDF thin-film structures in the β phase. The uniaxial stretching technique is used under variable temperatures to obtain PVDF structure in β phase.17–20 Another common fabrication technique for piezoelectric PVDF thin film production is the spin-coating technique. With this coating technique, PVDF thin films can be produced of desired thickness and β phase content in a controlled manner.21–28 In both production techniques, a polarization process is necessary. Electrospinning is a more effective method of obtaining a piezoelectric effect. Nanofiber thin-film membrane structures are obtained by the electrospinning method that is commonly used.29–36 The most crucial advantage of the electrospinning method is that mechanical stretching and polarization processes are combined in a single process. The system consists of a syringe pump, syringe, needle tip, high voltage source, and collector. The polymer solution is collected as nanofibers by scattering from the needle tip to the collector under the electric field. In this way, nanofibers stretch under the electric field also the dipole moments are oriented. The polymer chains of the PVDF membrane structure are produced by this method in electroactive phases.
Solution concentration, solvent ratio, syringe feeding speed, applied voltage, and the distance between needle tip and collector are the essential parameters affecting piezoelectric properties. In order to obtain the most efficient piezoelectric effect from the PVDF fiber mats, several studies have been carried out on the optimum selection of electrospinning method parameters. An optimization model for electrospinning parameters was developed using artificial neural networks in a 2018 study. It was emphasized that the concentration of the solution had a 36% effect on the open-circuit voltage. 37 Another study used the Taguchi method to obtain an 80% β phase; for the electrospinning method, a 60% DMF/40% Acetone by volume mixture, a flow rate of 0.8 mL/s, a distance of 16 cm between the needle collector, and voltage values of 14 kV were chosen. 38 The bead structure is reduced when the solvent is completely evaporated during the electrospinning process. 39 During the electrospinning process, a solution with a high volatile solvent ratio is effectively stretched, causing an increase in the formation of PVDF nanofibers.40,41 Stretched nanofiber without beaded was reported to have a β phase content of up to 80%. 42 The effect of solvent types (DMF, Acetone, or MEK) on fiber diameters, β phase ratios, and piezoelectric power outputs (600 MΩ, 10.1 µ/cm2) under bending load were investigated. 43 A cantilever beam type energy harvester made of PVDF produced 0.286 mW/cm3 piezoelectric power output density. 44 Using parallel-stripe electrodes and a 20 Hz excitation frequency, the electrospun piezoelectric sensor produced an output voltage of 1.12 V. 45 In the study conducted under various resistive loads, the highest power output was determined to be 3.44 μW using a PVDF nanogenerator. 46
Due to their brittle structure, piezoceramics limit their use in high amplitude vibration or strain conditions. However, piezo polymers can perform well under high strain and vibrations. In the last decades, nanocomposite piezo polymers have been enhanced to improve the piezoelectric output performance of nanogenerators and maintain their flexibility. The piezo nanoparticles such as BaTiO3, 47 KNN (potassium sodium niobate), 48 PZT (lead zirconate titanate), 49 and ZnO (Zinc oxide) 50 are generally used to improve the piezoelectric effect of nanogenerators. Polymers with BaTiO3 nanocomposite have been studied to improve the piezoelectric performance due to their high piezoelectric properties and lead-free structure.51–60 0.02 μW piezoelectric power output was reported using a cantilever beam type energy harvester made of PVDF/BaTiO3 (1 Hz, 1MΩ resistance load). 61 The effect of BatiO3 nanoparticle size (10, 100, 500 nm) on the piezoelectric output voltage was investigated. 62 BaTiO3 compounded flexible piezoelectric nanogenerator reached up to 40% of improvement on mechanical energy harvesting was reported. 63
Choosing the proper dimensions of nanoparticles according to the diameters of PVDF nanofibers is crucial for piezoelectric output. This study investigated the effects of solvent ratio and solution concentration on PVDF nanofiber diameters. Also, the piezoelectric output performance of PVDF/BaTiO3 nanocomposite piezo polymer nanogenerator was examined for mechanical vibration energy harvesting. Polymer crystalline phases and morphology of PVDF and PVDF/BaTiO3 were examined using Fourier-transform infrared spectroscopy (FTIR) ve Scanning Electron microscopy (SEM). Electrospun PVDF and PVDF/BaTiO3 mats were sandwiched between two aluminum electrodes and polyester films to fabricate the piezo polymer nanogenerator (PPN). The piezoelectric output performance of PPN was tested via a vibration energy harvesting system. PVDF nanofibers without beads have been found to affect PPN performance directly. Besides, BaTiO3 nanoparticles improved the piezoelectric power output of PPN has been presented. To the best of our knowledge, there has been no in-deep study based on morphology effects to get optimum piezoelectric performance from nanogenerators. This study guides the appropriate selection of PVDF solutions used in the electrospinning process to obtain suitable nanofiber diameters for nanocomposite studies.
Materials and method
Materials
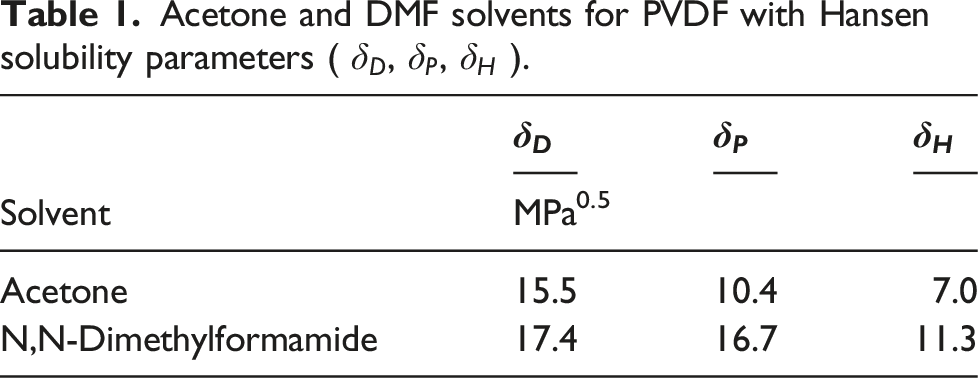
Acetone and DMF solvents for PVDF with Hansen solubility parameters (
Preparation of PVDF solutions
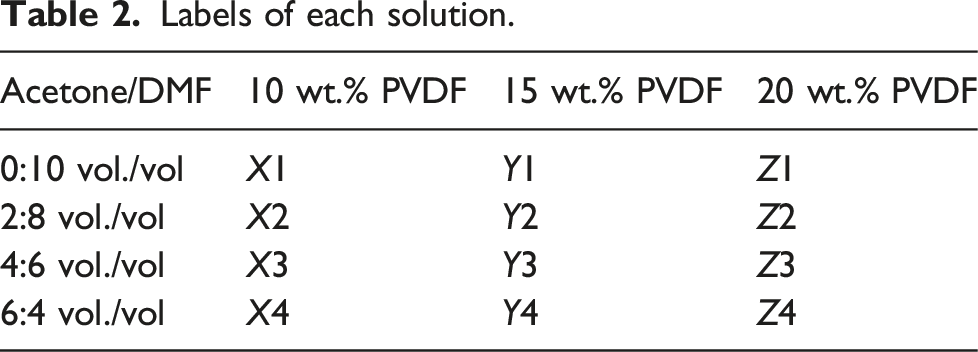
This investigation was carried out in two stages. In the first, three different polymer solutions with PVDF weight percent concentrations of 10, 15, and 20 were chosen. Each polymer solution was dissolved in an Acetone/DMF solvent system at four distinct volume ratios (vol./vol.) of 0:10, 2:8, 4:6, and 6:4. A total of twelve different polymer solutions were stirred using a magnetic stirrer for 10 h at 50°C to obtain a homogenous solution. Each polymer solution is denoted as a letter and number, as given in Table 2. The letters X, Y, and Z are designated to represent weight percent PVDF concentrations of 10, 15, and 20, respectively. In addition, the numerals 1, 2, 3, and 4 were employed as solvent volume ratios of 0:10, 2:8, 4:6, and 6:4.
Labels of each solution.
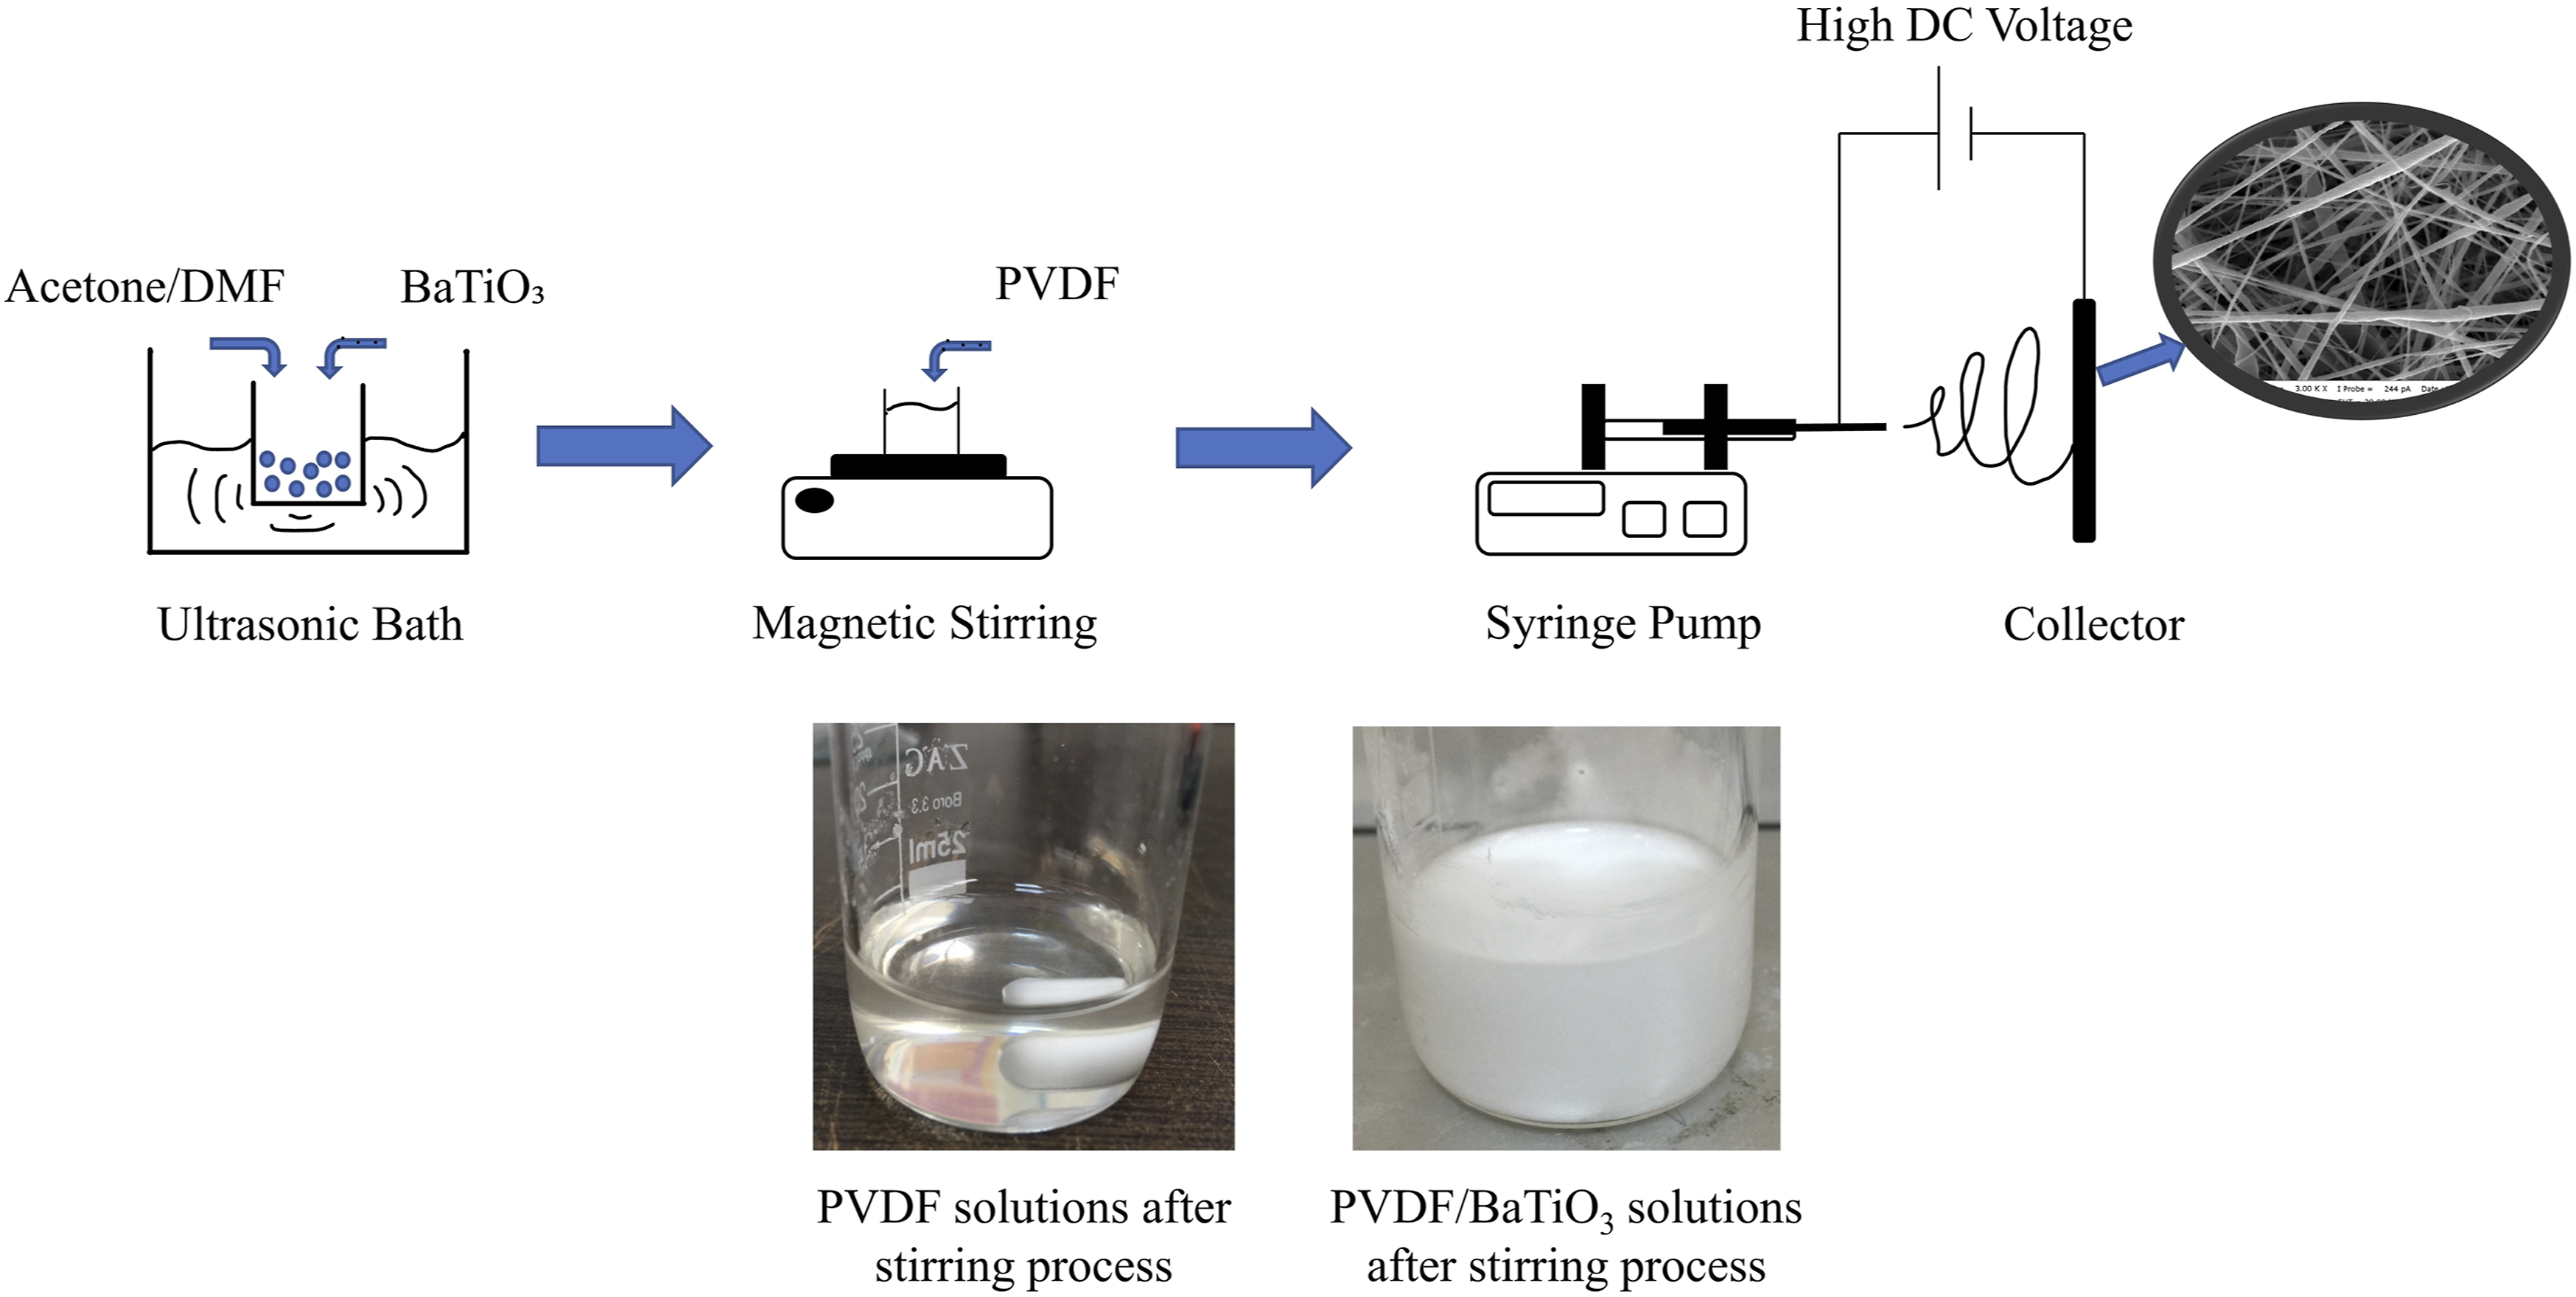
Sample preparation and electrospinning process.
Electrospinning process parameters
Each polymer solution was added to a 10 mL plastic syringe fitted with a 22-gauge stainless steel needle (inner diameter: 0.46 mm and outer diameter: 0.72 mm). The Plastic syringe was mounted horizontally on the syringe pump. The syringe pump (NE-300, New Era Pump System Inc.) was used to feed the stainless-steel needle at a fixed rate of 0.8 mL/min. A high DC voltage supply’s positive probe was attached to a steel needle, and the ground probe was clamped to an Aluminum foil-covered Al plate. The electrospinning process was executed under 14 kV at room temperature. The distance between the steel needle tip to the grounded collecting plate was 15 cm. The electrospinning process parameters (feeding rate, voltage, tip-to-collector distance) were determined based on the results of prior optimization studies for the electrospinning process published in the literature.37,38 The effects of solvent type, solution concentration, and filler concentration parameters on the morphology of the nanofiber structure were profoundly investigated. After the electrospinning process, electrospun fibers were placed in the fume hood to remove the solvent. All procedures were carried out in a dust-free environment, at room temperature of 20 ± 2°C, and at 50% humidity. Figure 1 depicts the sample preparation and electrospinning procedure. The electrospinning parameters for electrospun PVDF/BaTiO3 and electrospun PVDF were the same.
Characterization methods
The crystalline phases were analyzed using Fourier-transform infrared spectroscopy (FTIR spectroscopy, Perkin-Elmer Spectrum 100/USA). FTIR measurements of the electrospun fibers were collected with 32 scans from 600 cm−1 to 4000 cm−1 spectral range and resolution of 4 cm−1. Each sample of electrospun fibers was coated with a gold layer in a sputter-coater (BAL-TEC SCD005 Sputter Coater/NY/USA) before the scanning electron microscope imaging (SEM). The morphology of electrospun fibers was examined using a ZEISS Evo 40 (Oberkochen/GERMANY) scanning electron microscope with an accelerating voltage of 20 kV. Image J software (Java-based image processing program/USA) and SEM images at 3000x, 6000x, and 10,000x magnification were used to determine the mean nanofiber diameters. All characterization tests were conducted in Bursa Uludağ University Central Laboratory (Bursa/TÜRKİYE).
Fabrication of piezo polymer nanogenerator
To obtain the piezoelectric effect, the thickness of 50 μm, the width of 2 cm, and the length of 6 cm electrospun fiber mats were put in between two 12 μm aluminum electrodes. Then, conductive copper wires were attached to the up and bottom electrodes. Thin Kapton® tape (3 M™) was used to hold together the piezoelectric core structure. To complete the piezo-polymer nanogenerator (PPN), the core structure was laminated between two polyester-based laminating films (PET) of 125 μm thickness using a Mapilam LM27 hot laminator device. PPNs with a 12 cm2 surface area were used to harvest piezoelectric energy from vibrations. Schematic and actual image of PPN was given in Figure 2. Schematic (a) and actual image (b) of PPN.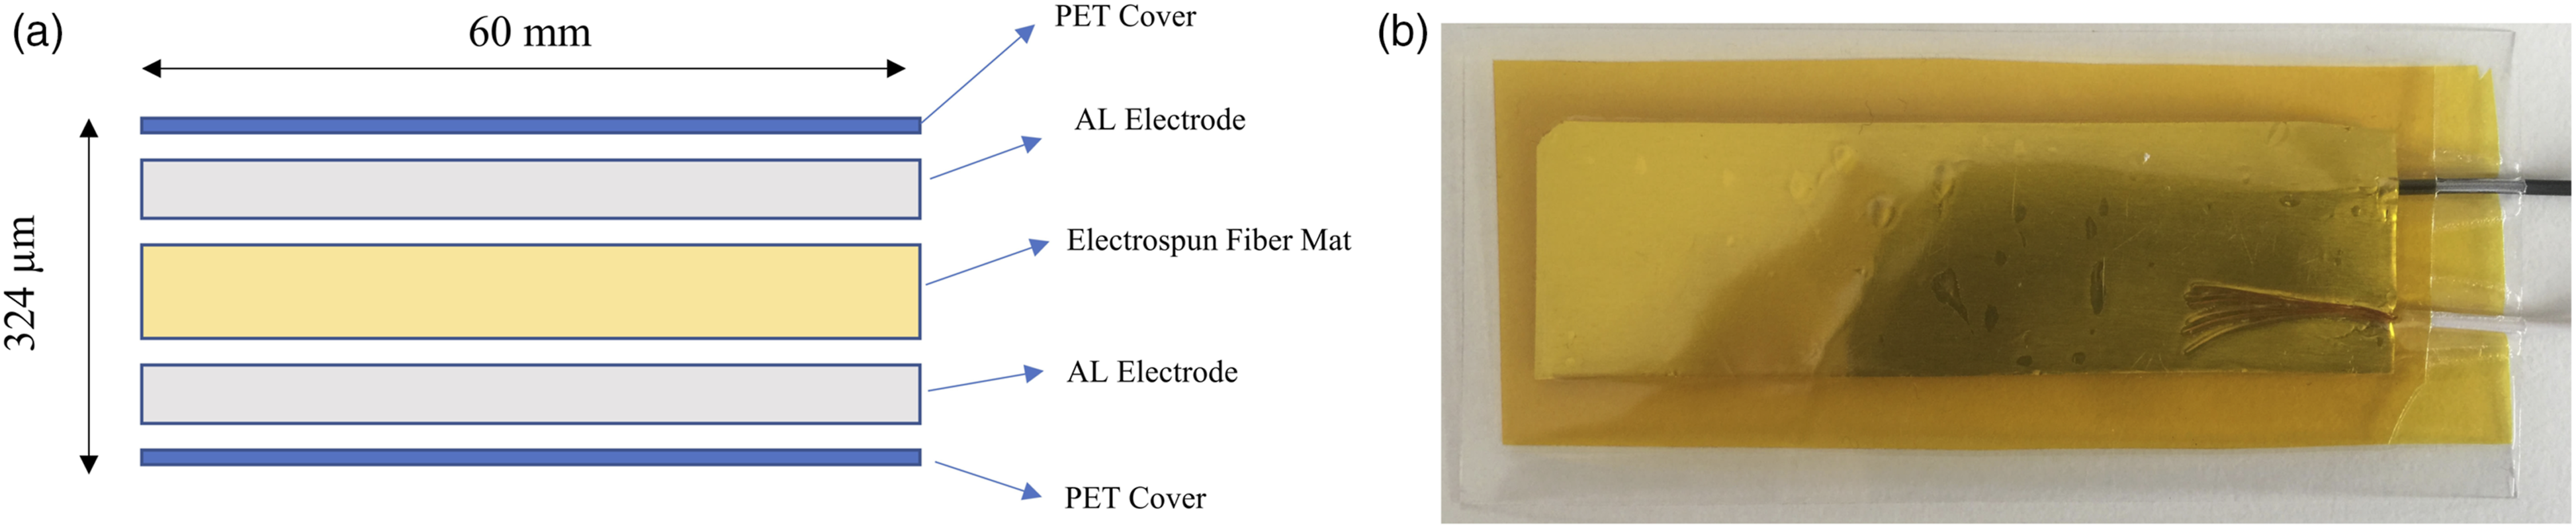
Experimental setup
The piezoelectric vibration energy harvesting system is shown in Figure 3. The Piezo polymer nanogenerator was clamped between two polymers (Polyoxymethylene, POM) blocks with the help of screws to achieve a cantilever beam structure. The cantilever beam apparatus was mounted using the setscrew onto the electromagnetic shaker (Frederiksen 2185, 0.1 Hz–5 kHz). An electromagnetic shaker generates the dynamic forces required for the excitation frequency of cantilever beam structures. A cantilever beam without tip mass was used for piezoelectric energy harvesting. The vibration generator was controlled with the help of the function generator (TT Technic VC2002), IRF520 MOSFET was used as a power amplifier, and Marxlow KXN-3020D was used as a DC Power Supply. The output voltages were measured using a KEYSIGHT MSOX3034T Oscilloscope (350 MHz, 5 GSa/s). Vibration energy harvesting values were calculated under different load resistances. The piezoelectric vibration energy harvesting system.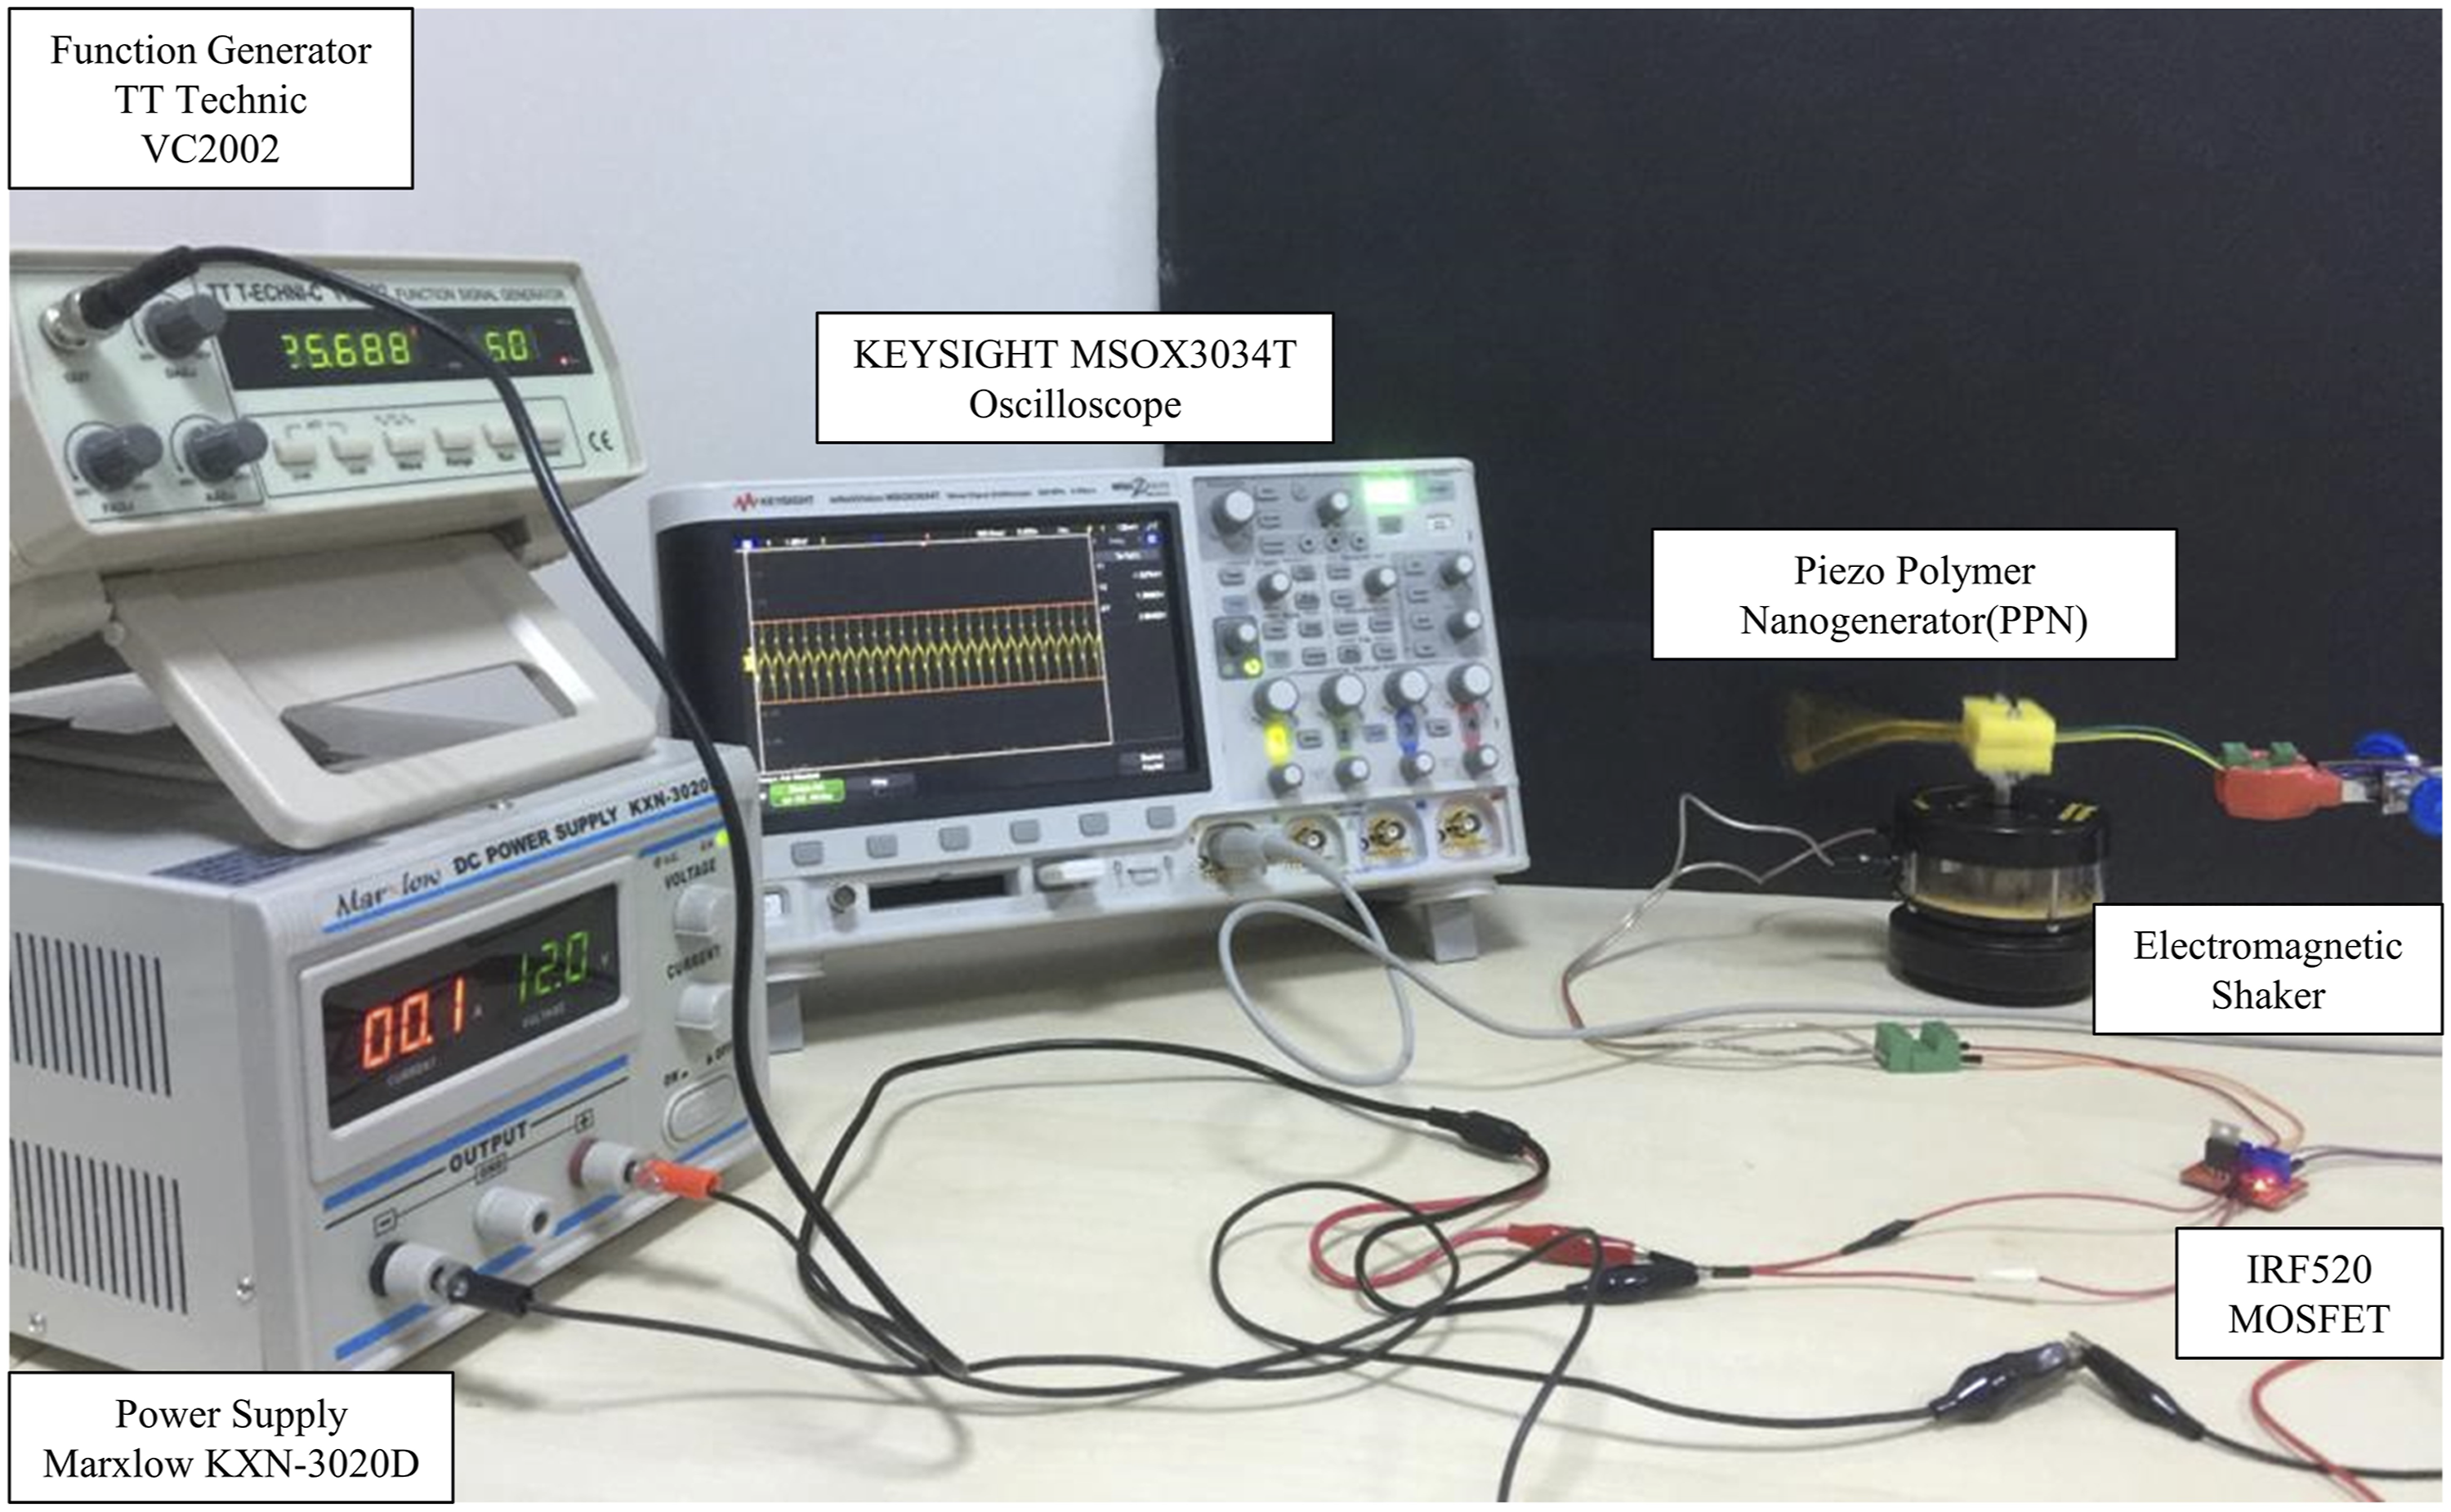
Numerical modelling
PPN’s finite element model was created to determine the natural frequencies of the cantilever beam structure. Frequency analysis was performed in Abaqus® Software using Abaqus/Standard solver. A composite layup modeling technique was chosen to create five layers of the composite beam (PET/AL/PVDF/AL/PET) with a 354 μm total thickness. The finite element model consists of 350 linear quadrilateral elements (S4R) and 396 nodes. Encastre boundary conditions (All degree of freedom was fixed) were applied for the endpoint of the beam. The first twelve fundamental frequencies of the cantilever beam were selected using the step toolbox of frequency analysis. Finite element analysis was carried out to predict the natural frequencies of the piezo polymer nanocomposite energy generator. The highest strains were observed at the first natural frequency of the system. Therefore, the most efficient piezoelectric performance of the nanogenerator was determined at the first natural frequency values.
Results and discussion
Morphological analysis
Morphological analysis of electrospun PVDF and PVDF/BaTiO3 nanofibers was performed using Scanning Electron Microscope (SEM). SEM images of electrospun PVDF nanofiber structures with three different concentrations of polymer solutions and four different solvent ratios are shown in Figure 4. SEM images of electrospun PVDF nanofiber structures with three different concentrations of polymer solutions and four different solvent ratios.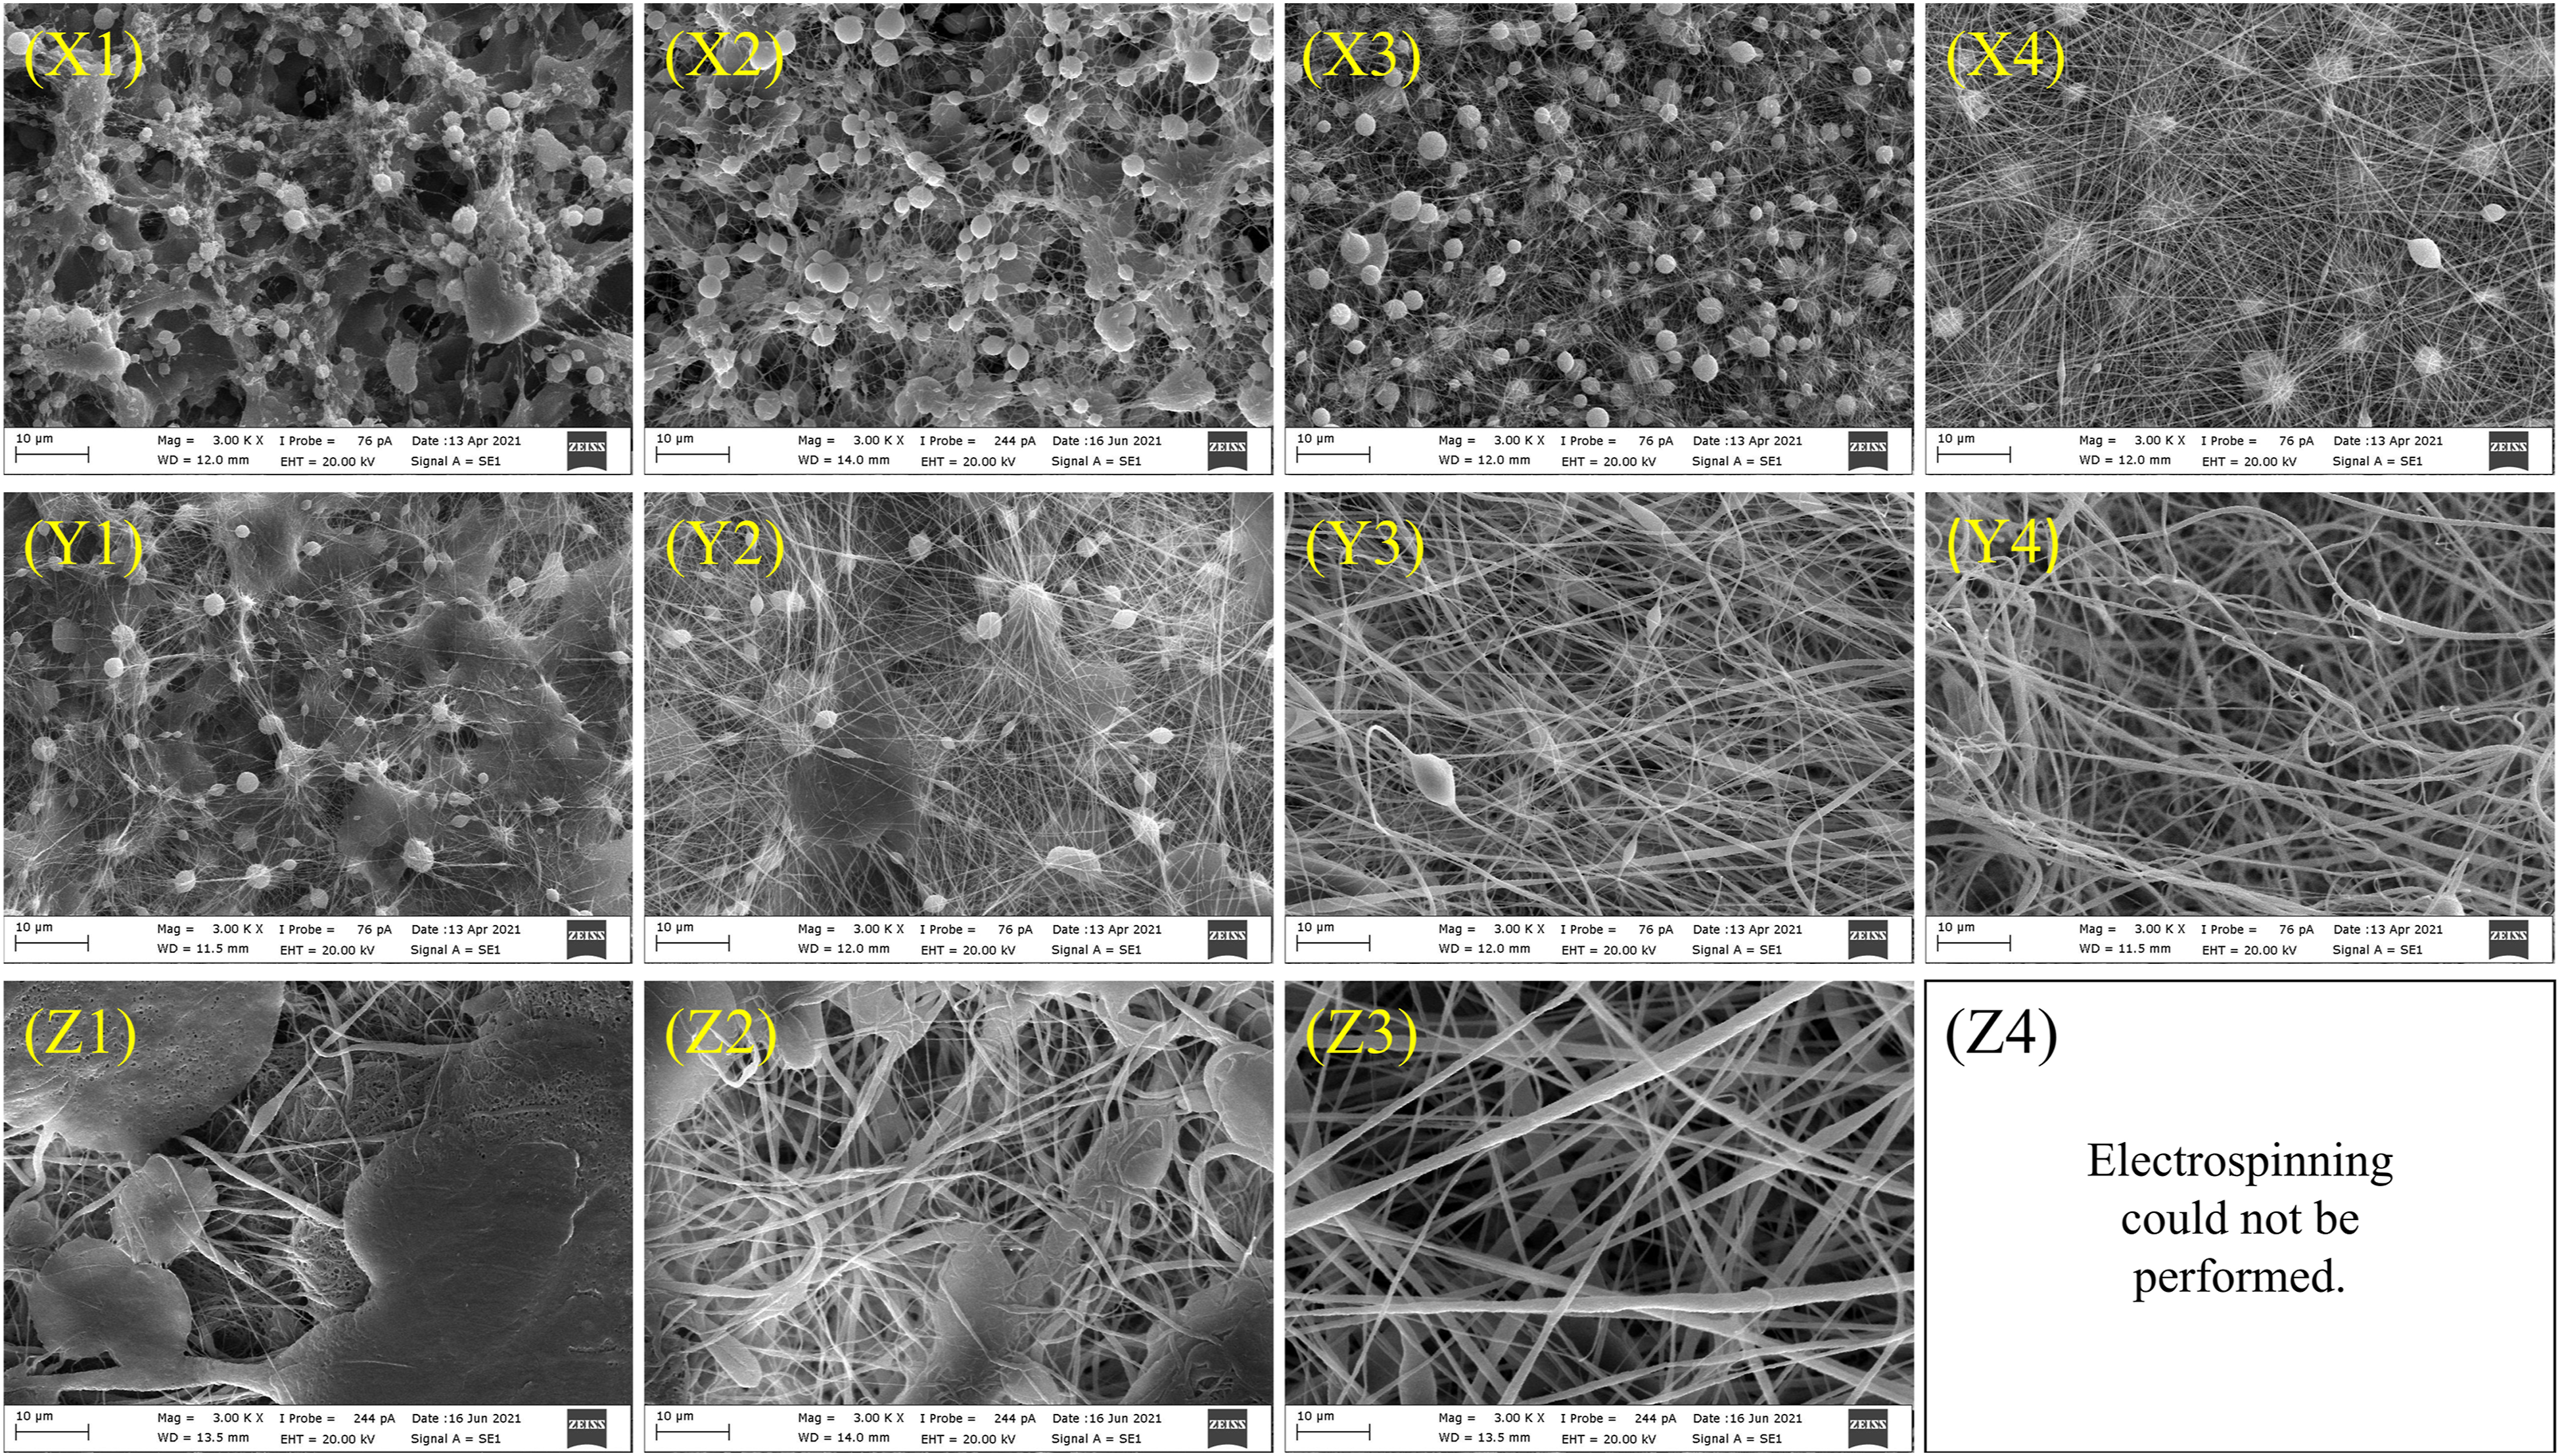
In Figure 4, SEM images are given at 10 μm scale and 3000x magnification. In electrospinning, the electrostatic force that arises from the electric field must overcome the surface tension of the polymer solution to occur the nanofiber formation. At low polymer concentration, the viscosity of the solution decreases depending on weak interaction between polymer molecules. A beaded structure occurs during the electrospinning process. As the polymer concentration increases, the interaction between the polymer molecule chains increases, and the viscosity of the solution increases. As a result, smoother nanofiber structures are formed. Nanofiber formation was observed with increasing polymer concentration (Y >X), as seen in Figure 4. Further increase in polymer concentration (Y1 → Z1, Y2 → Z2) caused a further increase in viscosity. In this case, a more strong polymer molecule chain entanglement occurred in the polymer solution and became difficult to be drawn by the electric field. Cessation of continuity occurred in the electrospinning jet, reduced the formation of nanofibers, and increased the beaded formation in the PVDF mat. The Acetone ratio in the solution significantly influences the formation of the nanofiber structure. The number of beads in the PVDF mats reduces as the Acetone concentration in the polymer solution increases (X1 → X4, Y1 → Y4, Z1 → Z3). Acetone increases the volatility of the solvent mixture. Due to the high solvent evaporation rate, more smooth nanofibers have formed throughout the electrospinning process. Another significant result of the increasing Acetone ratio in the solution is the thickening of nanofiber diameters (Y2→Y4).
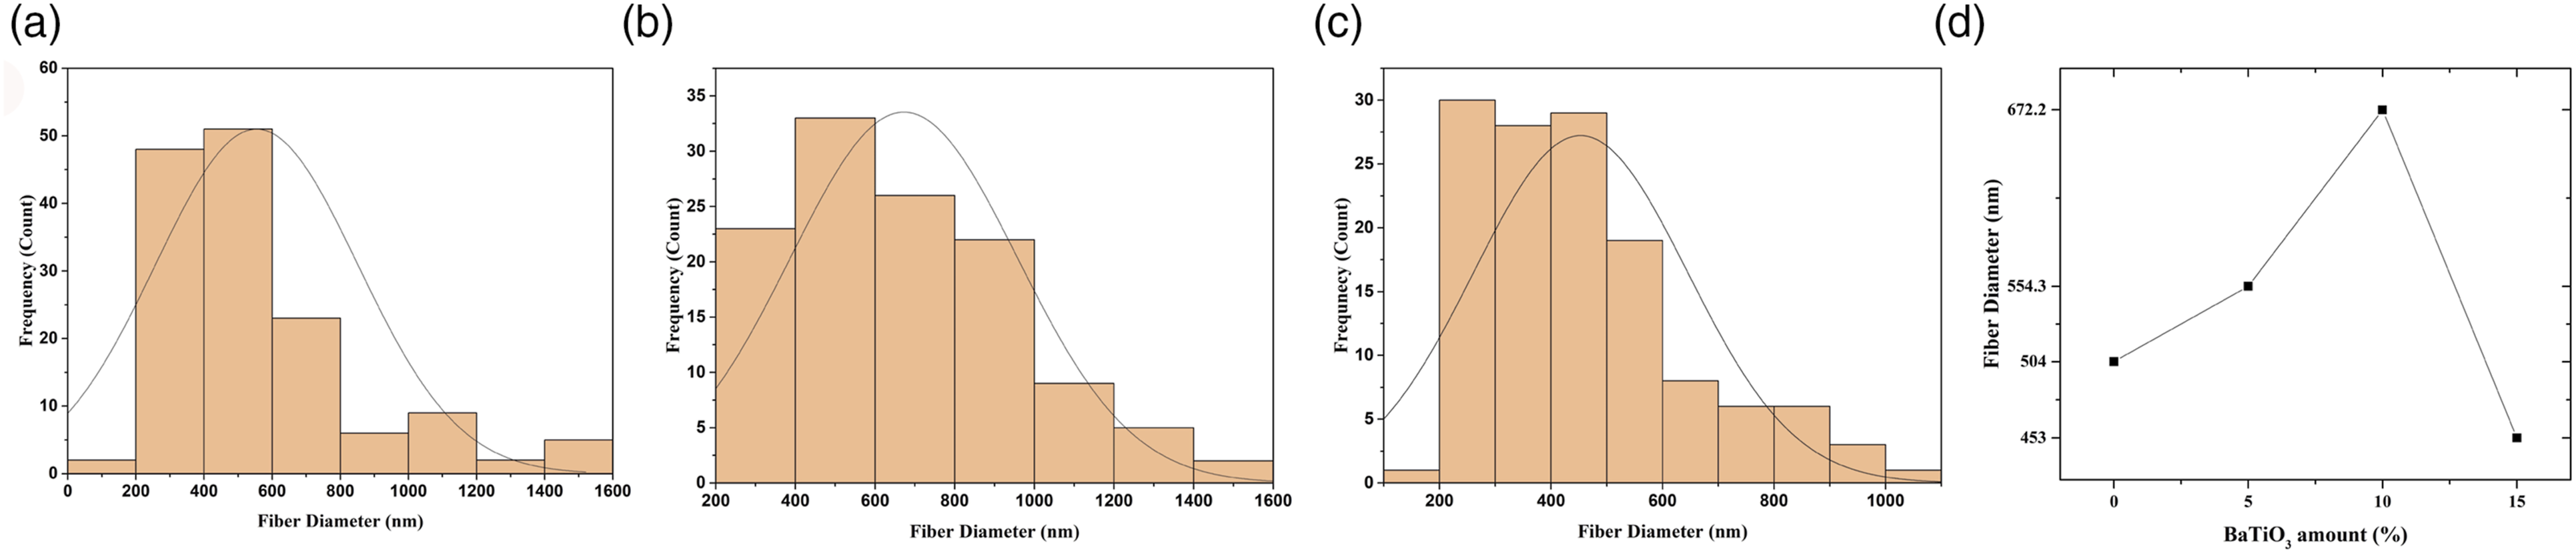
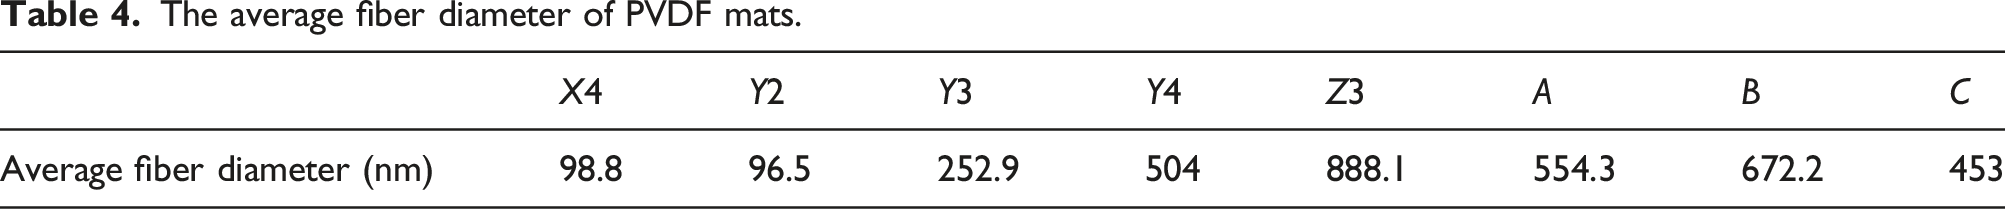
PVDF and solvent ratios were kept constant for 5 wt.%, 10 wt.% and 15 wt.% doped electrospun PVDF/BaTiO3 nanocomposites. (Y4, 15 wt.% PVDF, Acetone/DMF (6:4 v/v)). SEM images of PVDF/BaTiO3 nanocomposite fiber mats are given in Figure 5. SEM images are shown in 2000 and 6000 magnifications. The formation of smooth nanofibers was observed in A and B. The beaded structure was seen only in C. As the BaTiO3 ratio increases, discontinuities occur during jet formation at the needle tip during electrospinning. That causes the formation of beaded structures, as seen in Figure 5(c). The mean diameters of the nanofibers are given in Table 4. Nanofiber’s diameters were calculated in Image J software. SEM images of electrospun of PVDF/BaTiO3 nanocomposites with three different BaTiO3 content (a) (5 wt.%, (b) (10 wt.%), (c) (15 wt.%). Labels of PVDF/BaTiO3 nanocomposite.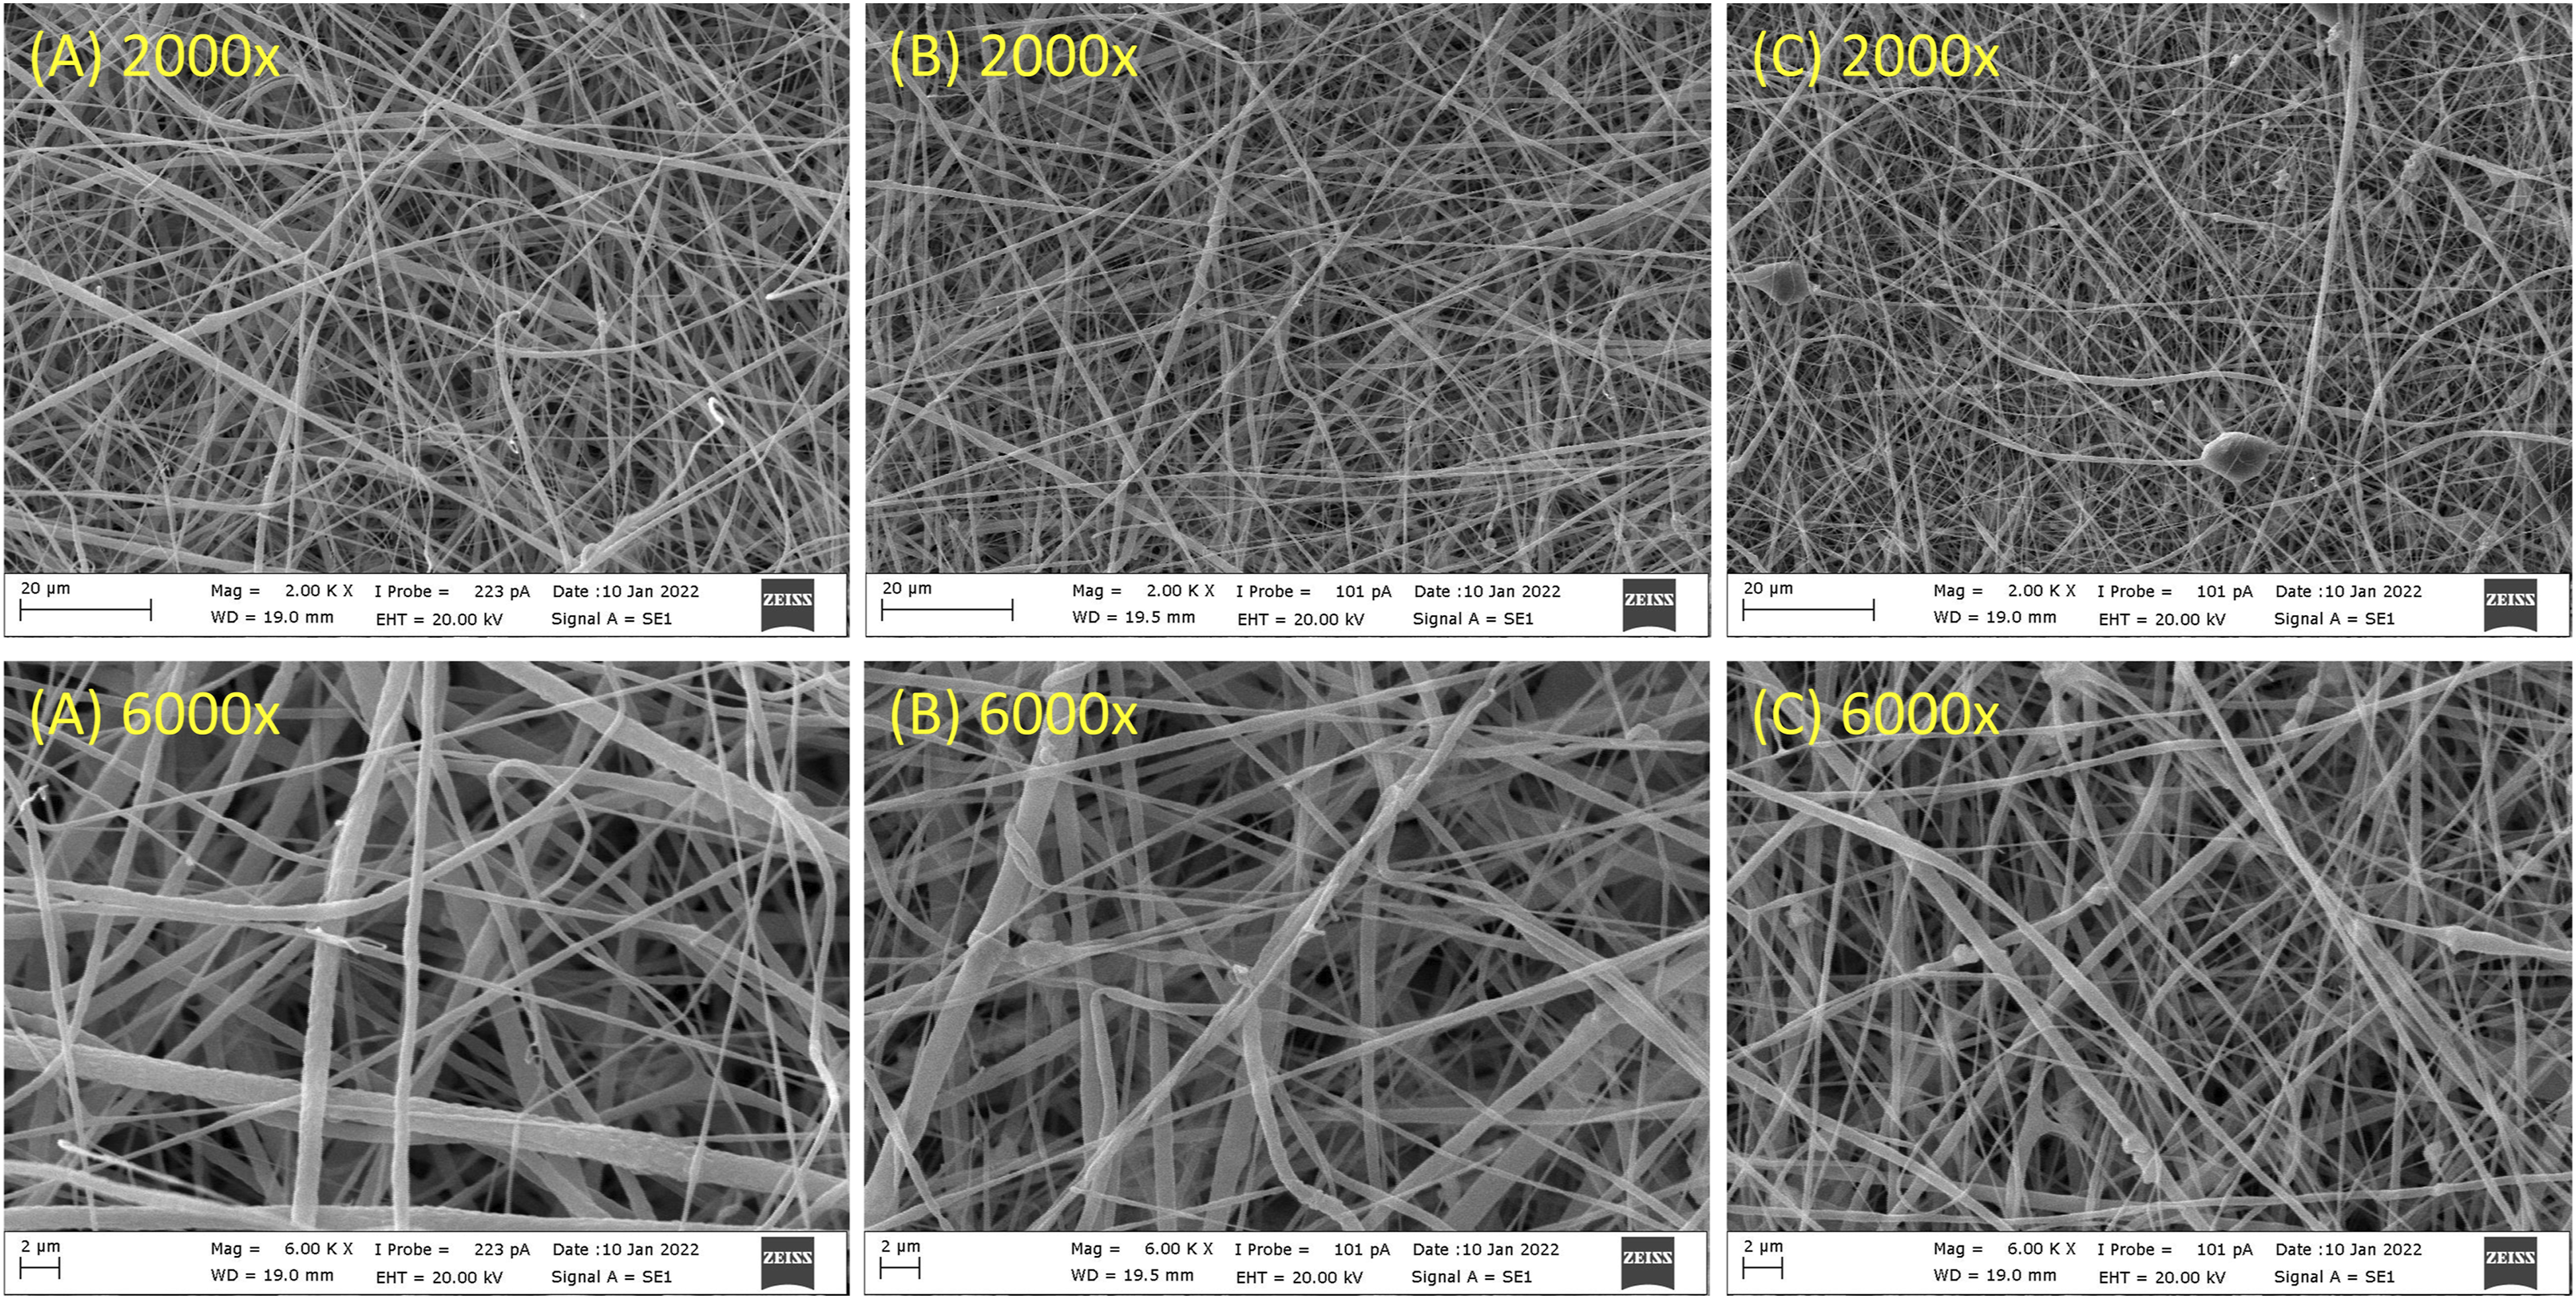
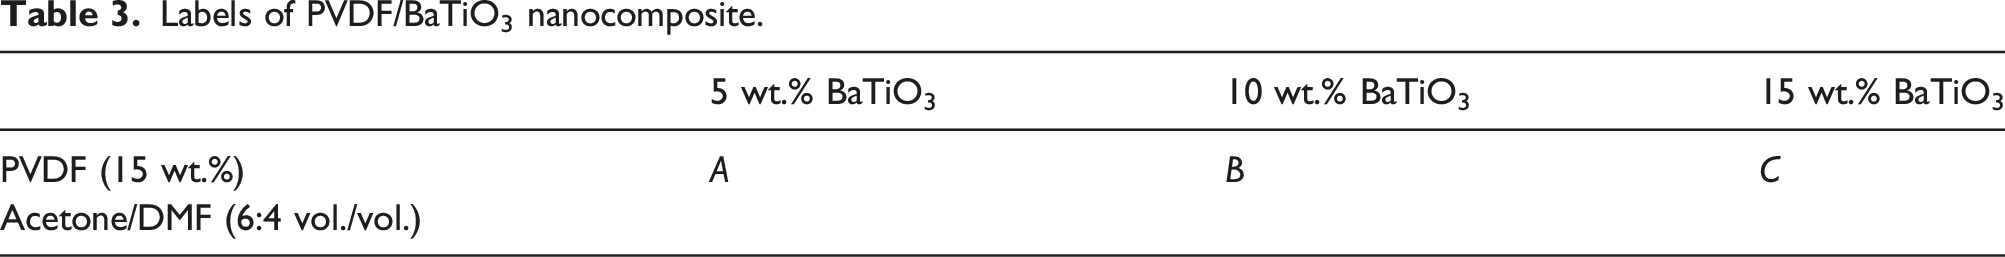
Figure 6 shows the nanofiber size distribution of X4, Y2, Y3, Y4, and Z3. Figure 7 shows the nanofiber size distribution of PVDF/BaTiO3 nanocomposites. Seventy readings have been taken for each SEM image to calculate the average nanofibers diameters. Among the electrospun PVDF mats, Z3 has the highest average fiber diameter at 888.1 nm. In the polymer solution (Z4) at 20% concentration and Acetone/DMF (6:4 vol./vol.) solvent ratio, complete evaporation has occurred from the needle tip to the collector with the effect of the high evaporation rate. Then the solid macromolecular interaction between the polymer chains was caused to high surface tension. As a result, the electrospinning jet was not formed. The Acetone ratio of the solvent has functioned as a critical parameter for controlling the electrospinning process as a matter of PVDF nanofiber size and morphology. It is known that, with the voltage level increase, the electrospun jet will be subjected to more elongation forces and increase the beta phase fraction in the fiber mats. The nanofiber size distribution of (a) X4, (b) Y2, (c) Y3, (d) Y4, and (e) Z3, (f) Fiber diameters of electrospun PVDF mats. The nanofiber size distribution of PVDF/BaTiO3 nanocomposites. (a) 5 wt.% BaTiO3 (b) 10 wt.% BaTiO3 (c) 15 wt.% BaTiO3 (d) Fiber diameters of electrospun PVDF/BaTiO3 mats.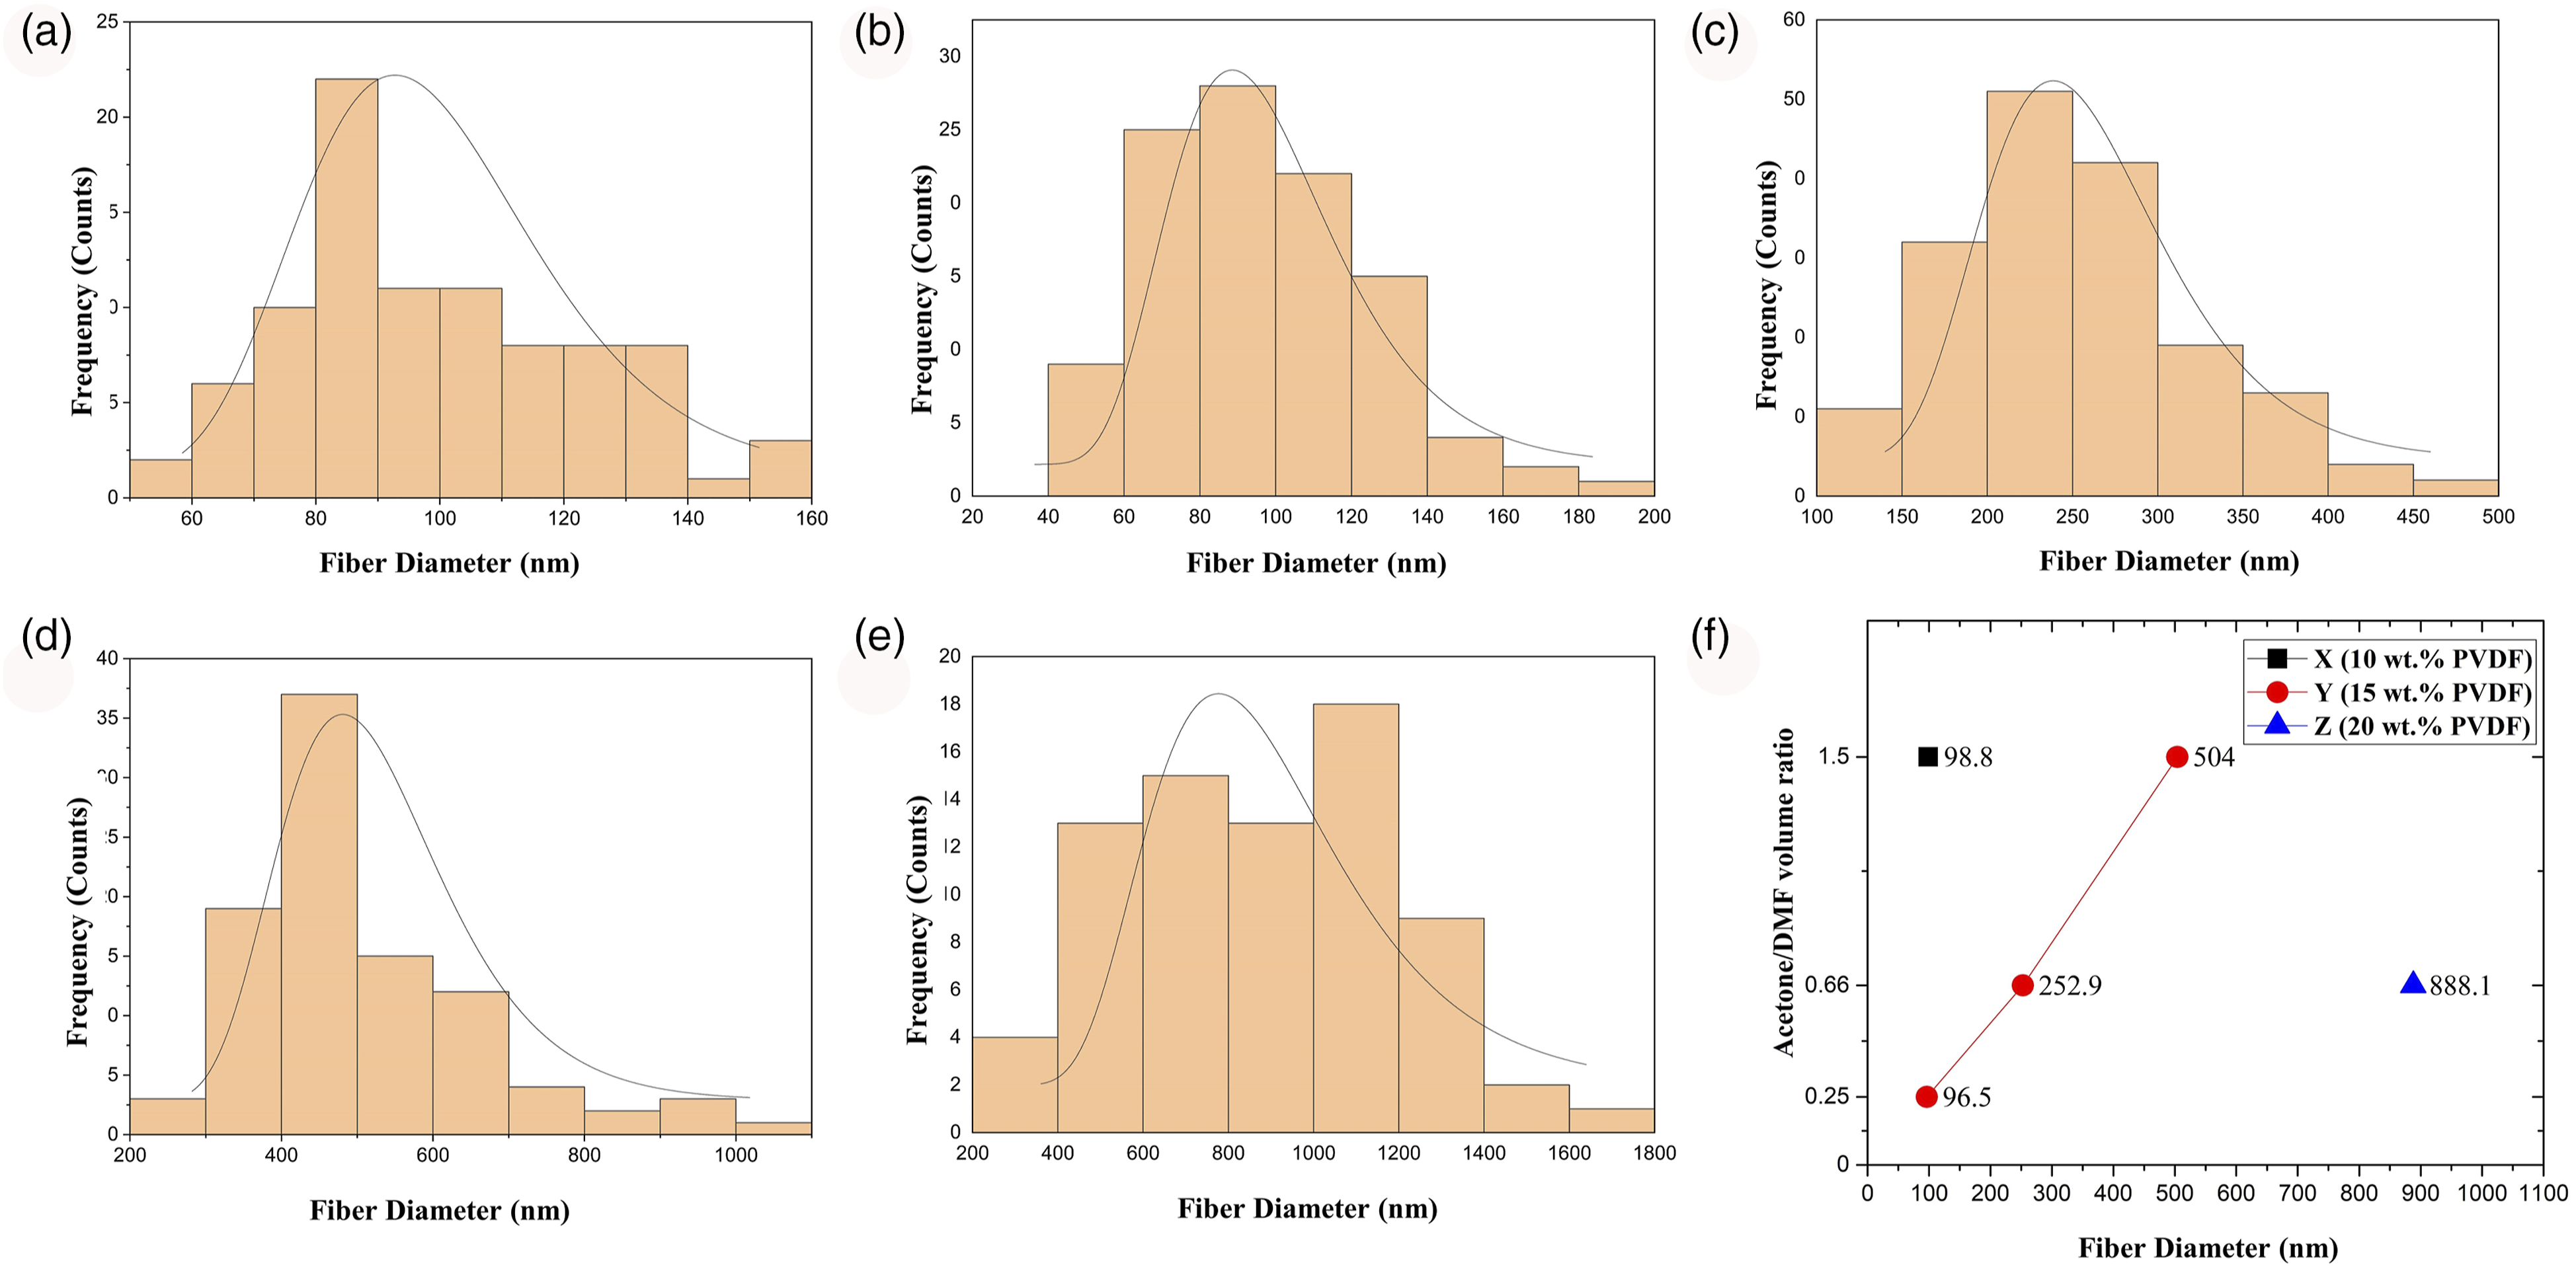
Additionally, the high voltage will induce a higher electric field between the collector and the needle tip. The high electric field will cause a higher poling process. As a result, the beta phase ratio will be higher. However, a high elongation force can cause discontinues in the electrospun jet and lead to a beaded structure within the nanofibers. The Tip to Collector Distance (TCD) parameter affects beta phase formation in two ways. If the TCD increases, there will be sufficient time for the nanofibers to elongate and the solvent to evaporate. This will positively affect the beta phase formation.
On the other hand, the increase in TCD will harm beta phase formation since the electric field strength will decrease, and the continuity of the electrospinning jet will be disrupted. Another parameter, the feeding rate, directly affects the Taylor cone formation and electrospun fiber morphology. A low feeding rate causes a vacuum in the needle. At high feed rates, the polymer will accumulate towards the needle tip, thus disrupting the Taylor cone formation. In the electrospinning process, a suitable and optimum feeding rate is necessary for each applied voltage for beadless nanofibers formation. In this study, voltage, feed rate, and distance were selected and kept constant, considering the previous optimization studies in the literature.37,38 The effects of solvent type, solution concentration, and filler concentration parameters on the morphology of the nanofiber structure were profoundly investigated.
FTIR analysis
The piezoelectric properties of PVDF mats depend on β phase content. PVDF phase analyses are carried out using FTIR measurements. FTIR is preferred in PVDF phase analysis because it is a low-cost, fast, and practical approach. Numerous investigations in the literature have validated the wavenumber acquired from the FTIR study, which defines the phases of PVDF, and are clearly described with a wavenumber of 840 cm−1. It was identified as the most significant peak of the β phase. The strongest peak of the α phase is stated to be 766 cm−1.64–74 As a result of all of this, crystalline phase analyses and crystalline phase percentages were investigated in the presented study using FTIR measurements
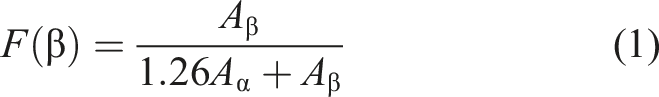
FTIR analyses were conducted for each sample to specify the degree of crystallinity of the β phase content. Figure 8 shows the FTIR spectrum of each electrospun PVDF and PVDF/BaTiO3 nanofibers. Equation (1) was used to calculate the β phase fraction of electrospun PVDF and PVDF/BaTiO3 mats.
75
The FTIR spectrum of each electrospun PVDF and PVDF/BaTiO3 nanofibers: (a) X, (b) Y, (c) Z (d) A (5 wt.% BaTiO3), B (10 wt.% BaTiO3), C (15 wt.% BaTiO3) and Y4. The average fiber diameter of PVDF mats. β phase content of electrospun nanofiber mats.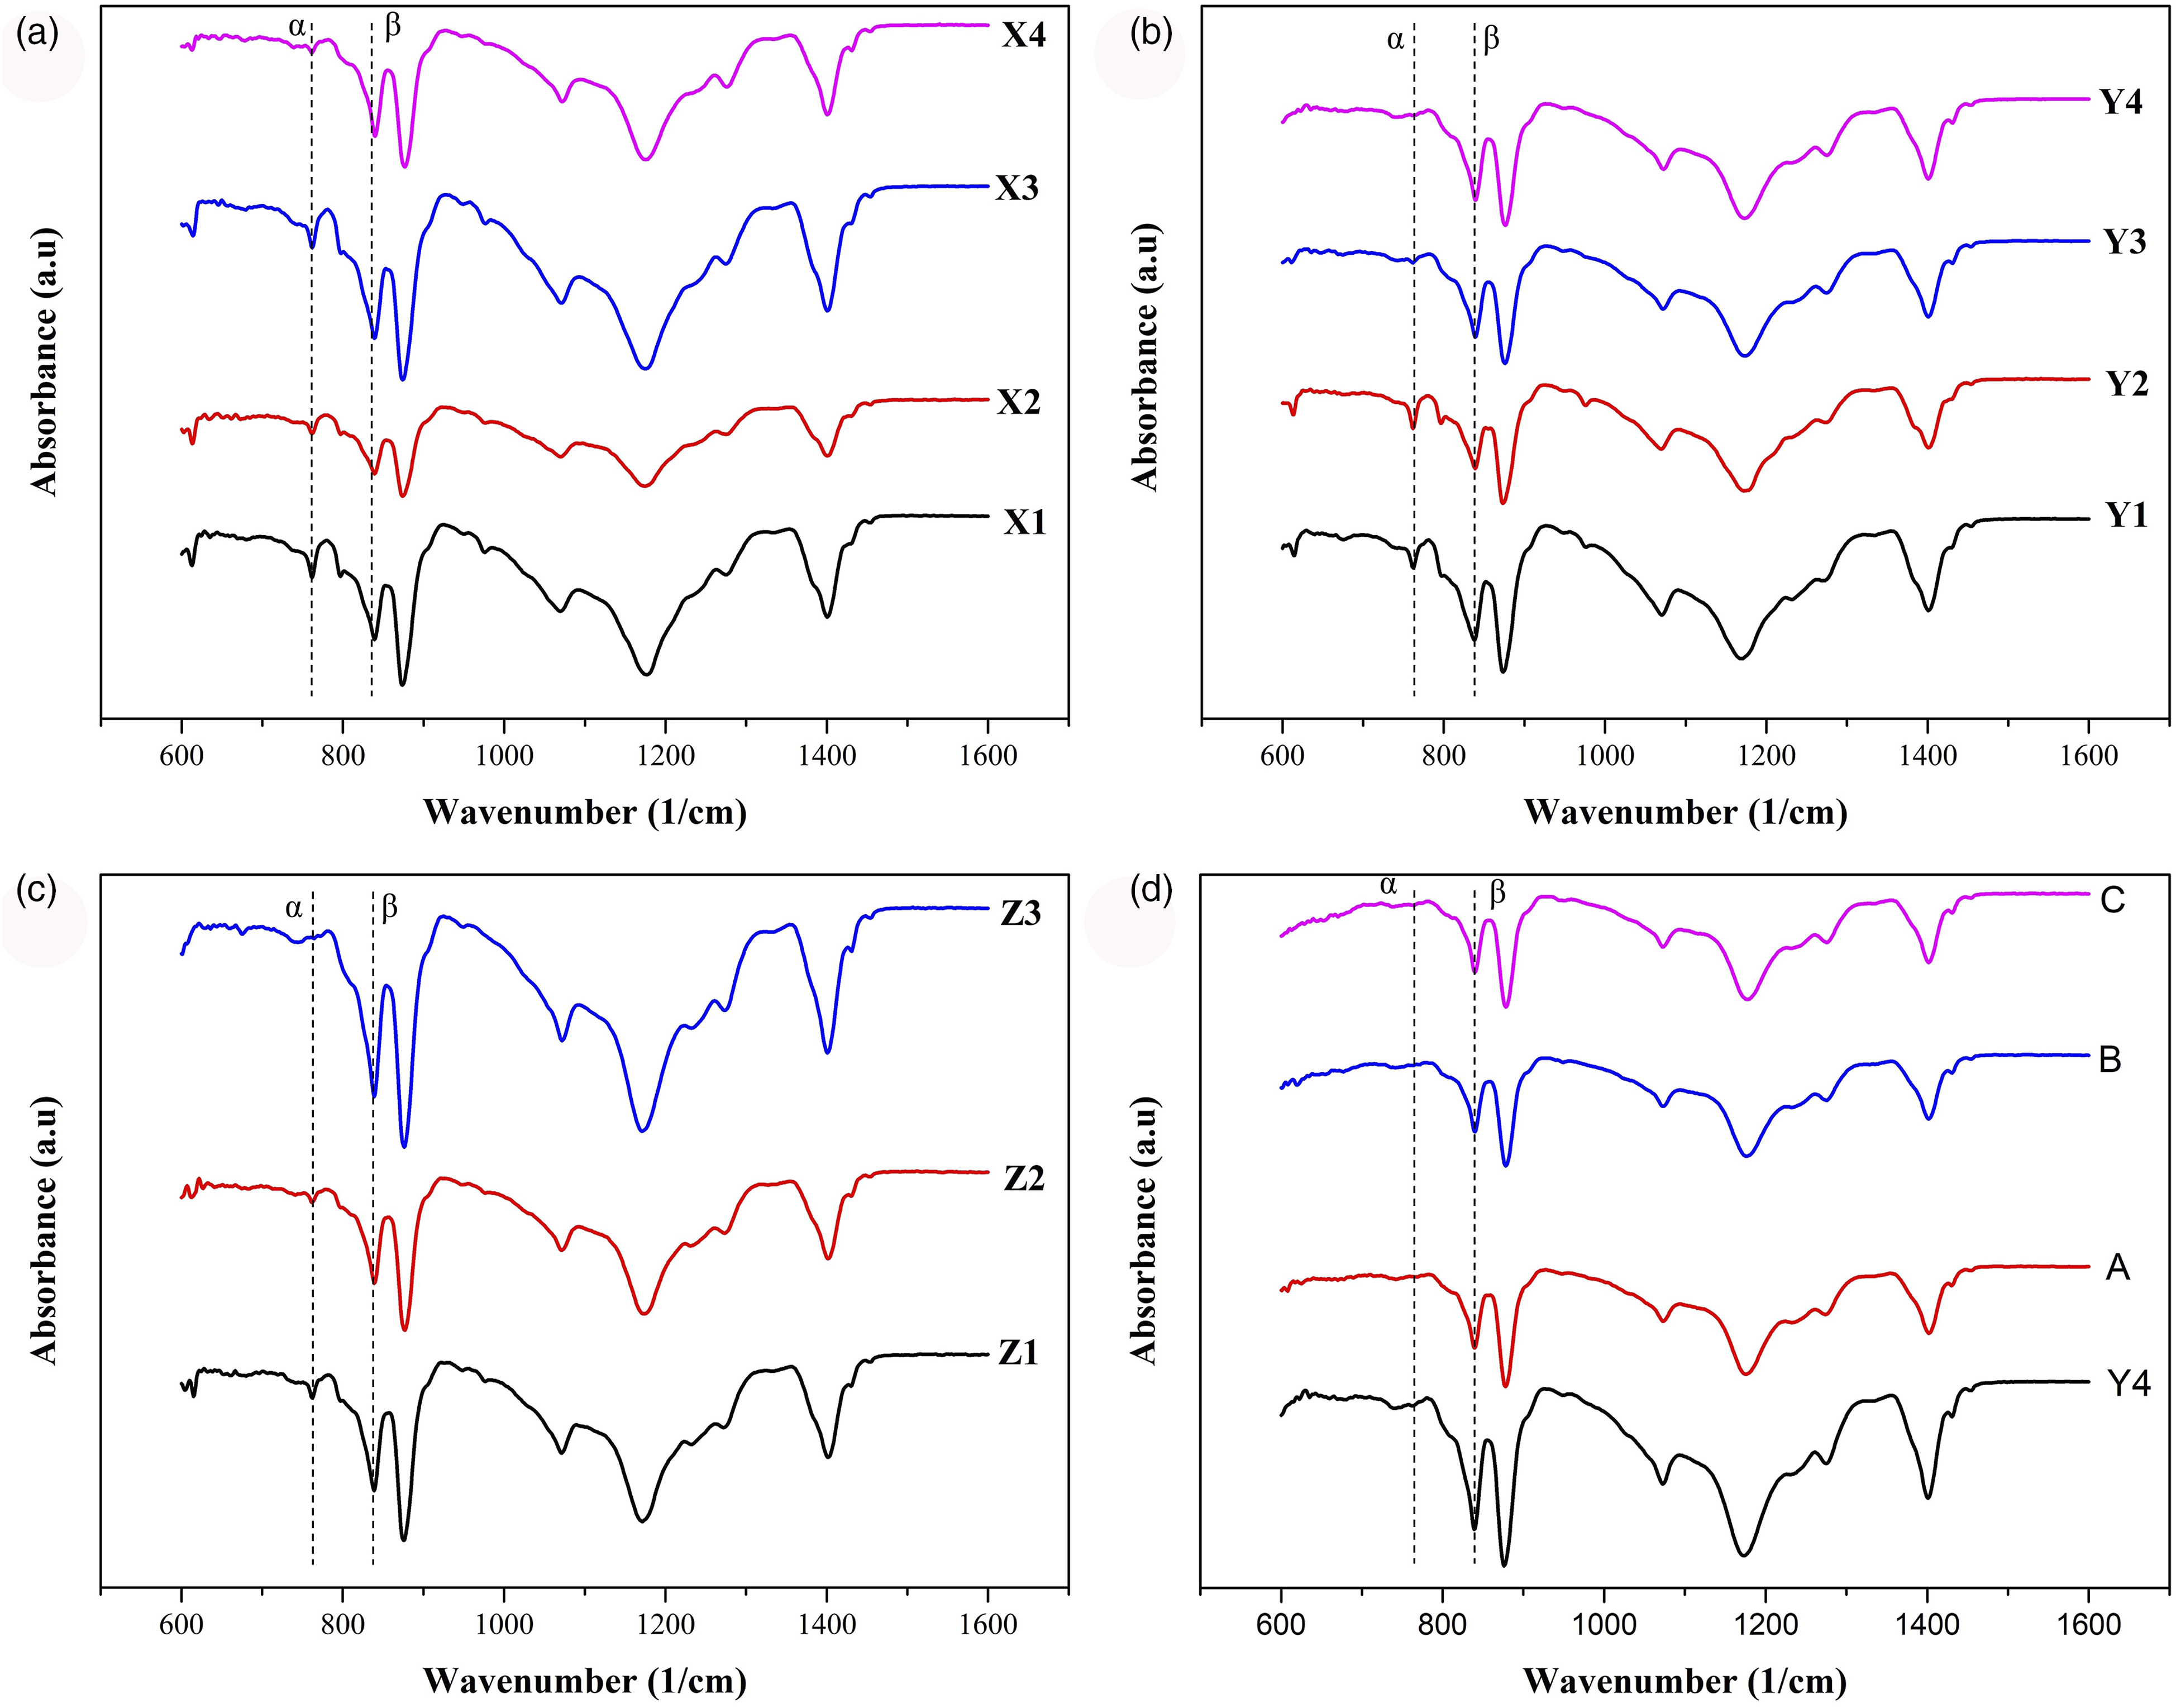
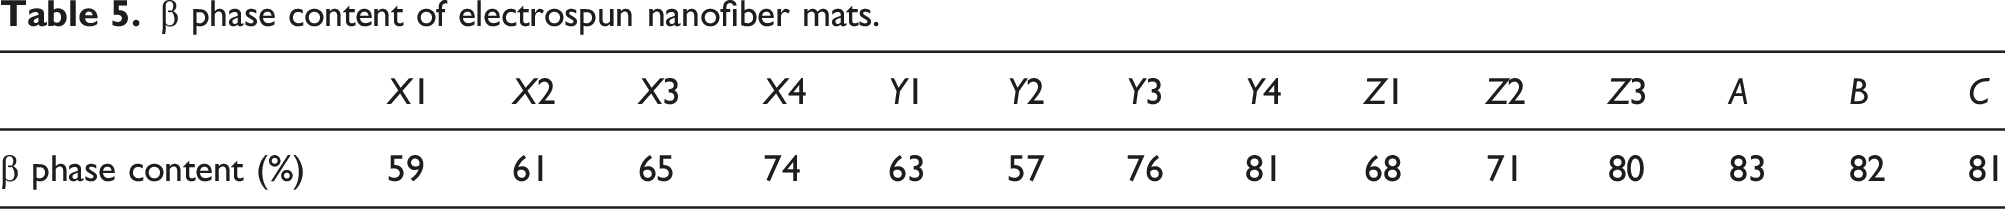
According to the FTIR measurements, the β phase ratio steadily increased as the Acetone/DMF ratio increased. In electrospun PVDF mats, the highest β phase ratio was calculated at Y4 as 81%. The addition of Acetone decreased the viscosity of the polymer solution. The stretch force overcame the surface tension of the solution during the electrospinning process, and then smooth nanofibers were obtained. A high rate of β phase fraction has occurred by the high stretch force depending on the Acetone ratio. β phase ratios were up to 76%, 81%, and 80% at Y3, Y4, and Z3 (beadless nanofibers). In electrospun PVDF/BaTiO3 nanocomposite, the β phase ratio has reached up to 83%. It has been observed that BaTiO3 particles in PVDF induce more β phase. To emphasize, the most critical parameter in β phase formation is the Acetone/DMF ratio according to FTIR results.
Piezoelectric vibration energy harvesting
Piezo polymer nanogenerators were produced to compare the piezoelectric performances of electrospun mats. The piezo polymer nanogenerators (PPN) were used to harvest energy from vibration. Cantilever beam-type energy harvesters were tested at resonance frequency to obtain maximum output performance of PPN. A finite element model was created to determine the natural frequencies of the cantilever beam without a tip mass before the tests were carried out. The finite element model was solved using Abaqus® Software. The first fundamental frequency of the system was found as 15.17 Hz. Figure 9 shows the FEM result and energy harvesting test. The FEM result (a) and energy harvesting test (b).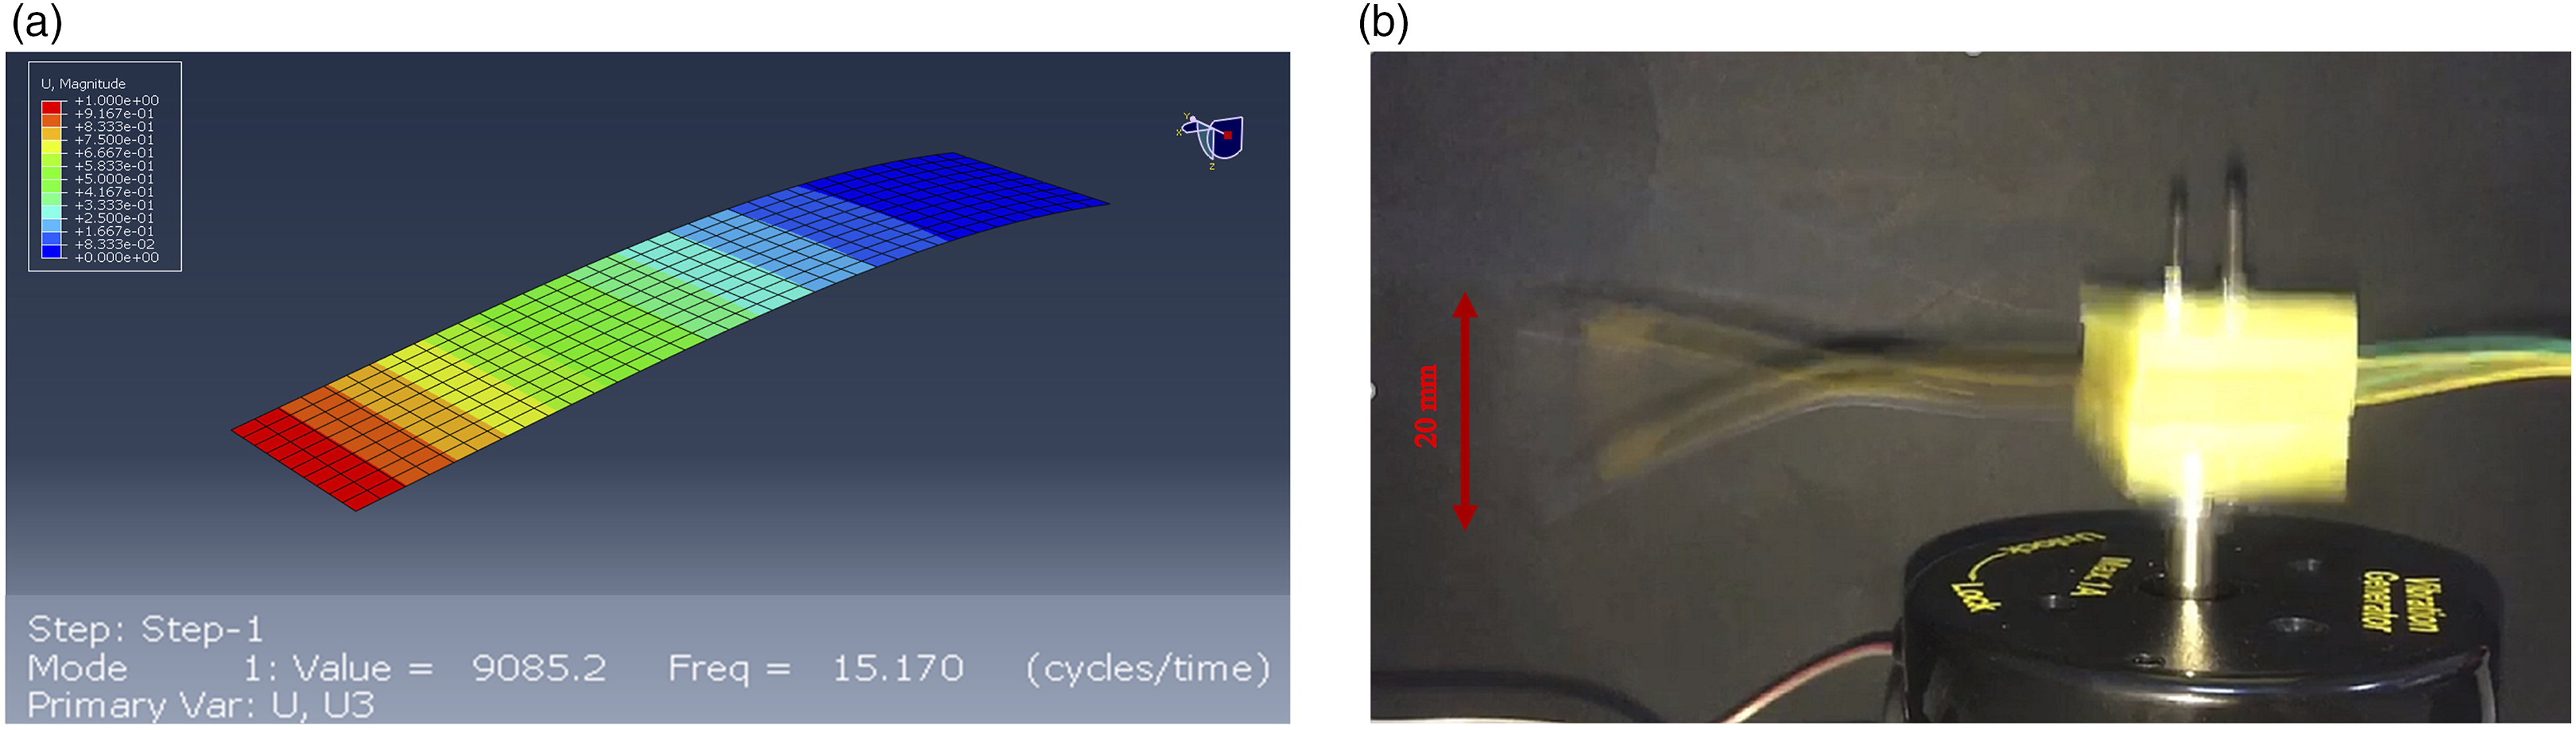
15.7 Hz frequency was applied using the function generator to the electromagnetic shaker. Tip to tip displacement of PPN was measured as 20 mm. Each piezo polymer nanogenerators (PPNs) were tested at the high amplitude resonance frequency, as shown in Figure 9. Open-circuit output voltage values were gathered using the KEYSIGHT MSOX3034T Oscilloscope. Effective voltage (root mean square) values were calculated using equation (2).
46
Figure 10 demonstrates the general output voltage profile of the piezoelectric nanogenerator. The PPN signal profile consists of two bending stages. The dipole moments in the nanofibers are orienting due to the bending load, and potential difference occurs between the PPN electrodes. The charges are transferred to the circuit via positive and negative electrodes. The open-Circuit output voltage of Z3 at 3.3 MΩ reference load resistance.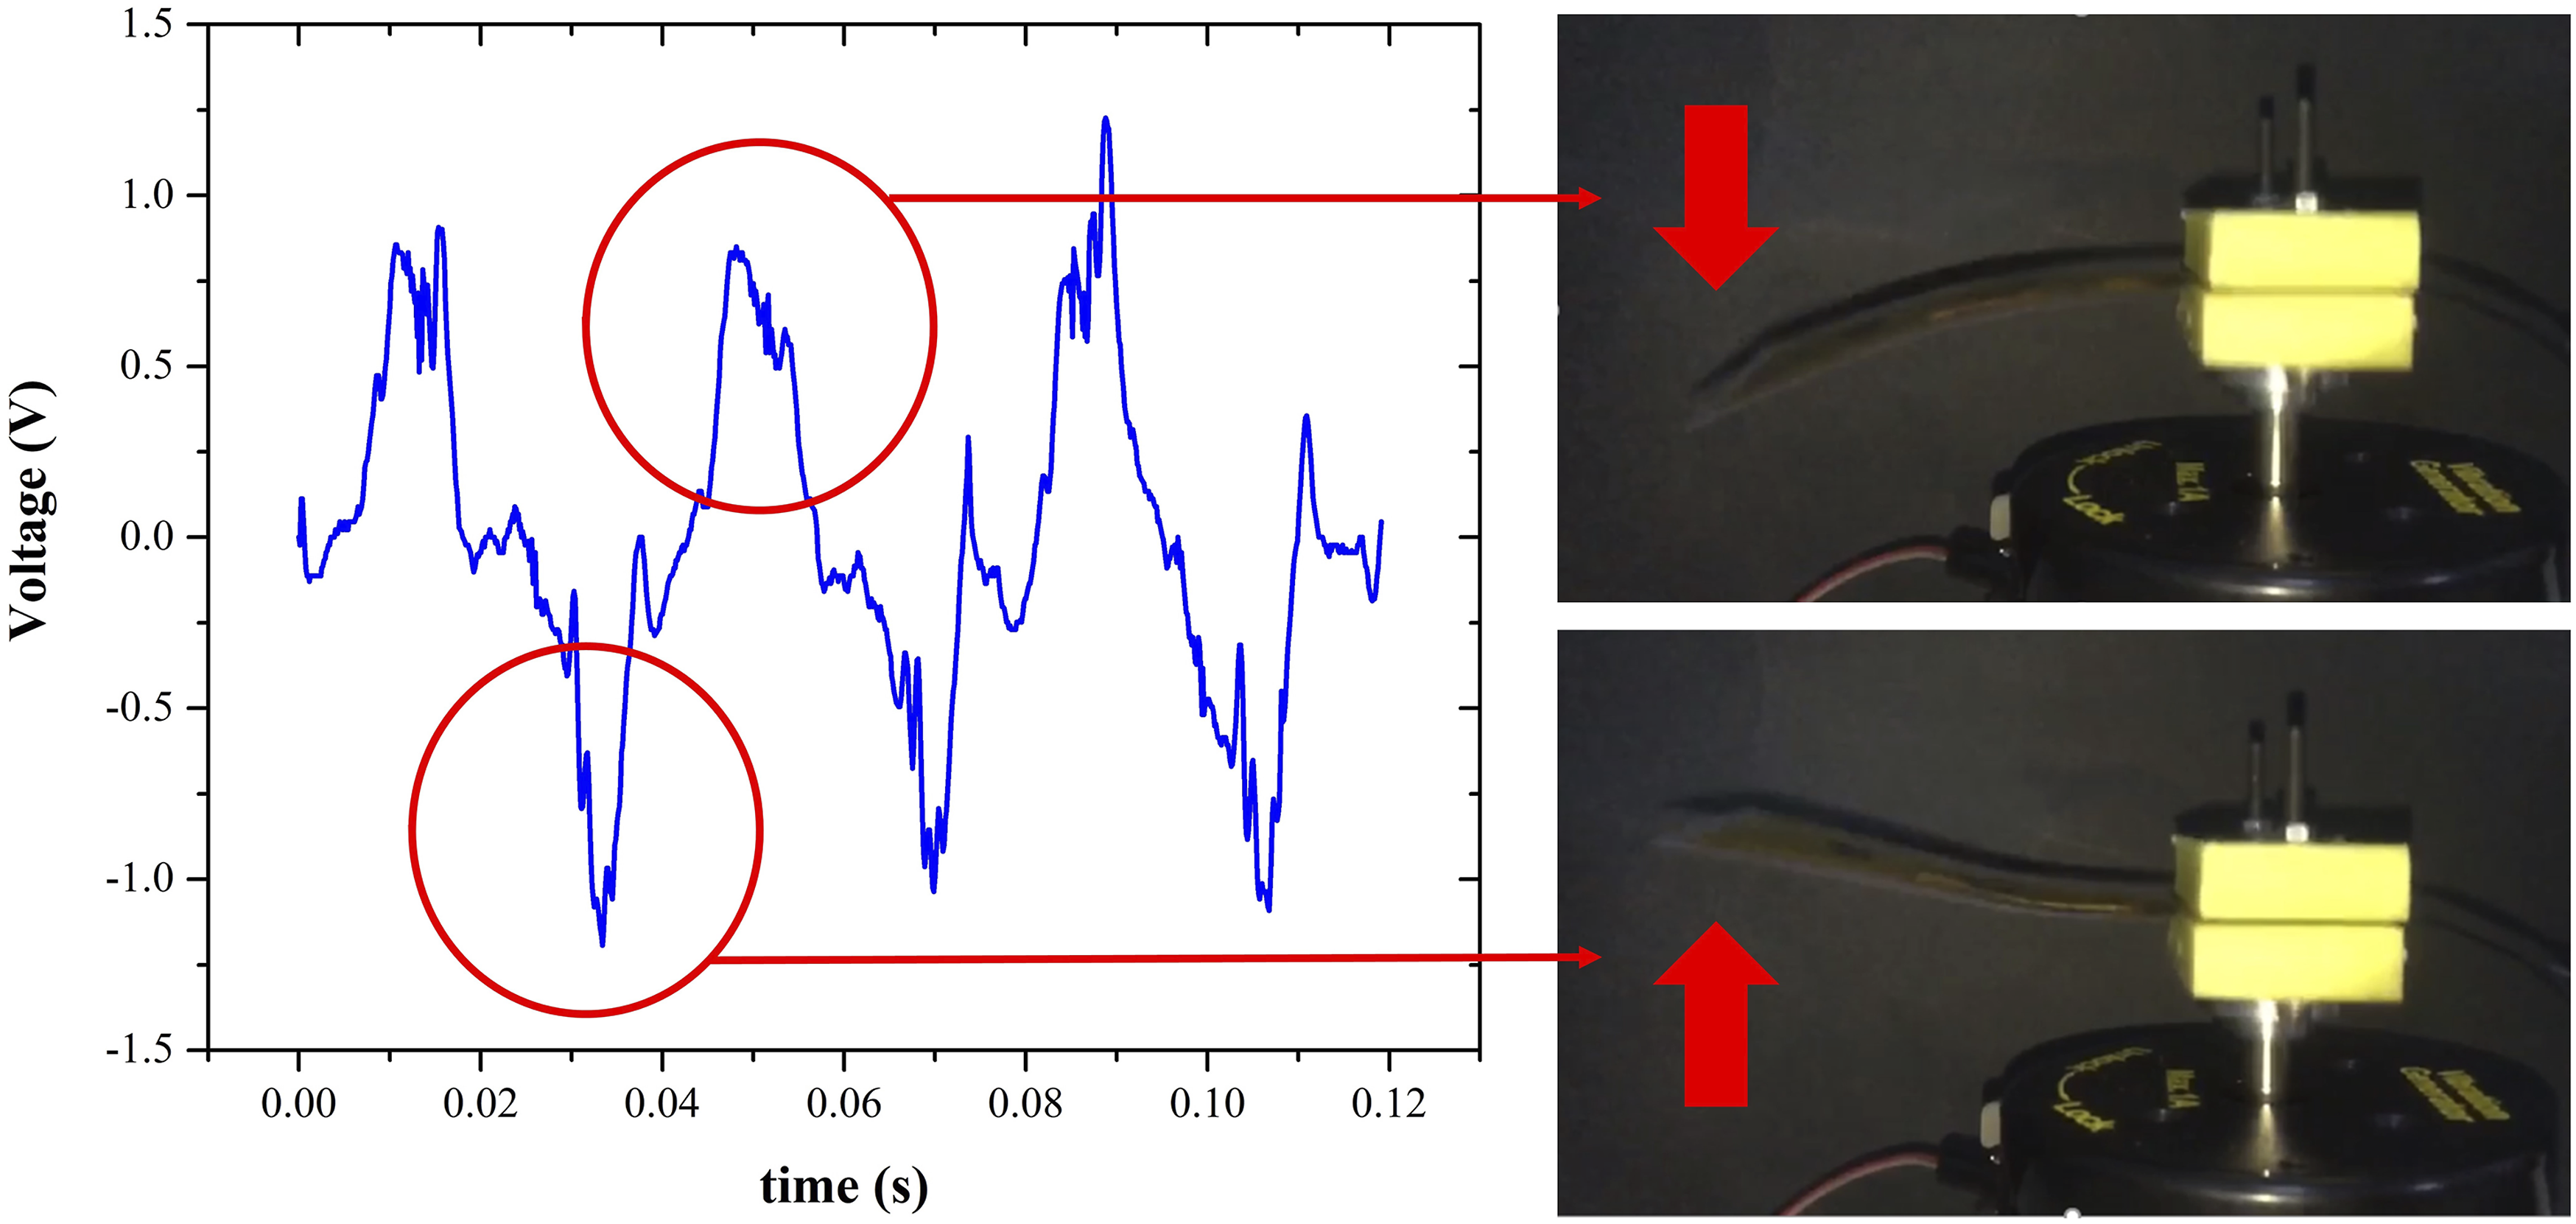
As the first step of the study, piezoelectric output voltages of eleven different PVDF nanogenerators were determined under a reference load (3.3 MΩ). The highest output voltage values were measured at X4, Y4, and Z3 as 432 mV, 674 mV, and 492 mV, respectively. Among the nanogenerators tested at reference load values, the highest piezoelectric output was calculated on Y4.
Vrms values changing at 3.3 MΩ load resistance with Acetone/DMF ratio are given in Figure 11(a) β phase content has a direct effect on the piezoelectric output. Besides, Morphologic structure also affects the output voltage values. High output difference was measured between Y4 (81% β phase) and Z3 (80% β phase) as a 182 mV. The piezoelectric output source is the dipole moments that are built in the electrospun PVDF structure. There are two fundamental scientific reasons why the Y4 (6:4 Acetone/DMF) ratio shows better piezoelectric properties than X4, Z3 and others. The first main reason is that during the electrospinning process, the ratio of Acetone increases in the solution, resulting in a beadless fiber structure. In this way, more beta phase is induced. The ratio of the beta phase directly affects the piezoelectric output performance. Another reason is that depending on the formation of a beadless fiber structure, a higher level of electron charge transfer was due to dipole moments between nanofibers. Y4 has more uniform nanofibers and directed dipole moments than Z3. Dipole moments in Y4 transferred more charges to the surface compared to Z3. Although X4 has a 74% β phase ratio, the beads in the nanofiber structure decreased the piezoelectric output value. (a) Vrms values of electrospun PVDF mats, (b) Piezoelectric power output values at 3.3 MΩ load resistance.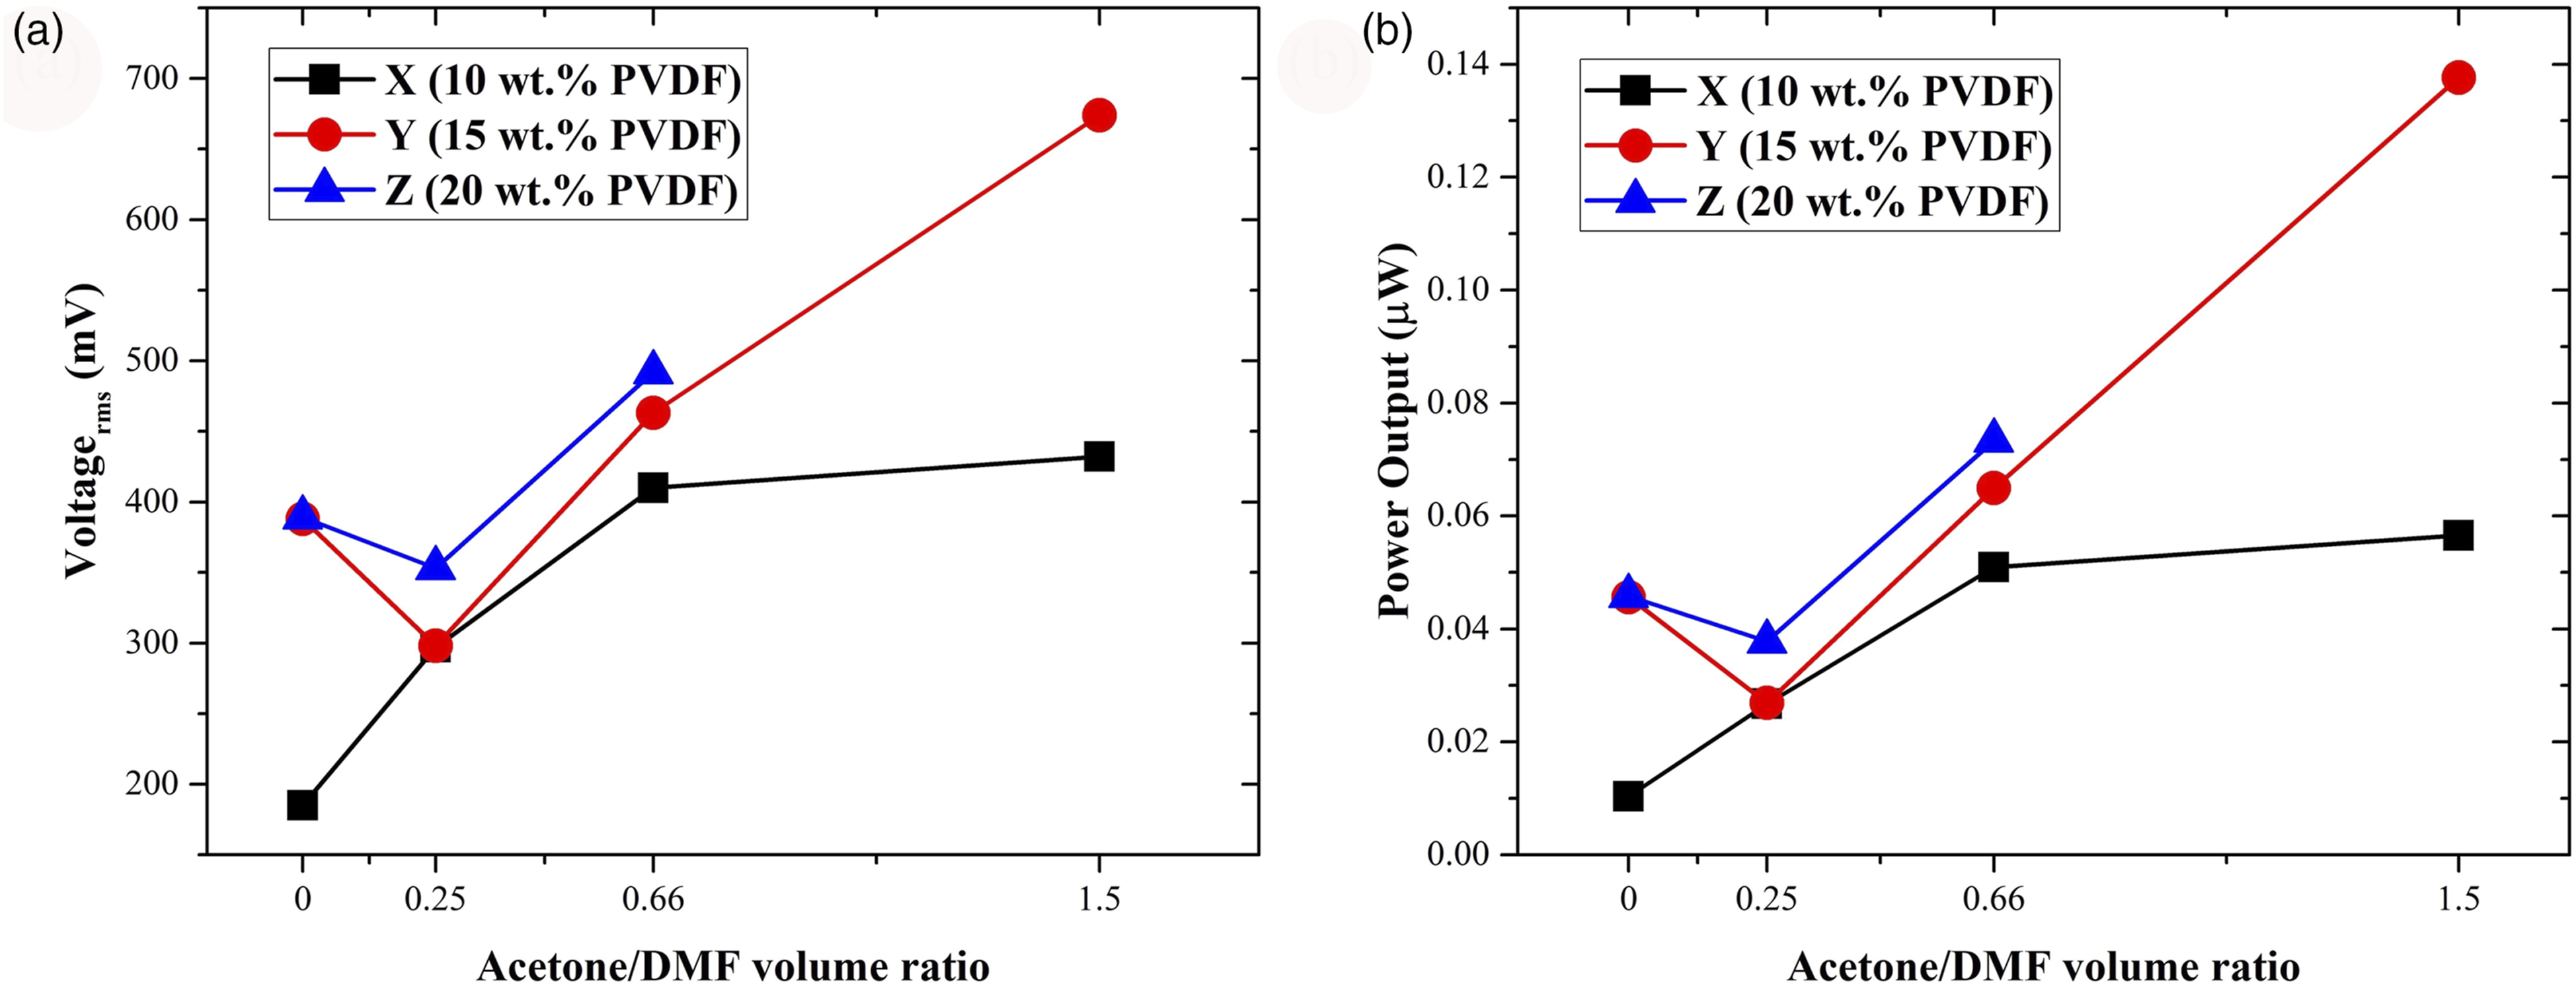
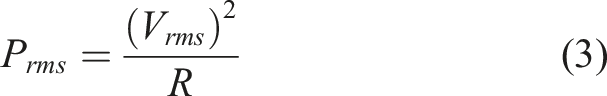
Equation (3) was used to determine the power values produced by the PPNs.
Piezoelectric power output values are given in Figure 11(b). The highest power value was measured at Y4 as 0.137 μW in electrospun PVDF mats.
In the second stage of the study, tests of PVDF/BaTiO3 piezo polymer nanocomposite energy generators were carried out. Y4, with the highest piezoelectric output determined by the first tests, and nanogenerators with three different BaTiO3 nanoparticle ratios were tested. Figure 12(a) illustrates the open-circuit output voltage values of Y4 (15 wt.% PVDF, Acetone/DMF (6:4 vol./vol.)), A (15 wt.% PVDF, Acetone/DMF (6:4 vol./vol.), 5 wt. % BaTiO3), B (15 wt.% PVDF, Acetone/DMF (6:4 vol./vol.), 10 wt. % BaTiO3), and C (15 wt.% PVDF, Acetone/DMF (6:4 vol./vol.), 15 wt. % BaTiO3). Due to high arranged dipole moments, the highest voltage value was measured in A as a 2 Volt. (5 wt.% PVDF/BaTiO3). As the third stage of the piezoelectric energy generator tests, the tests were carried out between 1 MΩ and 30 MΩ to find the optimum load resistance for the A nanogenerator, where the highest piezoelectric output is provided. Figure 12(b) shows the Vrms and current values at different load resistors. The optimum load resistance has been determined as 10 MΩ. The optimum power value is calculated as 0.243 μW, as shown in Figure 12(c). For optimum power values, the piezoelectric output voltage was calculated as 1.56 V and the current value as 0.156 μA. In the last stage of the study, a test was carried out with the help of a rectifier bridge circuit using A (5 wt.% PVDF/BaTiO3) piezo polymer nanogenerator to charge the 1 μF 50 V capacitor. The capacitor was charged to 1.5 V in 10 s at a resonant frequency of 15.7. Test results are shown in Figure 12(d). (a) The open-circuit output voltage values of Y4, A, B, and C, (b) Vrms and current values of A PVDF/BaTiO3 PPN (c) Piezoelectric power output values at different load resistance (d) The voltage charge curve for a 1 μF capacitor.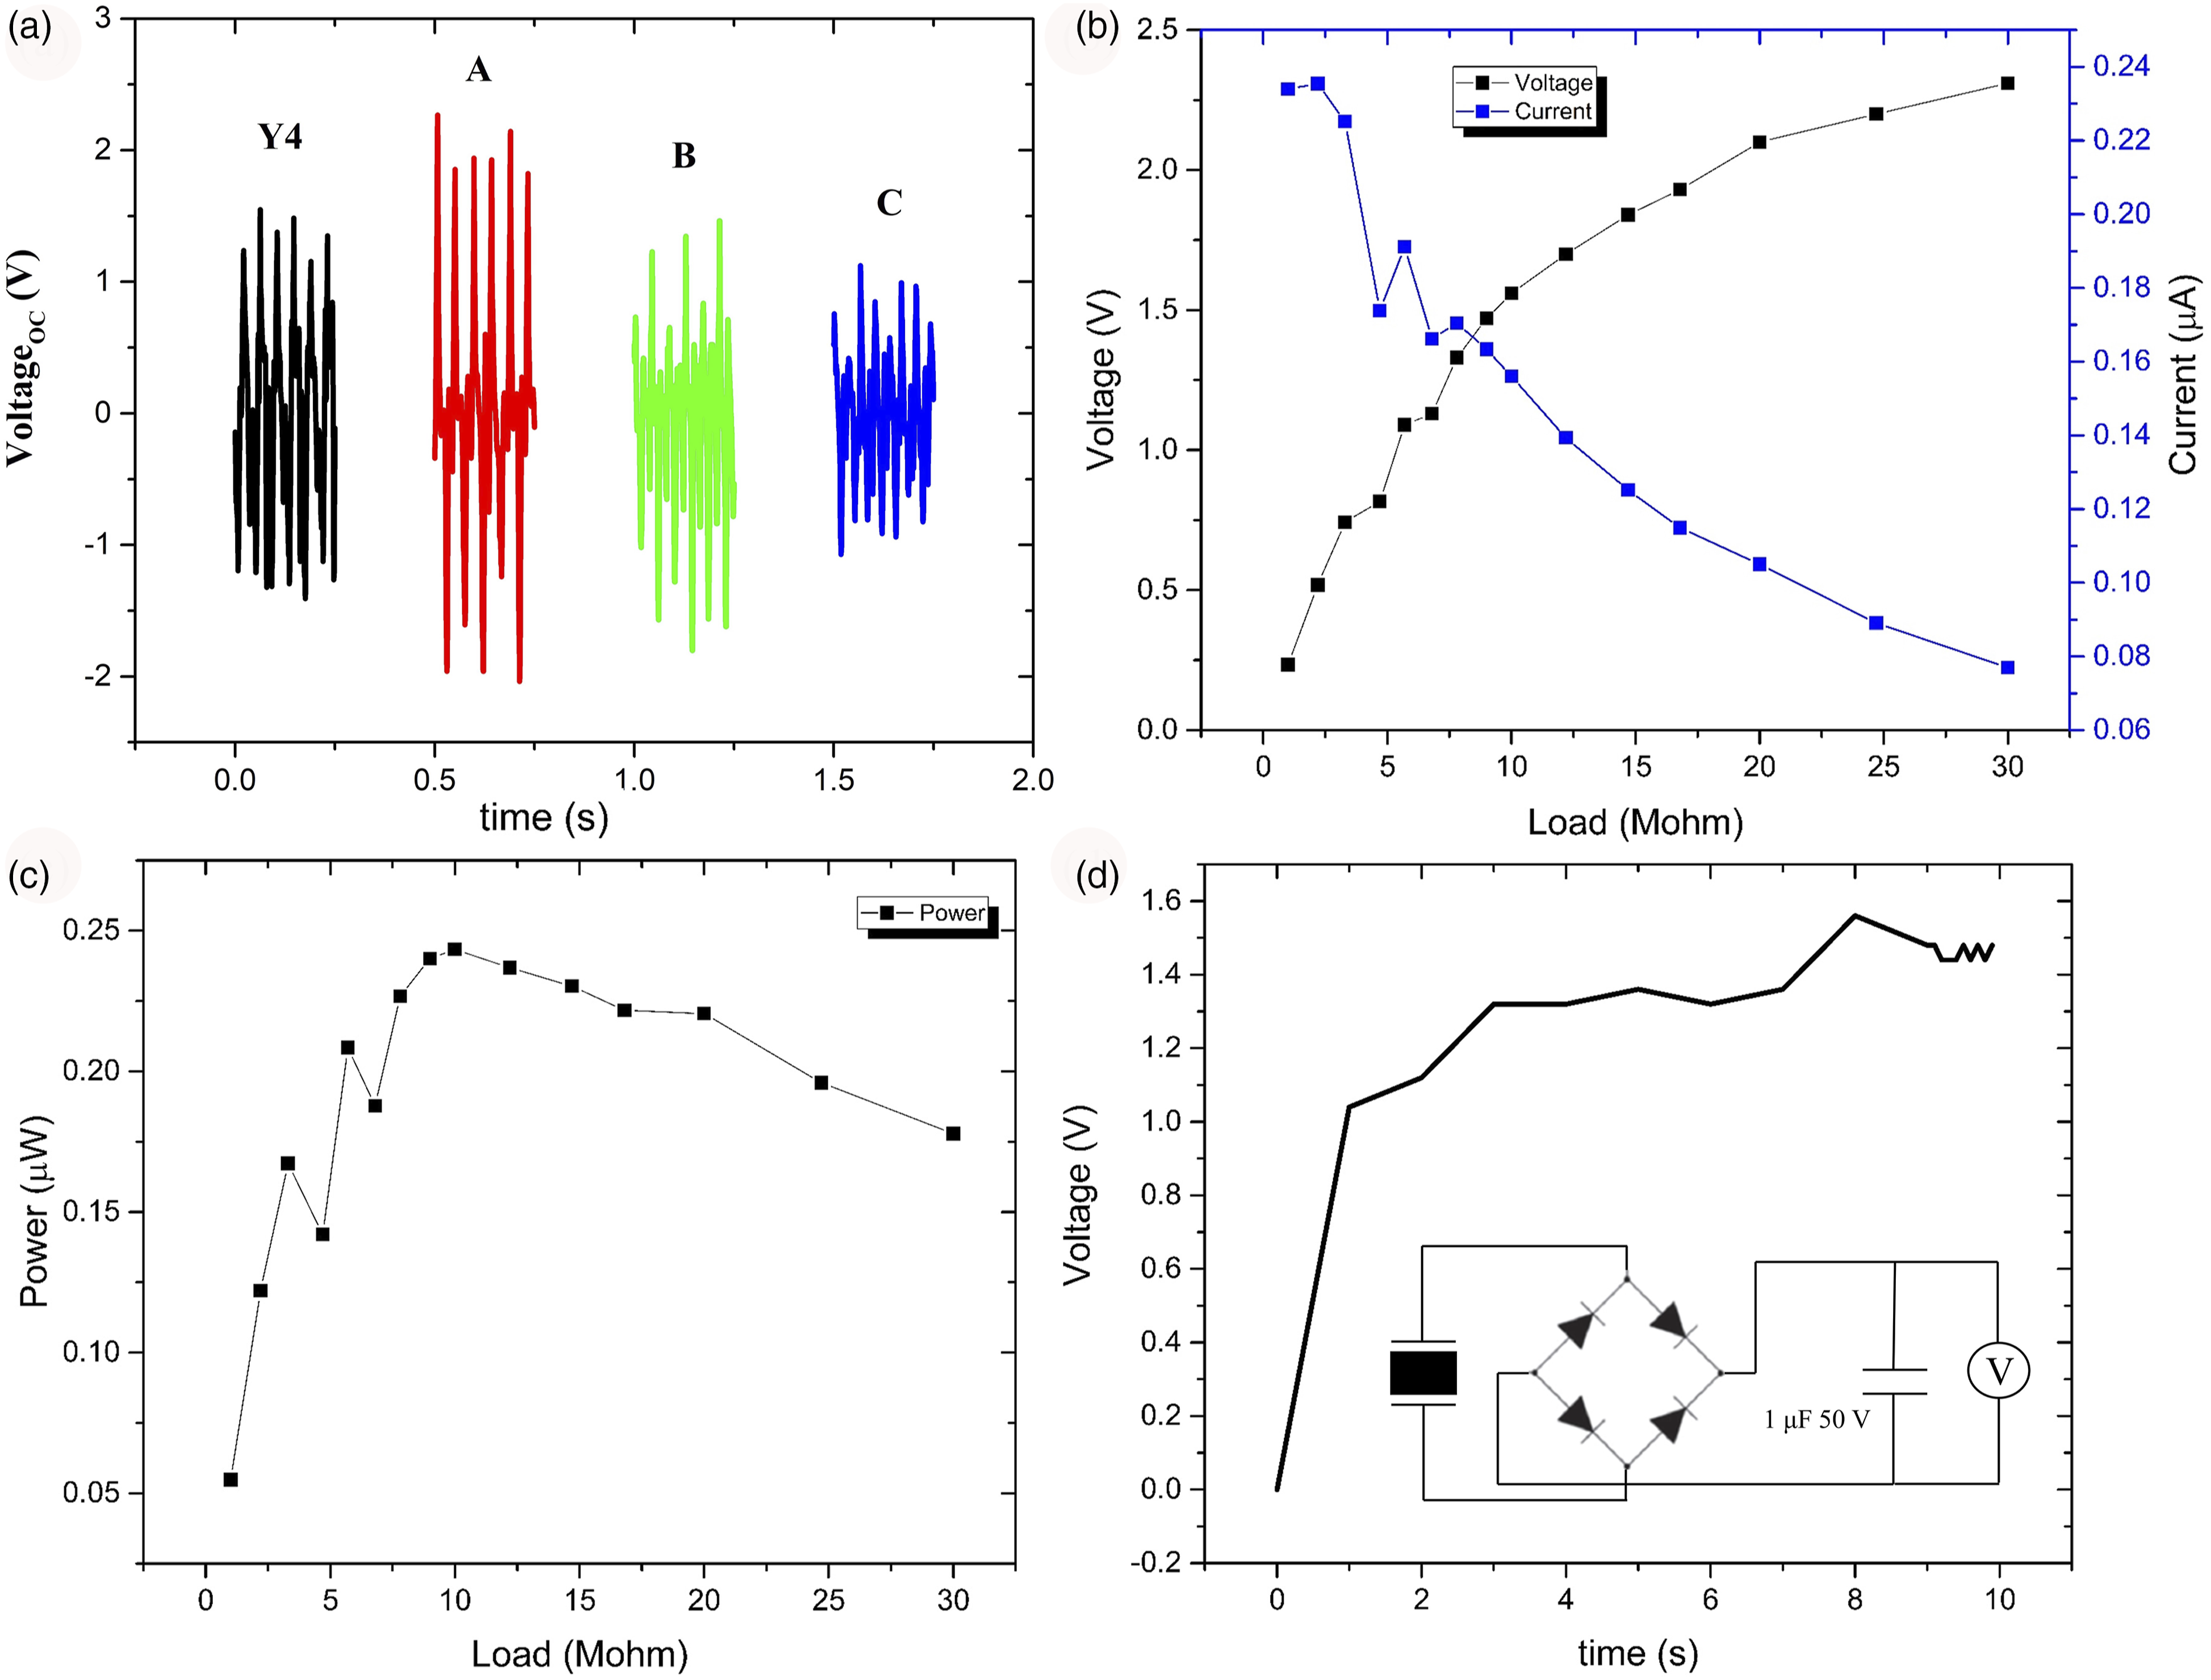
During the polarization process in the electrospinning method, the dipole moments in PVDF and BaTiO3 nanoparticles (NPs) are oriented in the polarization direction. In Figure 13, electrospun PVDF/BaTiO3 nanocomposite SEM images are given at 10 000x magnification. The main reason for this increase in performance can be explained by the changes in the morphological structure that occur after the electrospinning process. During the electric field-induced polarization process during the electrospinning process, the dipole moments in the PVDF polymer chains and BaTiO3 nanoparticles were oriented in the polarization direction. In Figure 13, the distribution of BaTiO3 nanoparticles in PVDF nanofibers is shown in detail. For A (PVDF/BaTiO3, 5% BaTiO3, 15% PVDF, Acetone/DMF (6:4)), the distribution of BaTiO3 nanoparticles within the PVDF nanofibers is linear and uniformly distributed. In this way, the dipole moments of the PVDF nanofiber and the dipole moments of BaTiO3 piezo nanoparticles form the total dipole moments in a single fiber. Due to the uniform distribution of BaTiO3 nanoparticles, all dipole moments within the nanofibers under mechanical vibrations of the nanogenerator transmit more electrical charge to the electrode surfaces and provide a high piezoelectric output. In B (PVDF/BaTiO3, 5% BaTiO3, 15% PVDF, Acetone/DMF (6:4)), BaTiO3 nanoparticles do not show uniform distribution in the PVDF nanofiber, causing distortions in dipole moment orientations. In this case, there will be a decrease in the total number of dipole moments, and less charge transfer will occur to the electrode surfaces. Thus, there will be no increase in piezoelectric output due to mechanical vibration. In C, in addition to the uneven distribution in B, the distribution of the existing dipole moments is also negatively affected due to the micro-beaded structure resulting from the high BaTiO3 ratio. In this case, the charge transfer to the electrodes is further reduced compared to pure PVDF. The highest power value was determined at A (5 wt.% PVDF/BaTiO3) as 1.56 V. A (5 wt.% PVDF/BaTiO3) has the best performance of piezoelectric energy harvesting from mechanical energy harvesting as a 0.243 μW power output and 0.02 μW/cm2 power output density, respectively. The distribution of BaTiO3 nanoparticles in PVDF nanofibers.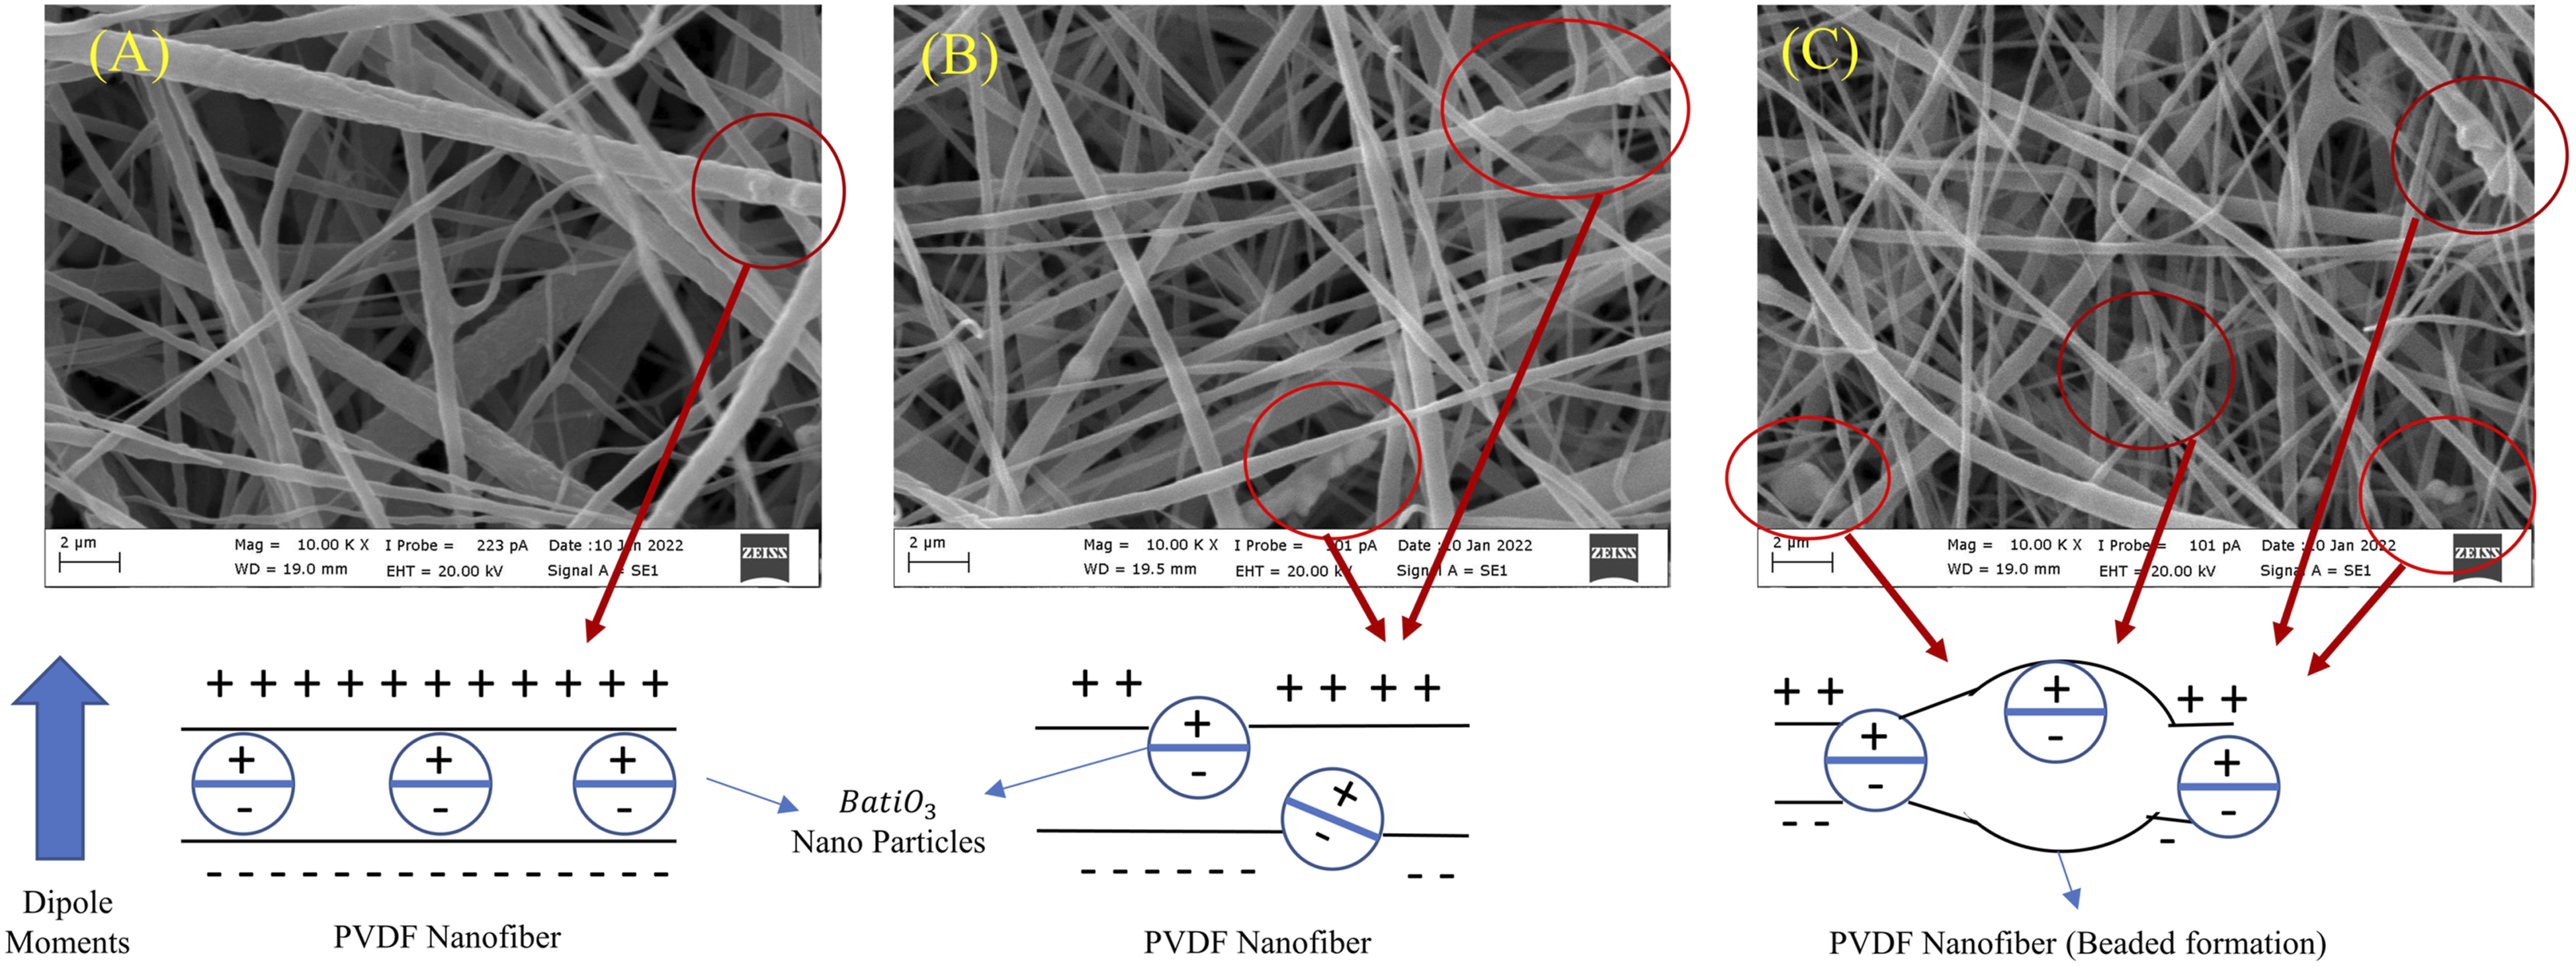
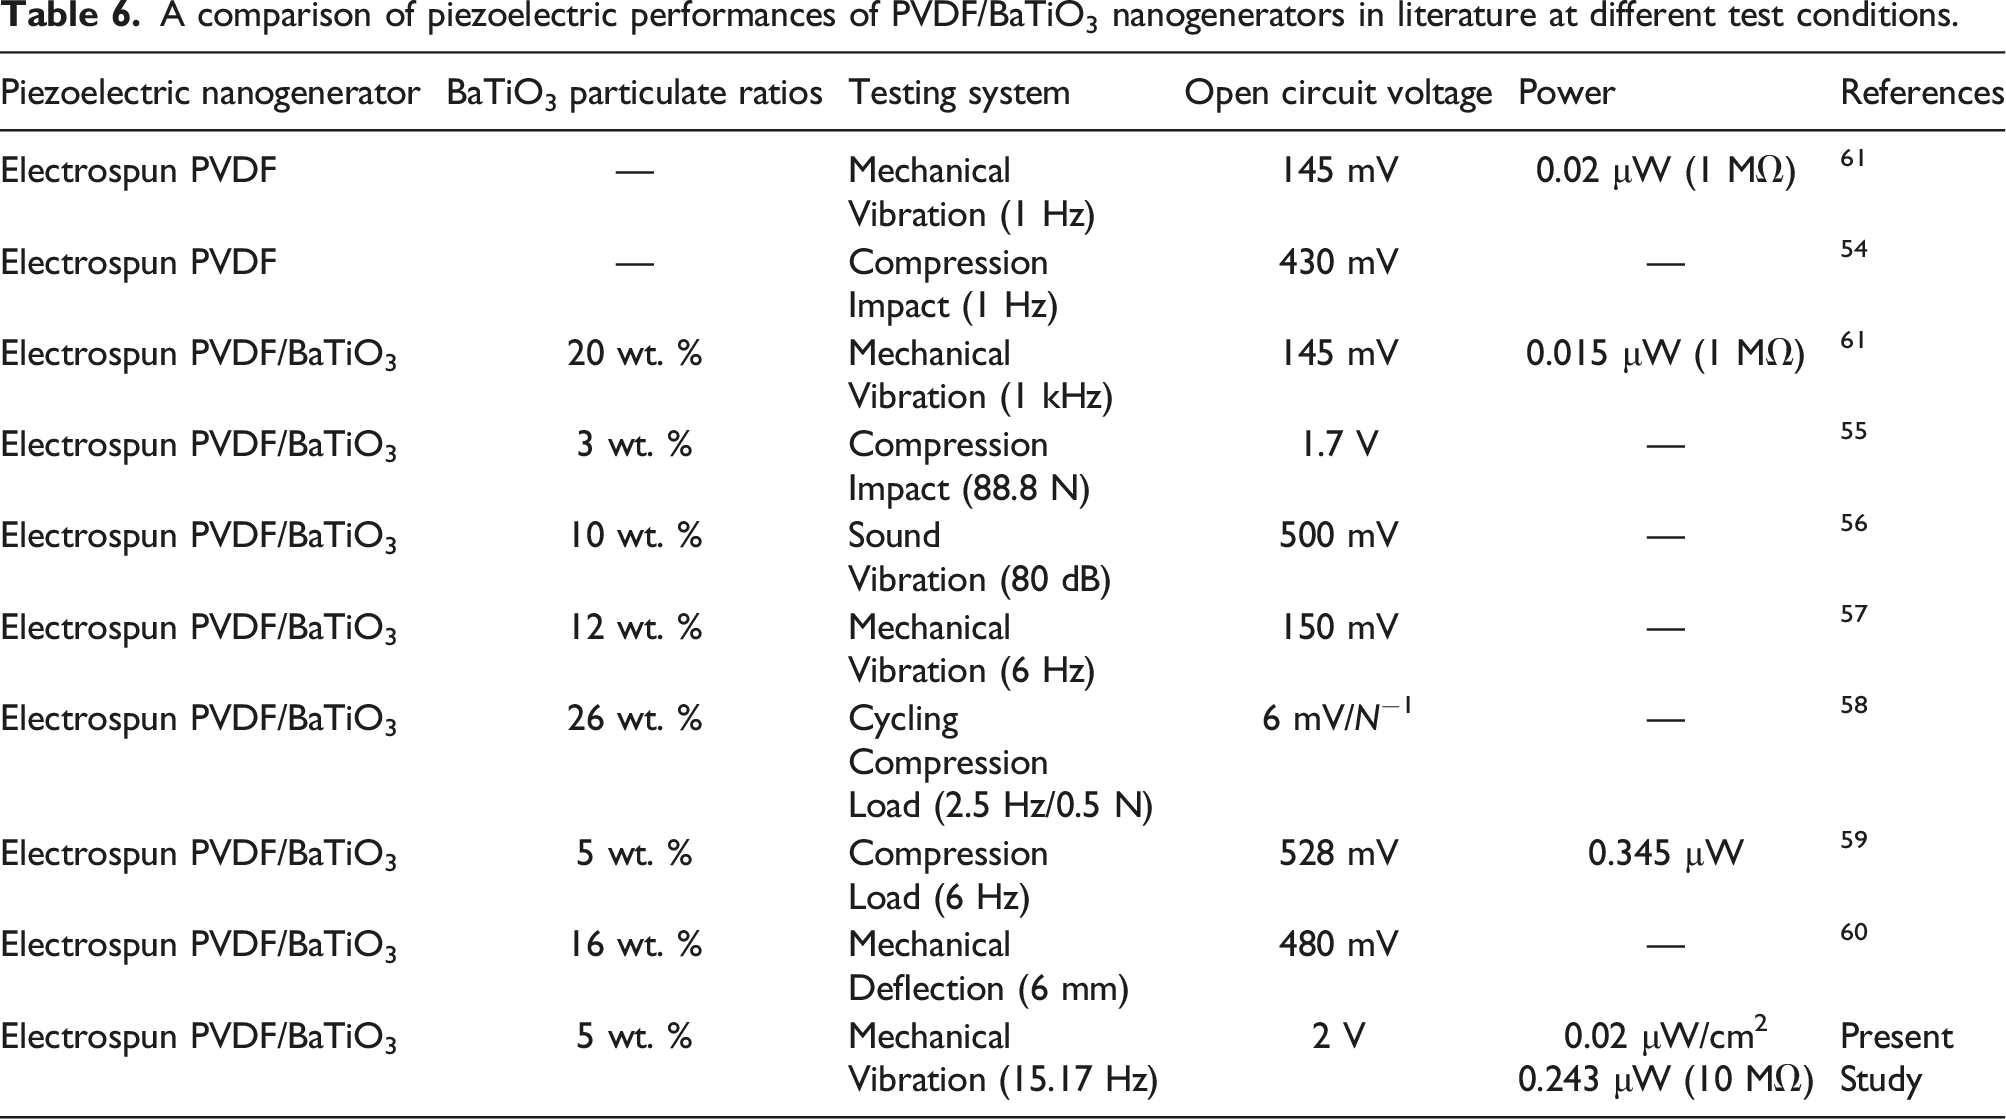
A comparison of piezoelectric performances of PVDF/BaTiO3 nanogenerators in literature at different test conditions.
Conclusion
The influence of solvent ratio and polymer concentration on the crystallinity and morphology of electrospun PVDF nanofibers were investigated by using FTIR and SEM. Four different solvent ratios and three different polymer concentrations were used for the electrospinning process. Electrospun PVDF/BaTiO3 nanocomposite fiber mats were produced with three different BaTiO3 nanoparticles’ weight percentages of 5, 10, and 15 based on optimum solution parameters as 15 wt.% PVDF and 6:4 vol./vol. Acetone/DMF solvent mixture. The piezoelectric output performance of the piezo polymer nanogenerator (PPN) was investigated under different load resistance. Power output values of PPNs were determined, and a 1 μF 50 V capacitor was charged with PVDF/BaTiO3 Piezo polymer nanogenerator using a rectifier bridge circuit. This study shows that electrospun PVDF/BaTiO3 flexible nanocomposite nanogenerator is suitable for large-amplitude vibration energy harvesting. Moreover, it has been observed that choosing the appropriate parameters for nanoparticle reinforced nanocomposite studies in electrospun PVDF nanofiber structures contributes positively to the piezoelectric power outputs. The concluded specific findings are mentioned below. • According to the morphology studies, it was determined that the most critical parameter affecting the nanofiber structure was the acetone ratio. Raising the Acetone content in the polymer solution increased the production of homogeneous nanofibers devoid of beads. Another effective parameter was found to be the polymer ratio. Increasing the polymer ratio in the solution increased the fiber diameters. This is related high evaporation rate of Acetone. Based on the suitable solvent and polymer ratios, the results reveal that the piezoelectric power values rise with a beadless nanofiber structure. The β phase content has reached up to 83% (15 wt.% PVDF, Acetone/DMF (6:4 vol./vol.) 5 wt. % BaTiO3) on nanofiber formation without beads. • The highest piezoelectric output was obtained from the PVDF/BaTiO3 piezo polymer nanocomposite structure. The uniform dispersion of BaTiO3 piezoelectric nanoparticles within the PVDF fiber enhances the output performance of the piezoelectric power source. The main reason for this is that the high charge transfer is achieved by oriented dipole moments when the dispersion of BaTiO3 nanoparticles in PVDF is uniformly dispersed. The maximum piezoelectric power density output was produced in the vibrations piezoelectric energy harvesting system with A (15 wt.% PVDF, 5 wt.% BaTiO3, 6:4 vol./vol. Acetone/DMF) piezo polymer nanogenerator. (0.02 μW/cm2 under 10 MΩ). 1uF 50 V capacitor was charged up to 1.5 V in 10 s.
In conclusion, the PVDF/BaTiO3 piezo polymer nanocomposite generator has come into prominence as a suitable candidate for piezoelectric energy harvesting applications under mechanical vibrations.
Footnotes
Acknowledgements
The authors are grateful for the funding provided by the Turkish Scientific and Technological Research Council (TÜBİTAK) under Project Number 122M172. Moreover, the authors would like to thank Bursa Uludağ University BAP (BUÜ Scientific Research Projects) unite for their financial support under project number FOA-2021-681.
Declaration of conflicting interests
The author(s) declared no potential conflicts of interest with respect to the research, authorship, and/or publication of this article.
Funding
The author(s) disclosed receipt of the following financial support for the research, authorship, and/or publication of this article: This work was supported by the Türkiye Bilimsel ve Teknolojik Araştirma Kurumu (122M172) and Bursa Uludağ Üniversitesi (FOA-2021-681).