
Abstract
Due to their high density-specific stiffnesses and strength, fibre reinforced plastic (FRP) composites are particularly interesting for mobility and transport applications. Warp-knitted non-crimp fabrics (NCF) are one possible way to produce such FRP composites. They are advantageous because of their low production costs and the ability to tailor the properties of the textile to the reinforcement and drape requirements of the application. Based on their specific production parameters, their draping properties can vary significantly. Draping simulations are used to predict the forming behaviour without relying on costly and time consuming trial and error experiments. However, these simulations require a broad material dataset to make accurate predictions. Previous studies have investigated the relationships between production parameters and drape behaviour only in isolation for a limited number of material parameters at a time. In this study, a comprehensive material characterisation is carried out. The influence of ply orientation, stitch pattern, stitch length and stitch tension on the tensile and bending properties and the friction, shear and drape behaviour of NCFs are investigated on a meso and macro scale. Furthermore, the inter-ply sliding phenomena in bias extension tests are analysed and the results of bias extension and picture frame tests are compared.
Keywords
Introduction
Compared to conventional construction materials such as lightweight metals (e.g. aluminium), fibre reinforced plastic (FRP) composites have higher density-specific stiffnesses and strengths, making them of particular interest for lightweight applications. 1 In order to reduce the costs of fibre composite components, efficient, automated manufacturing processes with high productivity are desired, which simultaneously allow the mechanical potential to be exploited. An approach to address these challenges are warp-knitted non-crimp fabrics (NCFs). Those NCFs consist of at least two stacked layers of reinforcing fibres connected to each other by a stitching yarn. 2 They are produced on warp knitting machines with multiaxial weft insertion. This type of reinforcement is advantageous because of their low specific costs in production and the possibility to tailor the properties of the textile to the reinforcement and drape requirements of the application. 3 The straight alignment of the rovings avoids undulations, which results in better mechanical properties compared to woven fabrics.4,5 NCFs can be designed for specific loads by selecting the material of the reinforcing fibres, the weight per unit area of the individual plies and the angle of the plies. 6 By adjusting the production parameters of the stitch, the drapeability of NCFs can be varied and adjusted significantly. 7 The productions parameters of the stitch are stitch pattern, stitch length, gauge length and stitch tension.4,6,7
Computational draping simulations are used to avoid iterative and thus cost- and time-intensive draping trials. The aim of draping simulation is to calculate the local fibre position and orientation after the draping process. 4 Due to the anisotropic properties of FRP, the information is essential for the subsequent mechanical component engineering. In addition, draping simulations can predict whether a certain geometry can be reproduced without defects with the specified textile and thus whether or not it can be feasibly produced. 8
The description of the drapeability of an NCF and the occurrence of defects during the draping process is highly complex. The deformation mechanisms are ply compaction, inter-ply shearing and sliding, intra-ply sliding, changes in stitch tension, sliding of the stitching yarn and the interactions between stitching yarn and reinforcing fibres. 5 All of which are strongly coupled to each other. This coupling depends on the characteristics of the NCF.9,10 In order to thoroughly understand mechanical behaviour of NCF, correlation between production parameters and mechanical properties of NCF is desired. Previous studies have investigated the relationships between production parameters and drape behaviour only in isolation for a limited number of material properties at a time.
This paper therefore presents the results of a broad material characterisation of a total of five different NCFs. The individual components of the textile (roving and stitching yarn) are analysed on a meso-scale. The textile is subjected to tensile, friction and shear tests on a macro-scale. The inter-ply sliding phenomena during bias extension testing is analysed in detail and the results between picture frame and bias extension tests are compared. Finally, the results of draping tests on a double dome geometry are presented.
State of the art: Material characterisation of NCFs
Khiem et al. 11 reported the results of thickness measurements, tensile, bending and bias extension and draping tests of one glass-fibre NCF type. A comparison of different NCFs is not presented. Krieger et al.4,7 investigated the shear and drape behaviour of six biaxial NCF types with different stitch pattern, stitch length and gauge length in bias extension and picture frame tests. Depending on the stitch pattern, opposing shear force reactions can be observed under positive and negative shear by these authors. Creech et al. characterised the bending, friction, shear and drape behaviour of one NCF type. 9 Thije et al. 5 measured the change in NCF thickness at increasing shear angles. They found that the assumption of constant fabric volume is not correct for shear angles above 30°. The shear and drape behaviour of unidirectional NCF has been characterised in Schirmaier et al. 12 by bias extension and picture frame tests. Draping experiments with a double-dome geometry were conducted in Ali et al. 13 for unidirectional, bi-, tri- and quadaxial NCFs. The defect evolution (e.g. wrinkle development) was investigated in shear and drape experiments for two biaxial NCFs in Mei et al. 14 Lomov et al. 15 investigated the tensile, shear, compression and bending behaviour of four different types of NCFs which differ in stitch pattern and fibre orientation. They found that different stitch patterns lead to different shear resistances. This has also been reported in Li et al. 16 Wiggers et al. 17 also found that the shear response is more asymmetric at increased stitch length. Kong et al. 18 tested the influence of stitch pattern and stitch tension on the shear behaviour of biaxial and triaxial NCFs by bias extension tests. Both parameters did influence the shear behaviour of the tested NCFs significantly. Senner et al. 19 carried out bending tests for NCFs. The draping behaviour of NCFs with different areal weights and stitch pattern were conducted by Christ et al. 20
So far, no study investigated the influence of the production parameters of NCFs on tensile, shear, bending, compression, friction and draping behaviour simultaneously. Since different textiles are used in all studies, the material properties of the isolated investigations cannot be gathered across several studies. When determining material parameters for the material models of draping simulations, it is essential that all relevant parameters (tensile, shear, friction etc.) are determined from the same materials. Since this paper also uses non-commercial, self-produced materials, the influence of the individual production parameters can be examined in isolation rather than comparing different commercial products that may incorporate different raw materials and have completely different product characteristics.
Materials
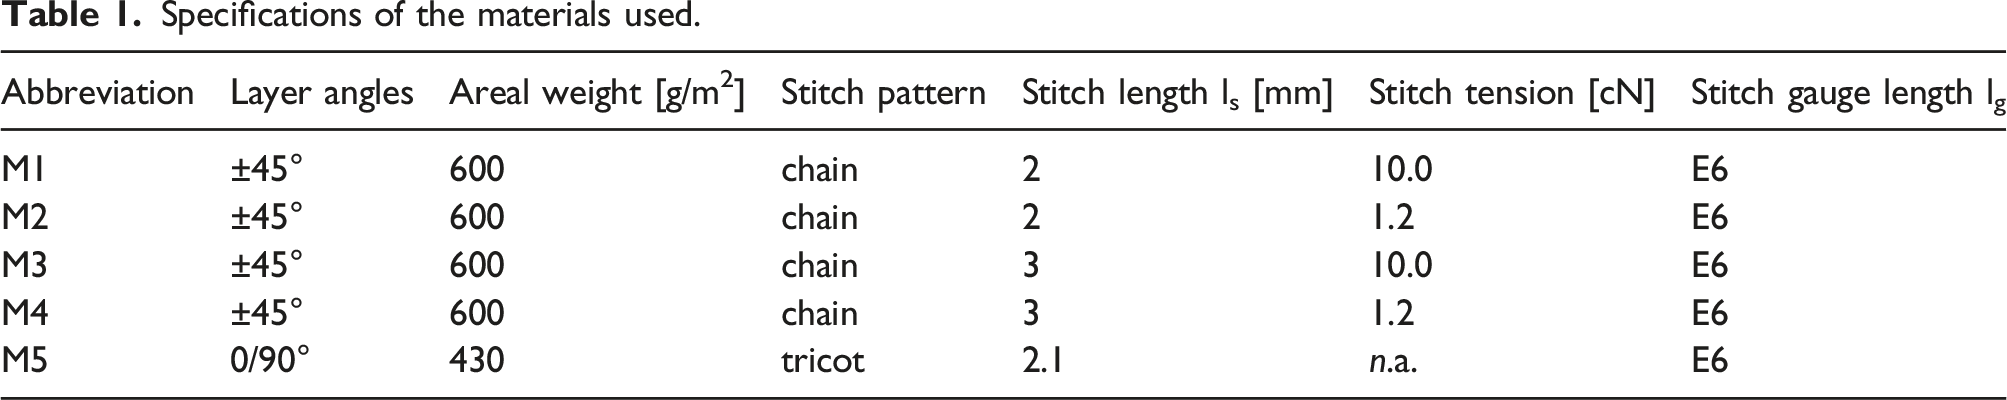
A total of five different biaxial, warp knitted glass-fibre NCFs were produced at the Institut für Textiltechnik (ITA) of RWTH Aachen University (see Figure 1). Four of these NCFs feature a fibre orientation of ±45° and were produced with an automatic warp knitting machine LIBA COPCENTRA MAX 3 CNC by KARL MAYER Holding GmbH & Co. KG (Obertshausen, Germany). These NCFs were produced with a chain stitch pattern and an approximate areal weight of 600 g/m2. They differ in terms of stitch length and stitch tension (see Table 1). Additionally, a 0/90° NCF with a tricot stitch and an approximate areal weight of 430 g/m2 was produced with a warp knitting machine Malimo P2 by KARL MAYER Holding GmbH & Co. KG (Obertshausen, Germany). Unlike the LIBA MAX3, this machine does not have the option to measure stitch tension during production. All NCFs were made from a 600 tex glass-fibre (GF) roving StarRov PR 120 600 086 by Johns Manville Slovakia, a.s. (Trnava, Slowakia) and a polyester (PE) stitching yarn with 167 dtex. The gauge length for every NCF is E6 (25.4 mm/6 = 4.23 mm). Microscopy images of front- and backside from all produced NCFs. Specifications of the materials used.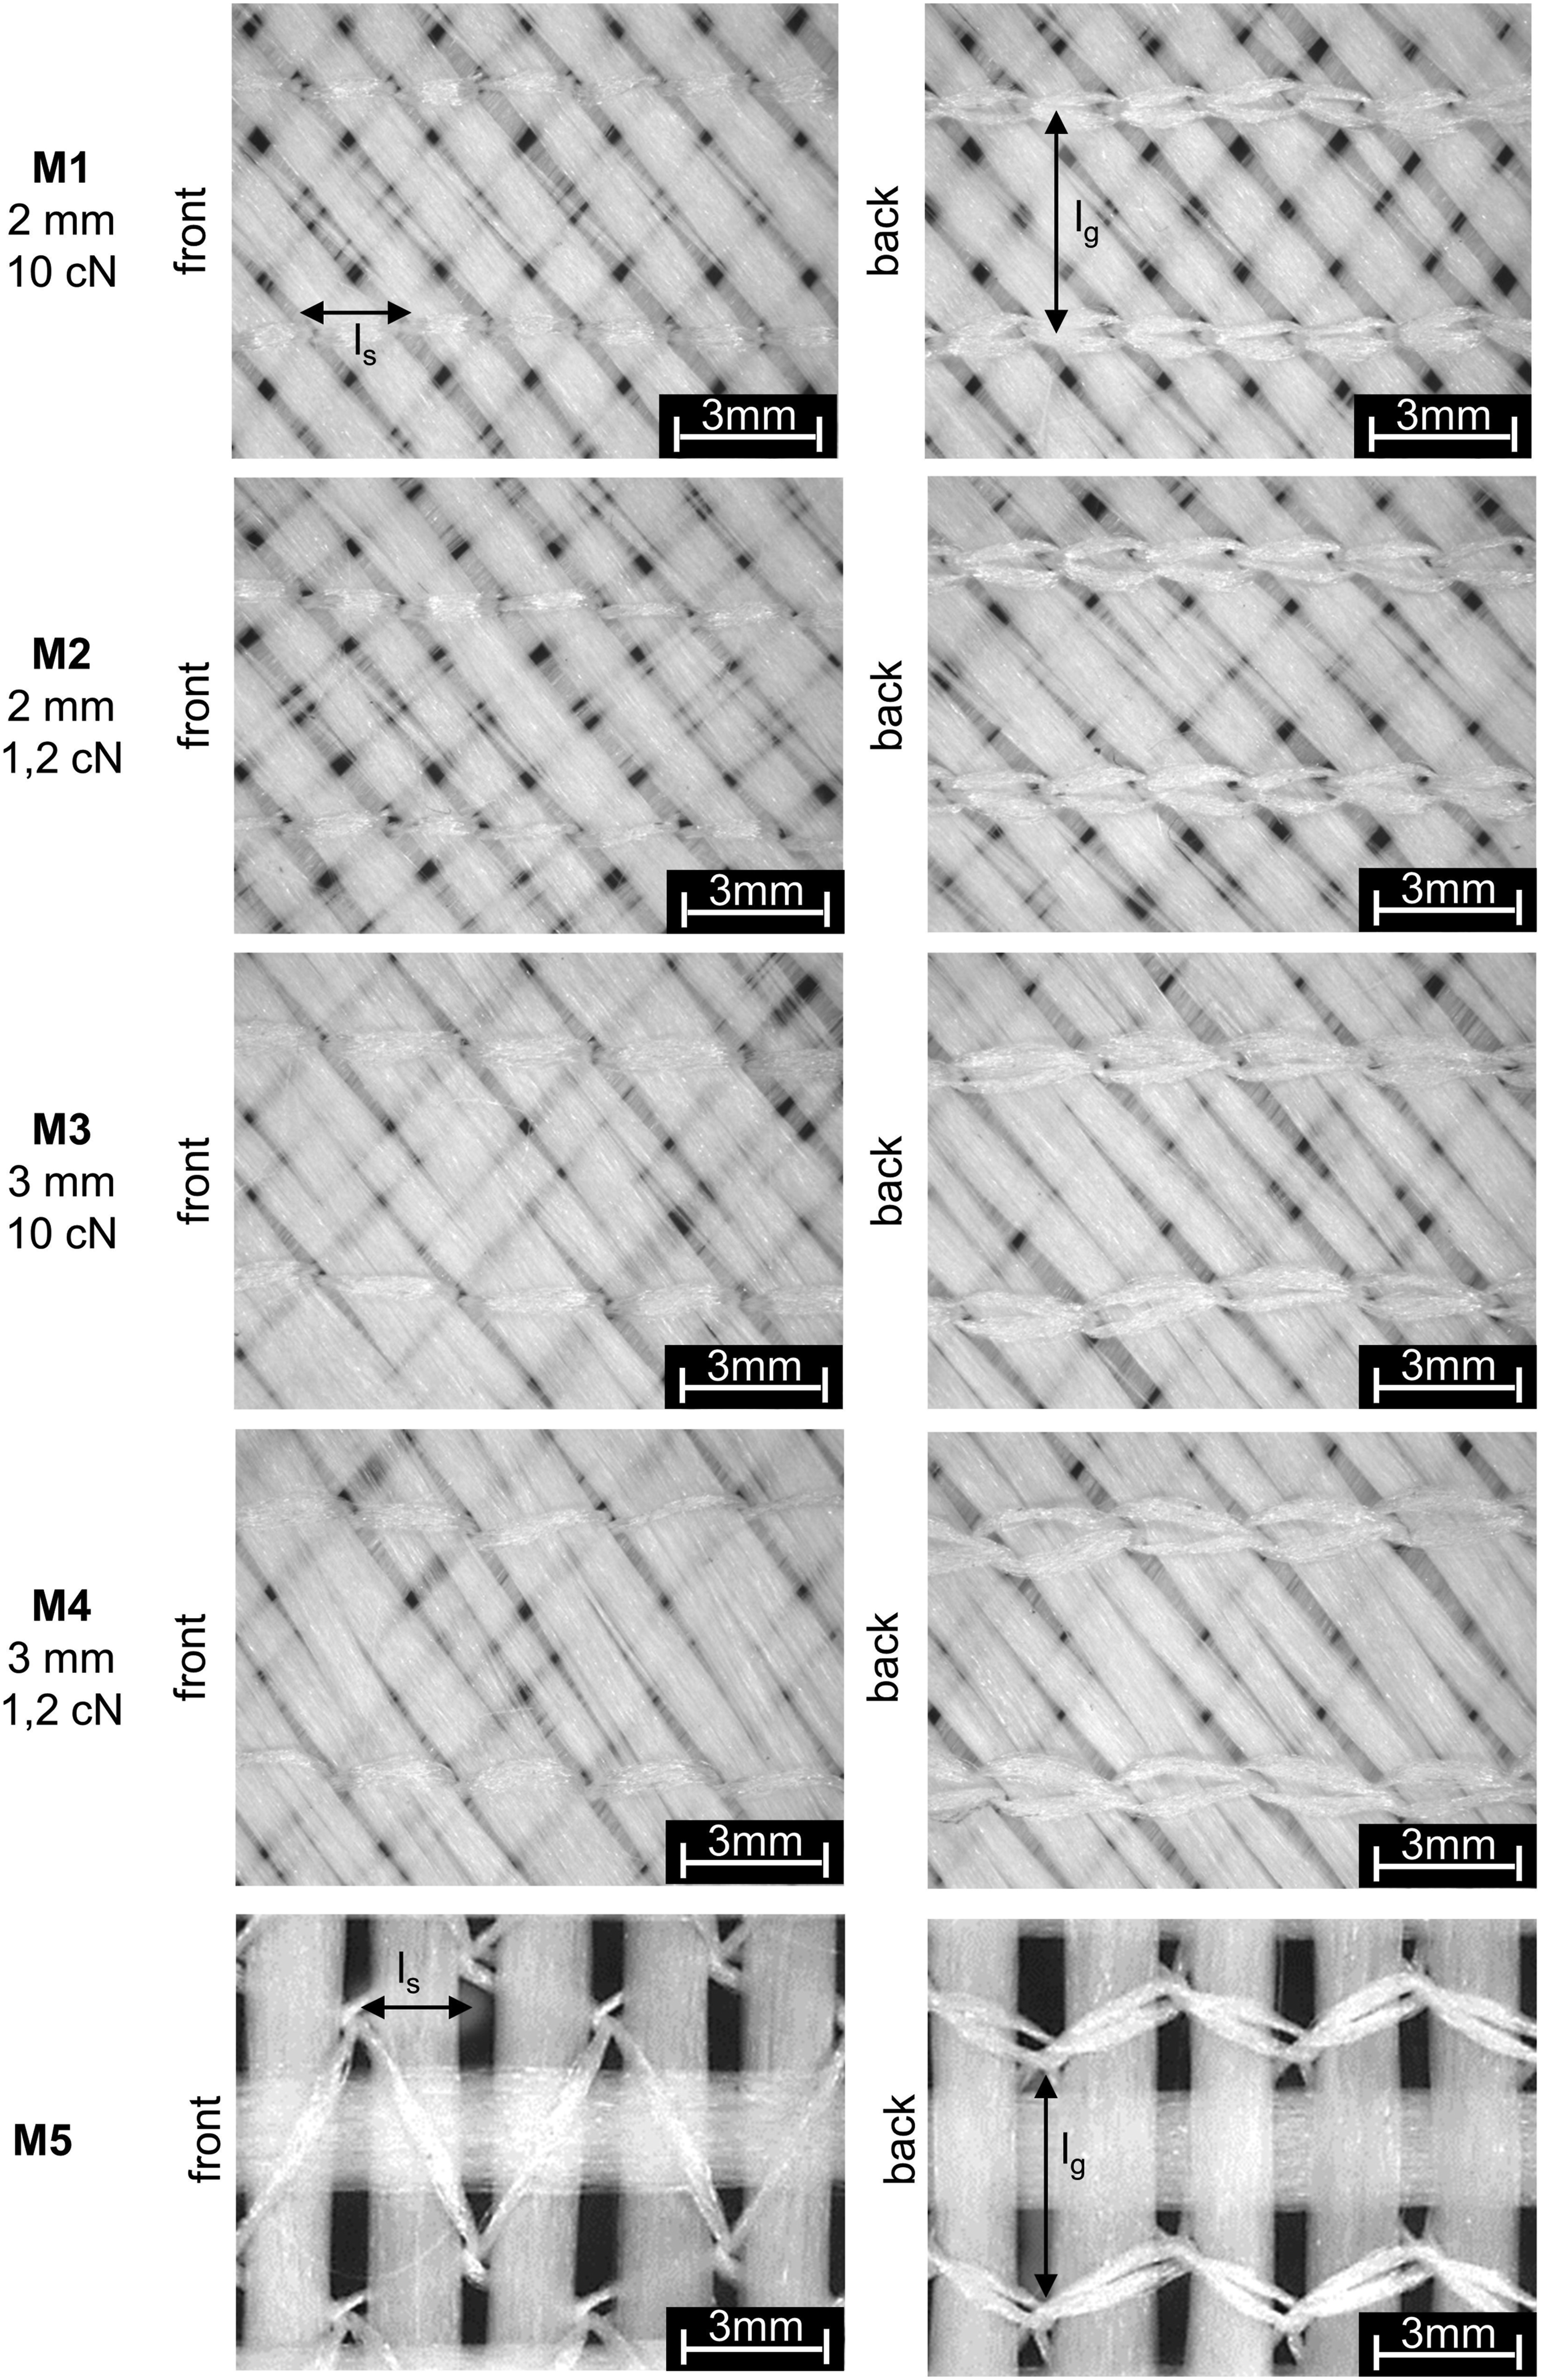
Experimental setups and results
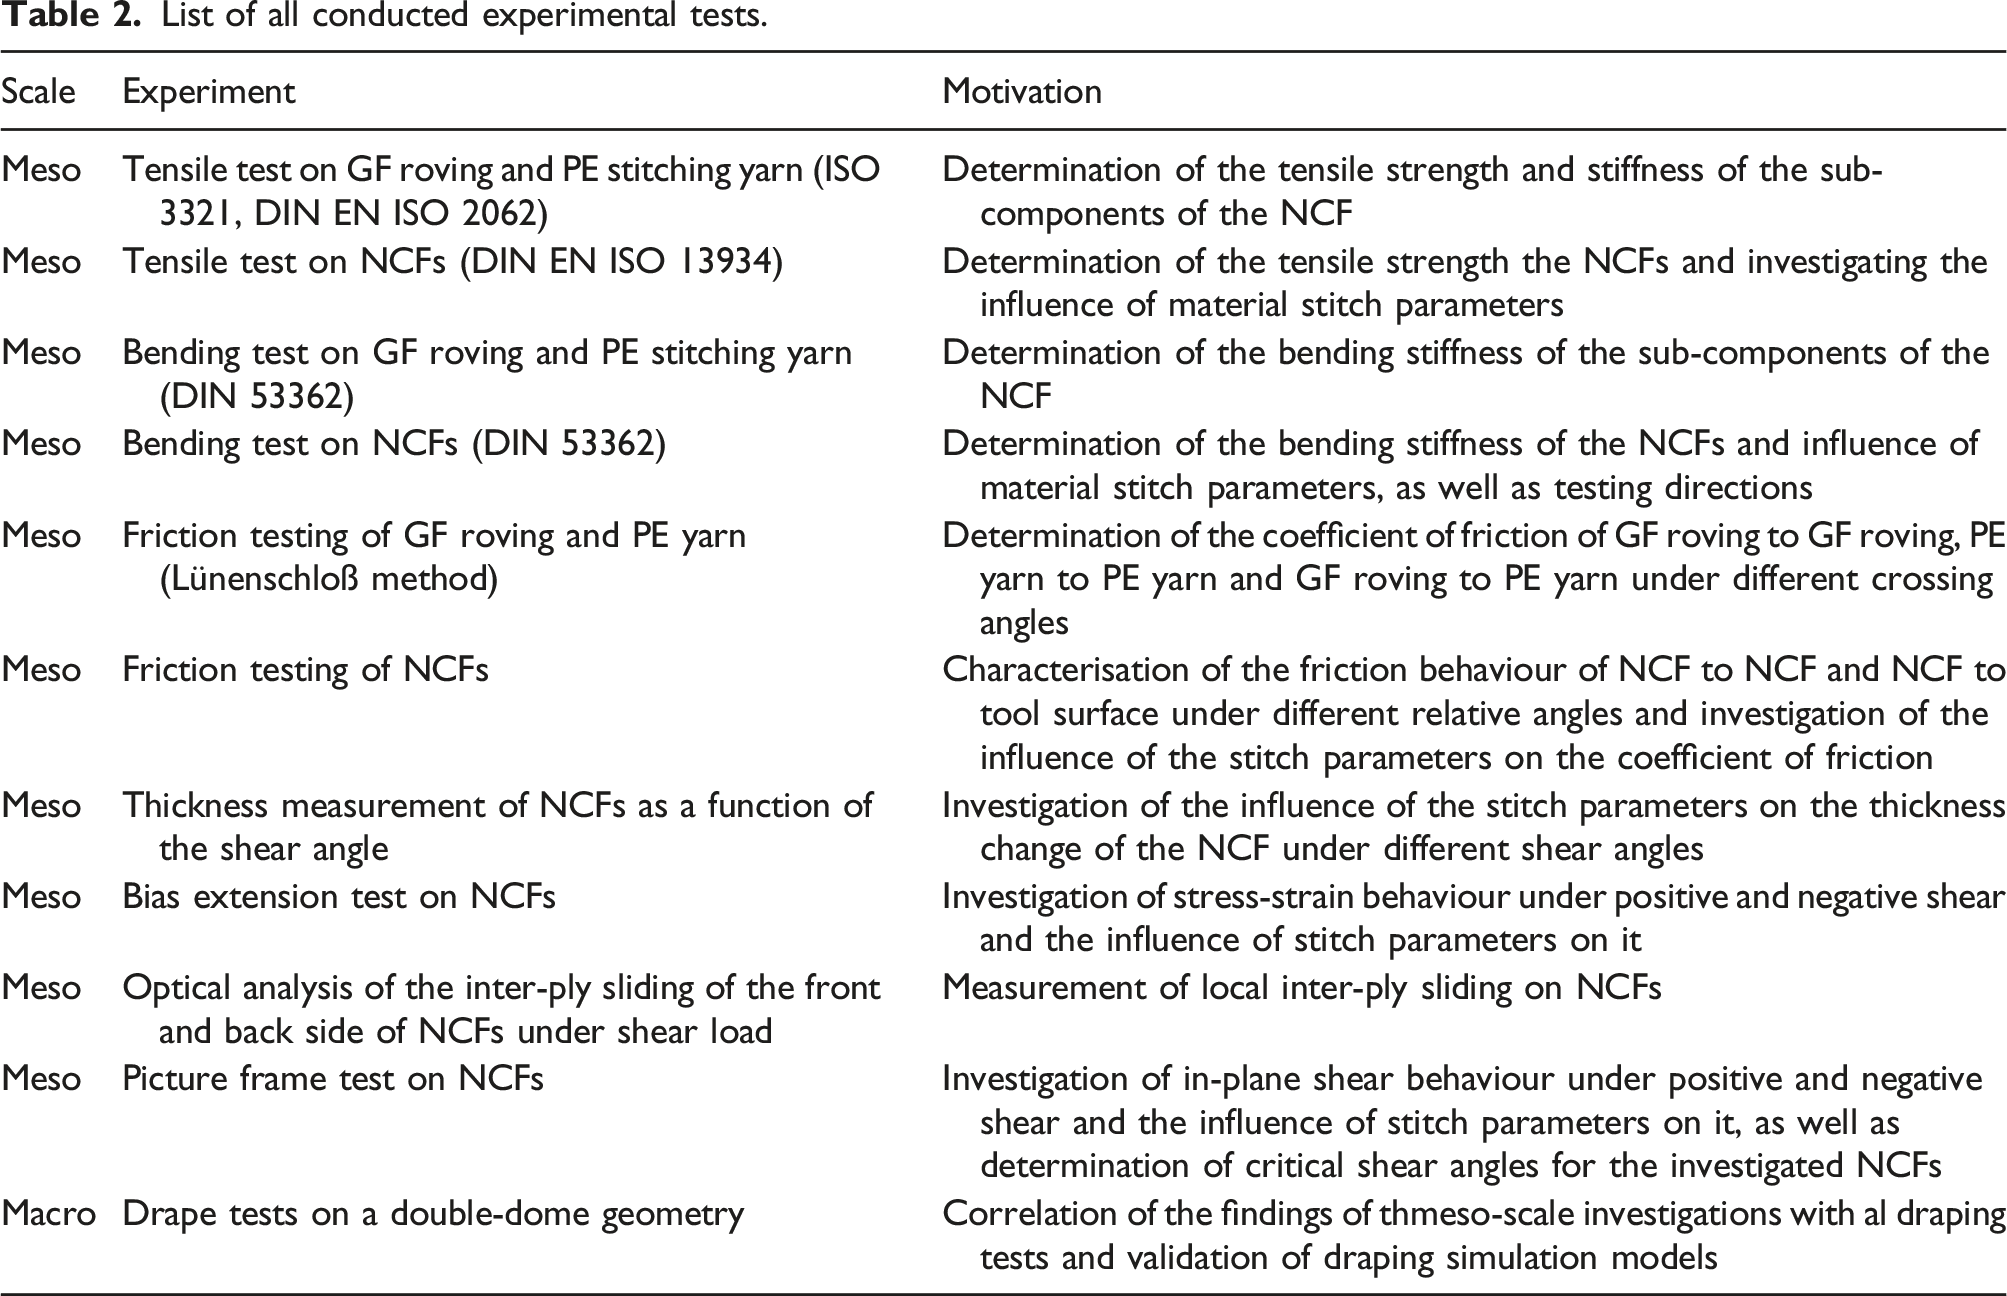
List of all conducted experimental tests.
Tensile tests of GF roving and PE stitching yarn and NCFs
To determine the tensile strength and stiffness of the GF roving and the PE stitching yarn, tensile tests were carried out according to ISO 3341 (GF roving) and DIN EN ISO 2062 (PE stitching yarn), respectively. Therefore, a STATIMAT 4U testing machine from Textechno H. Stein GmbH & Co. KG (Mönchengladbach, Germany) was used. The force-strain curves are shown in Figure 2. The glass-fibre roving shows a Young’s modulus of 68.2 GPa and an ultimate tensile strength of 1.68 GPa. The polyester yarn exhibits an averages young’s modulus of 3.4 GPa and 1.3 GPa between 0 – 1% and 0 – 5% of elongation, respectively. Force-strain data of roving and stitching yarn.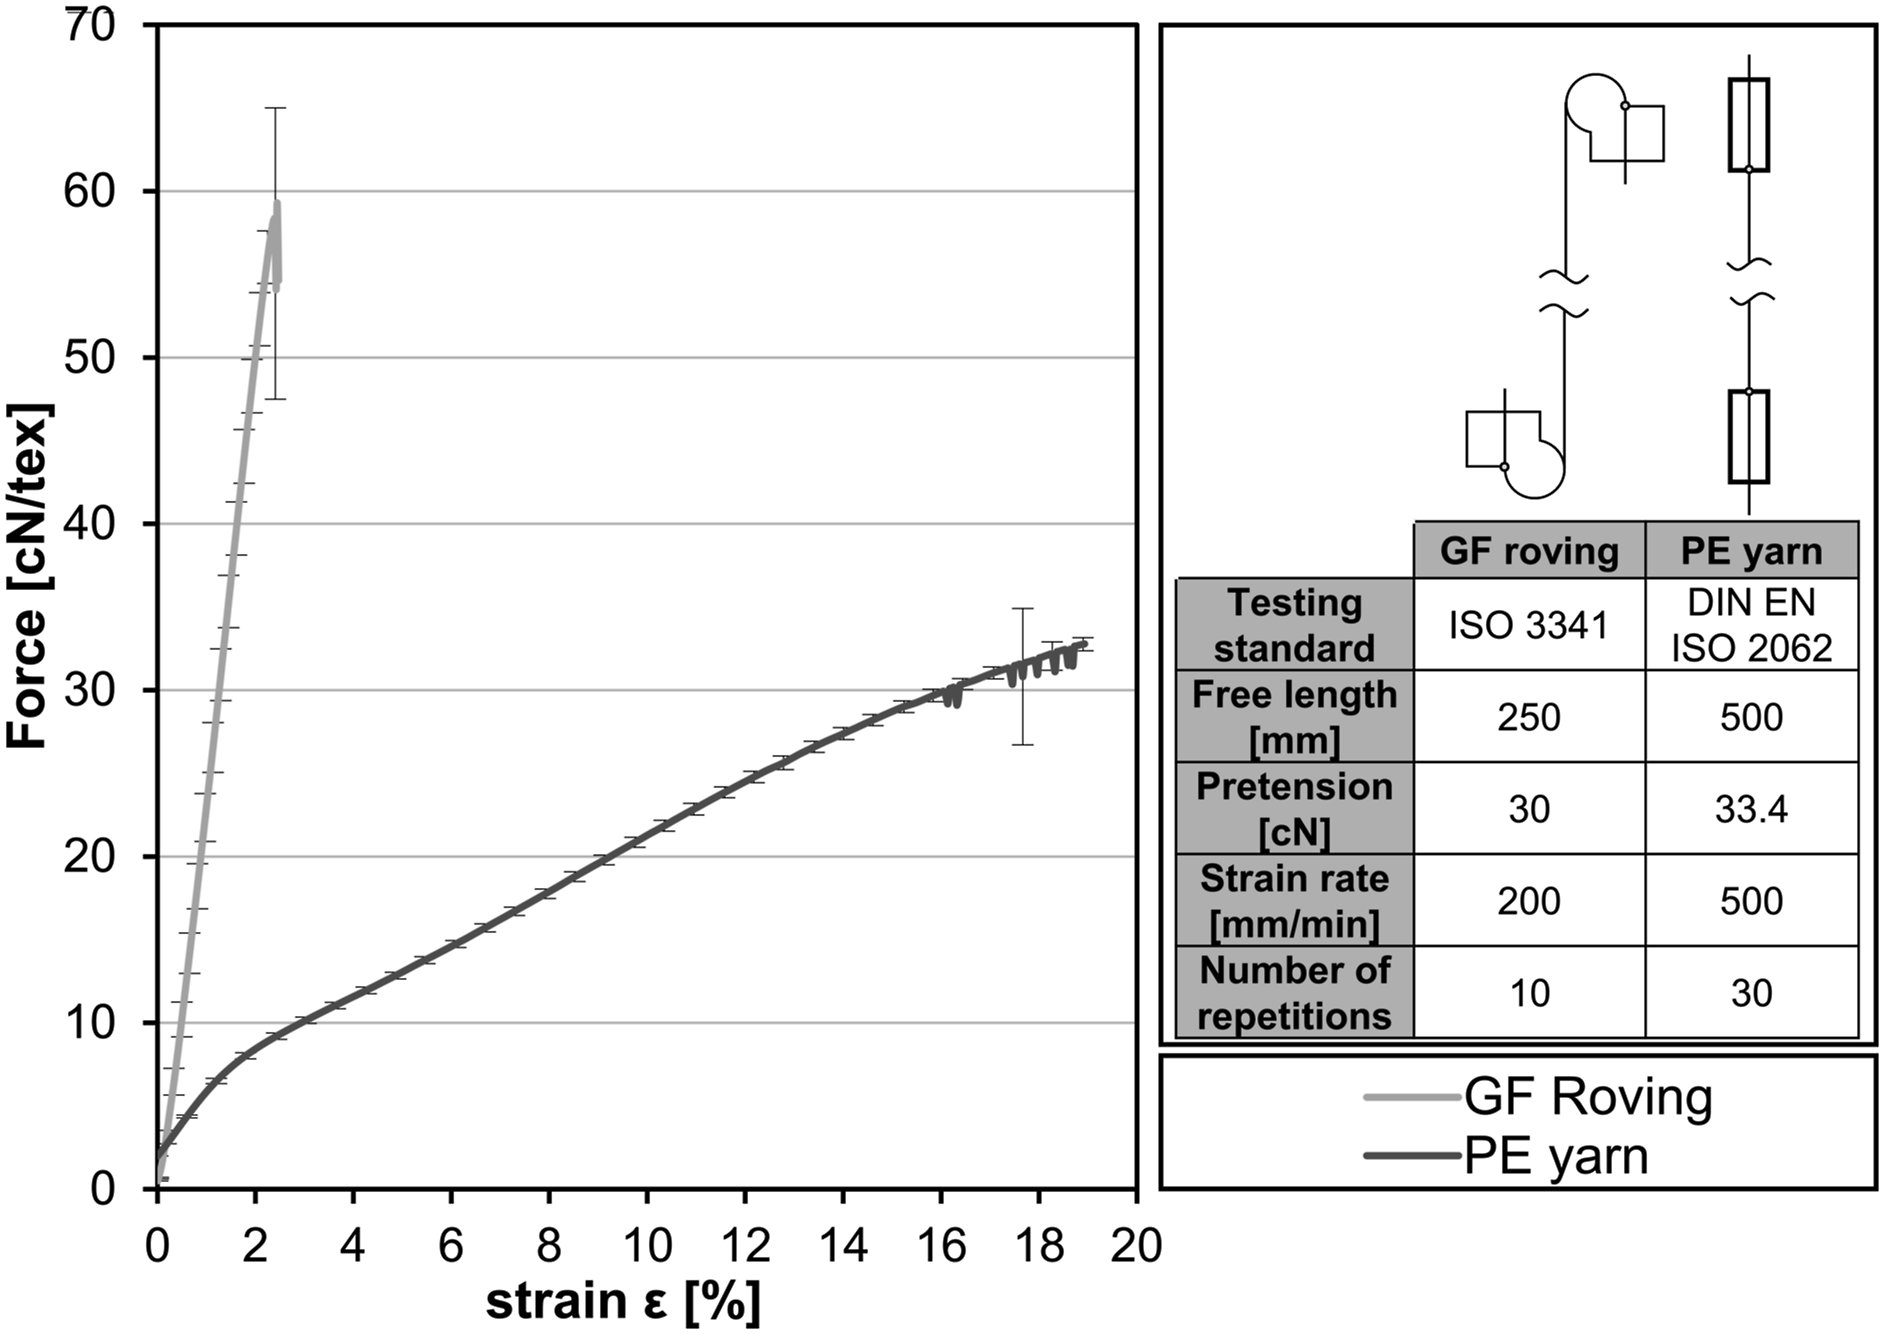
The axial tensile tests for the NCFs were performed in accordance to DIN EN ISO 13934. For this purpose, a universal testing machine 1455 by ZwickRoell GmbH & Co. KG (Ulm, Germany) with a 20 kN Xforce P force sensor by ZwickRoell GmbH & Co. KG (Ulm, Germany) was used. The specimens were cut to a width of 50 mm and a length of 300 mm. The thickness of the specimens was measured according to DIN EN ISO 5084. For better clamping a 50 mm wide cardboard strip was glued onto the specimens from both sides with epoxy resin Araldite 2011 by Huntsman Advanced Materials GmbH (Basel, Switzerland) resulting on a free length 200 mm. In addition, a preload of 10 N was applied and a strain rate of 100 mm/min was used. The ±45° NCFs (M1-M4) were tested in the direction of one of the GF roving layers. The 0/90° NCF (M5) was tested in both 0° and 90° directions. Each NCF was examined for 5 repetitions each. In order to obtain material parameters independent of the specimen size, the measured forces were related to the nominal cross-section (width and measured thickness) of the specimen. The results are shown in Figure 3. Tensile test results for all NCFs (top: force-displacement-plot, bottom: maximum tensile force for each NCF type) (error bars indicate standard deviation).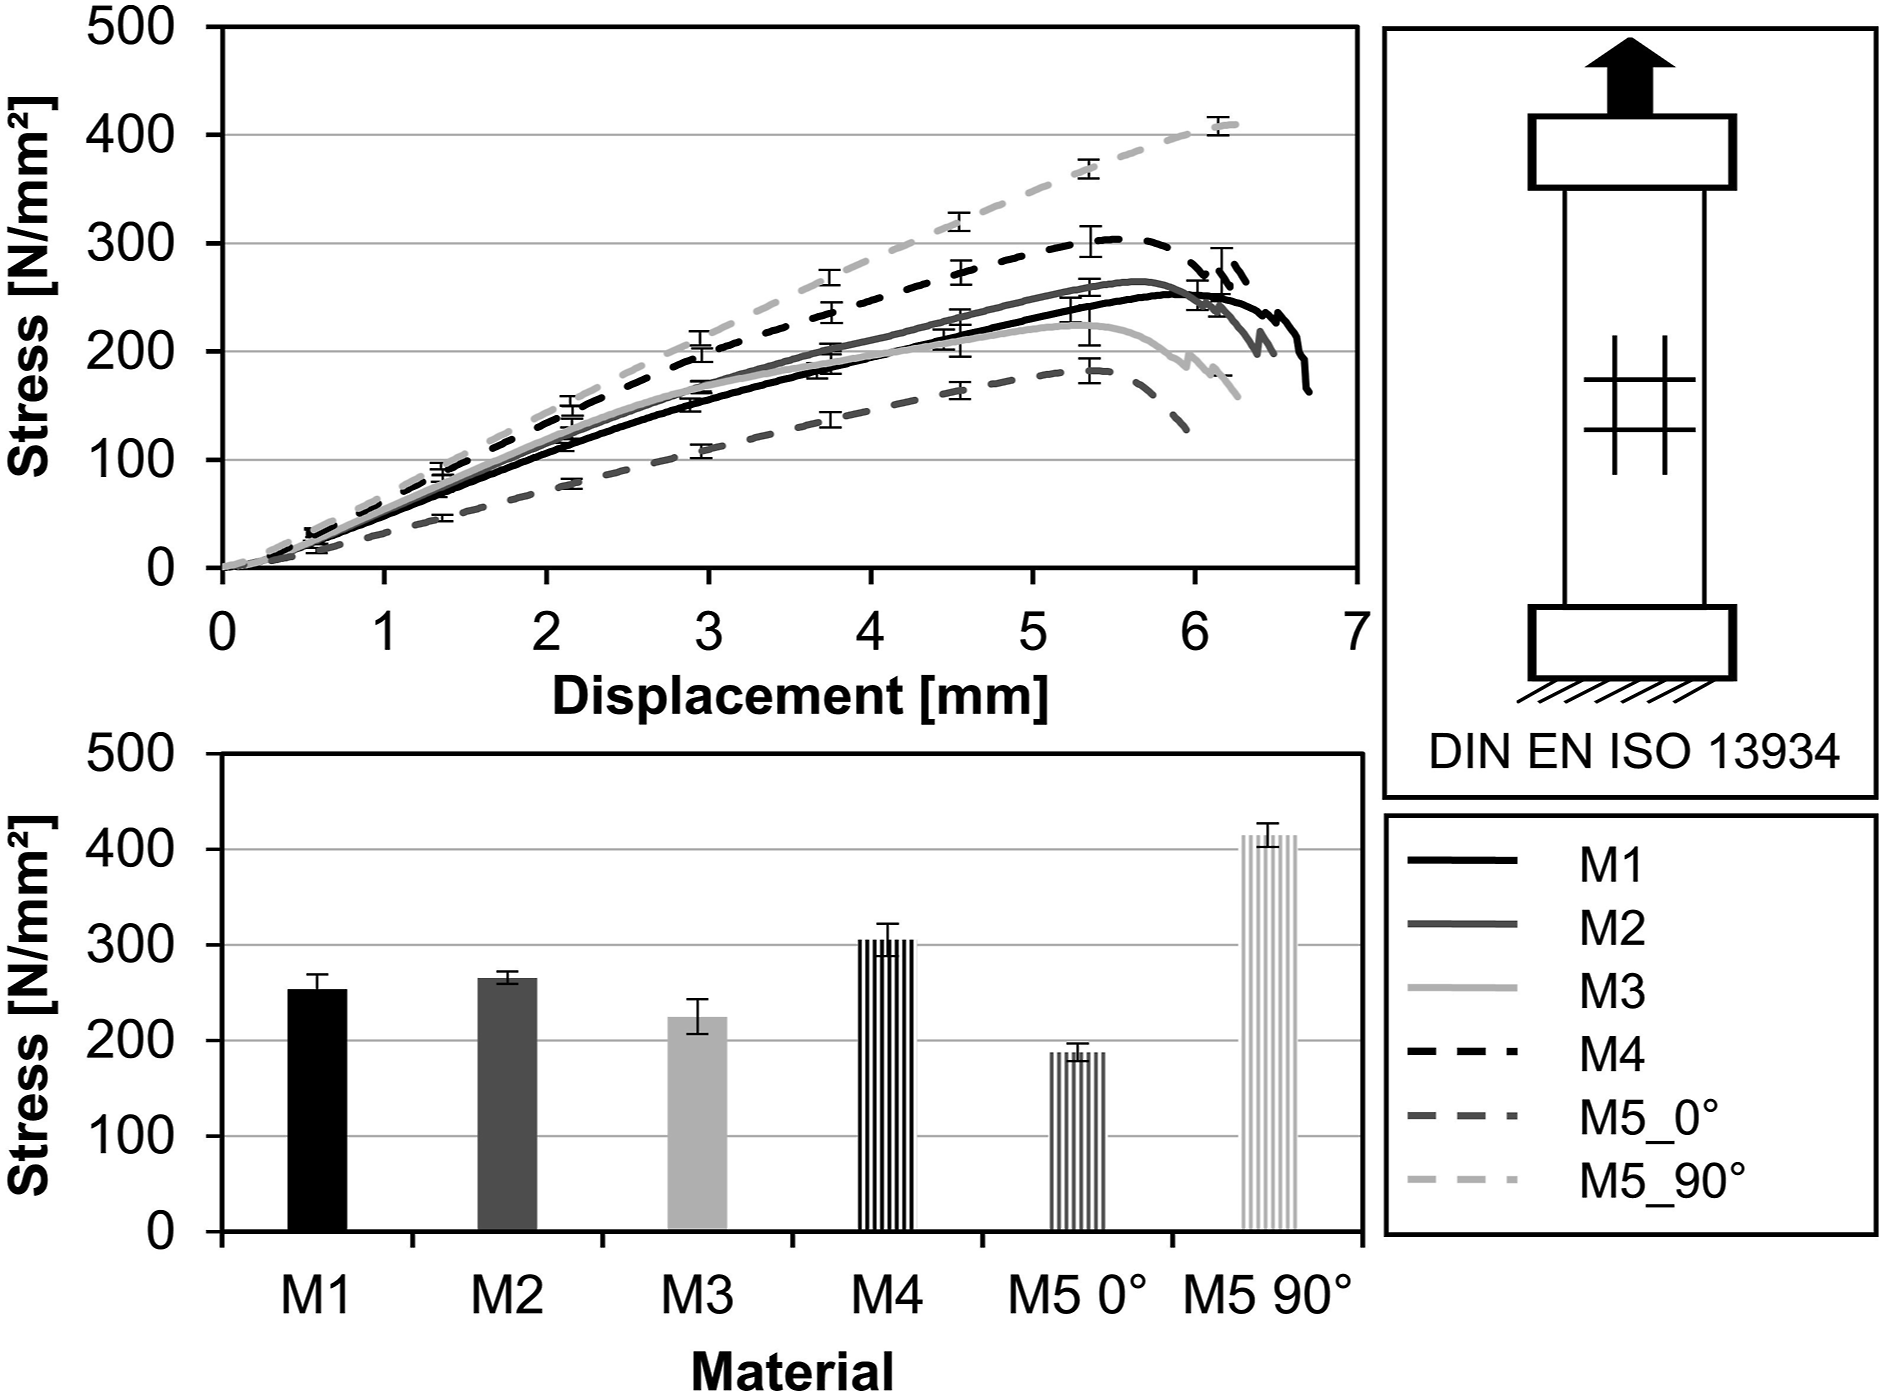
Comparing all ±45° NCF types (M1-M4), it is noticeable that the stitch tension has a significant effect on the tensile strength of the NCF (p-Value < 0.01, confidence interval 99%). M2 and M4 with a stitch tension of 1.2 cN have higher tensile strengths than their respective counterparts M1 and M3 with a stitch tension of 10 cN. The higher tensile forces in the NCFs with low stitch tension can potentially be explained by the fact that the knitting yarn constricts the glass fibre rovings less compared to higher tension. The periodic constriction prevents the filaments of the glass fibre roving from aligning in the load direction, resulting in in-plane ondulations of the individual filament, which leads to lower tensile forces.
For NCFs with high stitch tension (M1 and M3), a lower stitch length (M1) leads to higher tensile stresses (p-value < 0.01; confidence interval 99%). However, when comparing the two NCFs with low stitch tension (M2 and M4), the tensile strength is higher with higher stitch tension. This indicates an interaction between stitch tension and stitch length.
NCFs with a low stitch length of 2 mm (M1, M2) show fewer fish-eye defects (= penetration of the stitching yarn into the GF roving) (see Figure 1, M1 and M2 vs. M3 and M4). The increased number of fish-eye defects lead to more in-plane fibre waviness. However, if the stitch tension is high (M3), the stitching yarn prevents the GF rovings from aligning along the load direction under tensile load (M1 performs better than M3). At low stitch tension (M4), however, the increased in-plane waviness can be compensated for by the higher stitch width, as the rovings have enough free space to align along the load direction (M4 performs better than M2). This explains the observed interaction between stitch tension and stitch length. The fact that M4 is actually the best material of the ±45° NCFs indicates that the increased freedom of movement of the GF rovings (due to the higher stitch length) has a higher influence on the tensile strength than the stitch tension and thus even compensates for the increased in-plane fibre waviness caused by the higher stitch length.
A comparison of the NCF type 0/90° (M5) with all other NCFs shows that it has the lowest tensile strengths of the whole group when tested in the direction of the stitching yarn (0°) whereas it has the highest strength when tested perpendicular to it (90°). This is because of the uneven distribution of fibres between the layers. Due to the higher gauge length compared to the stitch length, the packing density of fibres in the 90° layer is much higher than in the 0° layer (see Figure 2). If the material is loaded at 90°, there are many more load-bearing fibres in the direction of the force, which results in higher strength.
Bending stiffness of GF roving, PE stitching yarn and NCFs
The bending stiffness of the GF roving, PE stitching yarn and NCFs was determined by cantilever tests in accordance with DIN 53362. The specimens were cut to a length of l = 250 mm. The NCF specimens have a width of 50 mm. The specimens are moved over the edge of the cantilever device until they touch the 41.5° plane (see Figure 4). The overhang length lÜ [mm] can then be read from the ruler. The bending stiffness B [mN cm2] is calculated by the formula shown in the (3.1), where m is the mass of the specimen [g] and g is the gravitational constant [m/s2]. Testing of bending stiffness by cantilever method for PE stitching yarn, GF roving and NCFs.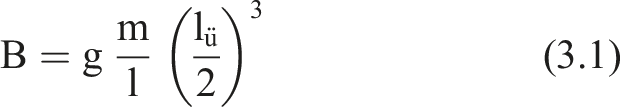
The sample size for the PE stitching yarn was 20. Since the GF roving showed significantly different bending stiffnesses, depending on whether it was tested against or in the winding direction of the roving, 10 repetitions were performed and averaged for each orientation. This resulted in high standard deviations. The NCFs specimen were tested in the direction of stitch (direction of production), in the direction of the GF roving and with the front and back side facing up for 10 repetitions each.
The bending stiffness of the PE stitching yarn and GF roving is 0.018 mN cm2 (±0.008 mN cm2) and 30.230 mN cm2 (±18.04 mN cm2) respectively. The results for the NCFs are shown in Figure 5. Between the ±45° NCFs (M1-M4) the bending stiffness is mostly influenced by stitch length (p-Value < 0.01; confidence interval 99%). NCFs with a stitch length of 2 mm (M1, M2) exhibit a higher bending stiffness compared to their counterparts with a stitch length of 3 mm (M3, M4). If the stitch length is short, the frequency of the stitches of the warp knitting thread increases. This means that the upper and lower layers of the NCF are connected to each other at more positions along the length of the specimen. This makes it more difficult for the upper and lower layers to slide against each other, which increases bending. The effect of stitch tension is not consistent and therefore not statistically significant. Although the influence of testing in GF fibre direction vs. in PE yarn direction is much higher (testing in GF fibre direction tends to double the bending stiffness), the differences between testing with back side up and front side up are statistically significant as well (p-Value < 0.01; confidence interval 99%). Depending on which side is facing up during testing, the ply with fibres oriented in bending direction are exposed to tension or compression loading which leads to the observed differences in bending stiffness. Compared to the ±45° NCFs (M1-M4) the 0/90° NCF shows significantly different bending stiffnesses. Its bending stiffnesses are lowest amongst the group when testing in GF fibre direction and highest when testing in PE yarn direction. This results from the fact that when the test specimens are tested in the direction of the PE yarn, the upper layer of the GF roving is also oriented in the same direction (under tension). If tested perpendicularly (in the direction of the lower GF layer), only this layer contributes to the bending stiffness (under compression). Bending stiffness of NCFs depending on testing orientation (error bars indicate standard deviation).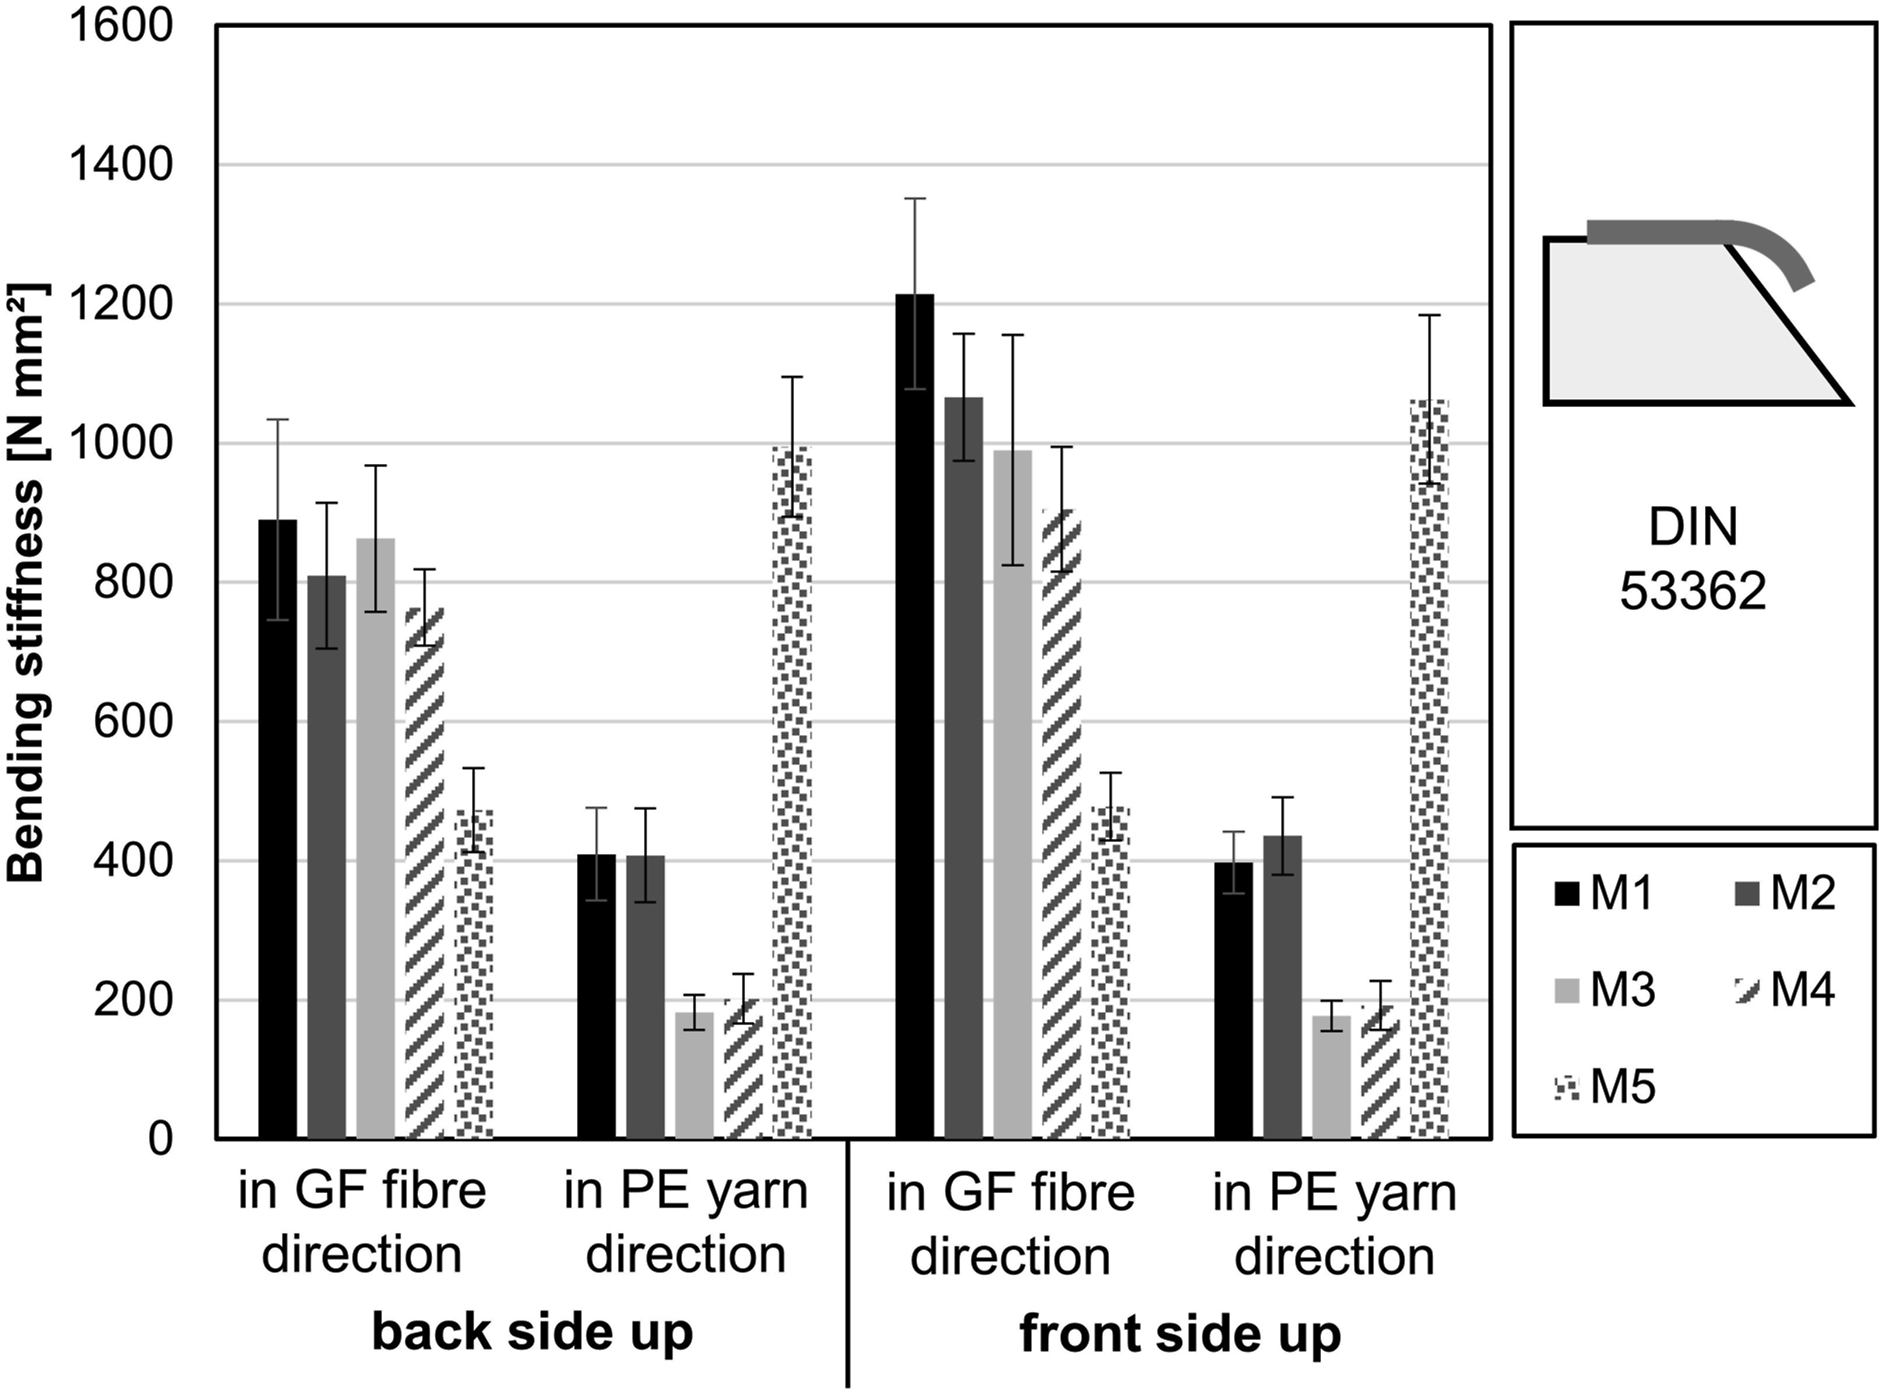
Characterisation of the friction behaviour
Friction behaviour between GF roving to GF roving and GF roving to PE stitching yarn
The friction between roving and yarns are dependent on the crossing angles.
21
In order to get a full characterisation of the friction behaviour between GF roving to GF roving and GF roving to PE yarn, these combinations were tested with crossing angles of 0°, 45° and 90°, different pretensions of 10 cN, 30 cN and 50 cN and different relative velocities of 1 m/min and 5 m/min for five replicates each. A friction test stand developed by Lünenschloß
22
was used at ITA (see Figure 6). In the friction test stand, one fibre is fixed with different angles on the surface of a driven roller while the other fibre is statistically positioned on the surface of the driven roller. By gathering data for multiple relative angles, the anisotropic friction behaviour can be modelled within draping simulations. One side of this tow is pretensioned with a defined load and the other is mounted to a load cell. The wrap angle is kept at 180°. The friction coefficient is then determined from the friction force appearing due to the rotation of the roller. Friction test stand by Lünenschloß.
22
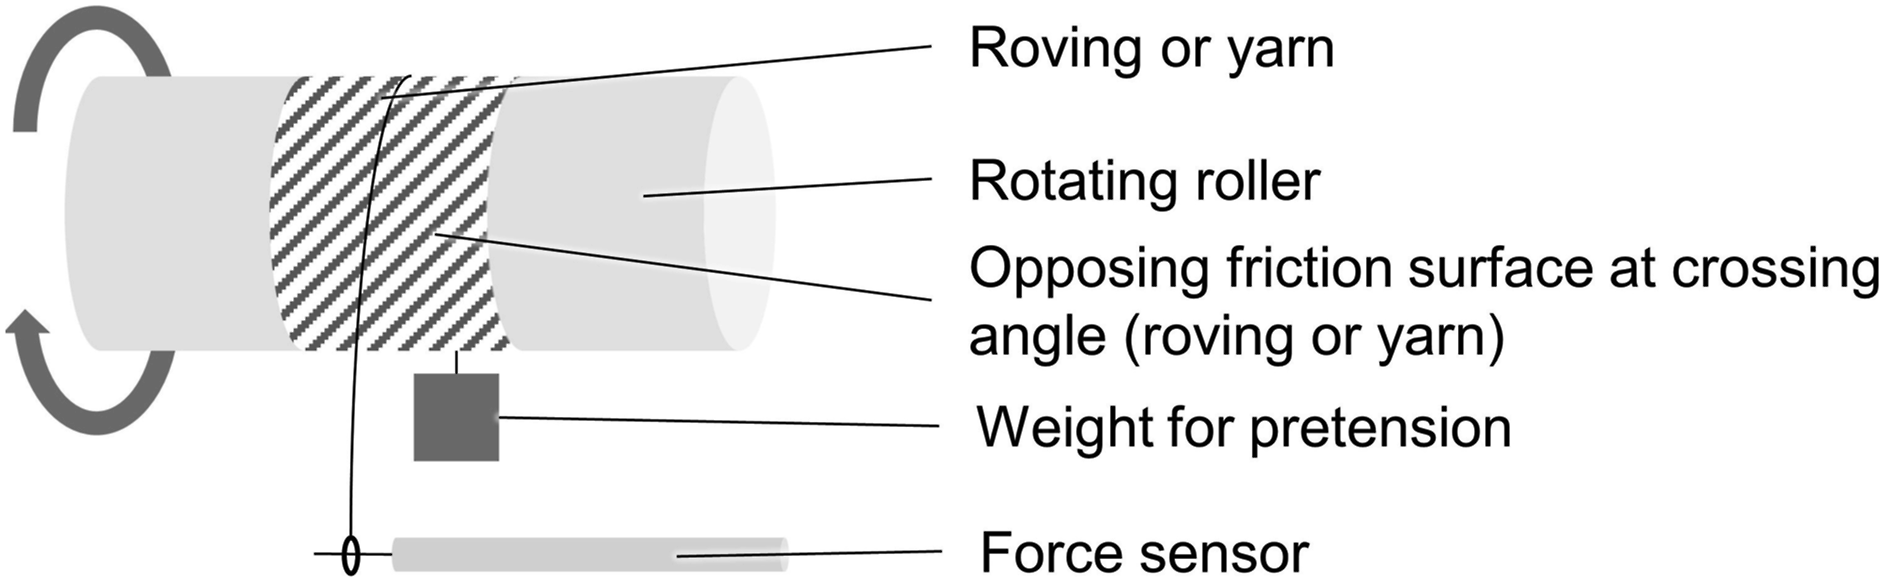
The coefficient of friction μ [-] (COF) can therefore be calculated by Euler–Eytelwein equation (see equation (3.2)
23
where T1 is the average input tension [cN] (pretension), T2 is the measured tension at the force sensor [cN] and θ is the wrap angle [rad] (here π). An exemplary plot of the measured friction coefficient is shown in Figure 7. Coefficient of friction between GF roving and PE stitching yarn at 10 cN pretension.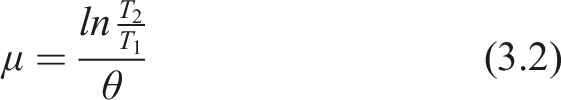
A crossing angle of 0° leads to inconsistent measurements. At this crossing angle configuration, geometric interlocking between the aligned filaments of the fibres lead to high forces and thus to high coefficients of frictions. Especially for the GF to GF pairing, these measurements exceed the capacity of the force sensor and were therefore excluded from the measurements. Furthermore, a slight stick-slip effect was observed at relative velocities of 1 m/min. The coefficient of friction was usually higher at the beginning of the trials but remained steady after the first 60 s due to run-in phenomena between two opposing friction surfaces.
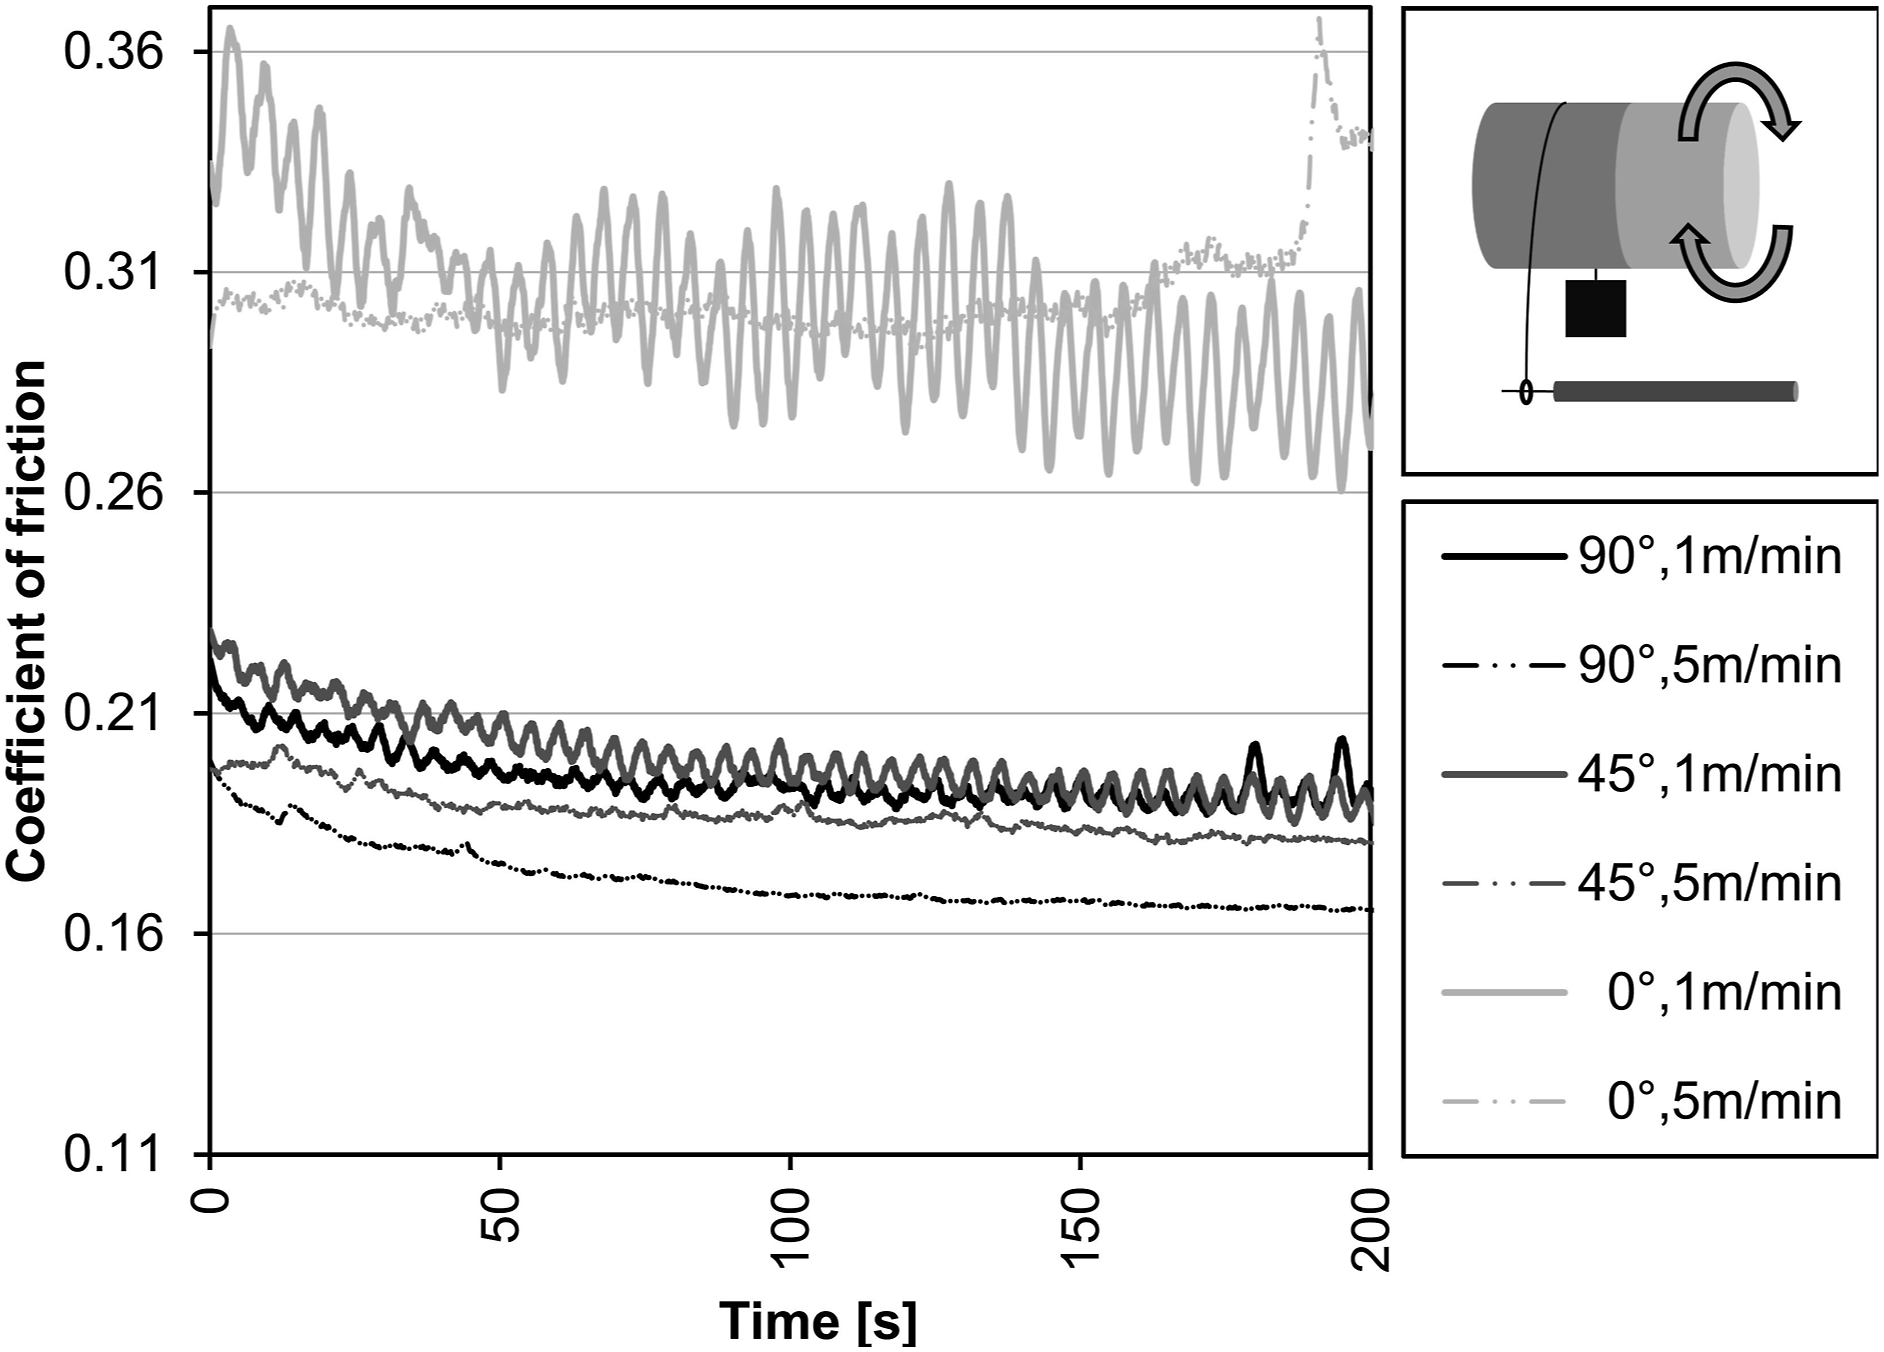
A comparison between all tested configurations is shown in Figure 8. The figure shows the average COF and its standard deviation over the measurement period. The COF is highest at a crossing angle of 0° due to interlocking between filaments with the same orientation. As soon as the relative angle deviates from 0°, the COF decreases significantly and remains constant even with increasing relative angle. Comparing the results of the GF roving to PE yarn friction trials at preloads of 10 and 30 cN, it can be observed that the friction coefficients are higher at low speed (1 m/min). The higher friction coefficients can be either attributed to the previously described stick-slip phenomenon or the increased interlocking between the friction surfaces. No consistent trend regarding the influence of speed can be derived from the other configurations. Therefore, no general statement can be made about the influence of the relative speed on the COF. At low levels of pretension (10 cN) the COF is slightly higher compared to higher levels of pretension, because the filaments may not be fully aligned under load making them more prone for geometric entanglement at low levels of pretension. However, no significant difference is observed between a pretension of 30 cN and 50 cN. Furthermore, a slight trend can be observed that the COF is lower when the friction between two GF rovings is measured compared to the friction between a GF roving and PE yarn. Coefficient of friction for different friction configurations, relative velocities and levels of pretension (top: GF roving to GF roving, bottom: GF roving to PE yarn) (error bars indicate standard deviation).
Friction behaviour between NCFs
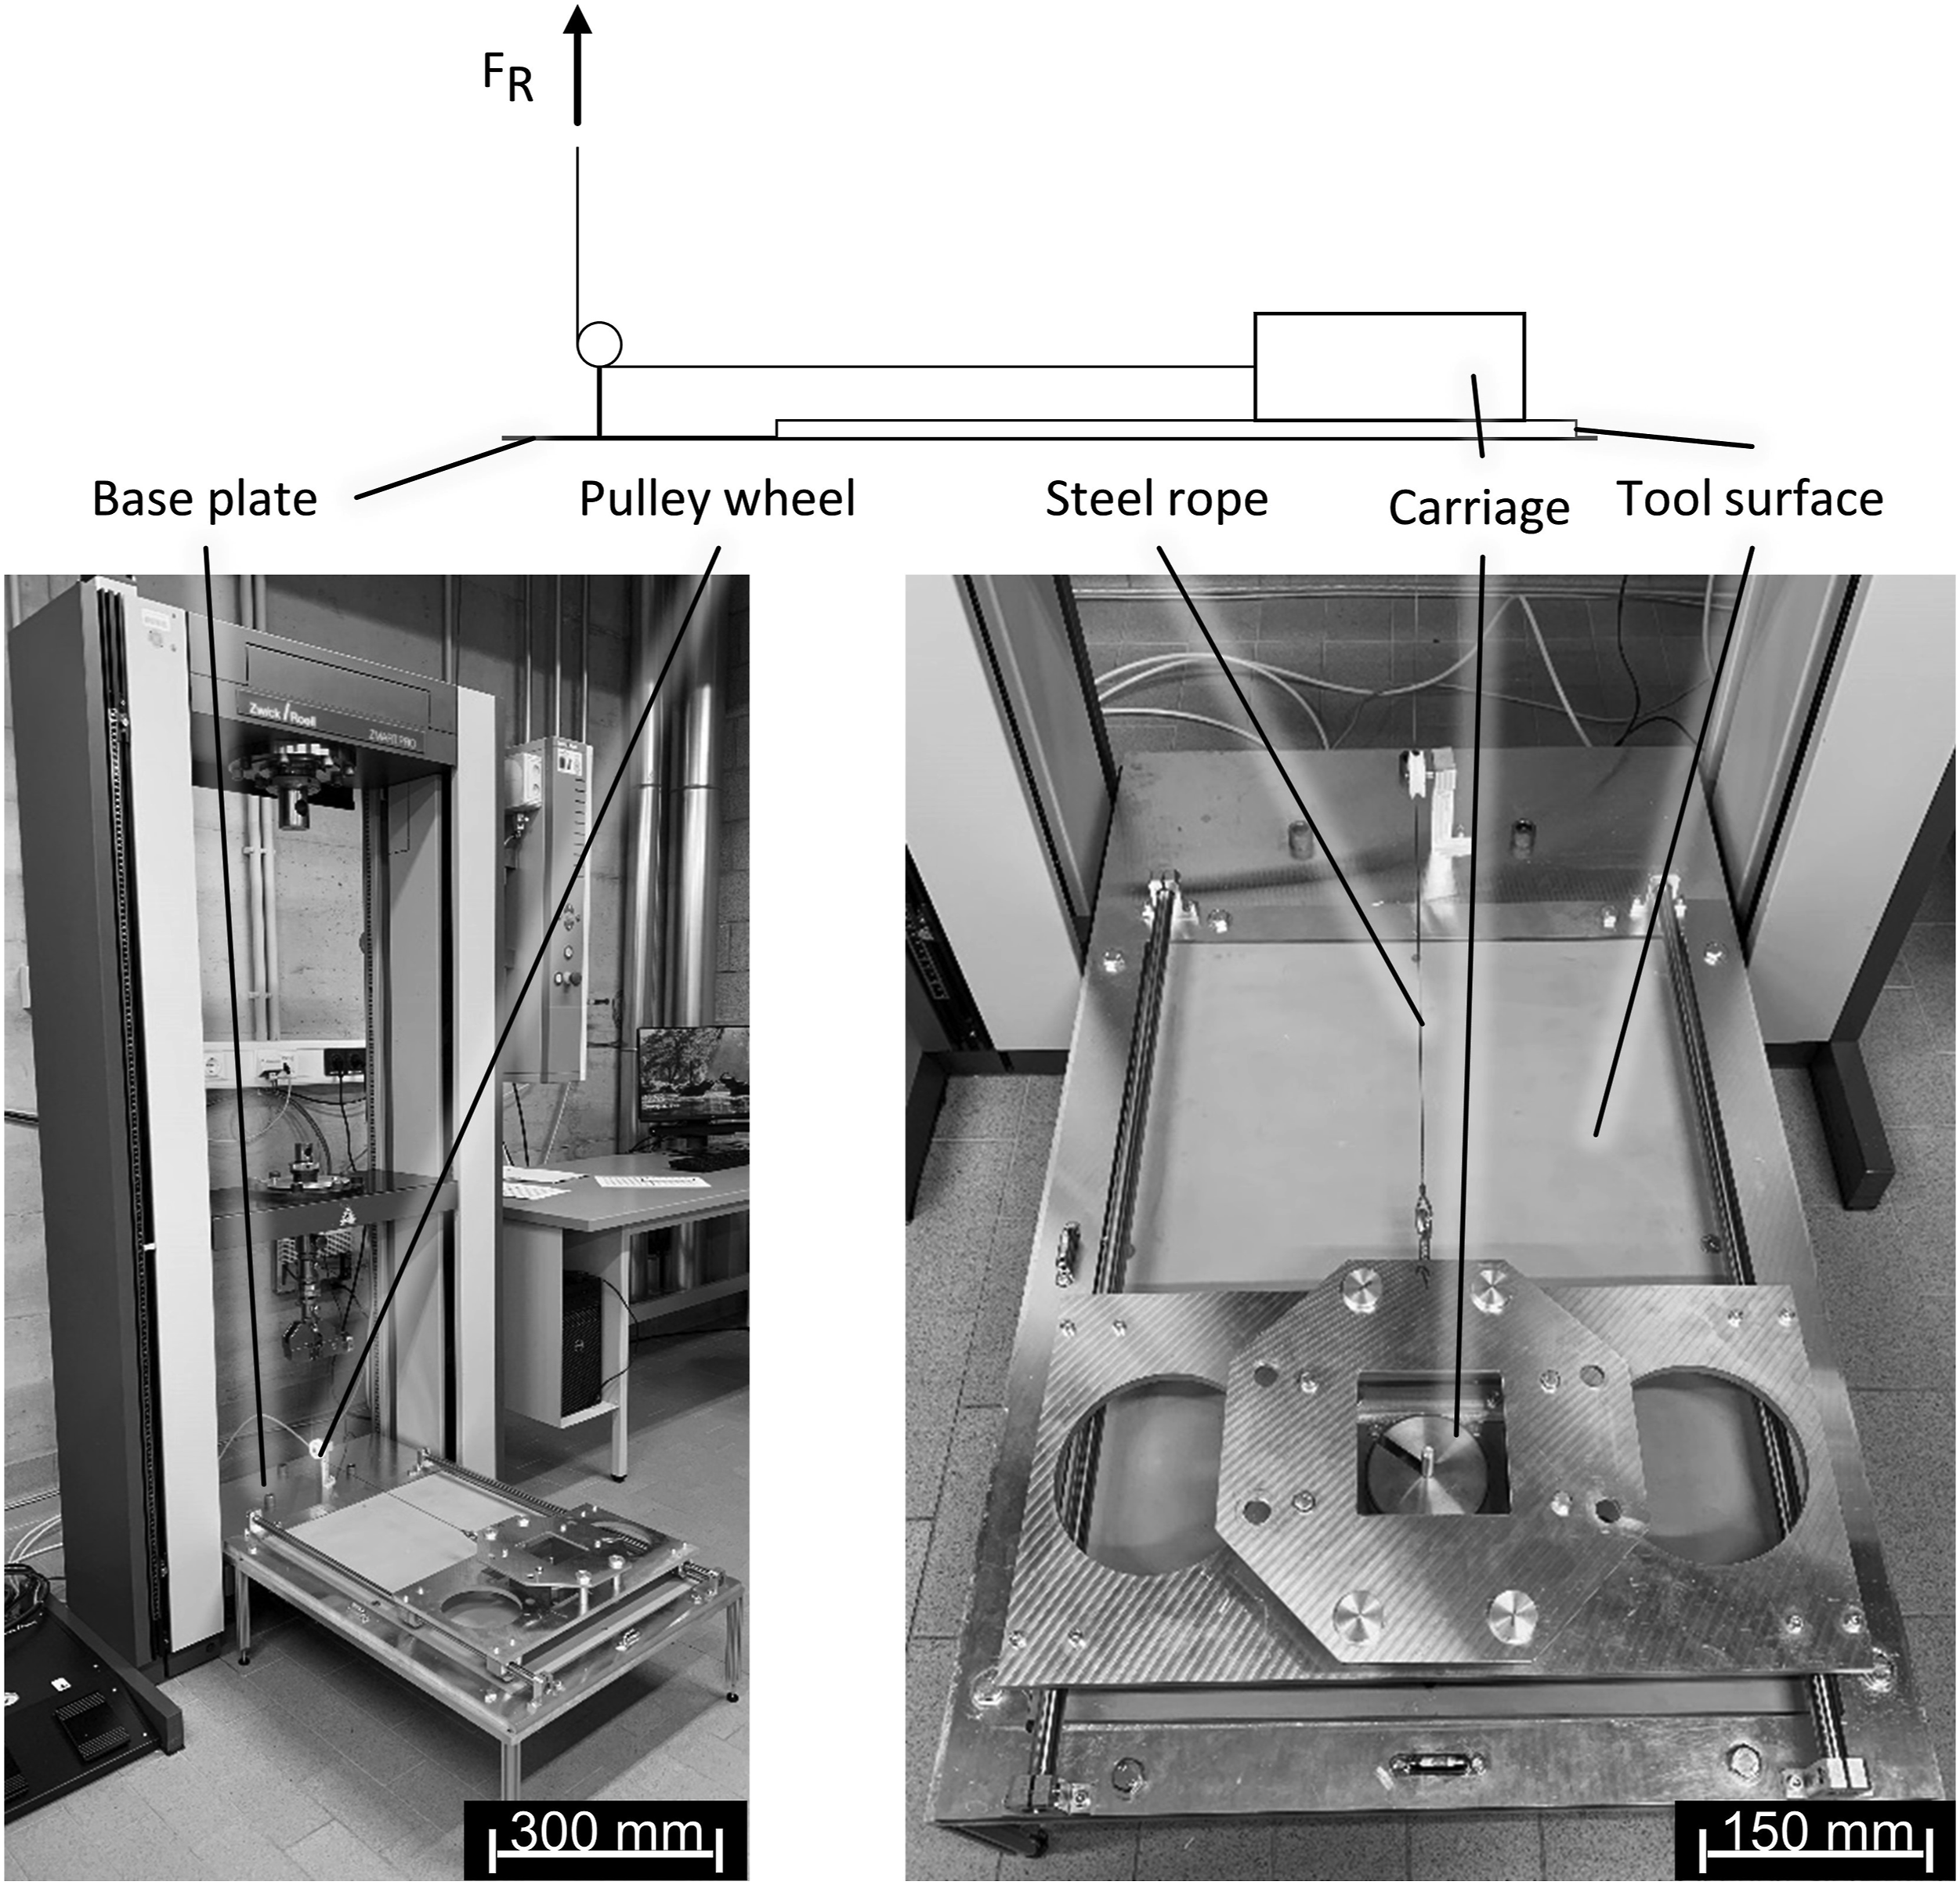
Within this section the friction between NCF-to-NCF surface, NCF-to-tool surface and the influence of relative angle between friction partners is investigated. Therefore, a friction test stand has been developed (see Figure 9). A similar setup is described in the literature.9,24 The device features a friction surface of 150 × 80 mm. The normal force of the friction can be changed by adding additional weight to the carriage. The carriage is covered with blanks of the NCF. The blanks are cut out of from the broad good NCF at different angles in order to achieve different relative angles between the tool surface or NCF and the NCF attached to the bottom of the carriage. The base plate can optionally be fitted with inserts of different tool materials or also with blanks of the NCFs in order to test the friction behaviour between NCF-to-tool surface or NCF-to-NCF surface. The coefficient of friction is calculated by the equation (3.3). The friction force FR [N] describes the force measured by a ZwickRoell GmbH & Co. KG (Ulm, Germany) 1455 universal testing machine with a 1kN Xforce HP force sensor by ZwickRoell GmbH & Co. KG (Ulm, Germany). The total mass m [kg] of the carriage is setup to 2.83 kg and g [m/s2] is the gravitational coefficient of 9.81 m/s2. The testing speed is 400 mm/min. NCF friction test stand.
The tests are conducted with different NCF materials (M1-M5), different relative angles between friction partners (0–90° in increments of 15°) and different friction surfaces (front of the NCF to the back of the NCF, front of the NCF to the tool surface and back of the NCF to the tool surface). Each configuration is repeated five times. The mould consists of an Ureol material, which is also commonly used as a moulding material in FRP industry. Figure 10 shows an exemplary line plot of the measurement of the friction force verses the displacement for a NCF front to back side pairing at a relative angle of 60°. In some of the tested configurations (like shown in Figure 10), it can be observed that the highest frictional forces are measured during the first repetition. Since the carriage and the base plate were not covered with a new test specimen after each repetition, this can be attributed to run-in effects. After the first repetition, the scatter between repetitions remains small. In addition, it was observed that the friction forces reach their maximum within the first 50 mm of displacement and tend to increase again towards the end. For the subsequent calculation of the average dynamic coefficient of friction, only the measurements between 50-300 mm displacement are considered. Due to the stick-slip effect when running the system empty, it was not possible to determine the friction of the system itself (friction of the pulley wheel, linear axis of the carriage etc.). Therefore, when interpreting the results, it must be noted that the frictional resistance of the measuring device itself is part of the measured friction. The average value is then calculated over all five repetitions. A comparison of all tested materials and configurations is shown in Figure 11. Friction Force vs. Displacement (Material 1, NCF front side to NCF back side, relative angle: 60°). Comparison of dynamic COF of all tested materials and configurations (error bars indicate standard deviation).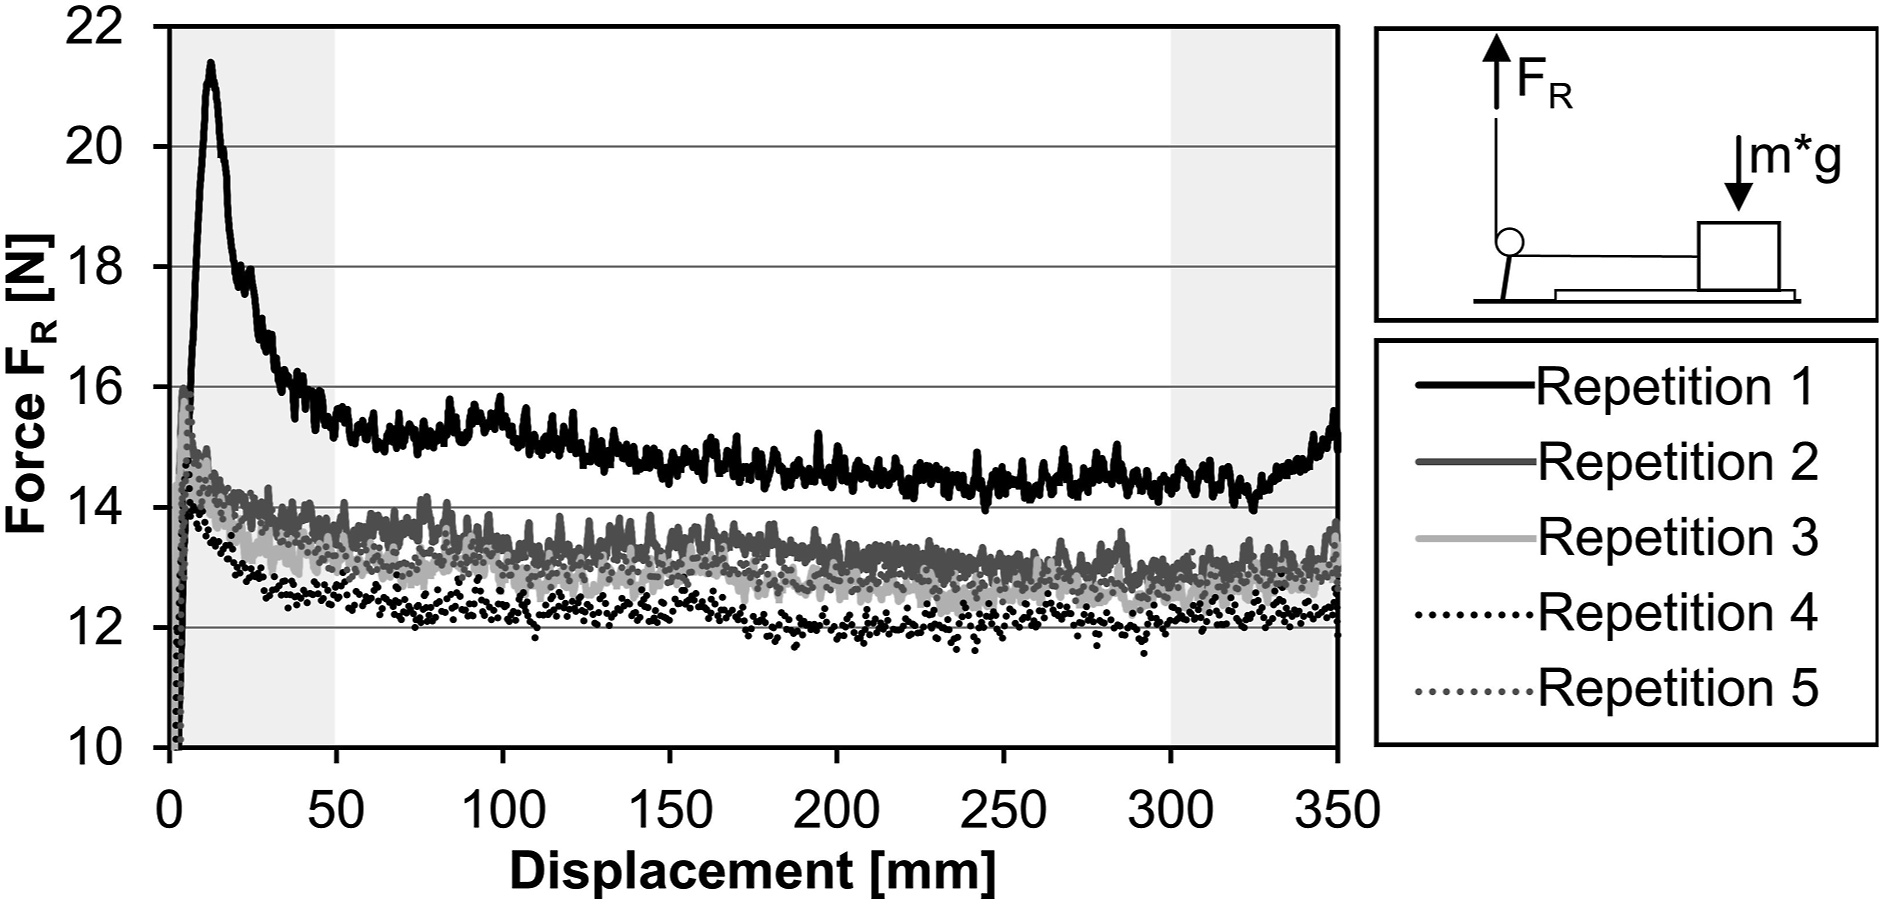
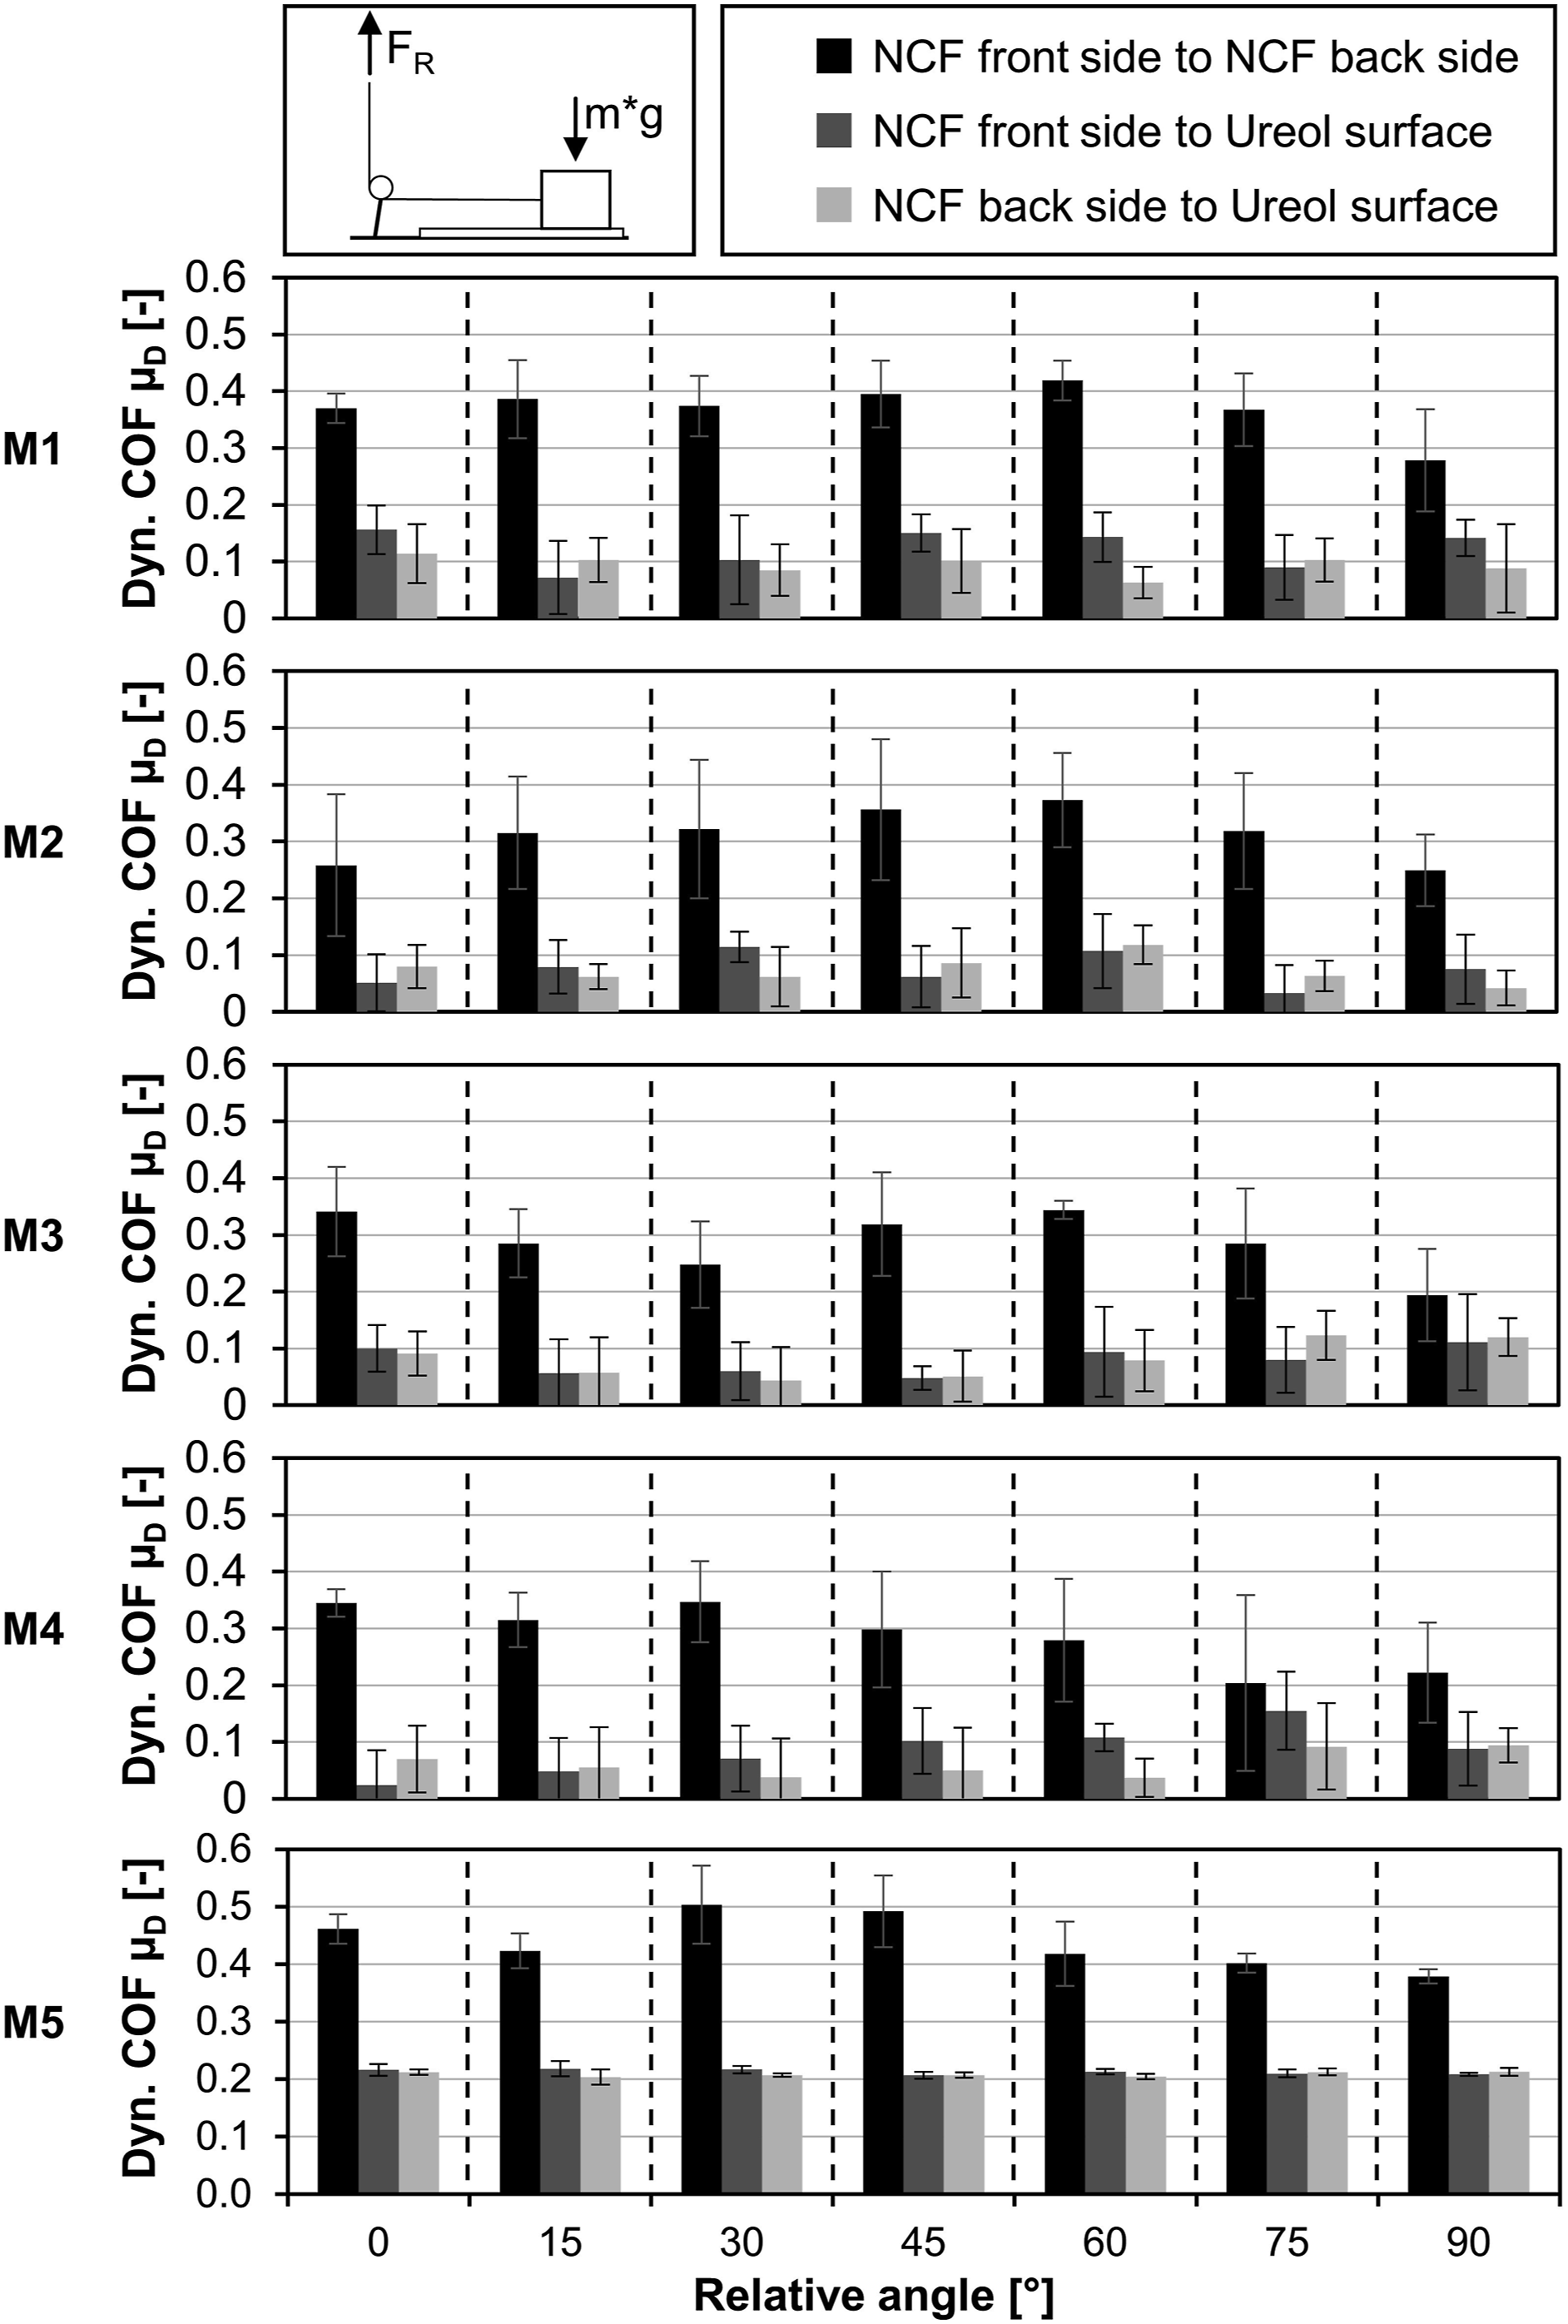
The dynamic COF is higher by a factor of 2–3.5 when the front and back side of the NCF are paired compared to friction between NCF and tool surface. It does not depend on whether the front or back side of the NCF is in contact with the other fabric surface (no consistent trend). The dynamic friction coefficients are highest for M5 because the tricot stitch offers more opportunities for interlocking of the knitted threads of both surfaces. Although a slight trend can be observed that the COF increases up to a relative angle of 45° and then decreases again when the front and back of the NCF are in frictional contact, the influence of the angle is not statistically significant (p-value 0.3, confidence interval 99%). Furthermore, no interaction between the testing parameters is statistically significant. However, the stitch length has a statistically significant effect on the friction behaviour of material M1-M4 (±45° NCFs). The COF is lower for NCFs with a higher stitch length of 3 mm (M3, M4) (p-value < 0.01, confidence interval 99%). When the stitch length is short, the frequency of the stitch yarn loops is higher, resulting in more interlocking between the stitch yarn on the surface of the NCF. The stitch tension has no significant influence on the friction behaviour.
Shear angle dependent thickness change
Depending on the shear angle, the thickness of the NCF changes. For this reason, the thickness of all NCFs is measured under different shear angles from 0° to 45°. In order to shear the NCF specimens, the picture frame construction presented in the following chapters is used. The thickness is measured at four different locations (see Figure 12) while the NCF is mounted in the picture frame with a micrometre screw. Each measurement is repeated twice (independent NCF specimens) at four different locations (total of eight data points) in order to calculate the average thickness. The thickness of the NCFs with a fibre orientation of ±45° (M1-M4) is measured when shearing in the stitch direction (so called positive shear) and perpendicular to that (so called negative shear). Thus, positive shear results in tension of the stitching yarn and negative shear leads to compression of the stitching yarn. The results are shown in Figure 12. Although all tested NCFs are starting (0° of shear) with a thickness between 0.4 – 0.5 mm, the shear angle dependent thickness change differs significantly between the materials. An increase in thickness with increasing shear angle is consistent for all materials and configurations (p-value < 0.01, 99% confidence interval). However, the rate of thickness change increases with increasing shear angle. This is consistent with the observations of Thije et al.
5
The shear direction (positive or negative) only makes a difference for shear angles over 30° (interaction between shear orientation and shear angle is statistically significant with p-value < 0.01; confidence interval 99%). Furthermore, the effect of stitch length is significant (p-value < 0.01; confidence interval 99%). The thickness increase of NCFs with a stitch length of 3 mm (M3 & M4) is 5–30% lower compared to NCFs with a stitch length of 2 mm (M1 & M2). Due to the lower stitch length, the materials are more prone for out-of-plane deformation which increases the thickness of these materials. The change in thickness of the 0/90° NCF (M5) is thus comparable to the behaviour of ±45° NCFs under positive shear. Shear angle dependent thickness change of all tested materials and configurations (error bars indicate standard deviation).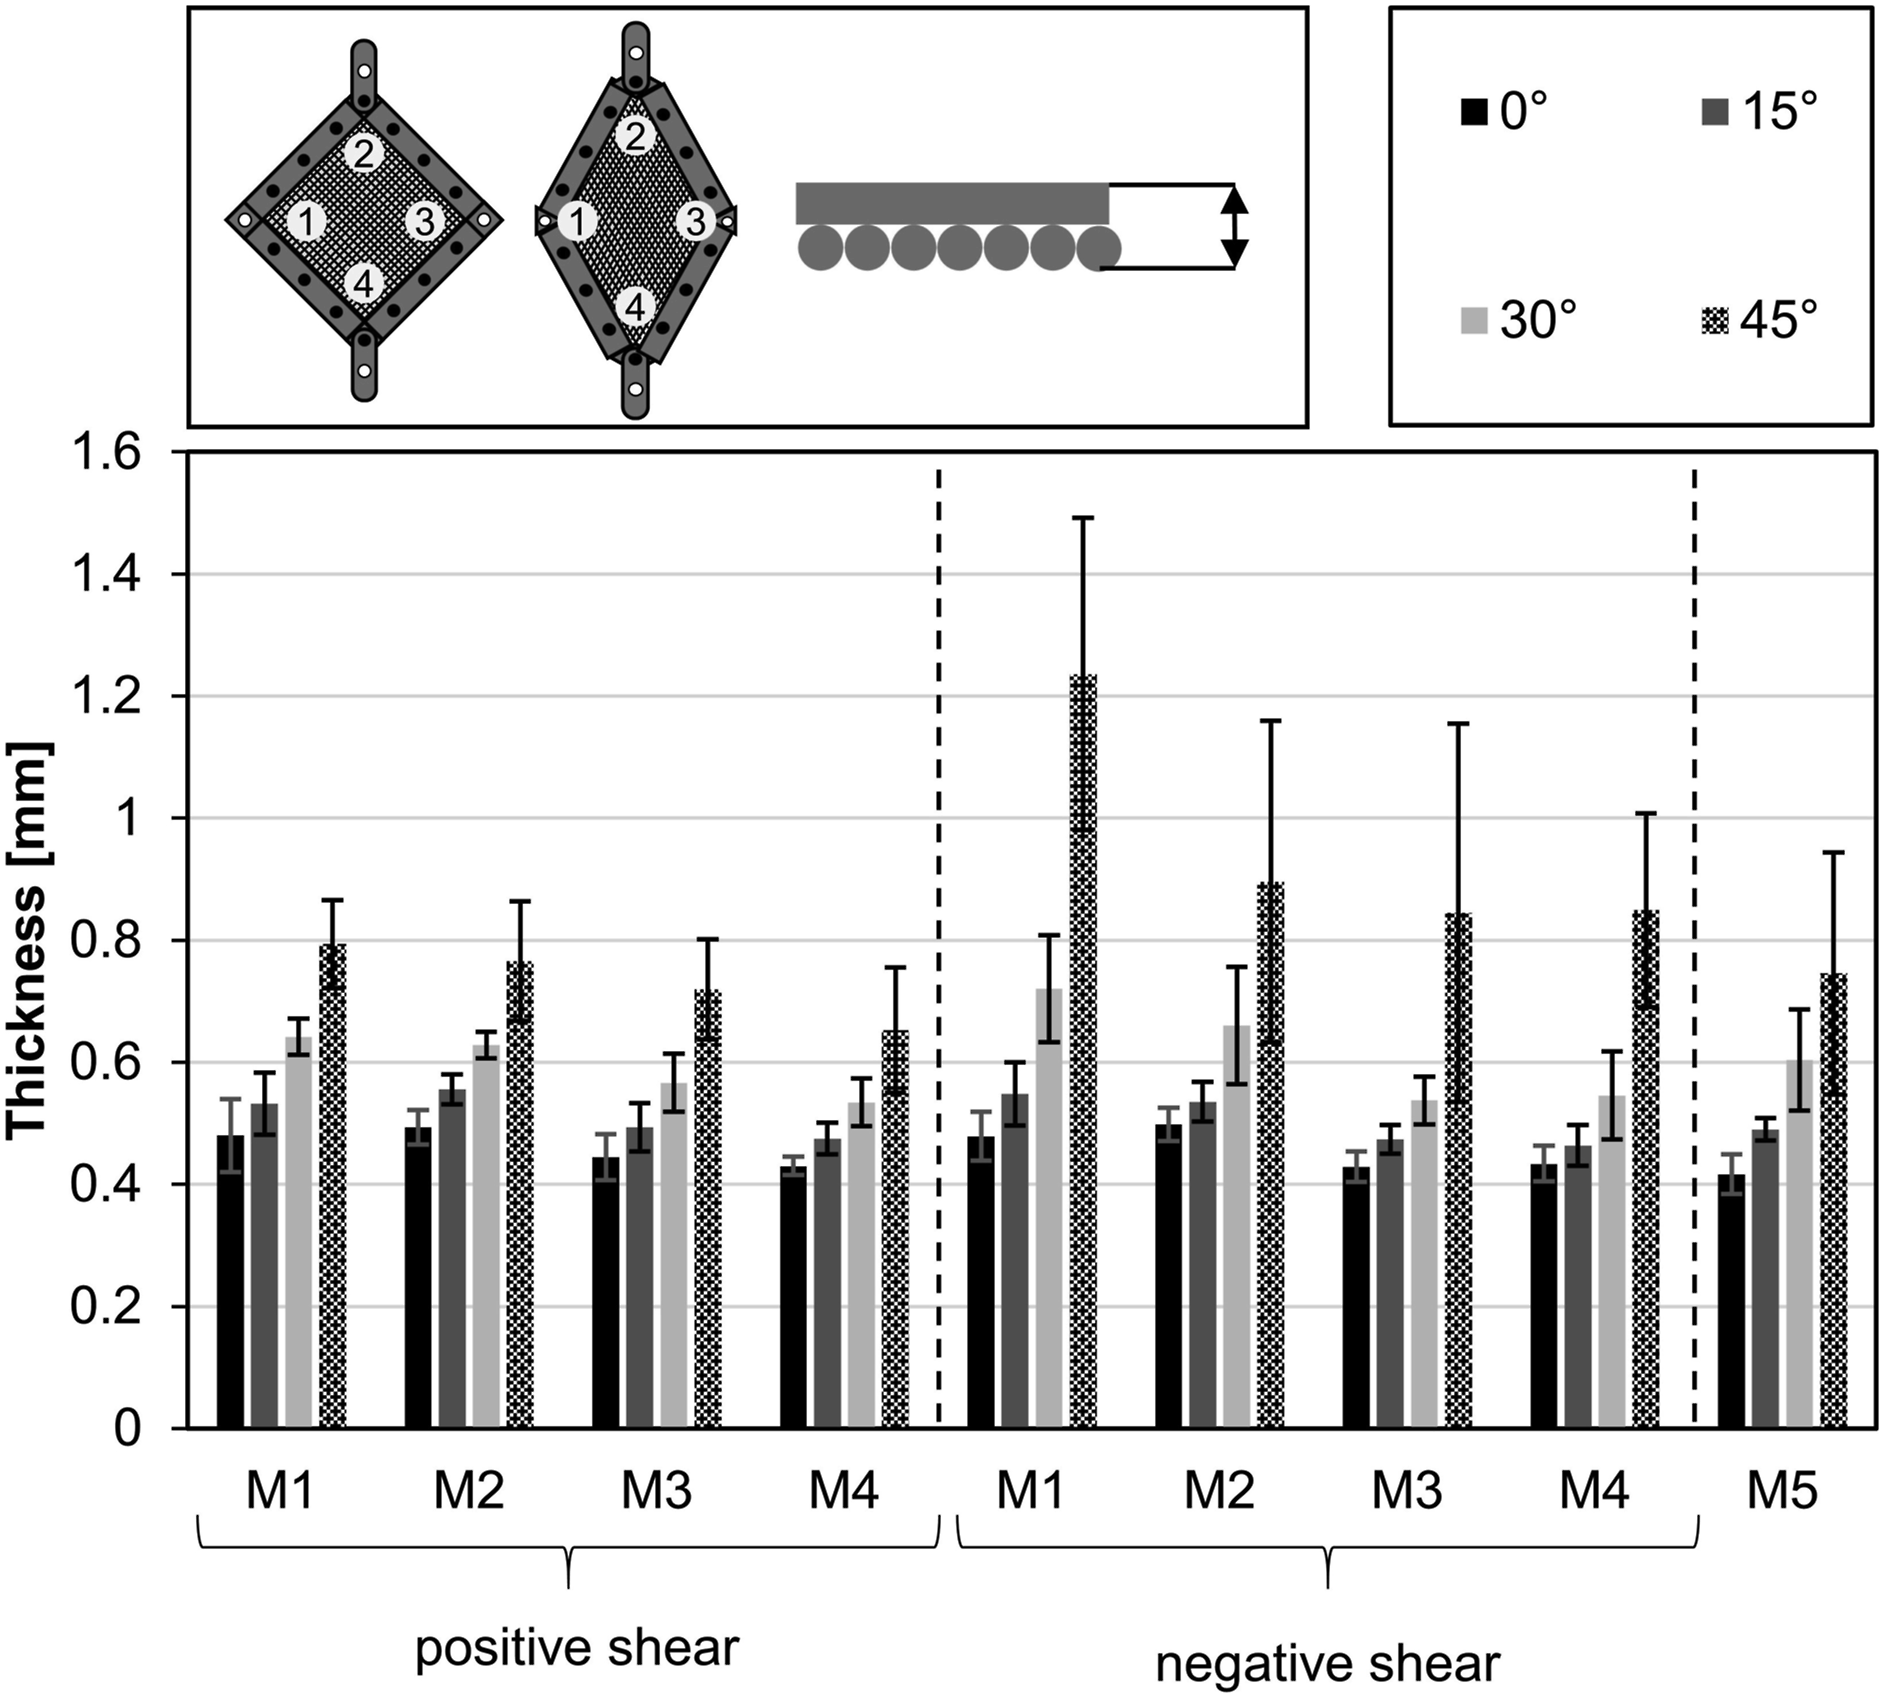
Shear and drape behaviour of NCFs on a macro scale
The bias extension test and the picture frame test are the two most common tests in order to quantify the shear behaviour of textiles.25,26 The results of both tests will be presented in the following sections. In order to verify the simulation model developed based on all the data gathered within this work, drape tests on a double dome geometry are conducted as well.
Bias extension test
Specimens with a geometry 300 × 100 mm are used. For better force transmission a 50 mm wide cardboard strip was glued onto the specimens from both sides with epoxy resin Araldite 2011 by Huntsman Advanced Materials GmbH (Basel, Switzerland) resulting on a free area of 200 × 100 mm. A ZwickiLine Z2.5 testing machine by ZwickRoell GmbH & Co. KG (Ulm, Germany) with a 1kN Xforce HP force sensor by ZwickRoell GmbH & Co. KG (Ulm, Germany) is used. All ±45° NCFs (M1-M4) are loaded under positive and negative shear. The speed of displacement is 50 mm/min and a preload force of 0.5 N is applied. Each measurement is repeated five times. In order to track the intra-ply sliding of the rovings, a grid with markers (dots) along the A-B and B-C border is applied to the specimens. Each 10 mm of displacement an image is taken the front side of the specimen. This enables the overlay of splines trough these markings in post-processing in order to track the displacement and in-plane bending behaviour of the rovings (see Figure 13). Setup of bias extension tests.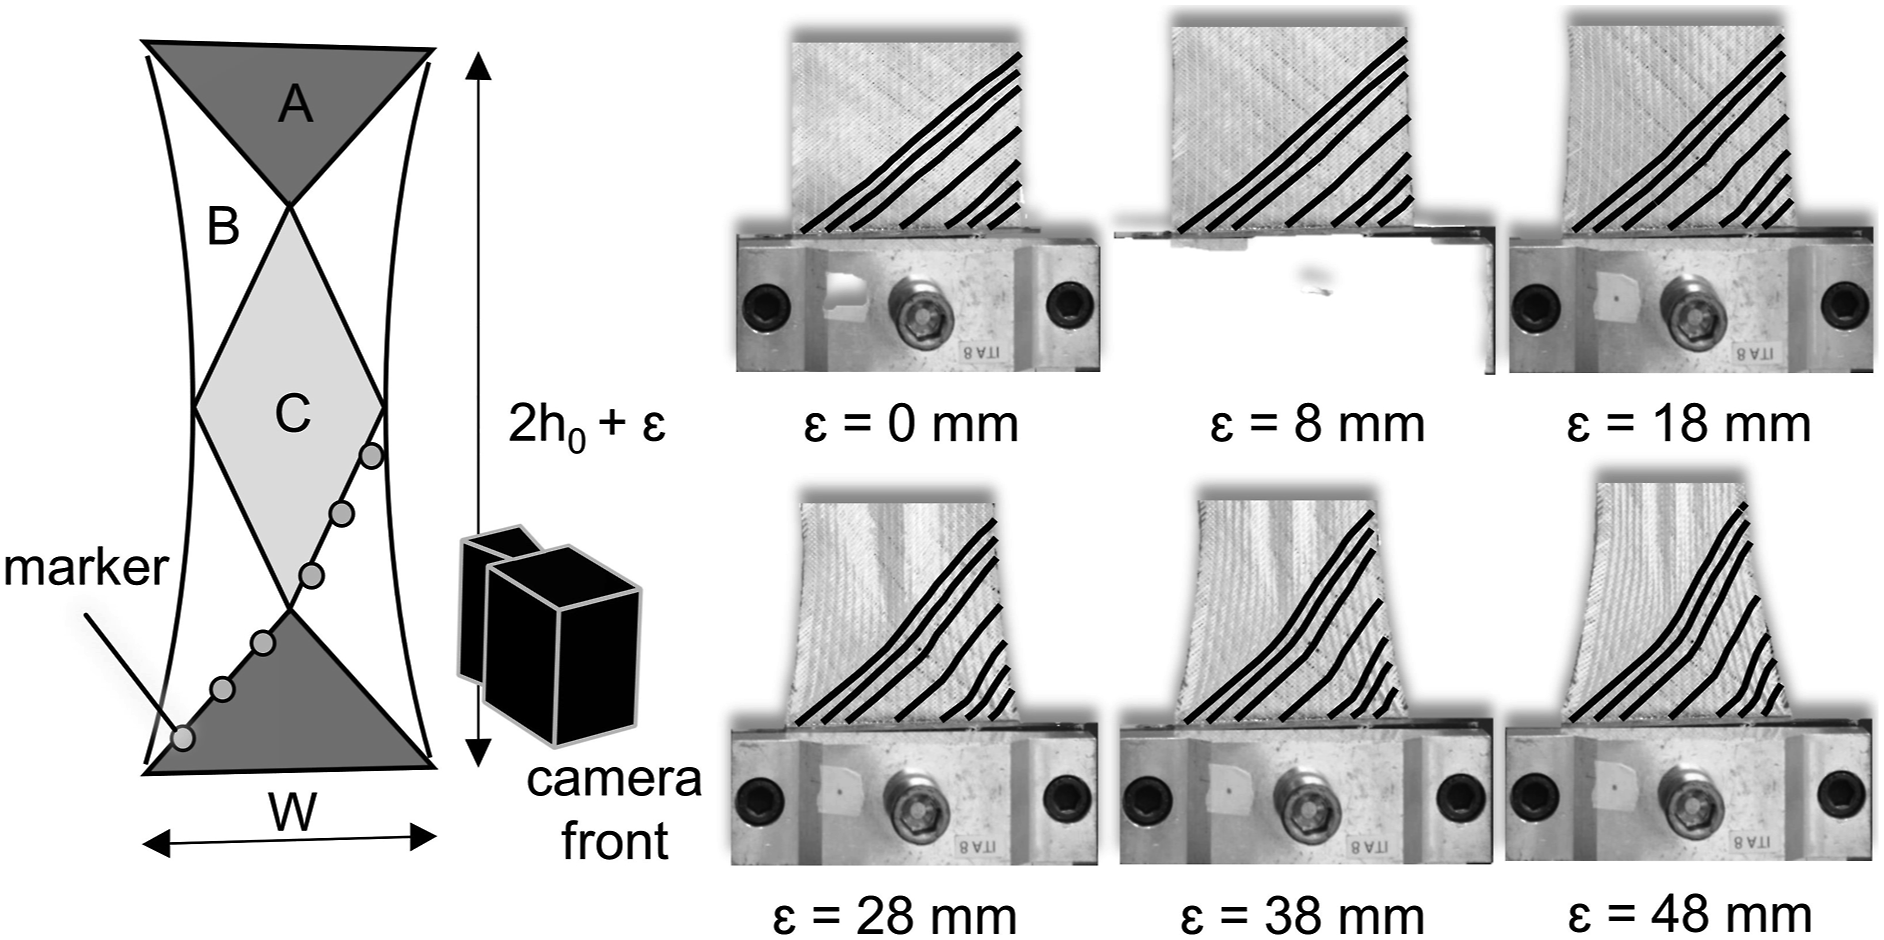
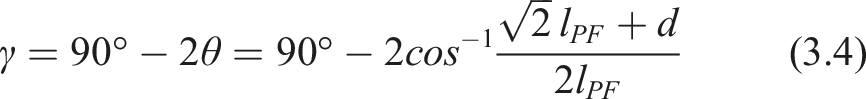
The axial force over the displacement is shown in Figure 14 for all tested materials and configurations. The theoretical (kinematic pure) shear angle γ of the sample in the bias extension test in zone C (see Figure 13) is calculated from the displacement via equation (3.4)
28
and substituting Axial force-displacement graphs for bias extension tests (error bars indicate standard deviation).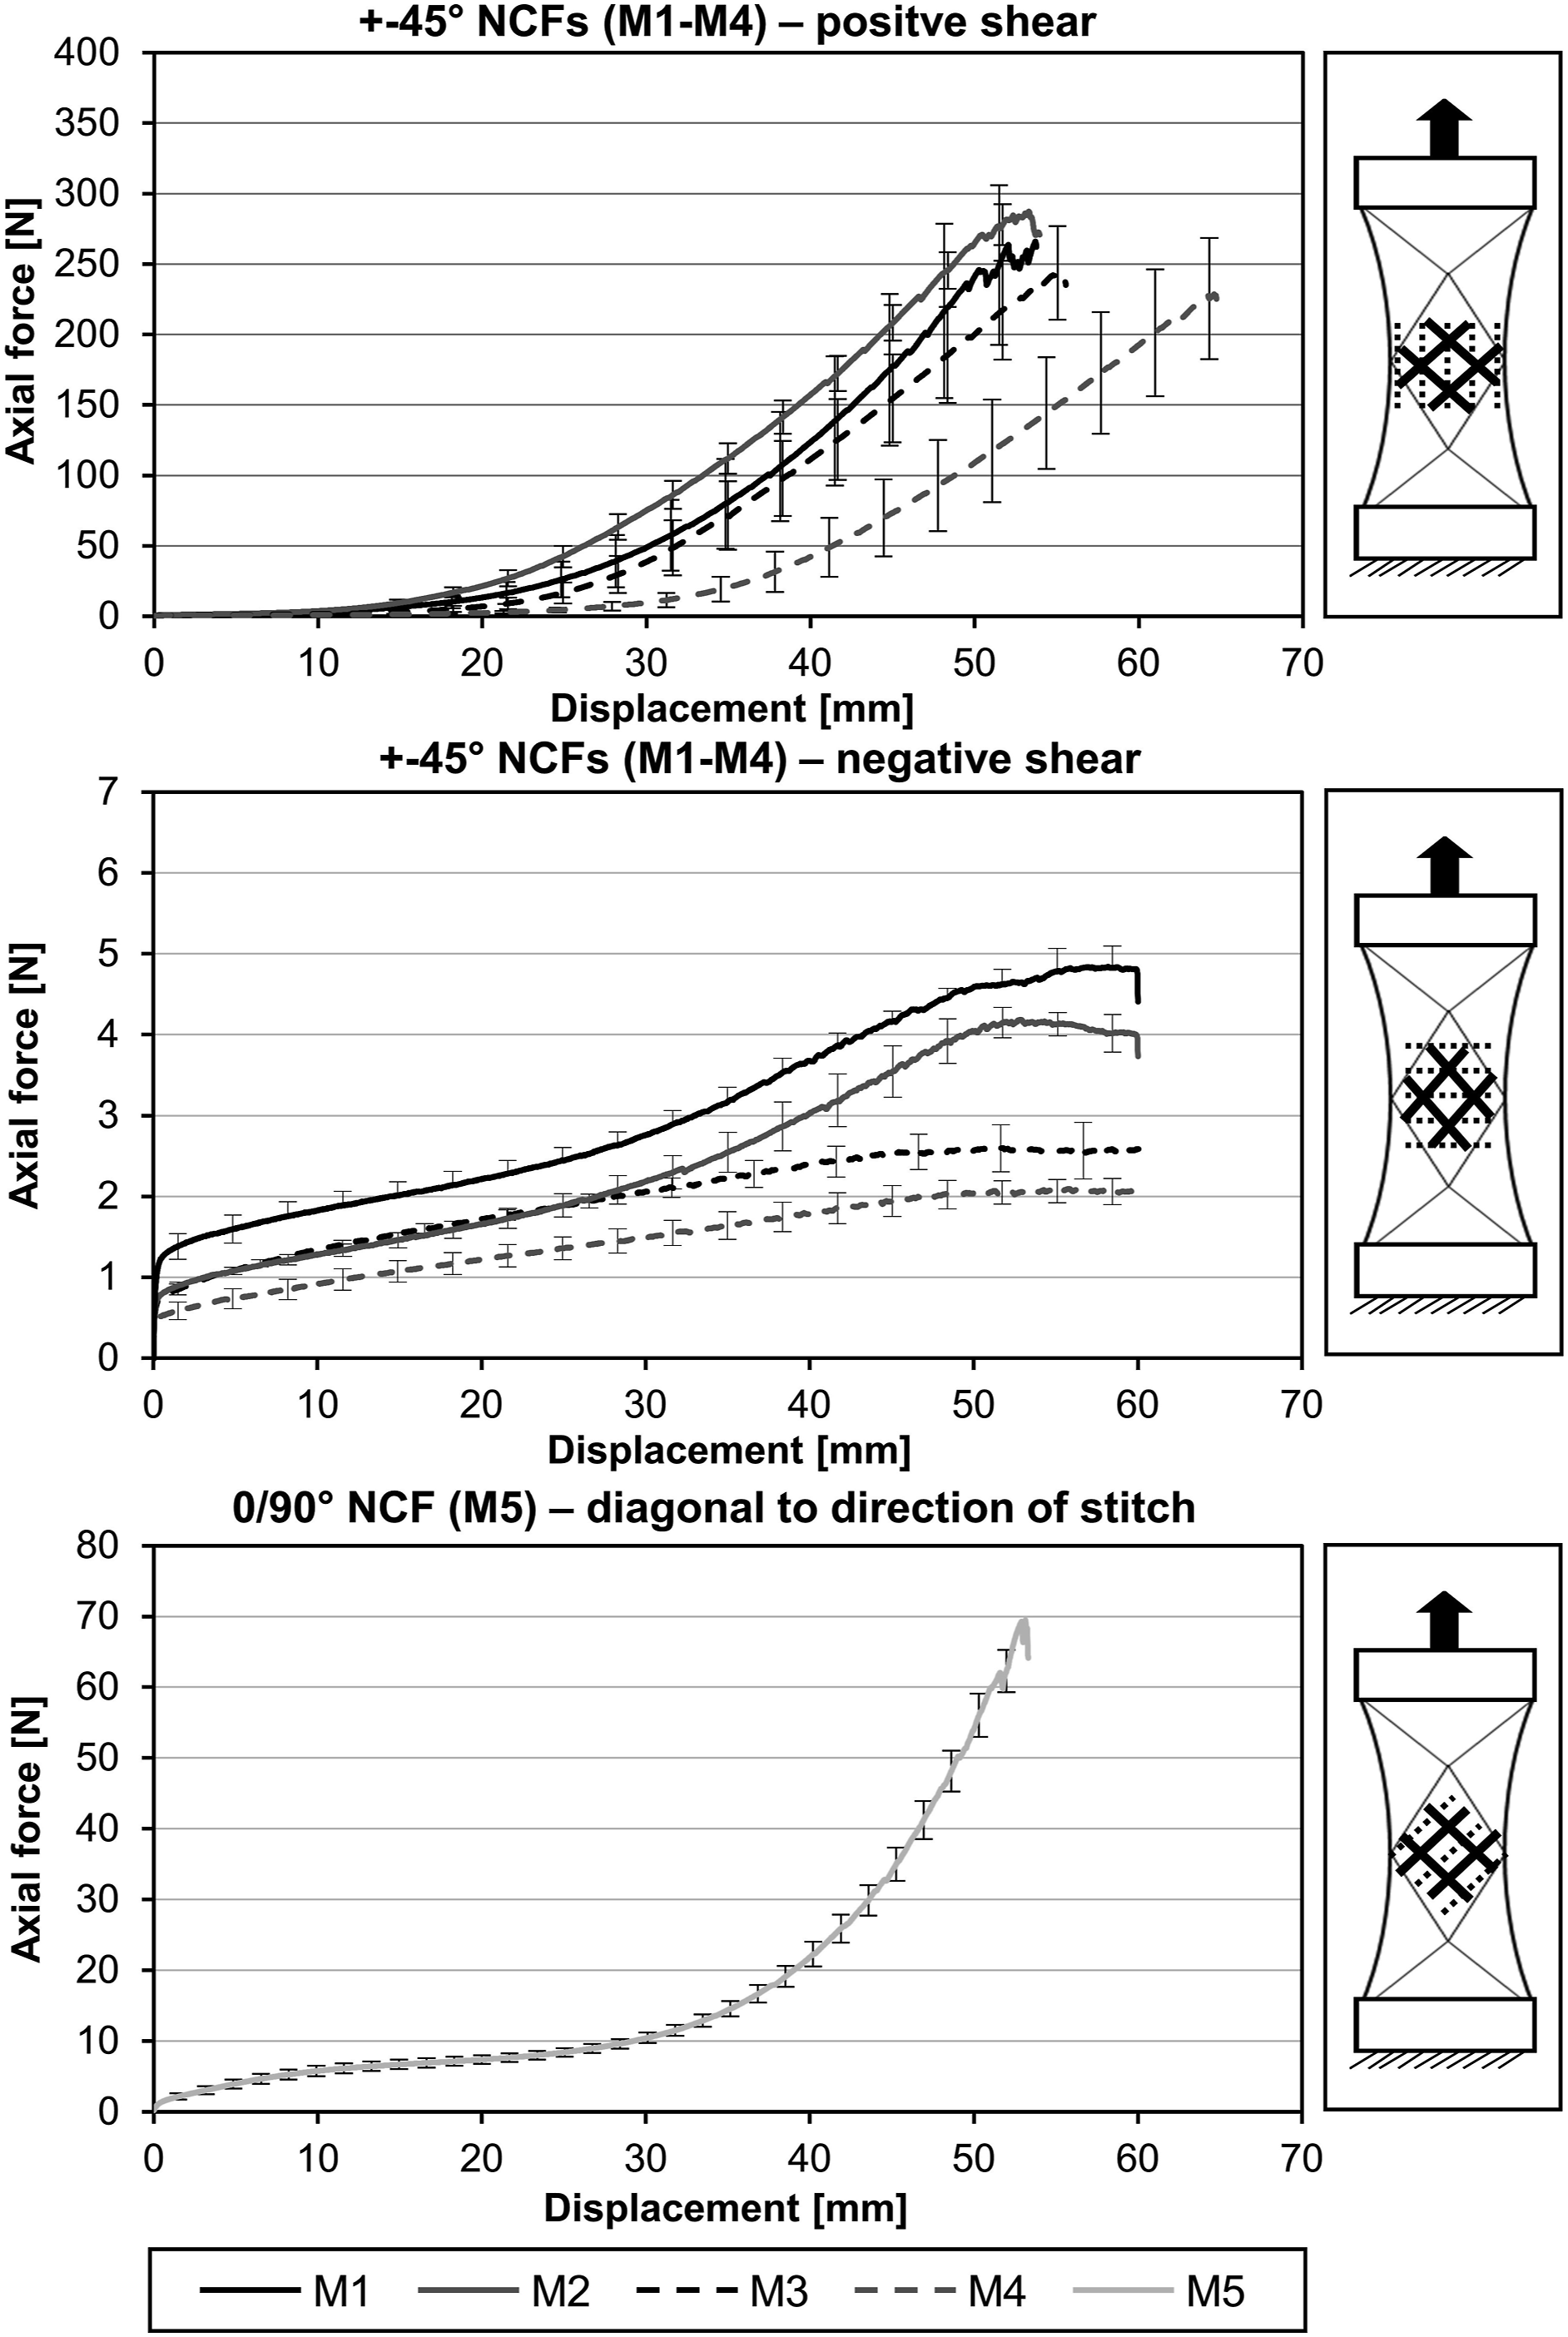
The characteristics of the force curve depend on the material and the testing direction. For tests in positive shear direction, materials differ in the displacement at which the force starts to increase. The gradient of the force curves after the initial rise in shear force is comparable. Under negative shear, the force curves initially rise very steeply (displacement <5 mm). This initial increase is followed by a phase with a low gradient. At a displacement of approx. 40 mm, the slope increases again for materials with a small stitch length of 2 mm (M1 & M2). For M5, the force curve already increases at a displacement of approx. 30 mm. The level of the measured forces for M5 lies between the values of M1 - M4 when tested in both negative and positive shear direction.
Inter-ply sliding in bias extension tests
Despite the warp-knitting of the individual layers of the NCFs, there is still the possibility for relative motion between the layers. In this case, the front and back surfaces of the specimens do not deform equally under shear stress. This phenomenon is called inter-ply sliding. To quantify this phenomenon, a pattern of 20 dots was drawn to the front and back of the bias extension specimen (see Figure 15). It was ensured that the dots were exactly aligned on both sides. The tests were performed with the same test parameters as the bias extension tests. During the tests, two cameras were used to take a picture of the front and back side each 10 mm of displacement. As coordinate origin a fixed reference point on the testing machine is selected which is visible in both images. This enables that the images of the front and rear sides can be referenced to the same coordinate system, which allows to calculate the sliding distance between the dots on both sides. Setup of the two-sided optical measurements during bias extension tests.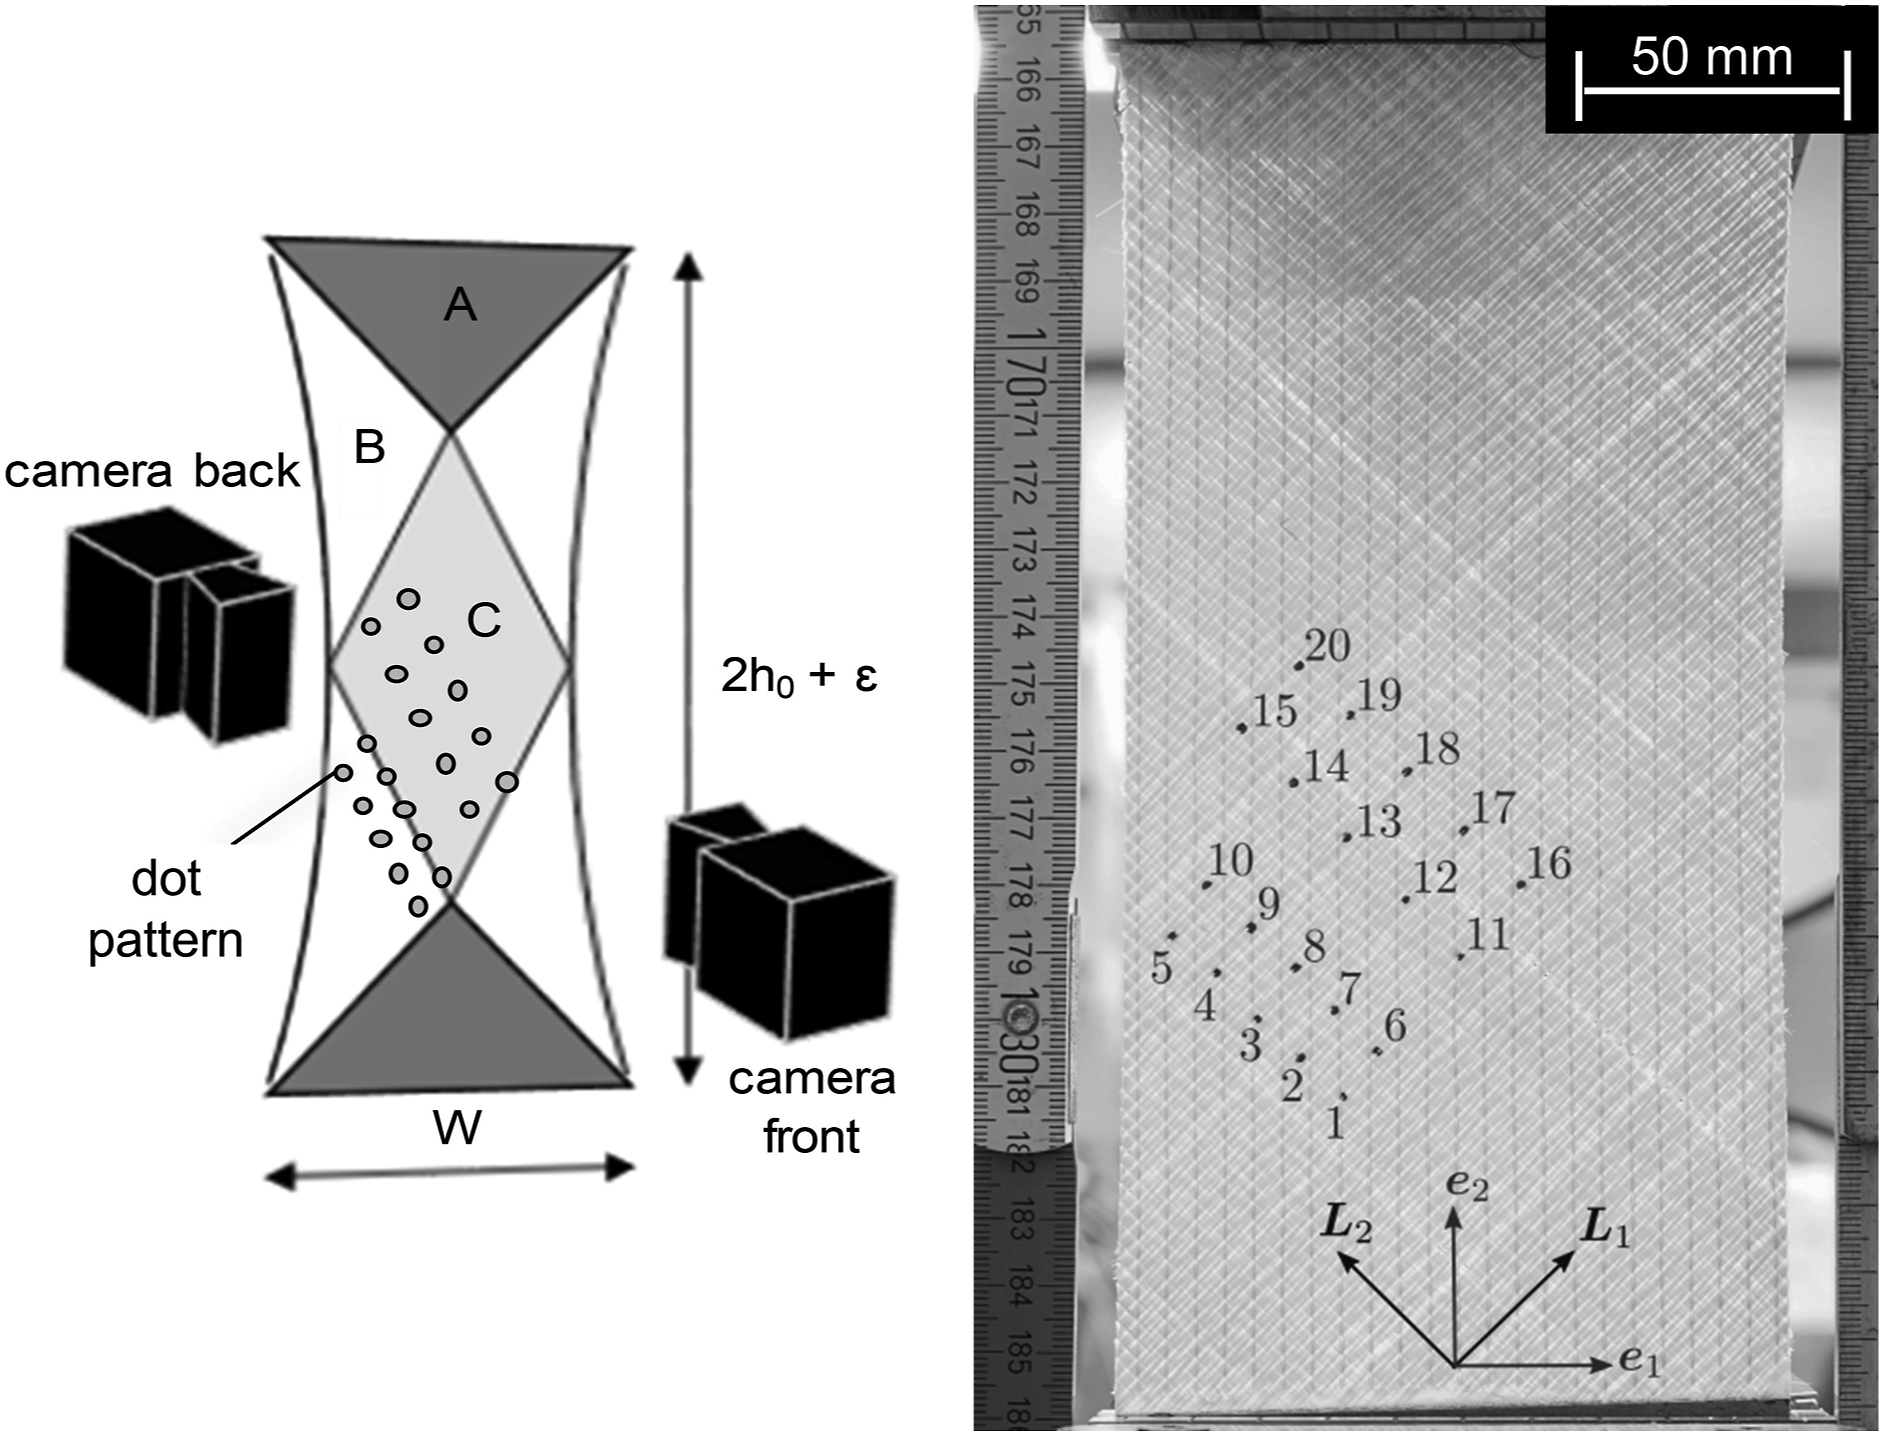
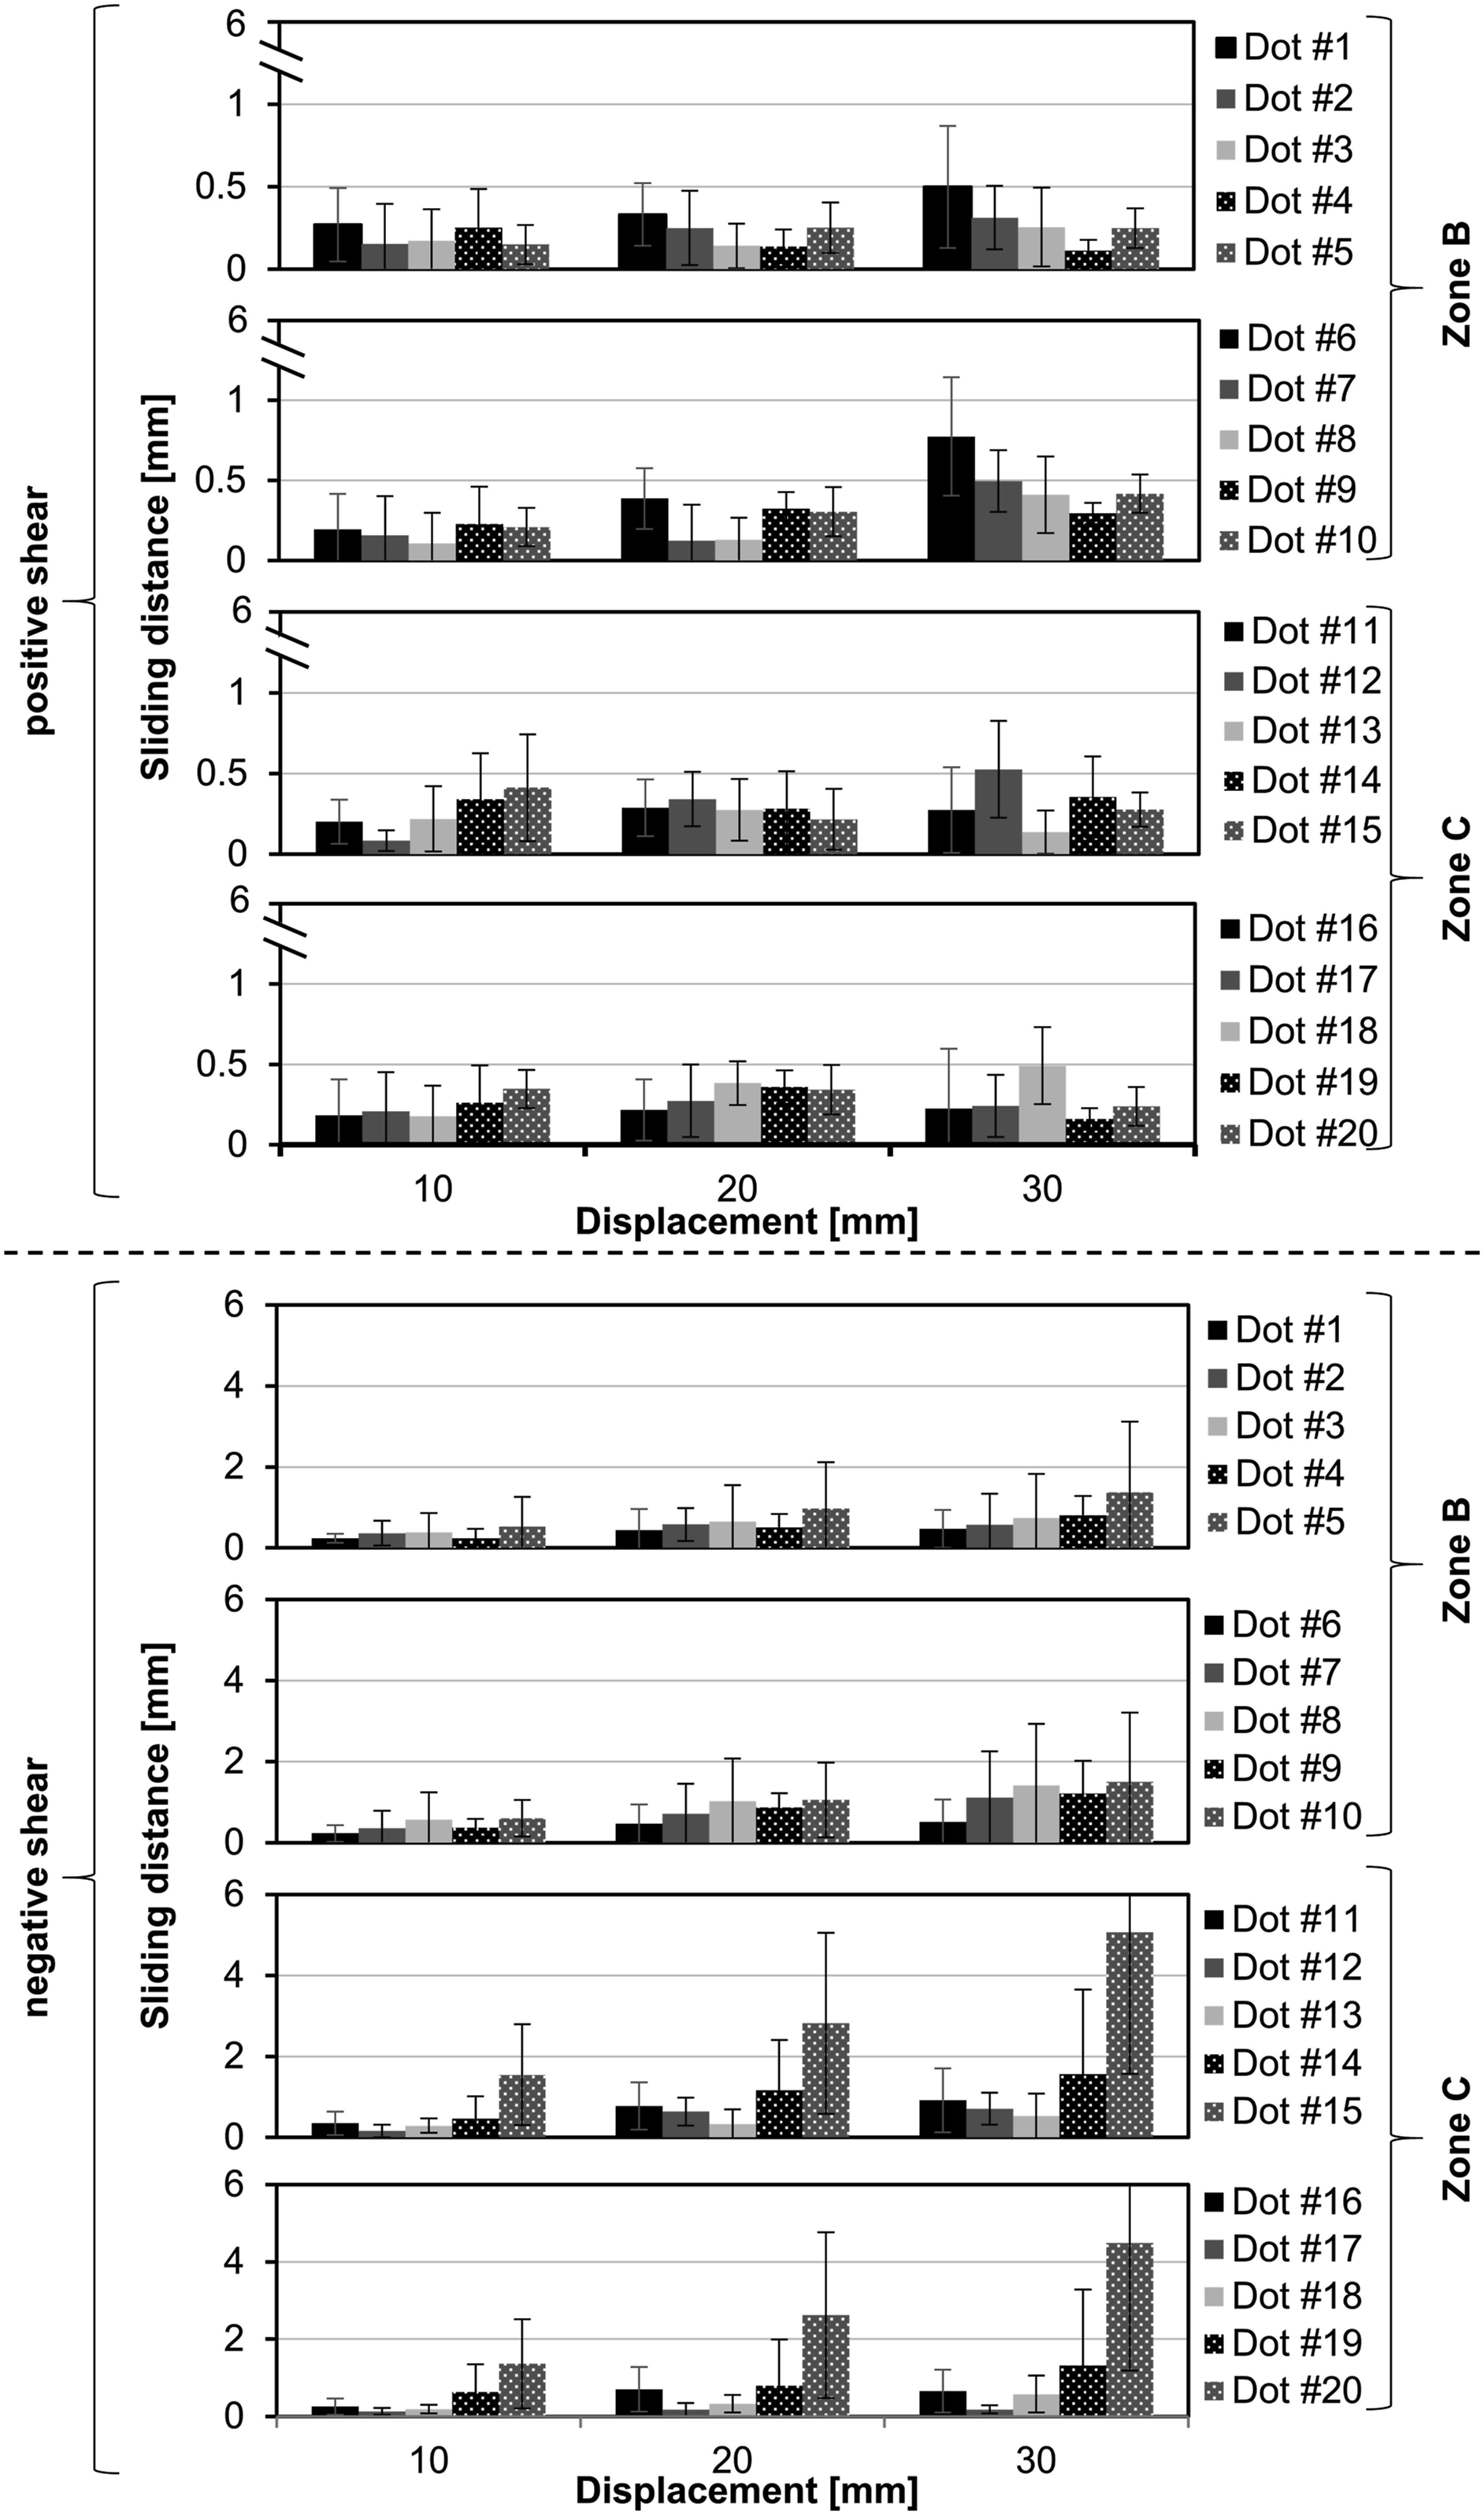
Figure 16 shows the inter-ply sliding vectors for all 20 dots obtained from the M3 samples. The data of inter-ply sliding distances at the dots are further shown in Figure 17. Under positive shear, the sliding starts from both zone B and C (see Figure 16). The order of magnitude of the sliding distance is comparable between both zones. I can also be observed, that the direction of sliding changes for some of the dots with increasing displacement. This can be attributed to measurement error due to out-of-plane deformation. Under negative shear loading, the primary direction of the sliding motion remains approximately the same with increasing deformation. It can also be seen, that the sliding in zone B (dots 1–10) is bigger compared to zone C excerpt for the dots close to the edge of the specimen (dots 15 & 20). Comparing the magnitude of the sliding distance during positive and negative shear, it can be observed that the sliding distance of some dots is much smaller during positive shear. This is due to the circumstance that the stitching yarn is under tension during positive shear. The stitch tension increases with increases displacement, thus pressing the layers together stronger compared to negative shear, where the stitching yarn is put under compression. Figure 17 shows, that the sliding distances generally increase with loading. Inter-ply sliding vectors for M3 under positive and negative shear. Inter-ply sliding for M3 during bias extension testing under positive (top) and negative shear (bottom) (error bars indicate standard deviation).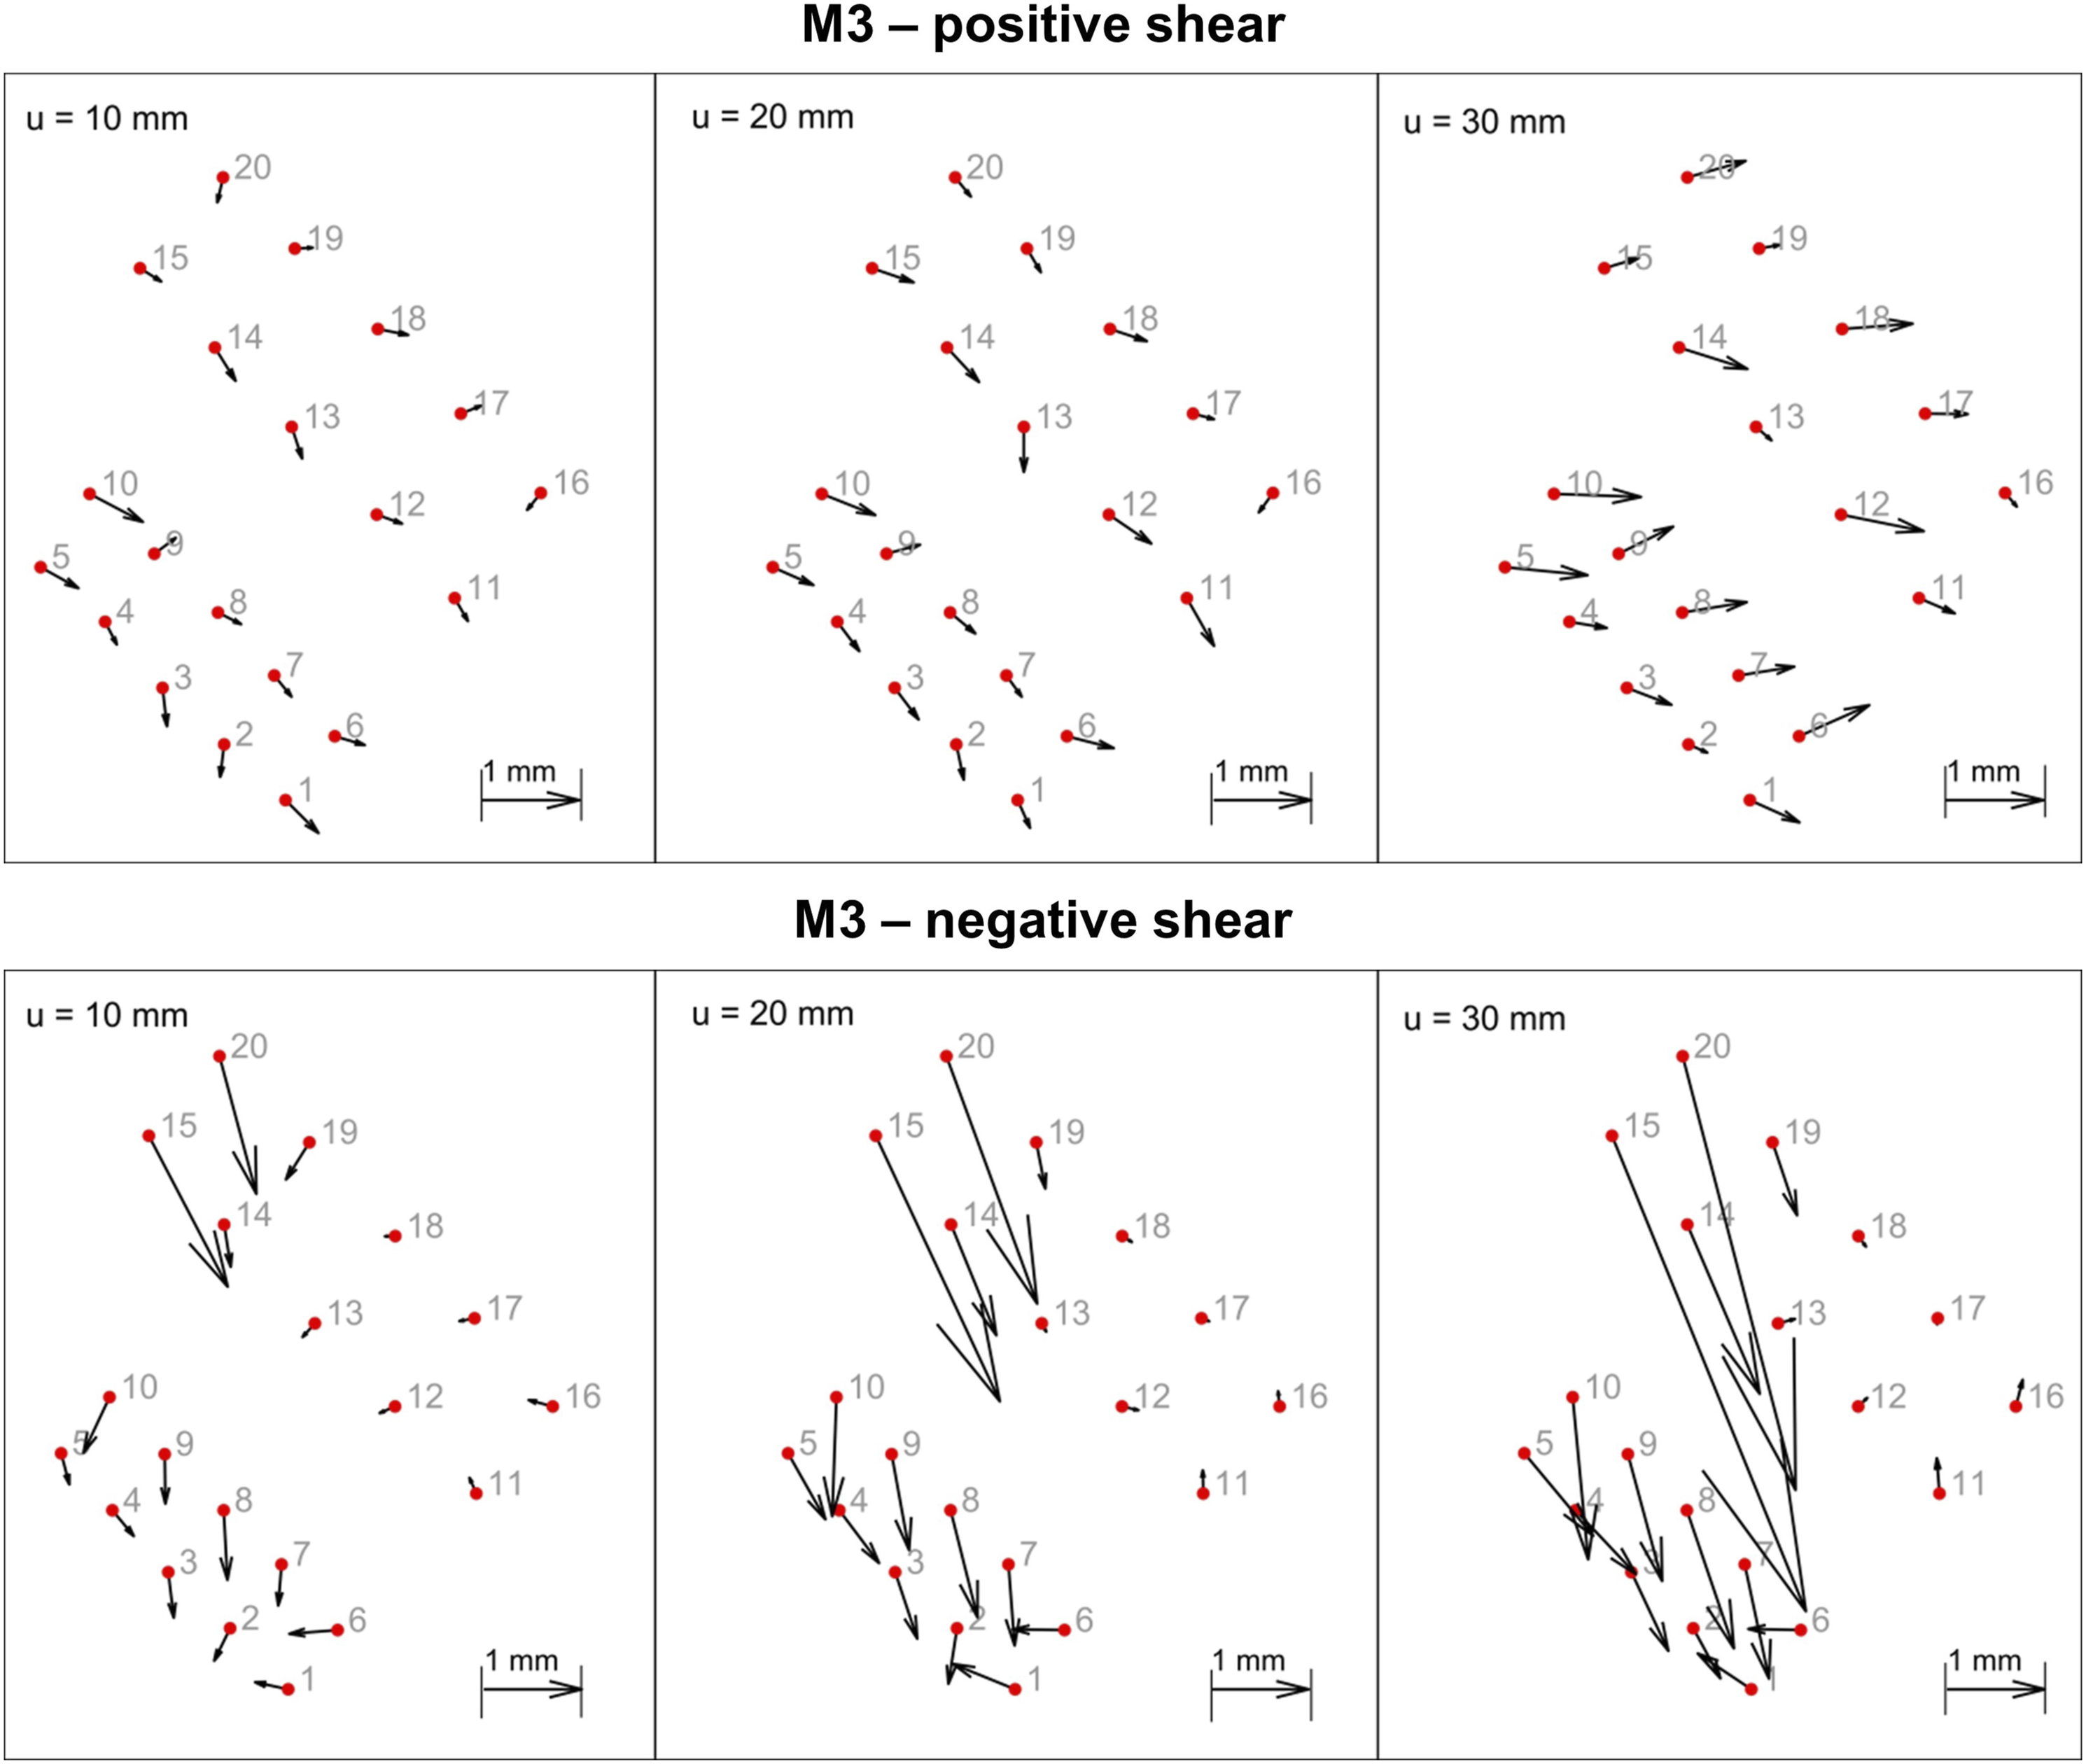
Picture frame test
Besides bias extension tests, picture frame tests were conducted in order to investigate the shear behaviour of NCFs. Figure 19 The picture frame setup is shown in Figure 18. The shear frame is mounted horizontally on a linear axis. It is connected to a universal testing machine 1455 by ZwickRoell GmbH & Co. KG (Ulm, Germany) with a 1kN Xforce HP force sensor by ZwickRoell GmbH & Co. KG (Ulm, Germany) via a pulley. The system friction can be determined in advance by running the picture frame empty. The friction of the system itself is subsequently subtracted from the measurements. The shear frame has a length of lPF = 300 mm. The test specimens have a size of 350 × 350 mm and have 100 × 100 mm cut-outs at all four corners. This results in a shear zone of 150 × 150 mm (bPF x bPF). A 50 mm/min speed of displacement is used. ±45° NCFs (M1-M4) were tested in both positive (pulling parallel to direction of stitch) and negative shear (pulling perpendicular to direction of stitch). Five repetitions were done for each configuration. Setup of picture frame tests. Results of picture frame test (error bars indicate standard deviation).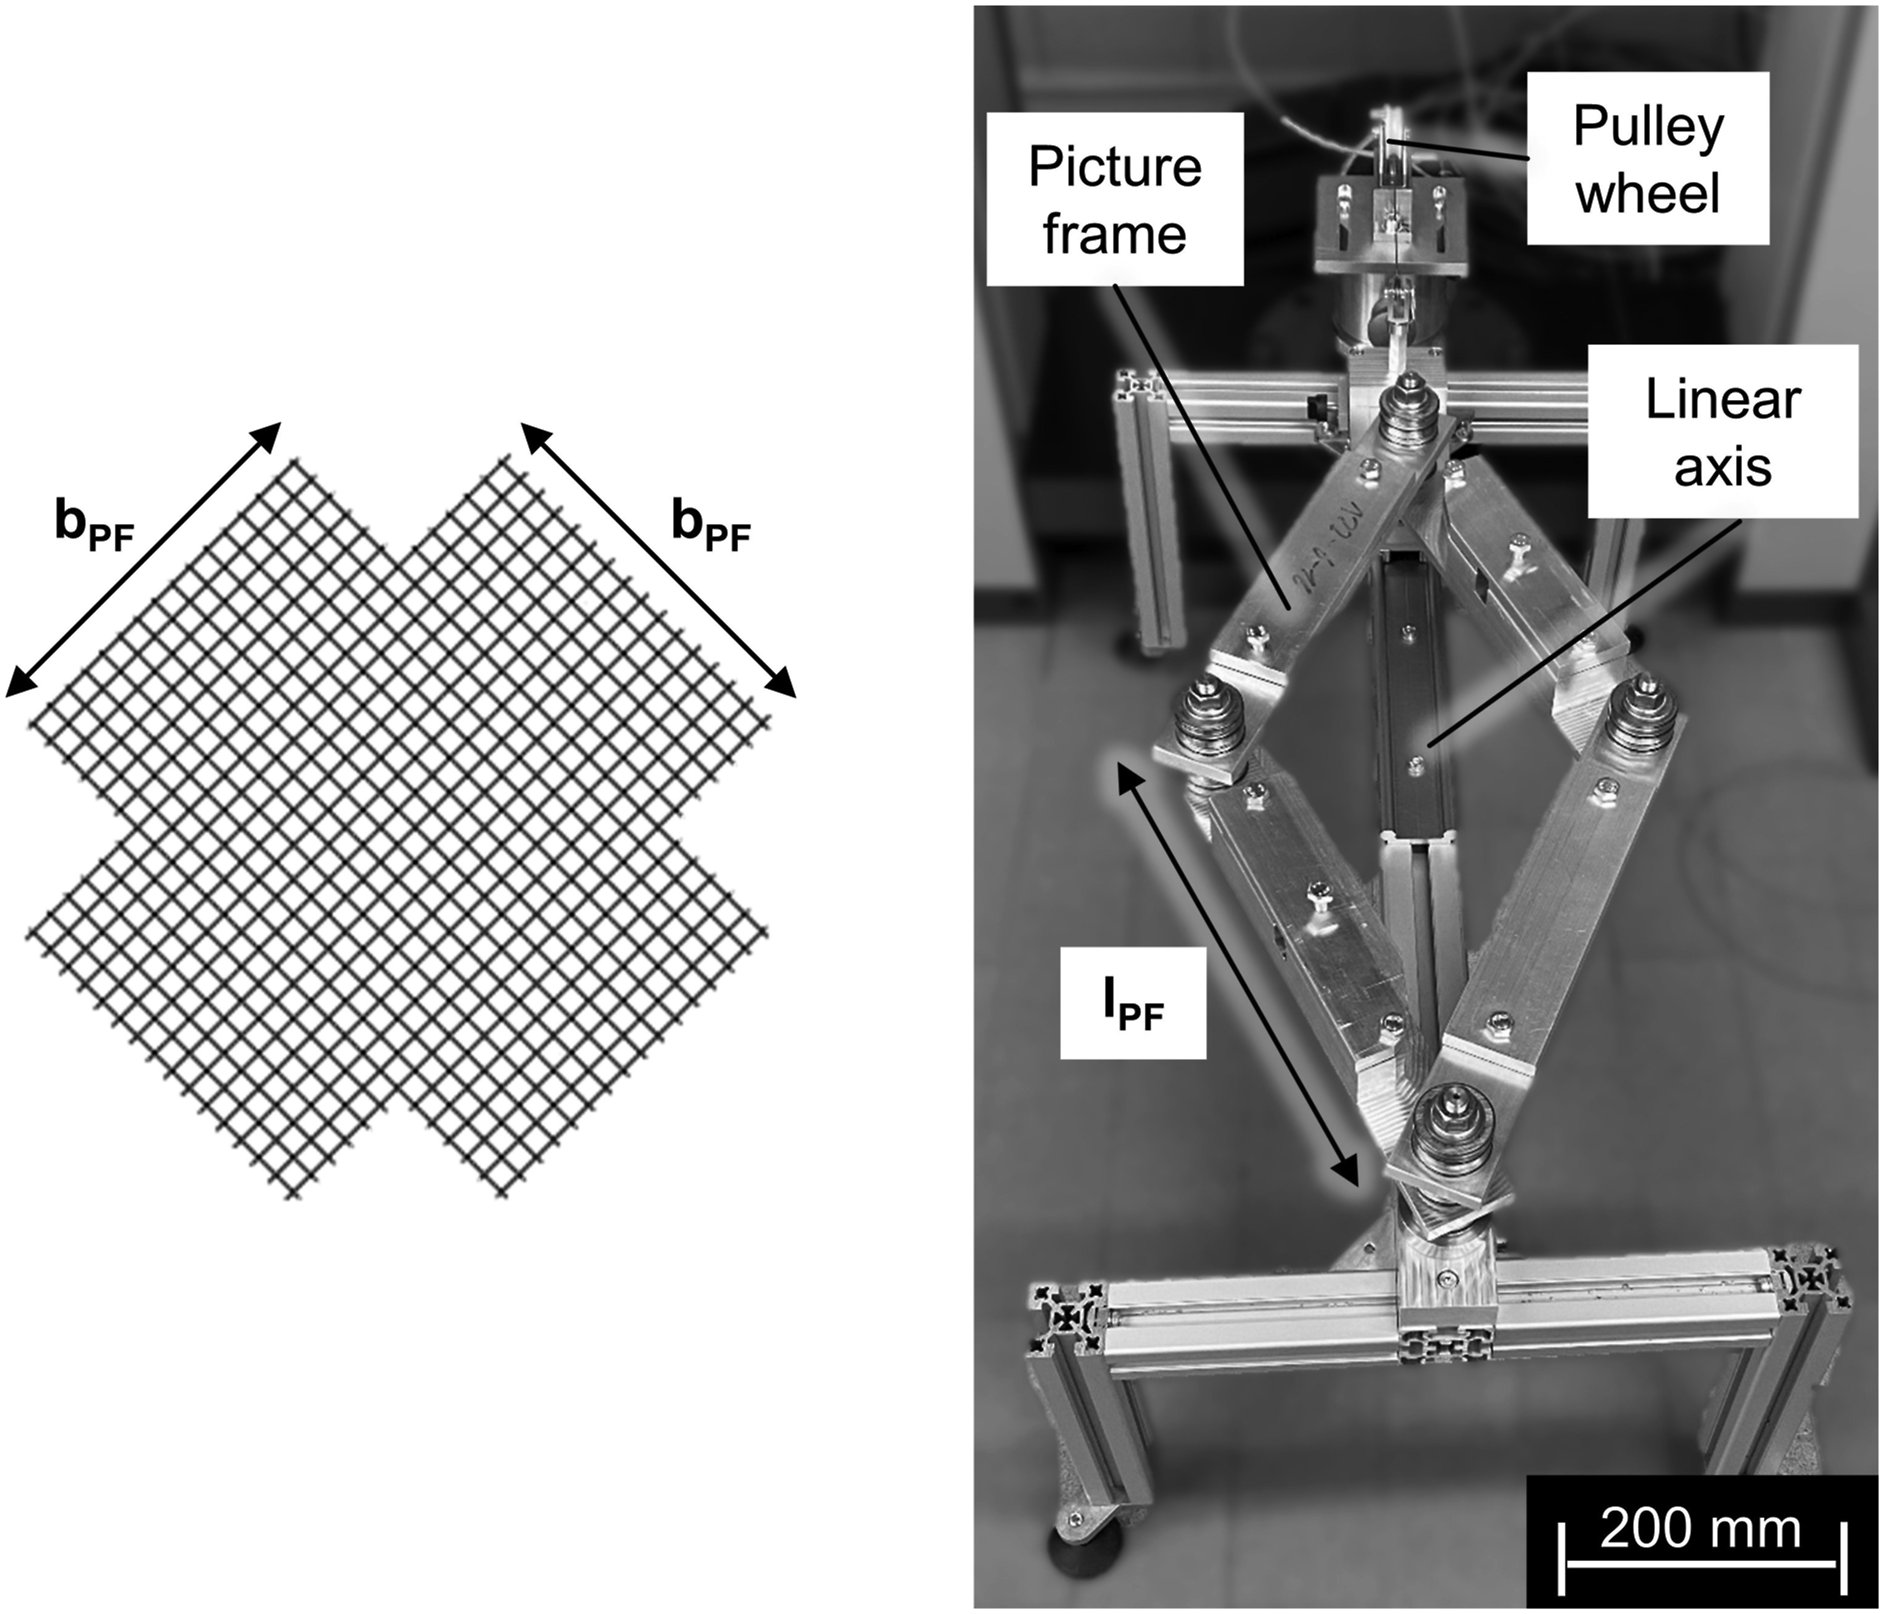
The results of the picture frame tests are shown in Figure 19. The shear angle γ can be calculated from the axial displacement by the following equation (3.4)
28
:
Here, F [N] is the measured axial force recorded by the testing machine subtracting the frictional force of the picture frame itself. The gradient of the force curves are steeper when testing in in positive shear direction. It can also be noted, that the standard deviation is higher under negative shear. With positive shear, the knitting threads are loaded in tension and thus contribute to the measured force. With negative shear, the stitching yarns are compressed. In this case, the stitching yarns do not contribute to the measured force, but lead to other phenomena such as friction or a slight disorientation of the rovings. This explains the higher forces and variation.4,16
Figure 19 also shows the critical shear angle (CSA). Since there is currently no uniform definition for the CSA,
26
it was calculated according to Souter.
27
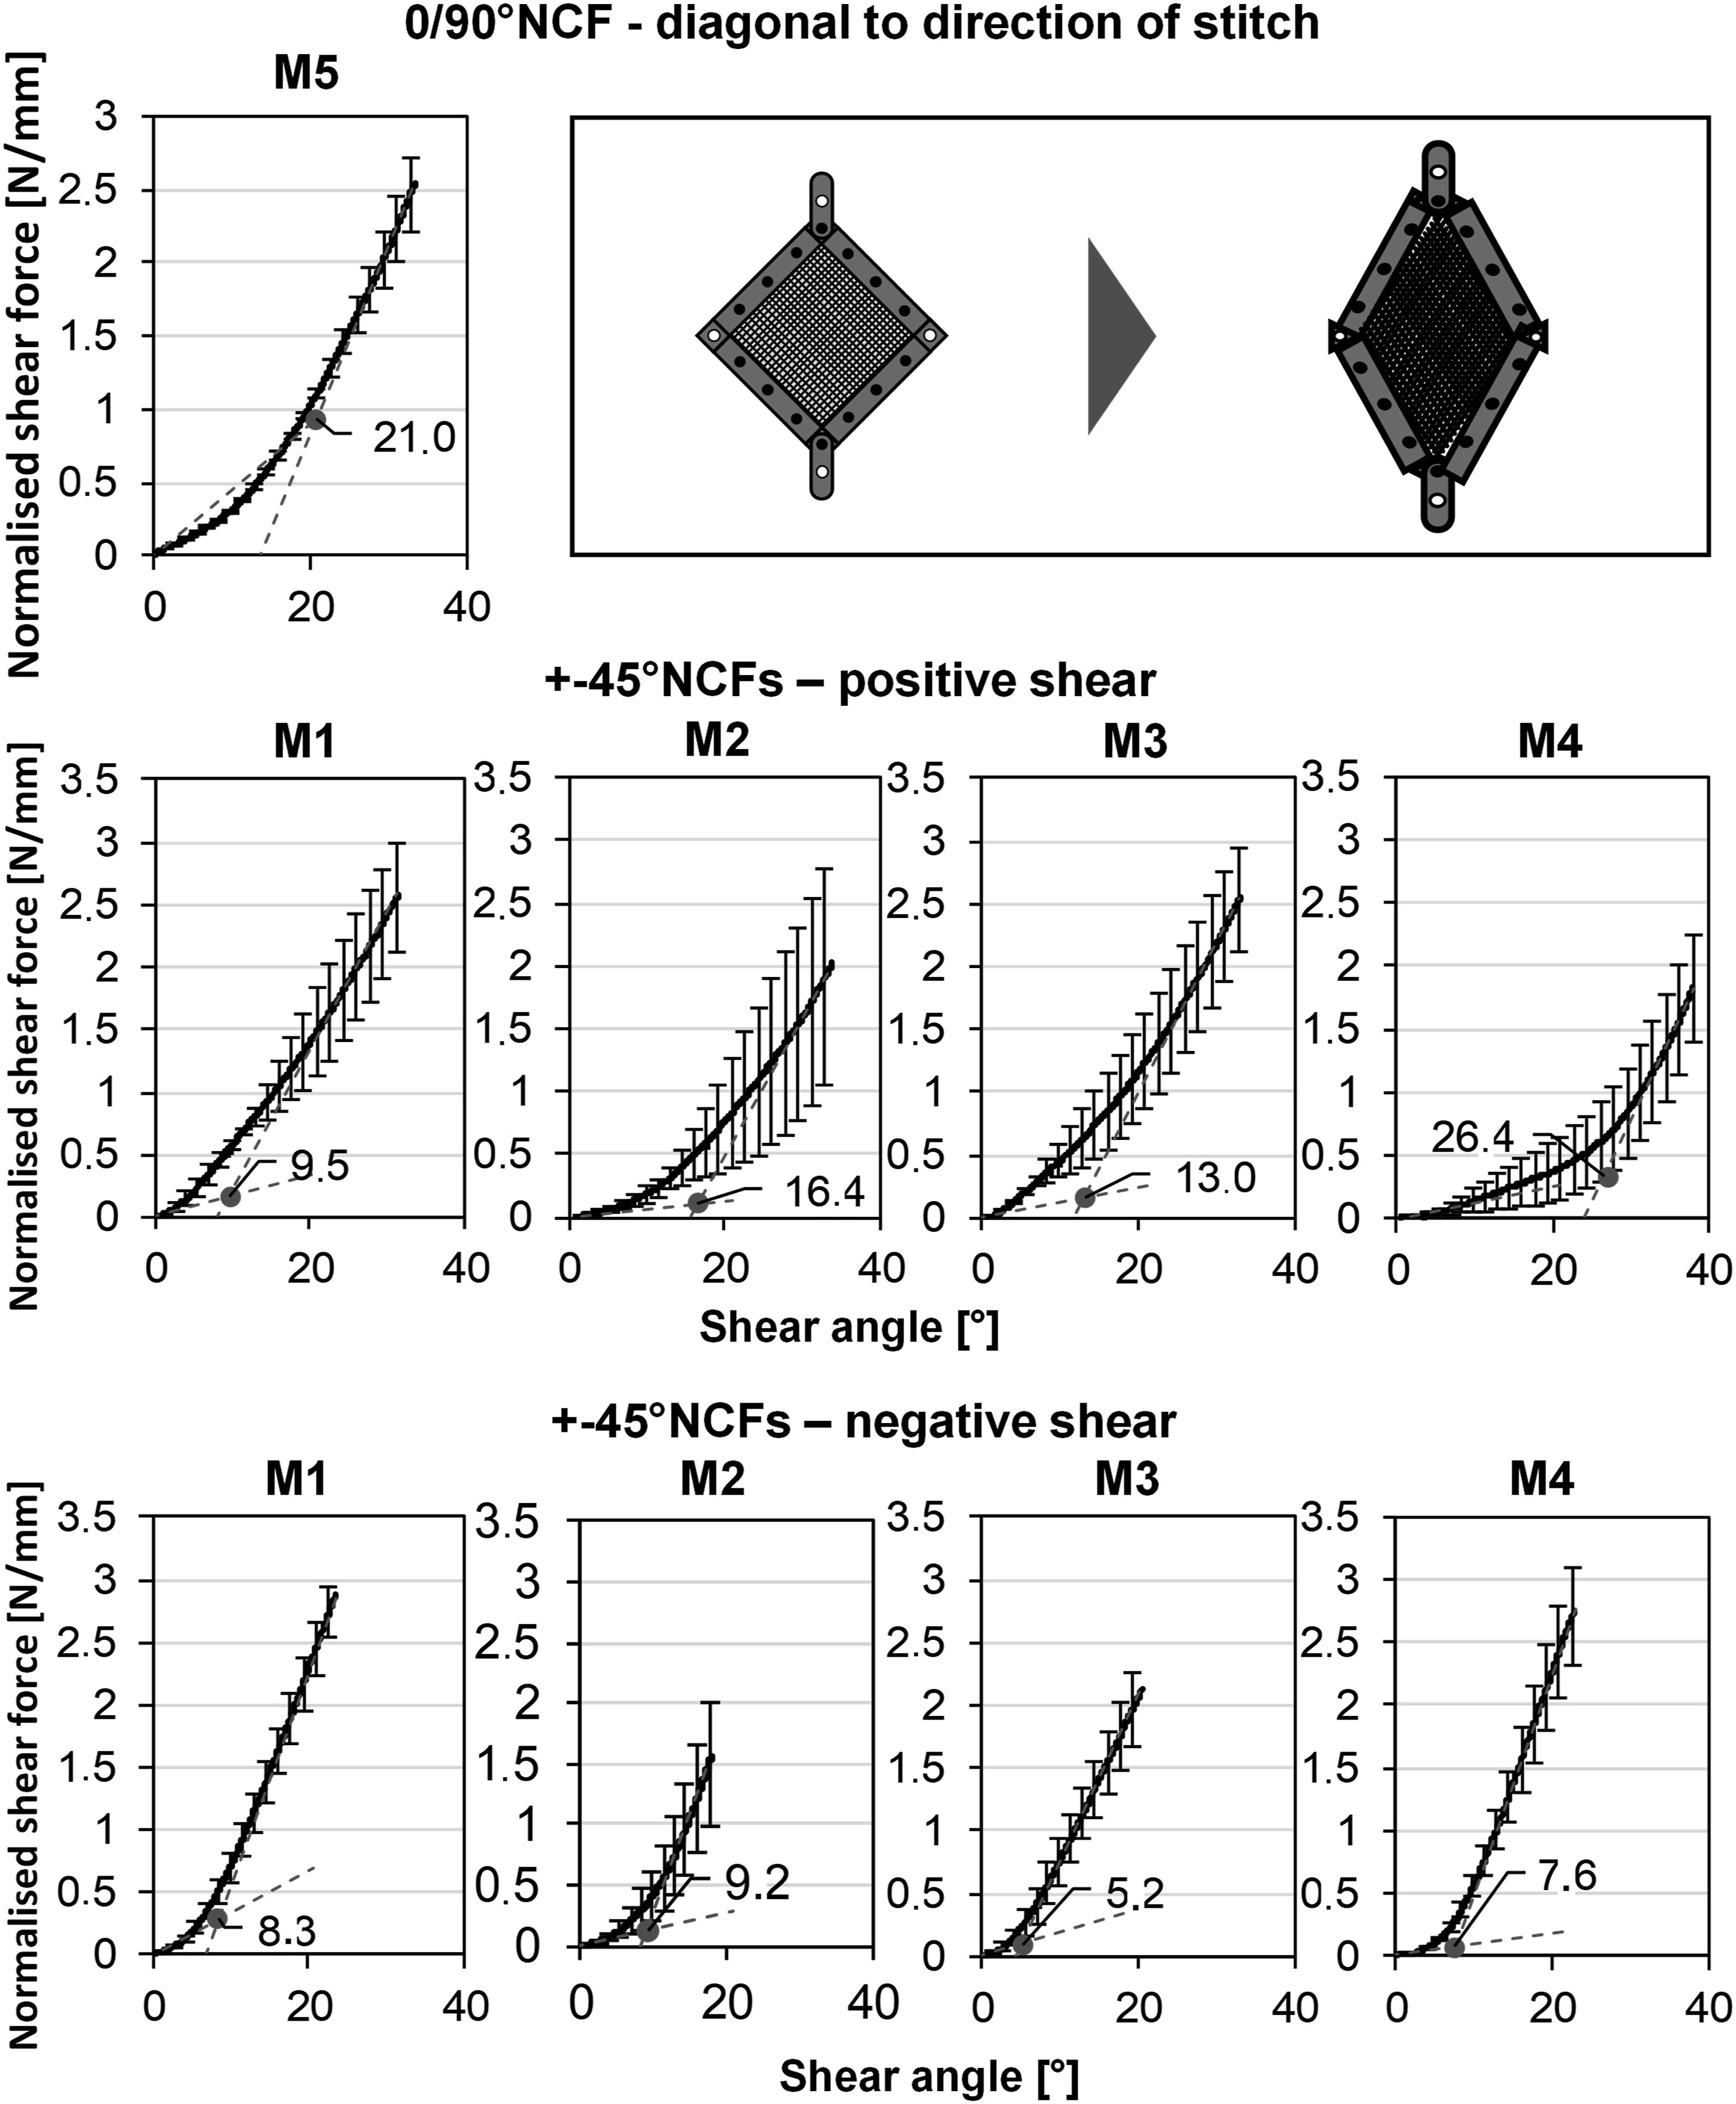
In this paper, a fitting of a linear regression to the first and last five degrees of force-shear angle data is described. The point at which both lines meet is defined as the critical shear angle. However, the initial gradient of the first five degrees of force-shear angle data is not linear within the trials. Figure 20 shows exemplarily for M3 and M5 that the force-shear angle data is approximately linear only up to a shear deformation of around 1°. Therefore, the limits based on which the initial gradient is calculated, are individually adjusted for each trial so that only the initial, linear increase of the force curve is fitted. For the calculation of the gradient at the end of the curve, the last five degrees of shear deformation (as suggested by Souter) are used, since the curve in this area of the measurement is approximately linear. Initial gradient of the normalised shear force over the shear angle of the picture frame tests: a) M3 under positive shear, b) M3 under negative shear, c) M5 (error bars indicate standard deviation).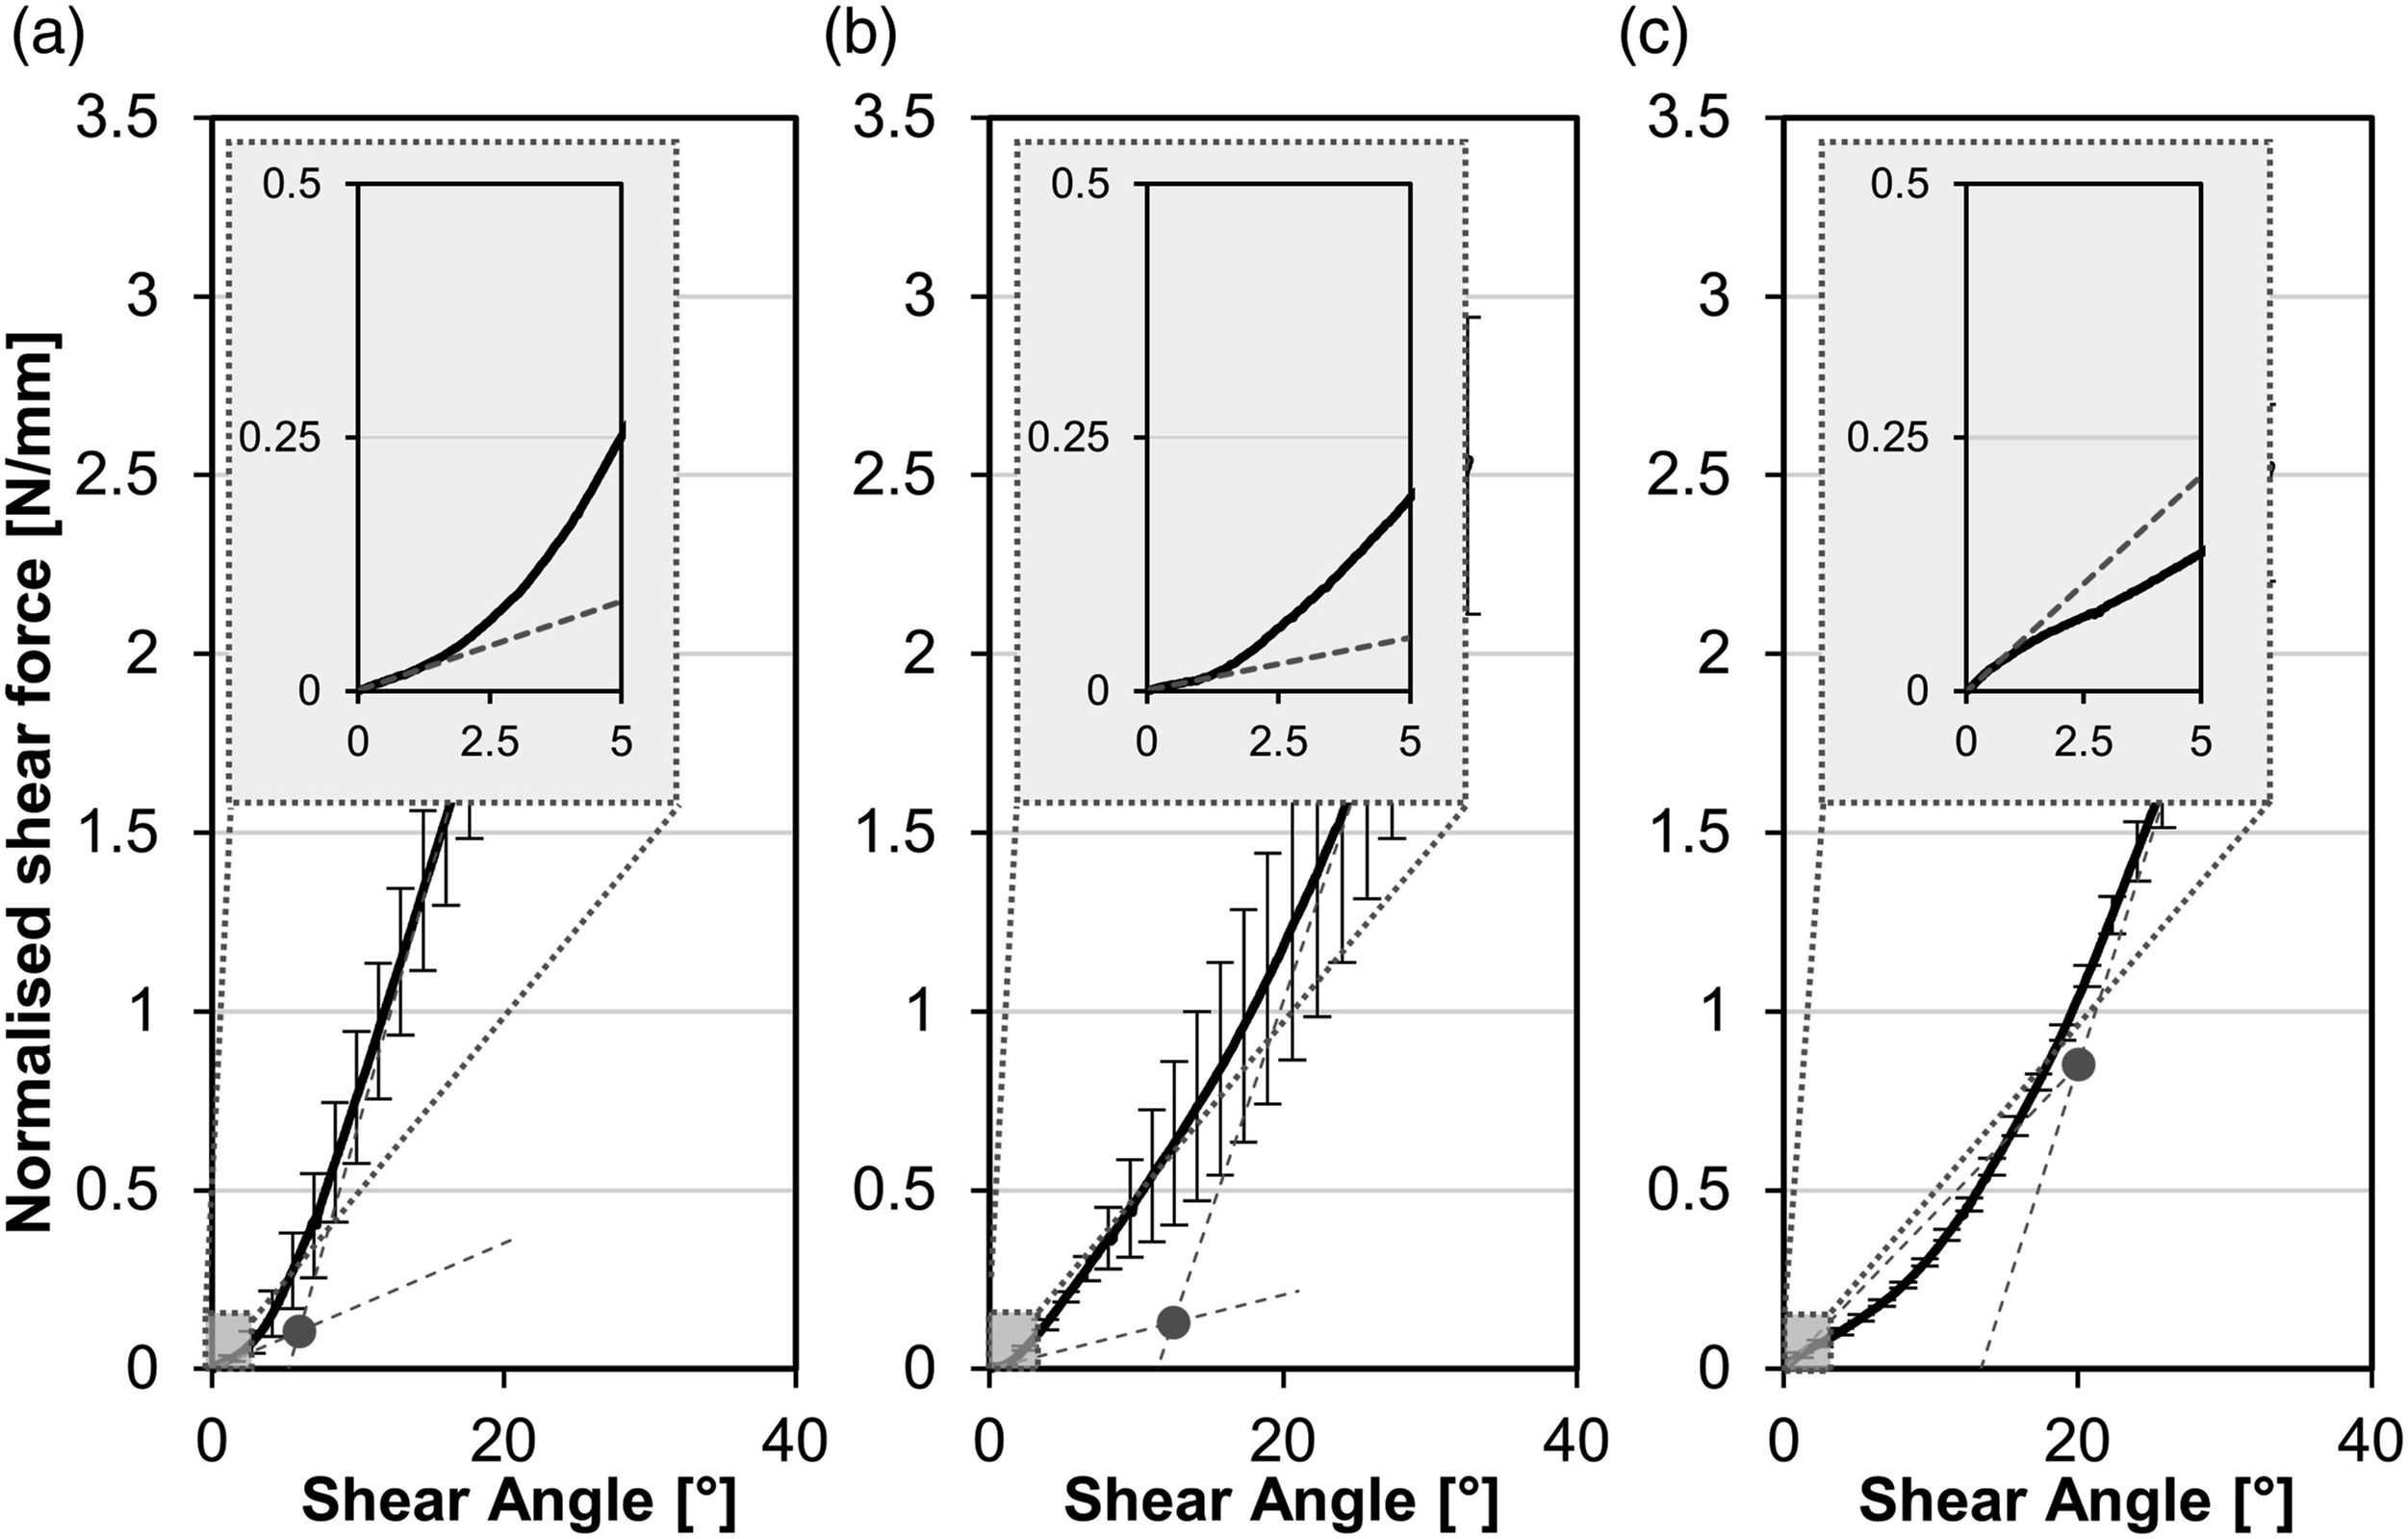
Figure 21 shows the CSA and the corresponding force at the CSA for all tested NCFs. Despite high variations, a statistical significance can be derived for the stitch tension and the testing direction (p-Value < 0.01, confidence interval 99%). Materials with higher stitch tension (M1 and M3) show lower values of CSA than their counterparts (M2 and M4) in both positive and negative shear. Additionally, the CSA is generally lower under positive shear. This can be explained by the fact that with increasing shear in the positive direction, the knitting yarn is subjected to tensile stress and thus the knitting yarn tension increases. The increasing tension makes roving rotation more difficult, which leads to earlier interlocking of the rovings and forces increase more rapidly with further shear deformation. Critical shear angle and corresponding force (error bars indicate standard deviation).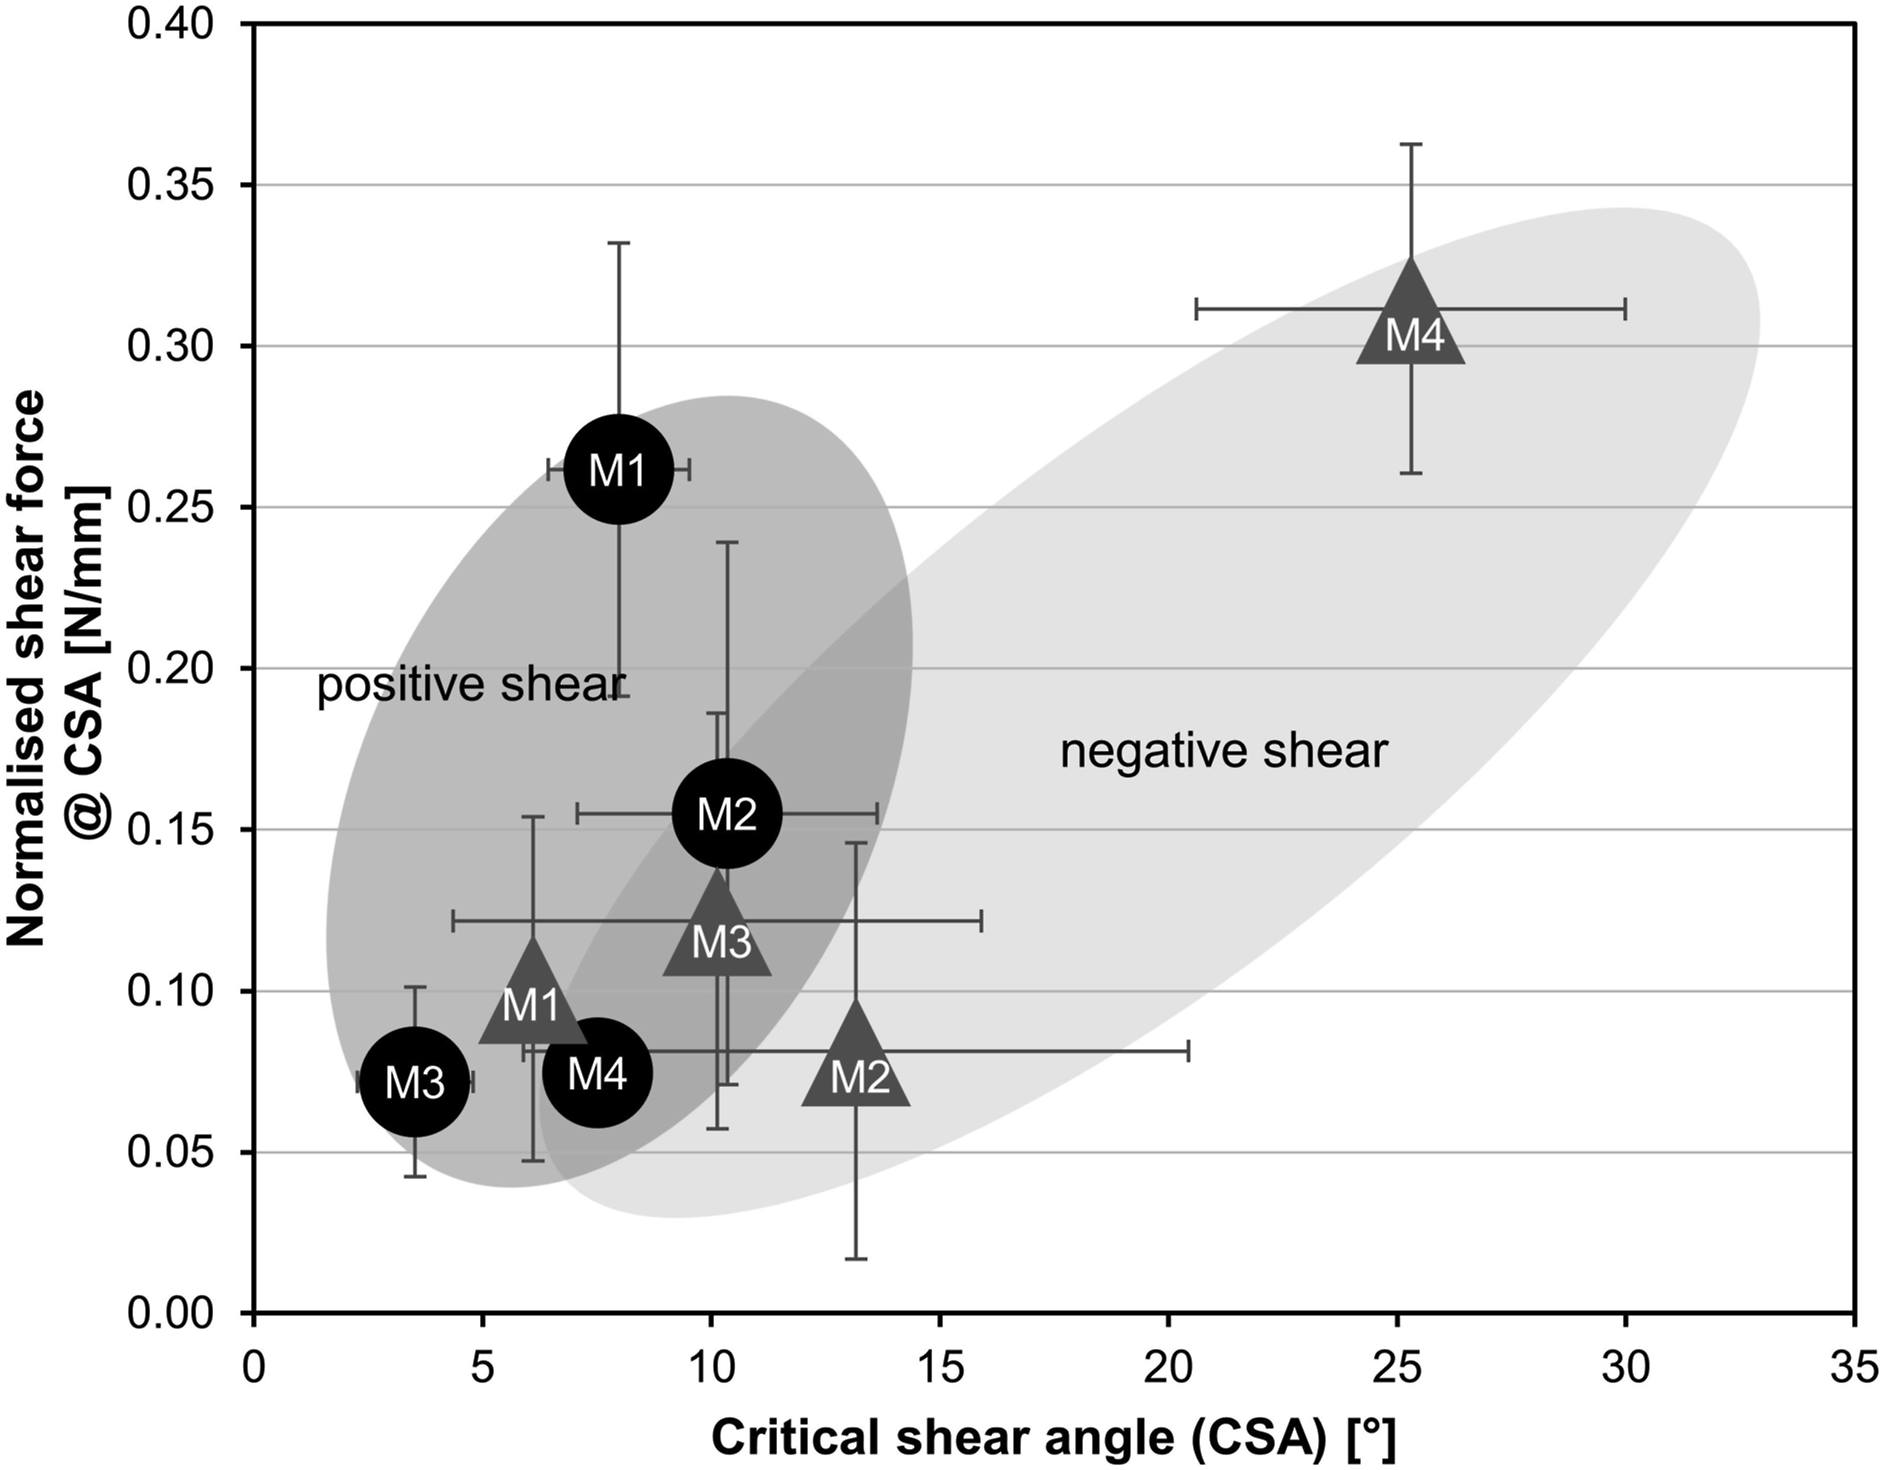
The stitch length was not found to be statistically significant. However, there is a significant interaction between the testing direction and stitch length. Materials with lower stitch length (M1, M2) show higher CSA than their counterparts (M3, M4) under positive shear. Under negative shear, this effect is reversed. For the corresponding force at CSA no statistically significant main effect was identified. However, the interaction between stitch tension and testing direction, as well as the interaction between stitch length and testing direction are significant regarding the normalised shear force at CSA. Under positive shear, the shorter stitch length (2 mm, M1 and M2) exhibit higher forces compared to their counterparts (3 mm, M3 and M4). This is not the case for negative shear.
Comparing the range of the CSAs with values from literature, 4 where the CSAs has been determined by unidirectional bias extension test under positive shear for similar NCF materials, the CSAs found here are around 25 – 50% lower. Therefore, the difference between picture frame and bias extension results have been investigated further.
Comparison between bias extension and picture frame test
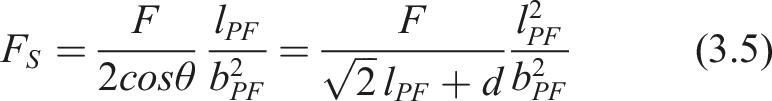
Previous sections show that the reaction force in the case of bias extension is much smaller than that in the picture frame test. Thus, the characterisation requires further analysis to understand and quantify the underlying mechanism of the bias extension tests. The normalised shear forces FS [N/mm] of the bias extension test are calculated by equation (3.6)
28
and compared with the corresponding values from the picture frame test in positive and negative shear (Figure 22). Only results of sample M3 are shown for the purpose of illustration. Normalised shear forces in bias extension and picture frame test under positive (left) and negative (right) shear of M3.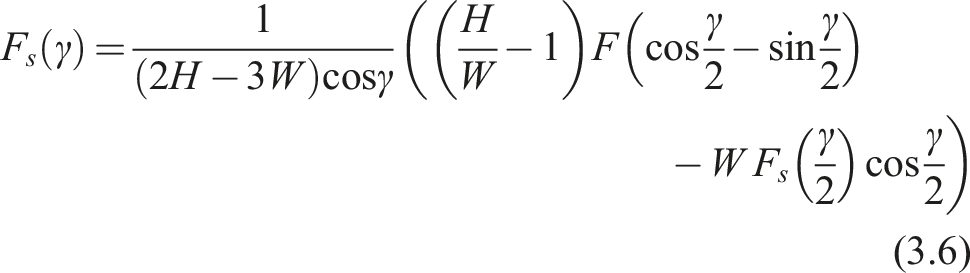
H [mm] and W [mm] are the height and the width of the bias extension sample, respectively. F is axial force recorded by the testing machine The theoretical shear angle is calculated from the displacement via equation (3.4). However, for bias extension test
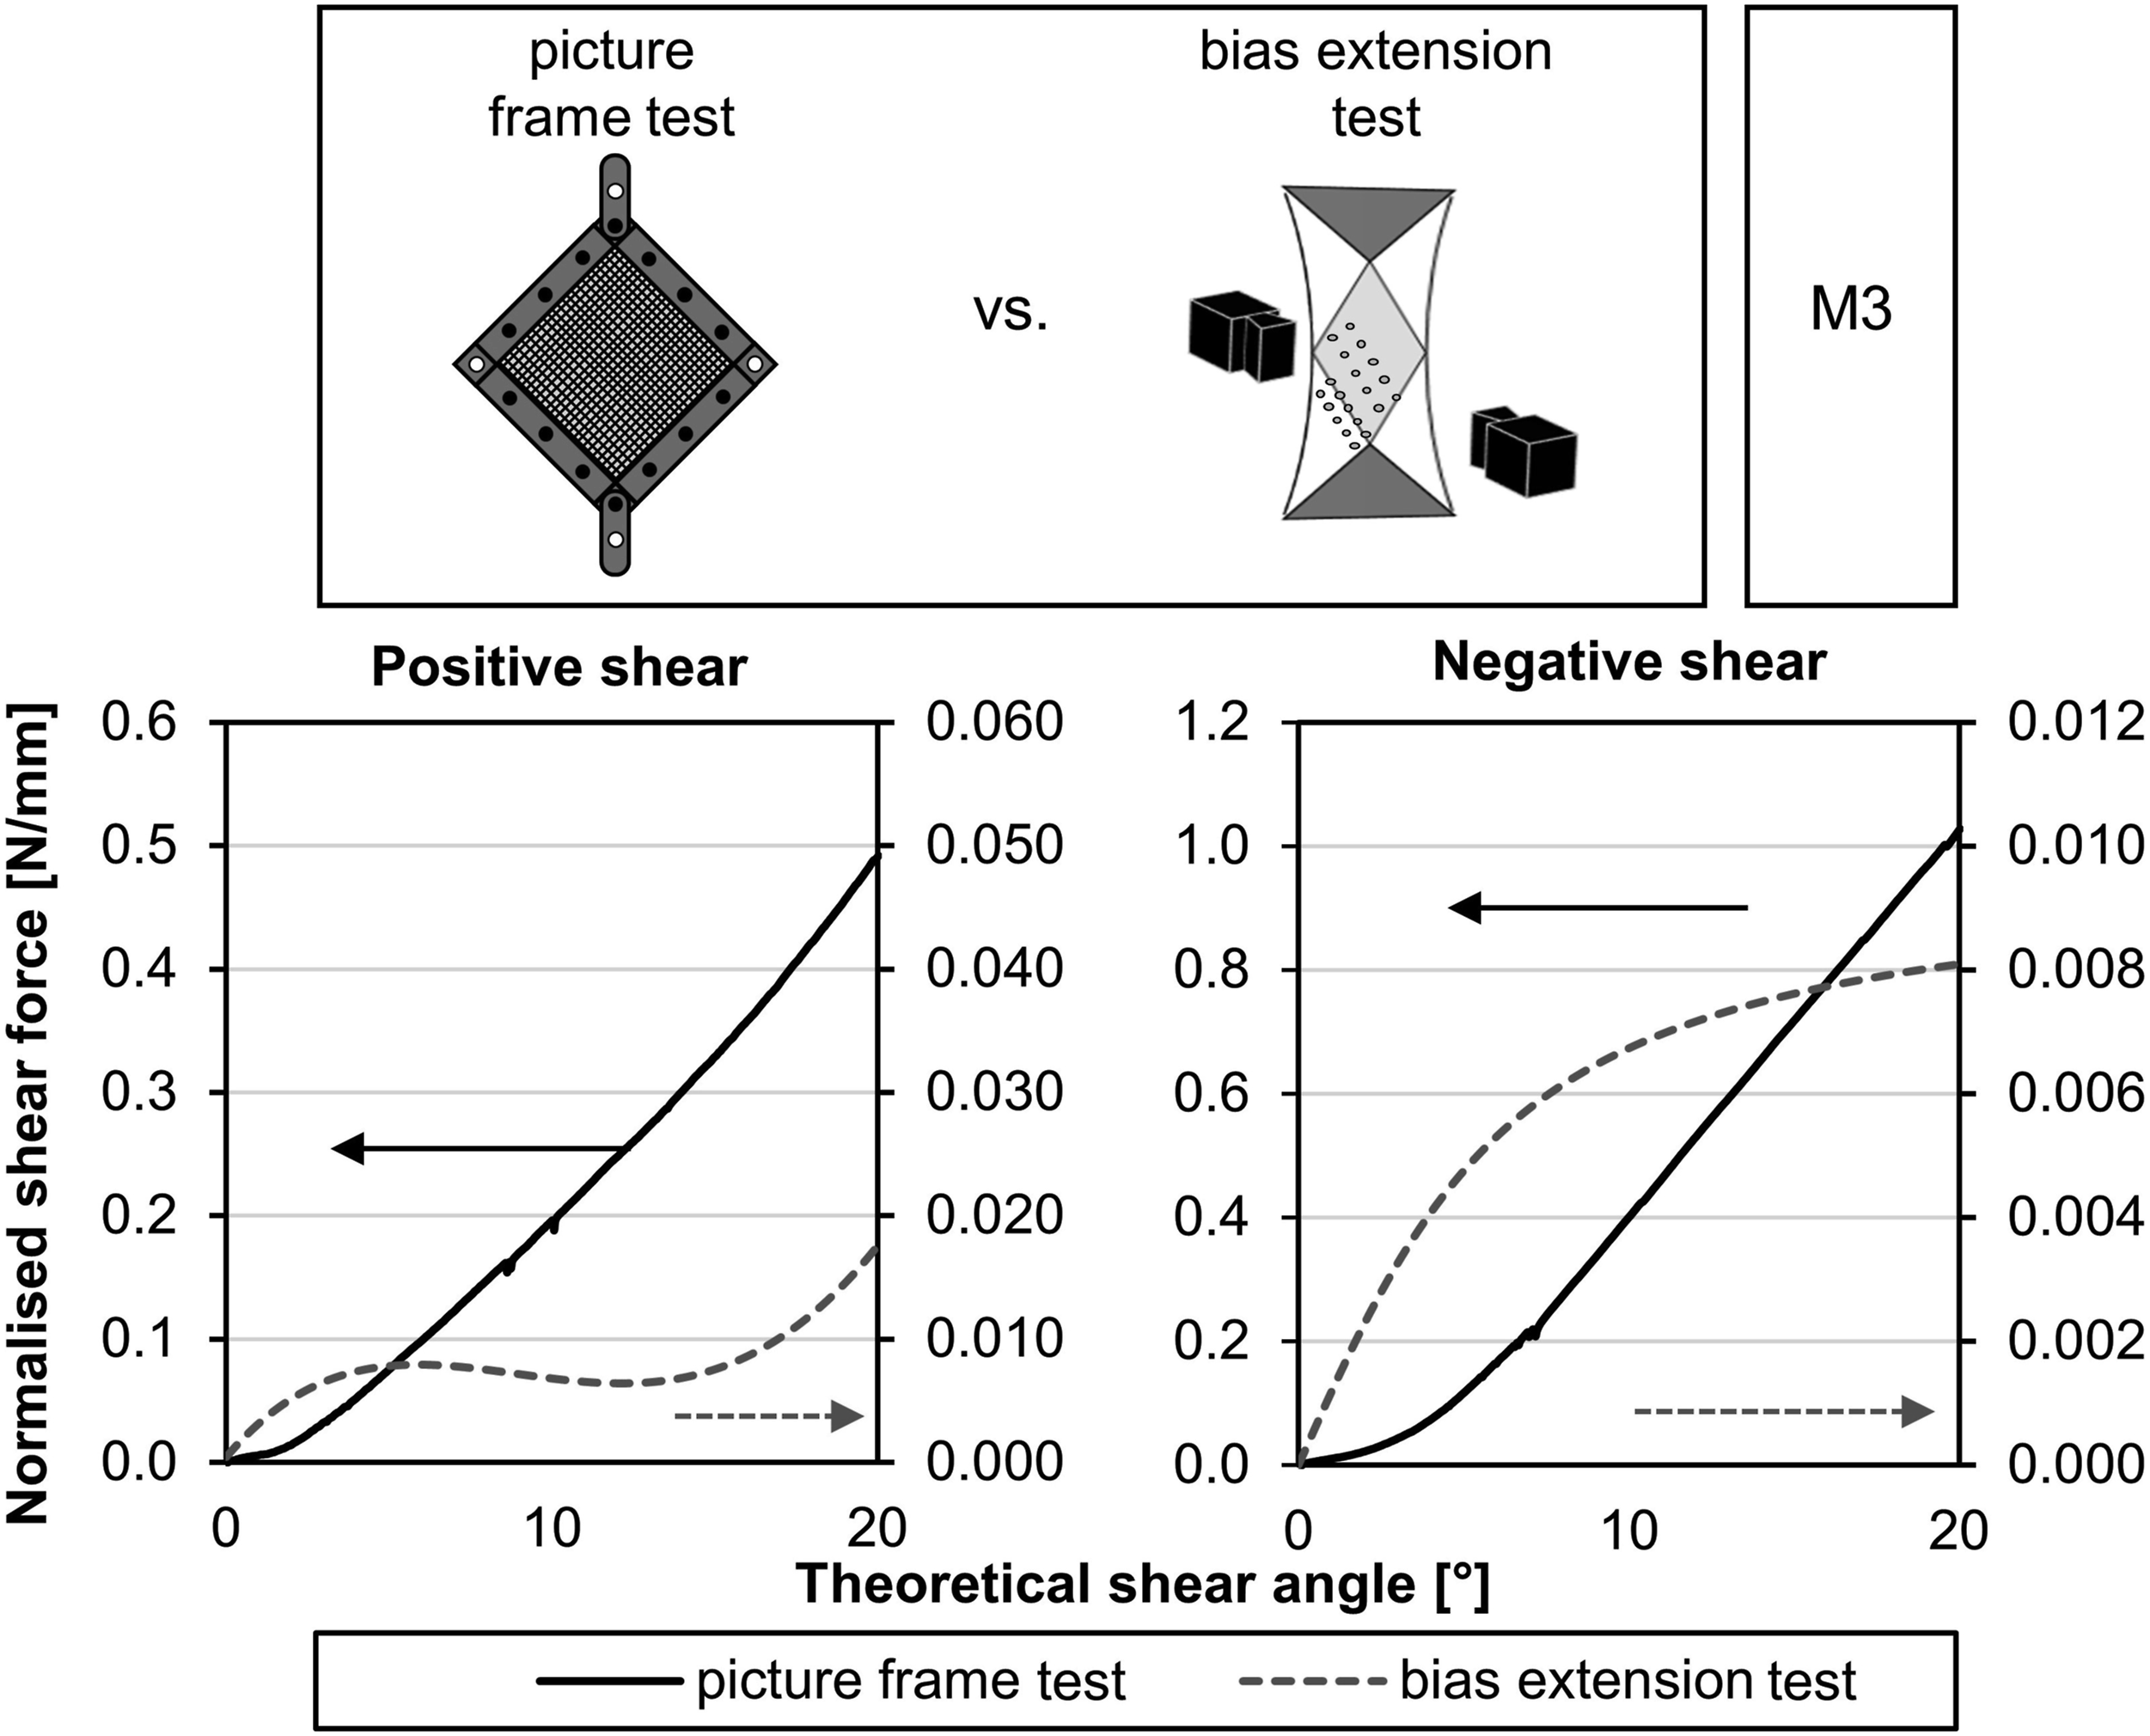
To analyse the source of plasticity, the optical shear angles are calculated from the images taken during the bias extension test (see section 3.5.1). In Figure 23 the difference between the optical and theoretical shear angle
28
in the C region (see Figure 13) are plotted versus the global displacement. It can be seen that there is a large deviation between the optical and theoretical shear angles, which indicates large sliding
10
between the weft and warp fibres. The sliding increases with deformation so that the shear angle and therefore the normalised shear force remain small. Deviation between optically measured shear angle and theoretical value versus applied displacement (error bars indicate standard deviation).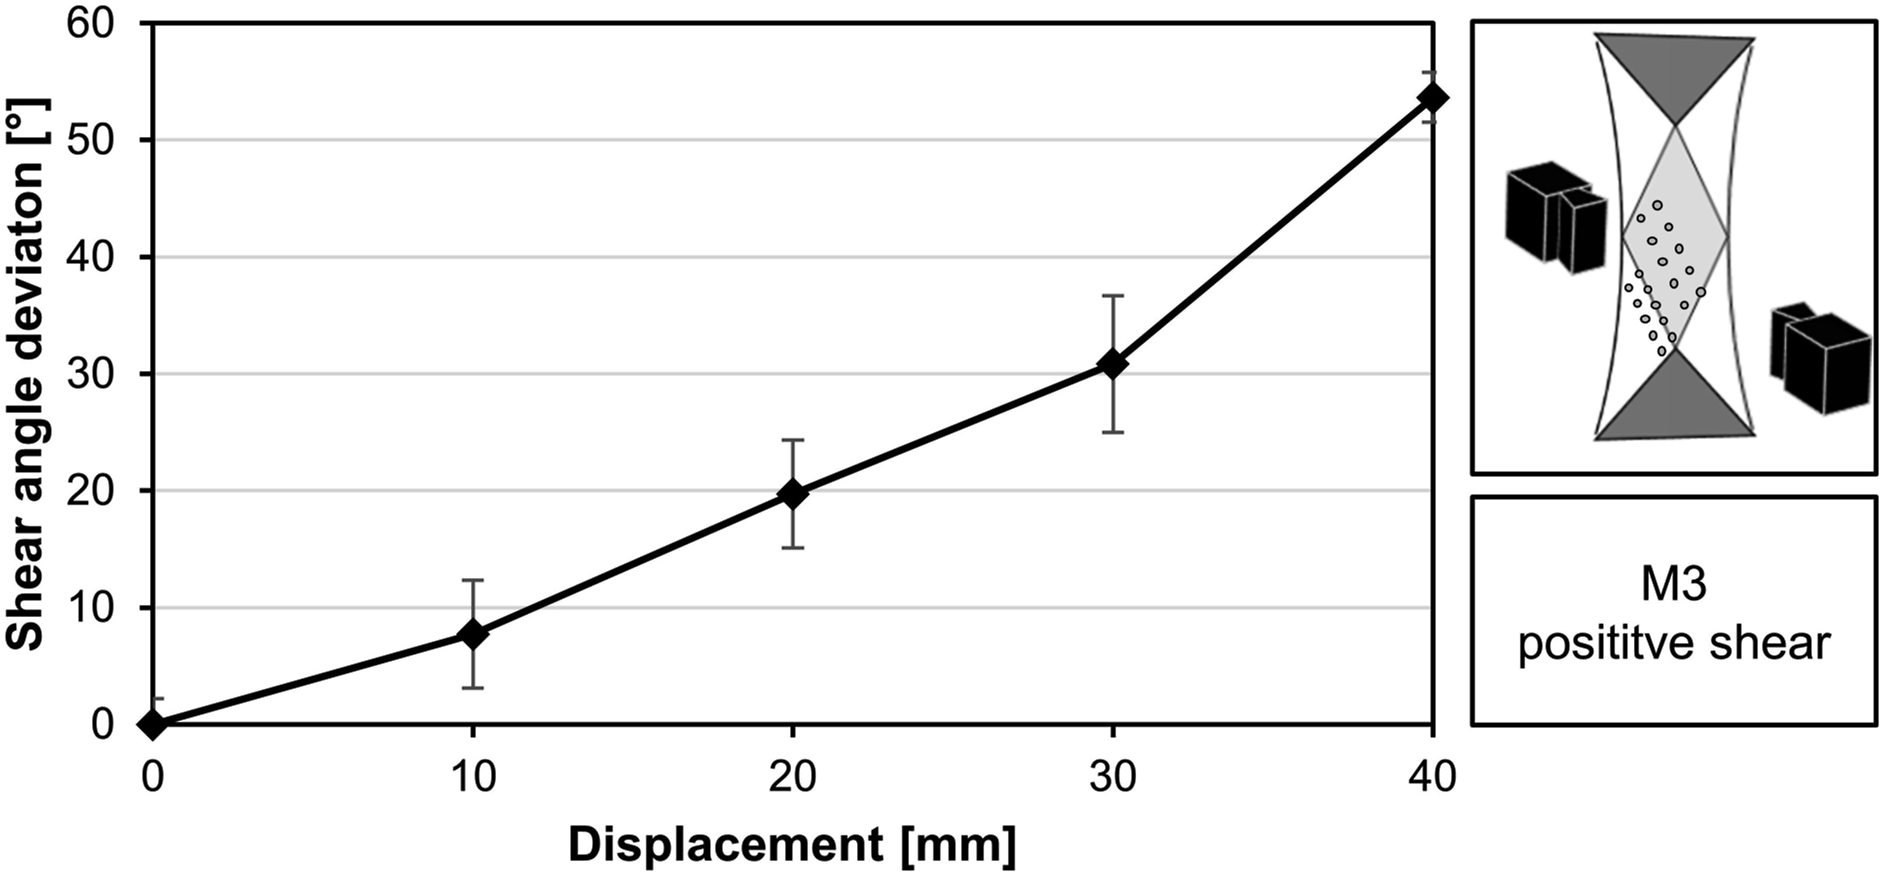
Indeed, by replacing the theoretical shear angle by the optically measured value in equation (3.6), the normalised shear force can be plotted versus the optically measured shear angle (see Figure 24 left). One can observe that before sliding takes place, the in-plane shear response of picture frame and bias extension are almost identical. The deviation between the two tests becomes larger with increasing sliding. Furthermore, by calculating the difference between the energies of deformation (the area under the normalized shear force), one can quantify the dissipated energy due to both inter- and intra-sliding (see Figure 24 right), which has not been available in the literature yet. It is seen that the sliding only takes place after certain deformation (at optical shear angle of 2°). When deformation exceeds the onset of sliding, the dissipated energy increases dramatically. Left: Normalised shear forces in bias extension and picture frame test under positive shear of the sample M3, Right: Dissipated energy due to fibre sliding.
Draping tests on double dome geometry
Drape tests are carried out on a double dome geometry to validate the simulation model. This geometry has already been used in multiple studies.7,11,13,29–31 The measured variables are the shear angle distribution and strains resulting from the draping process. Additionally, the occurring draping defects are recorded by means of an optical evaluation. The following evaluation only refers to the materials M1 to M4 since M5 showed severe wrinkling during draping. The wrinkles covered some of the measuring dots, so that no reliable shear angles could be calculated by the system. Three drape tests are carried out for each material using the following test procedure (see Figure 25): Procedure of the drape test.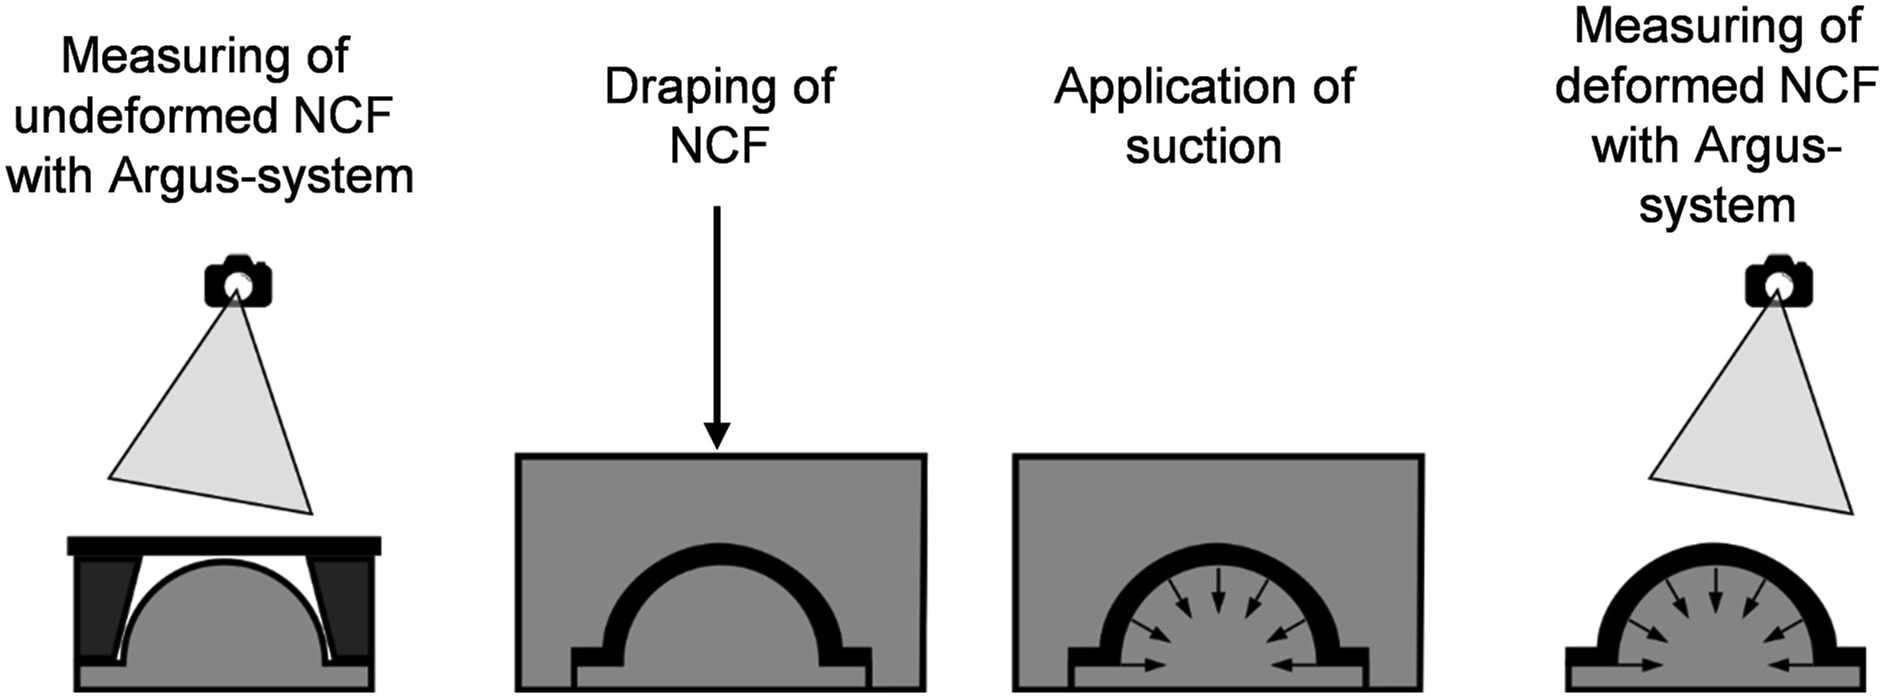
First, rectangular and undeformed NCF sheets are placed between a negative and a positive drape mould. These sheets have a size of 500 mm x 300 mm and were positioned in such a way that the fibre orientation was +/− 45° to the longitudinal axis of the drape mould. A robot then presses the negative mould onto the positive mould. With the mould closed, the textiles are fixed onto the positive mould via suction, which is applied through small holes inside the positive mould. The negative mould is then lifted off the positive mould and the measurements are performed.
The optical measuring system Argus of the company GOM GmbH (Braunschweig, Germany) is used for the measurements. For this purpose, a regular pattern of reference dots is applied to the undeformed textiles (quadratic pattern, 10 × 10 mm). The reference dots are recorded using a digital camera before and after deformation. Images are taken from all perspectives of the measured object in both deformation states. Using a set of fixed reference dots, the Argus software then creates a 3D model from the images and calculate the shear angle and strain. After deformation, the system references the change in the original 90° angle of the grid arrangement that results from the shear deformation. The shear angle of the NCF is thus homogenised over the given element (grid) size. In the context of the test evaluation a positive shear angle implies a deformation transverse to the fibre direction.
Figure 26 shows the distribution of the measured shear angles on the surface of the test specimens. One representative measurement result is shown for each material type, as all shear angle measurements show a similar result. Starting from the sides of the double dome, a zone of high deformation forms towards the outer boundary of the textile. Measured shear angle distribution across the specimen surface.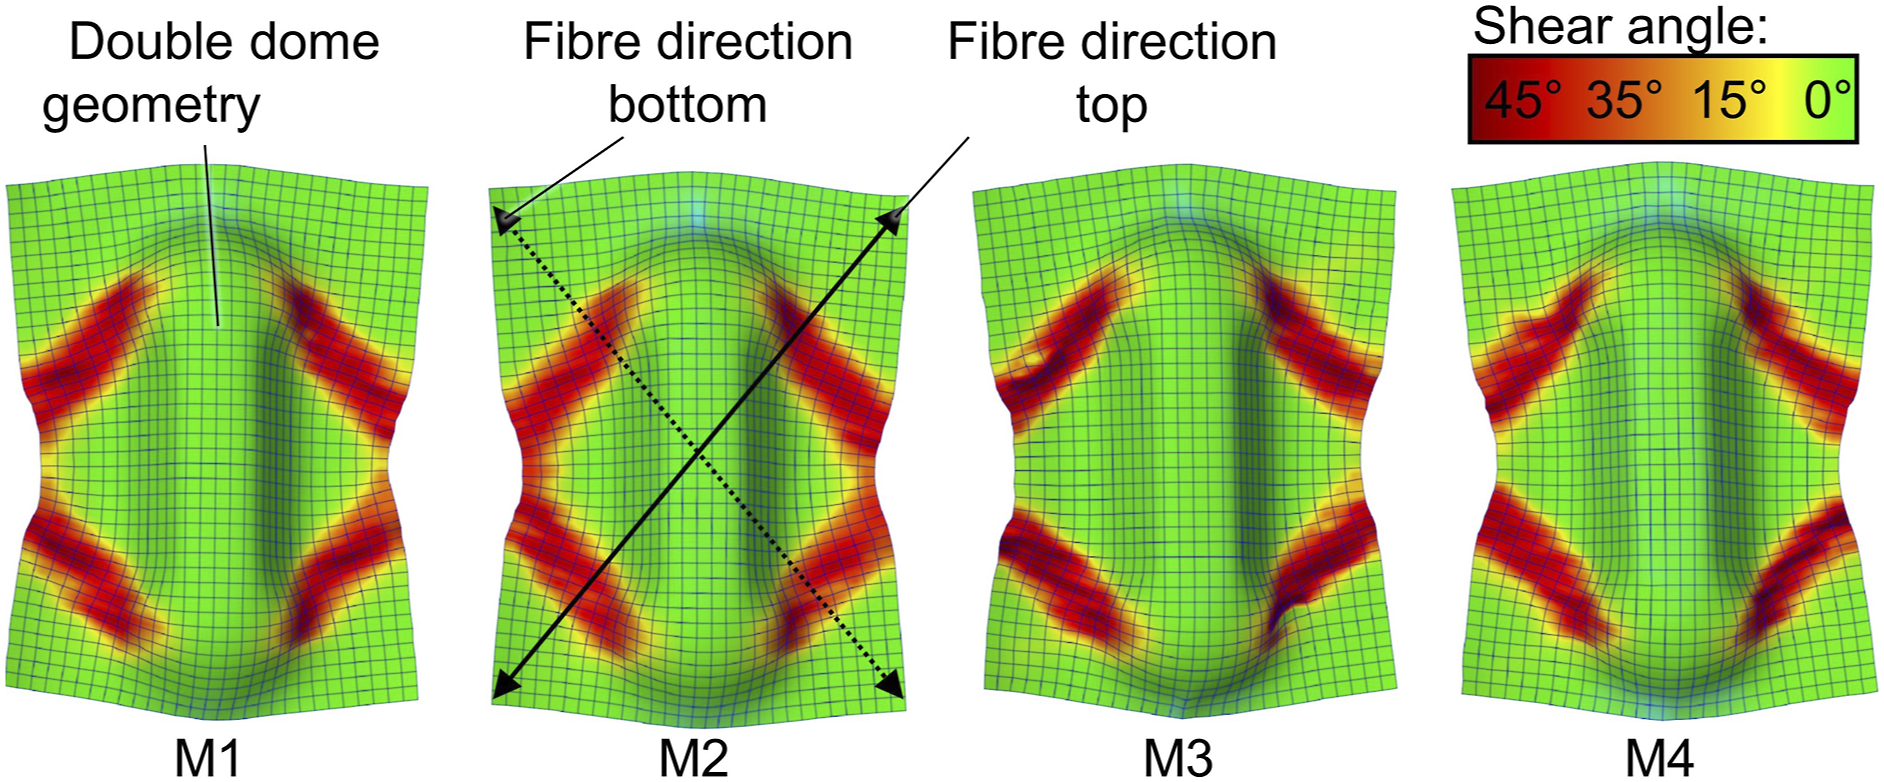
At the outer boundary, the entire textile is contracted and large wrinkles are formed. At the sides of the dome a roving-rotation occurs. Here the degree of roving rotation exceeds the critical shear angle of the textiles and draping defects occur in the form of undulations (in-, and out-of-plane) as well as gaps (see Figure 27). All strain measurements show no stretching or compression in fibre direction. Only transversely to the fibre direction compression occurs in the same zones where shear angle changes are present. In the compressed areas, a displacement and rotation of the reinforcement fibre rovings occurs as well as a compression of the warp yarn (negative shear). This is due to the fact, that the shear resistance in the negative shear direction is much lower compared to the positive shear direction (see section 3.5.1), thus the NCFs preferably deforms in negative shear direction. There is no elongation or compression of the glass fibre rovings, as the forces of the draping process are too low. Draping defects and definition of shear angle.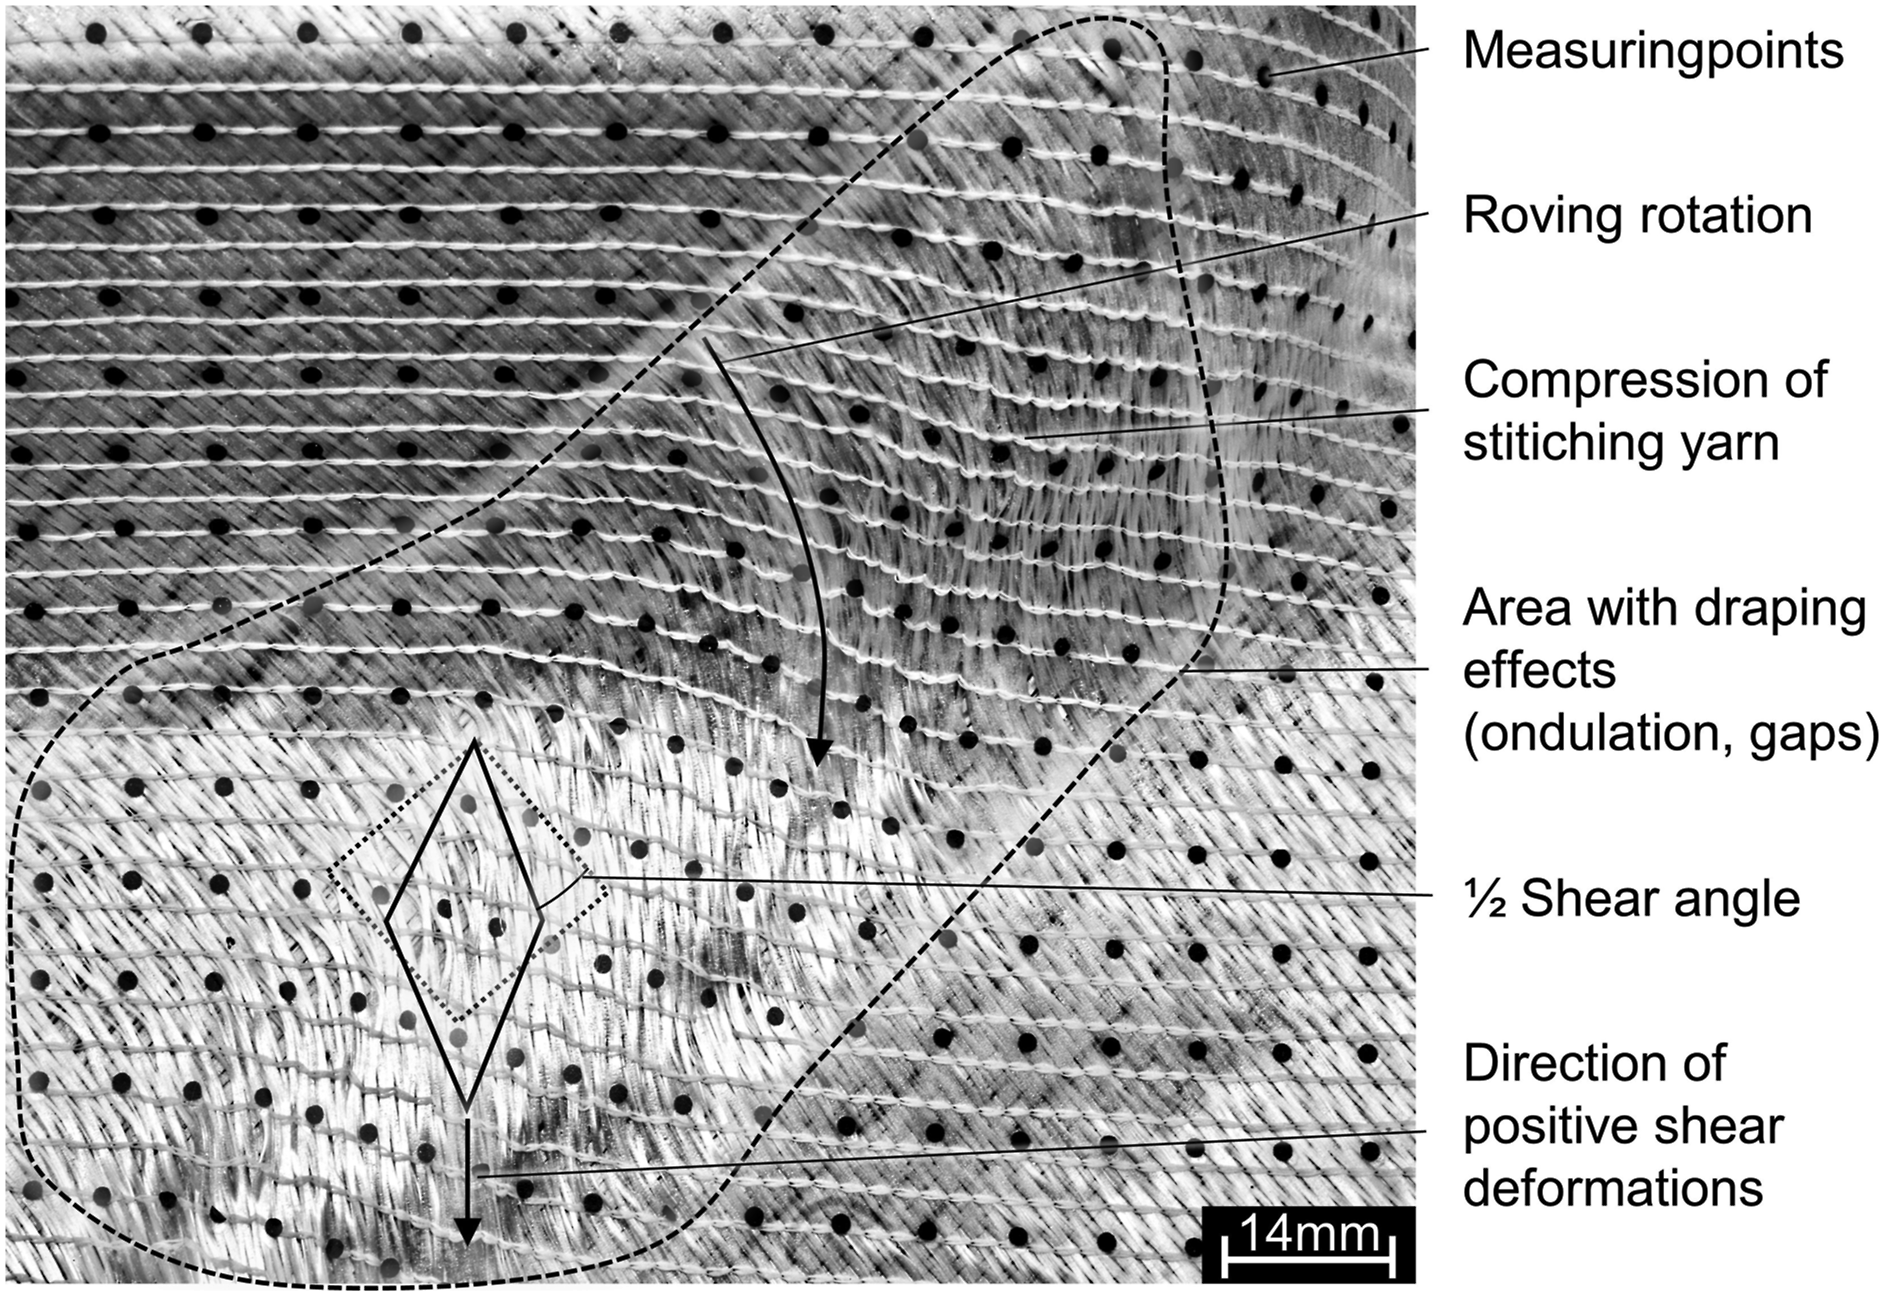
Figure 28 describes the proportion of the deformed area that exceeds a certain shear angle. The mean value from three measurements for each material is shown. Close to 99% of the surface of all specimens shows shear angles smaller than 45°. Up to a shear angle of approximately 30° there is no significant difference in shear behaviour between the materials M1-M4. Thus the factors stitch length and stitch tension have no significant influence on the drape behaviour. For shear angles greater than 30°, both the stitch length and the stitch tension have a significant influence on the drape behaviour. Materials with a high stitch length (M3 and M4) show a 1.5 to 6 times larger surface area with shear angles above 35° than materials with a short stitch length (M1 and M2). This is consistent with the findings from the bias extension tests from section 3.5.1, where materials with higher stitch length did show lower resistance to shear deformation under negative and positive shear, thus resulting in a larger deformation area. It is also consistent with the finding from the picture frame trials in section 3.5.3, where materials with higher stitch length showed lower forces at critical shear angle under negative shear (which is the dominant direction of shear in this draping trials). However, the CSA derived from the picture frame tests are much lower than the shear angles reached in the drape tests. The inaccuracy in determining the CSA on the basis of the force-shear angle data has already been described in the literature.
26
A high stitch tensions also leads to a higher proportion of deformed area. The effect of the stitch length is more pronounced than the effect of the stitch tension. This is not consistent with the picture frame and bias extension trials. These trials showed a higher shear resistance with increased stitch tension. Therefore, the deformed area should be smaller for fabrics with high stitch tension. There is no significant interaction between the factors stitch length and stitch tension. Proportion of area with shear angle greater than 25°, 30° and 35° (error bars indicate standard deviation).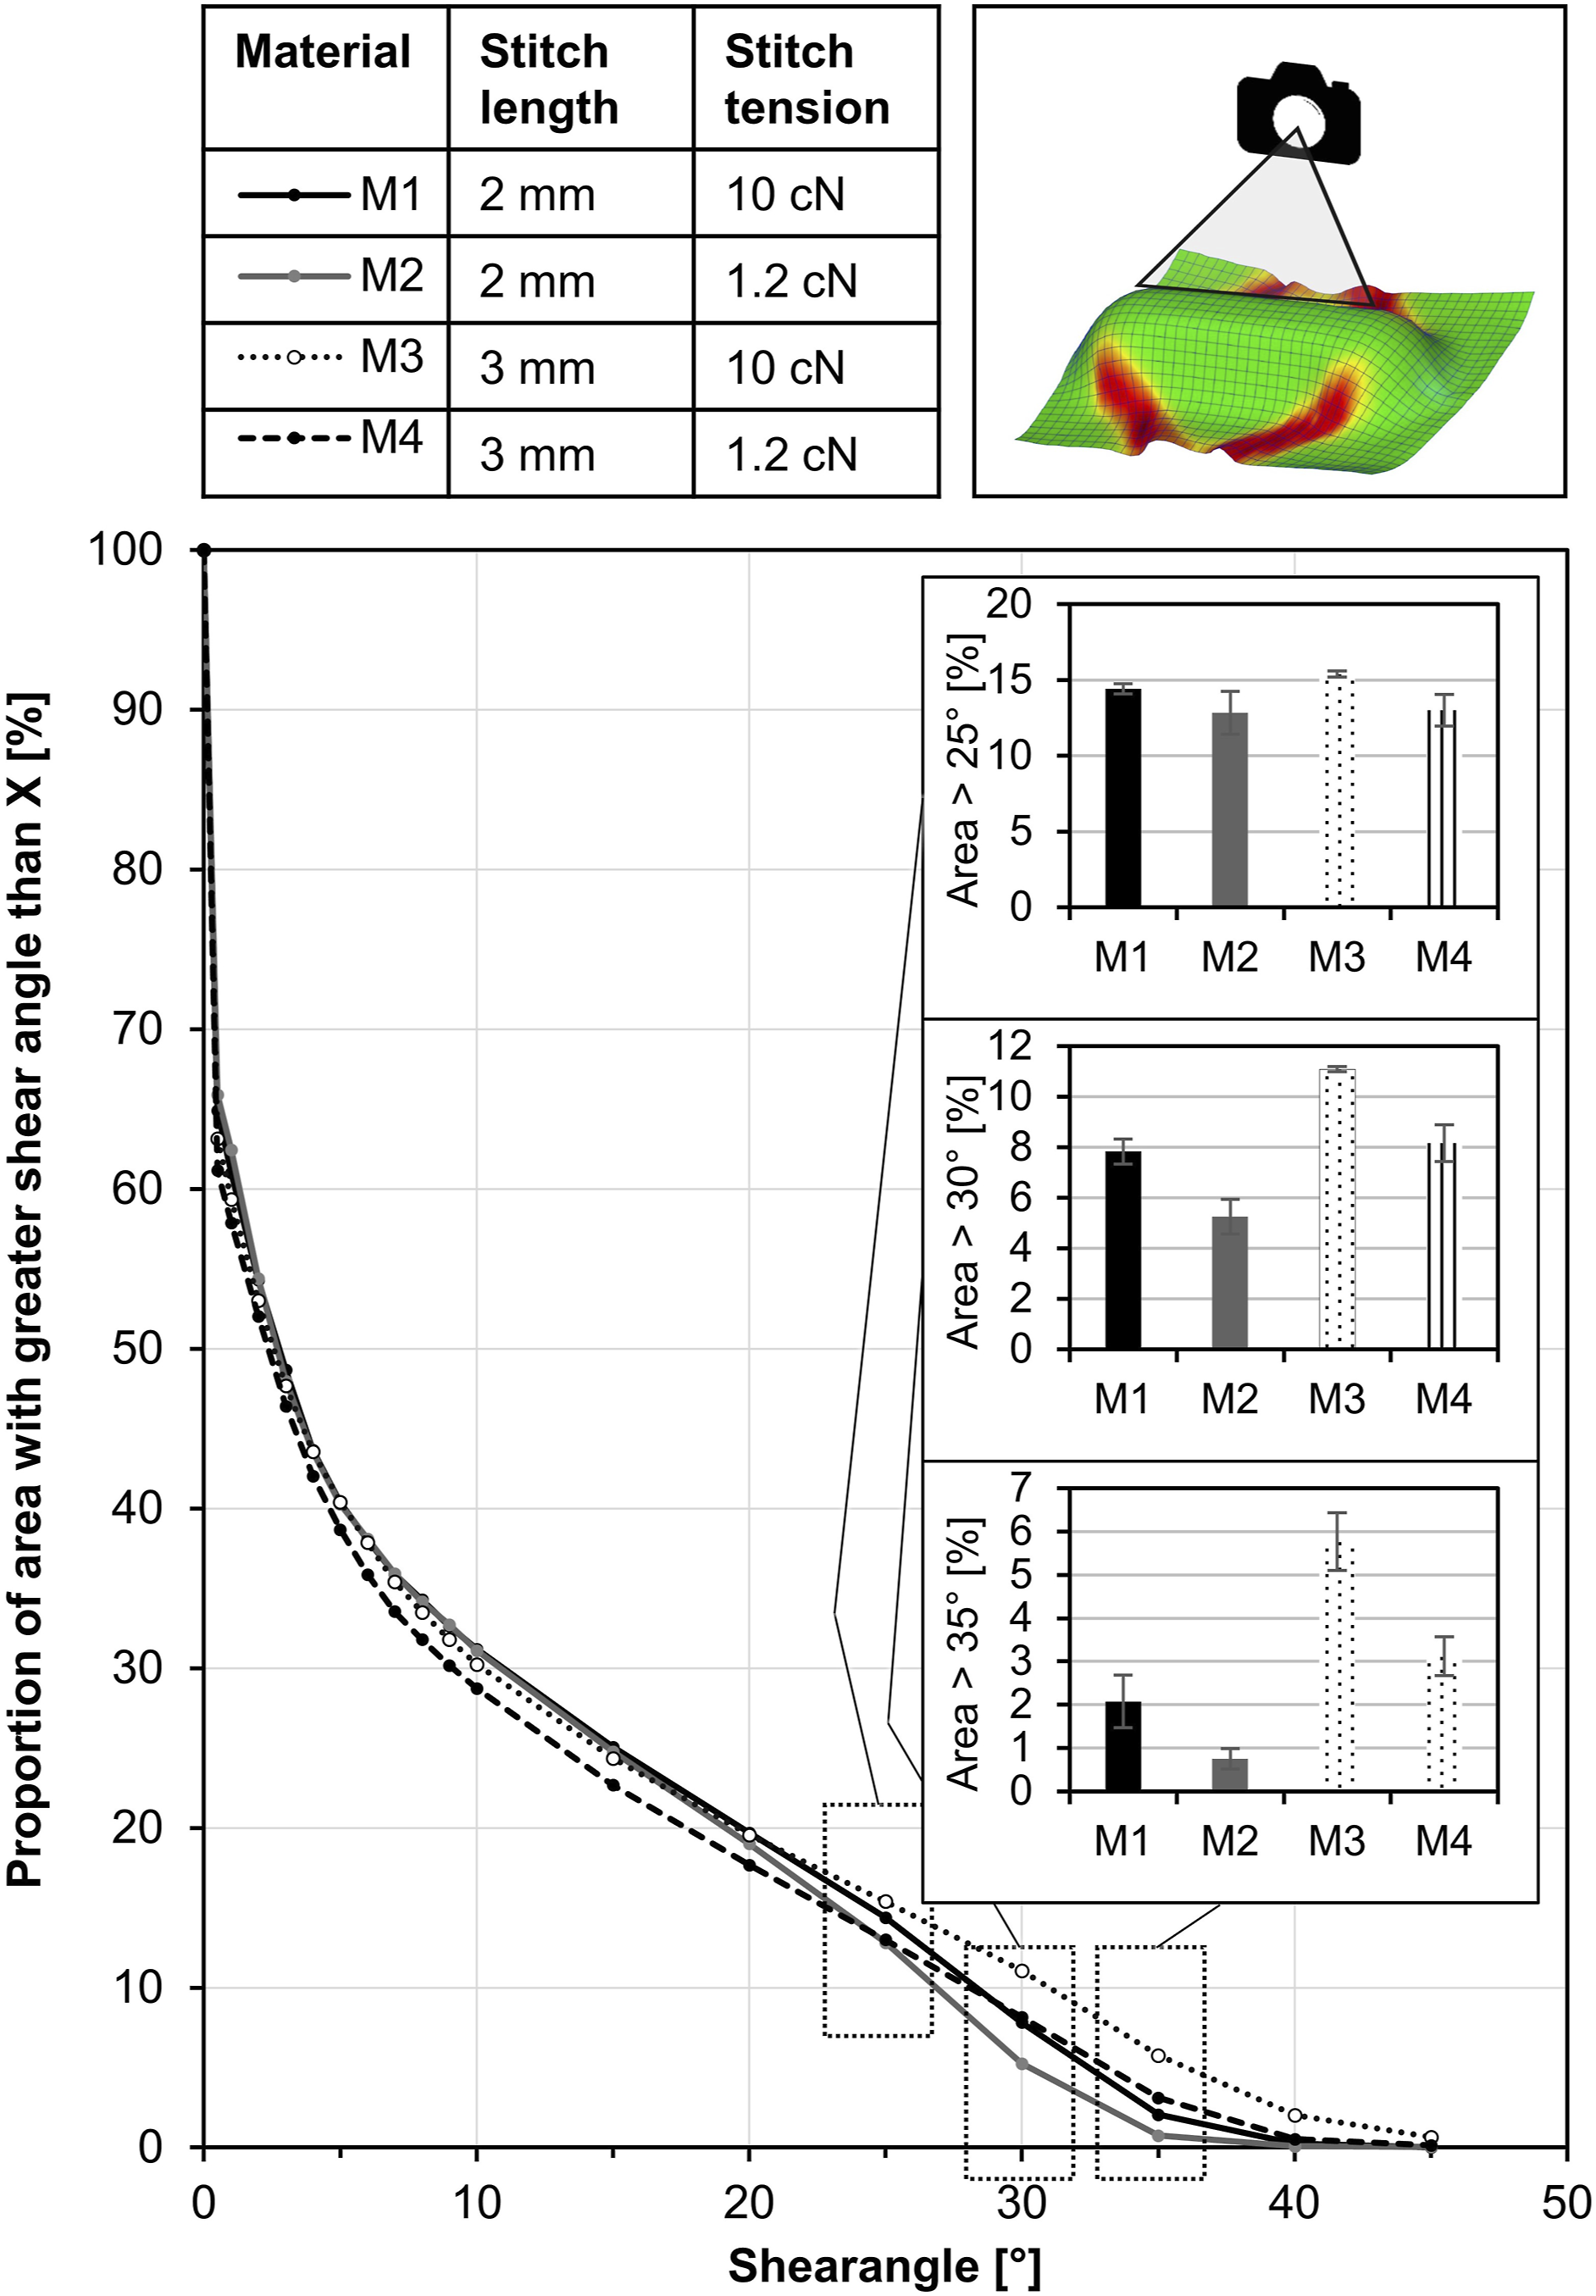
The qualitative visual assessment of the deformed textiles shows a similar result: The specimens from M3 show a significantly higher proportion of deformed area than the materials M1, M2 and M4. For the latter materials, no difference in the deformed area can be determined by purely visual observation. It can be concluded that fabrics with a long stitch length of 3 mm and a high stitch tension (M3) have a poorer draping behaviour and show more draping defects. Materials with short stitch lengths and low stitch tensions (M2) exhibit the most favourable draping behaviour.
Discussion
Influence of stitch length for ±45° NCFs
A stitch length of 2 mm lead to higher bending stiffness compared 3 mm stitch length. Since the frequency of the stitches increases with smaller stitch widths and the layers of the fabric are thus fixed to each other at smaller distances, relative movement between the layers is inhibited during bending, resulting in better force transmission into the load-bearing glass fibre rovings. A higher stitch length on the other hand resulted in lower friction, less thickness change under shear loading and reduced shear forces in bias extension tests. Friction is lower because the number of stitches decreases with higher stitch length, thus providing fewer opportunities for two different NCFs to geometrically interlock. The reduced thickening under shear stress and the lower shear resistance can be attributed to the fact that the rovings have more freedom for inter ply sliding at higher stitch lengths. Therefore, the interlocking of the rovings is delayed, thus avoiding out-of-plane deformation later and resulting in lower shear resistance. To verify whether a significantly higher level of inter-ply sliding by NCFs with higher stitch length is really taking place, the experiments from section 3.5.2 should be repeated for the other materials as well. This has so far only been done exclusively for M3.
The aforementioned findings are consistent with the observations made in the drape tests. NCFs with higher stitch length are more easily draped due to the lower shear resistance, which results in a higher deformation area. This means that the fibre orientation after draping of NCFs with higher stitch length deviates more from the initial orientation. Since the fibre angle is crucial for the mechanical design of components, the changes in fibre orientation must be predicted very accurately by a drape simulation. For NCFs with low stitch length, the deformed area after draping is smaller, but the risk of out-of-plane wrinkling increases. However, for the double dome geometry used within this study, even for NCFs with low stitch length, no severe out-of-plane folding was observed as the degree of deformation was too small for this. This shows that the critical shear angles derived from the picture frame test are not applicable to real drape tests. The critical angles of the picture frame test are much smaller than the shear angles obtained in the drape test, although no roving interlocking and out-of-plane deformation was observed.
The selection of the stitch length for NCFs therefore depends on the tolerated defects and the degree of deformation. If small defects such as roving rotations, gaps and loops and a high change in fibre angle are tolerated or complex geometries are to be reproduced, materials with a long stitch length are preferable. Here, the risk of forming critical folds is the lowest. If small defects are not tolerated, a stitch length as short as possible should be chosen. However, care must be taken to ensure that the stitch length is long enough so that no folds form.
Influence of stitch tension for ±45° NCFs
NCFs with a lower stitch tension exhibited 7 – 32% higher tensile strength. For the frictional behaviour, bending stiffness, the thickness change under shear loading and the shear resistance in bias extension under positive shear, the stitch tension did not show a significant influence. In bias extension under negative shear, the stitch tension was found to be significant. In this case, higher stitch tension did lead to higher shear resistance. Within the drape tests, however, NCFs with higher stitch tension showed a larger deformed area. This seems contradictory, since the lower shear resistance of the NCFs with low stitch tension in the bias extension test should actually have resulted in greater deformation after draping. The reason for this apparent contradiction should be the subject of future experiments. If a deviation of the fibre orientation during draping is to be avoided as far as possible, it is recommended to select a high stitch tension.
Influence of stitch pattern and ply orientation
The tensile strength for the NCFs with tricot stitch and a fibre orientation of 0/90° is highly anisotropic. Tested in the direction of stitch, it shows the lowest tensile strength of all tested materials. However, tested perpendicular to the direction of stitch, it reaches the highest tensile strength among the whole group. This is due to the difference in packing density (areal weight) of the 0° and 90° layer. Similar observations can be made for bending stiffness. The bending stiffness is highest in the direction of stitch (approx. 200 – 500%) and lowest (approx. 50%) when testing perpendicular to it. This high anisotropy in terms of bending stiffness is due to the different packing density of the 0° and 90° layers and the different ply orientation compared to the ±45° NCFs. When testing a 0/90° NCF in the direction of stitch, the 0° ply is oriented in the same direction and thus contributes to the bending stiffness. For ±45° NCFs, both glass fibre layers contribute less to the bending stiffness because they are oriented ±45° to the testing direction in this case. The 0/90° NCF with tricot stitch also showed higher friction compared to the other ±45° NFC with pillar stitch (up to 2.5 times higher). With the tricot stitch pattern, there are more possibilities for interlocking between the two surfaces compared to a pillar stitch pattern, which leads to higher coefficients of friction. Despite having the highest thickness overall, material M5 did not show a significant different rate of change of thickness under shear loading compared to other materials. In the bias extension test, the 0/90° NCF with tricot stitch showed a significantly different elongation-shear force characteristic compared to the other ±45° NCFs with pillar stitch. The overall range of the shear forces measured is between the forces of the ±45° NFCs tested under positive and negative shear.
Conclusion
In this work, a comprehensive material characterisation of warp-knitted NCFs was carried out. Four different ±45° NCFs (pillar stitch) were examined and compared to a 0/90° NCF (tricot stitch). The four ±45° NCFs differ in their production parameters stitch tension and stitch length. Their production parameter dependent material properties were investigated on a meso and macro level. A (relative) comparison between the ±45° NCFs for selected tests and test configurations is shown in Figure 29. Relative comparison of the selected material properties of the ±45° NCFs.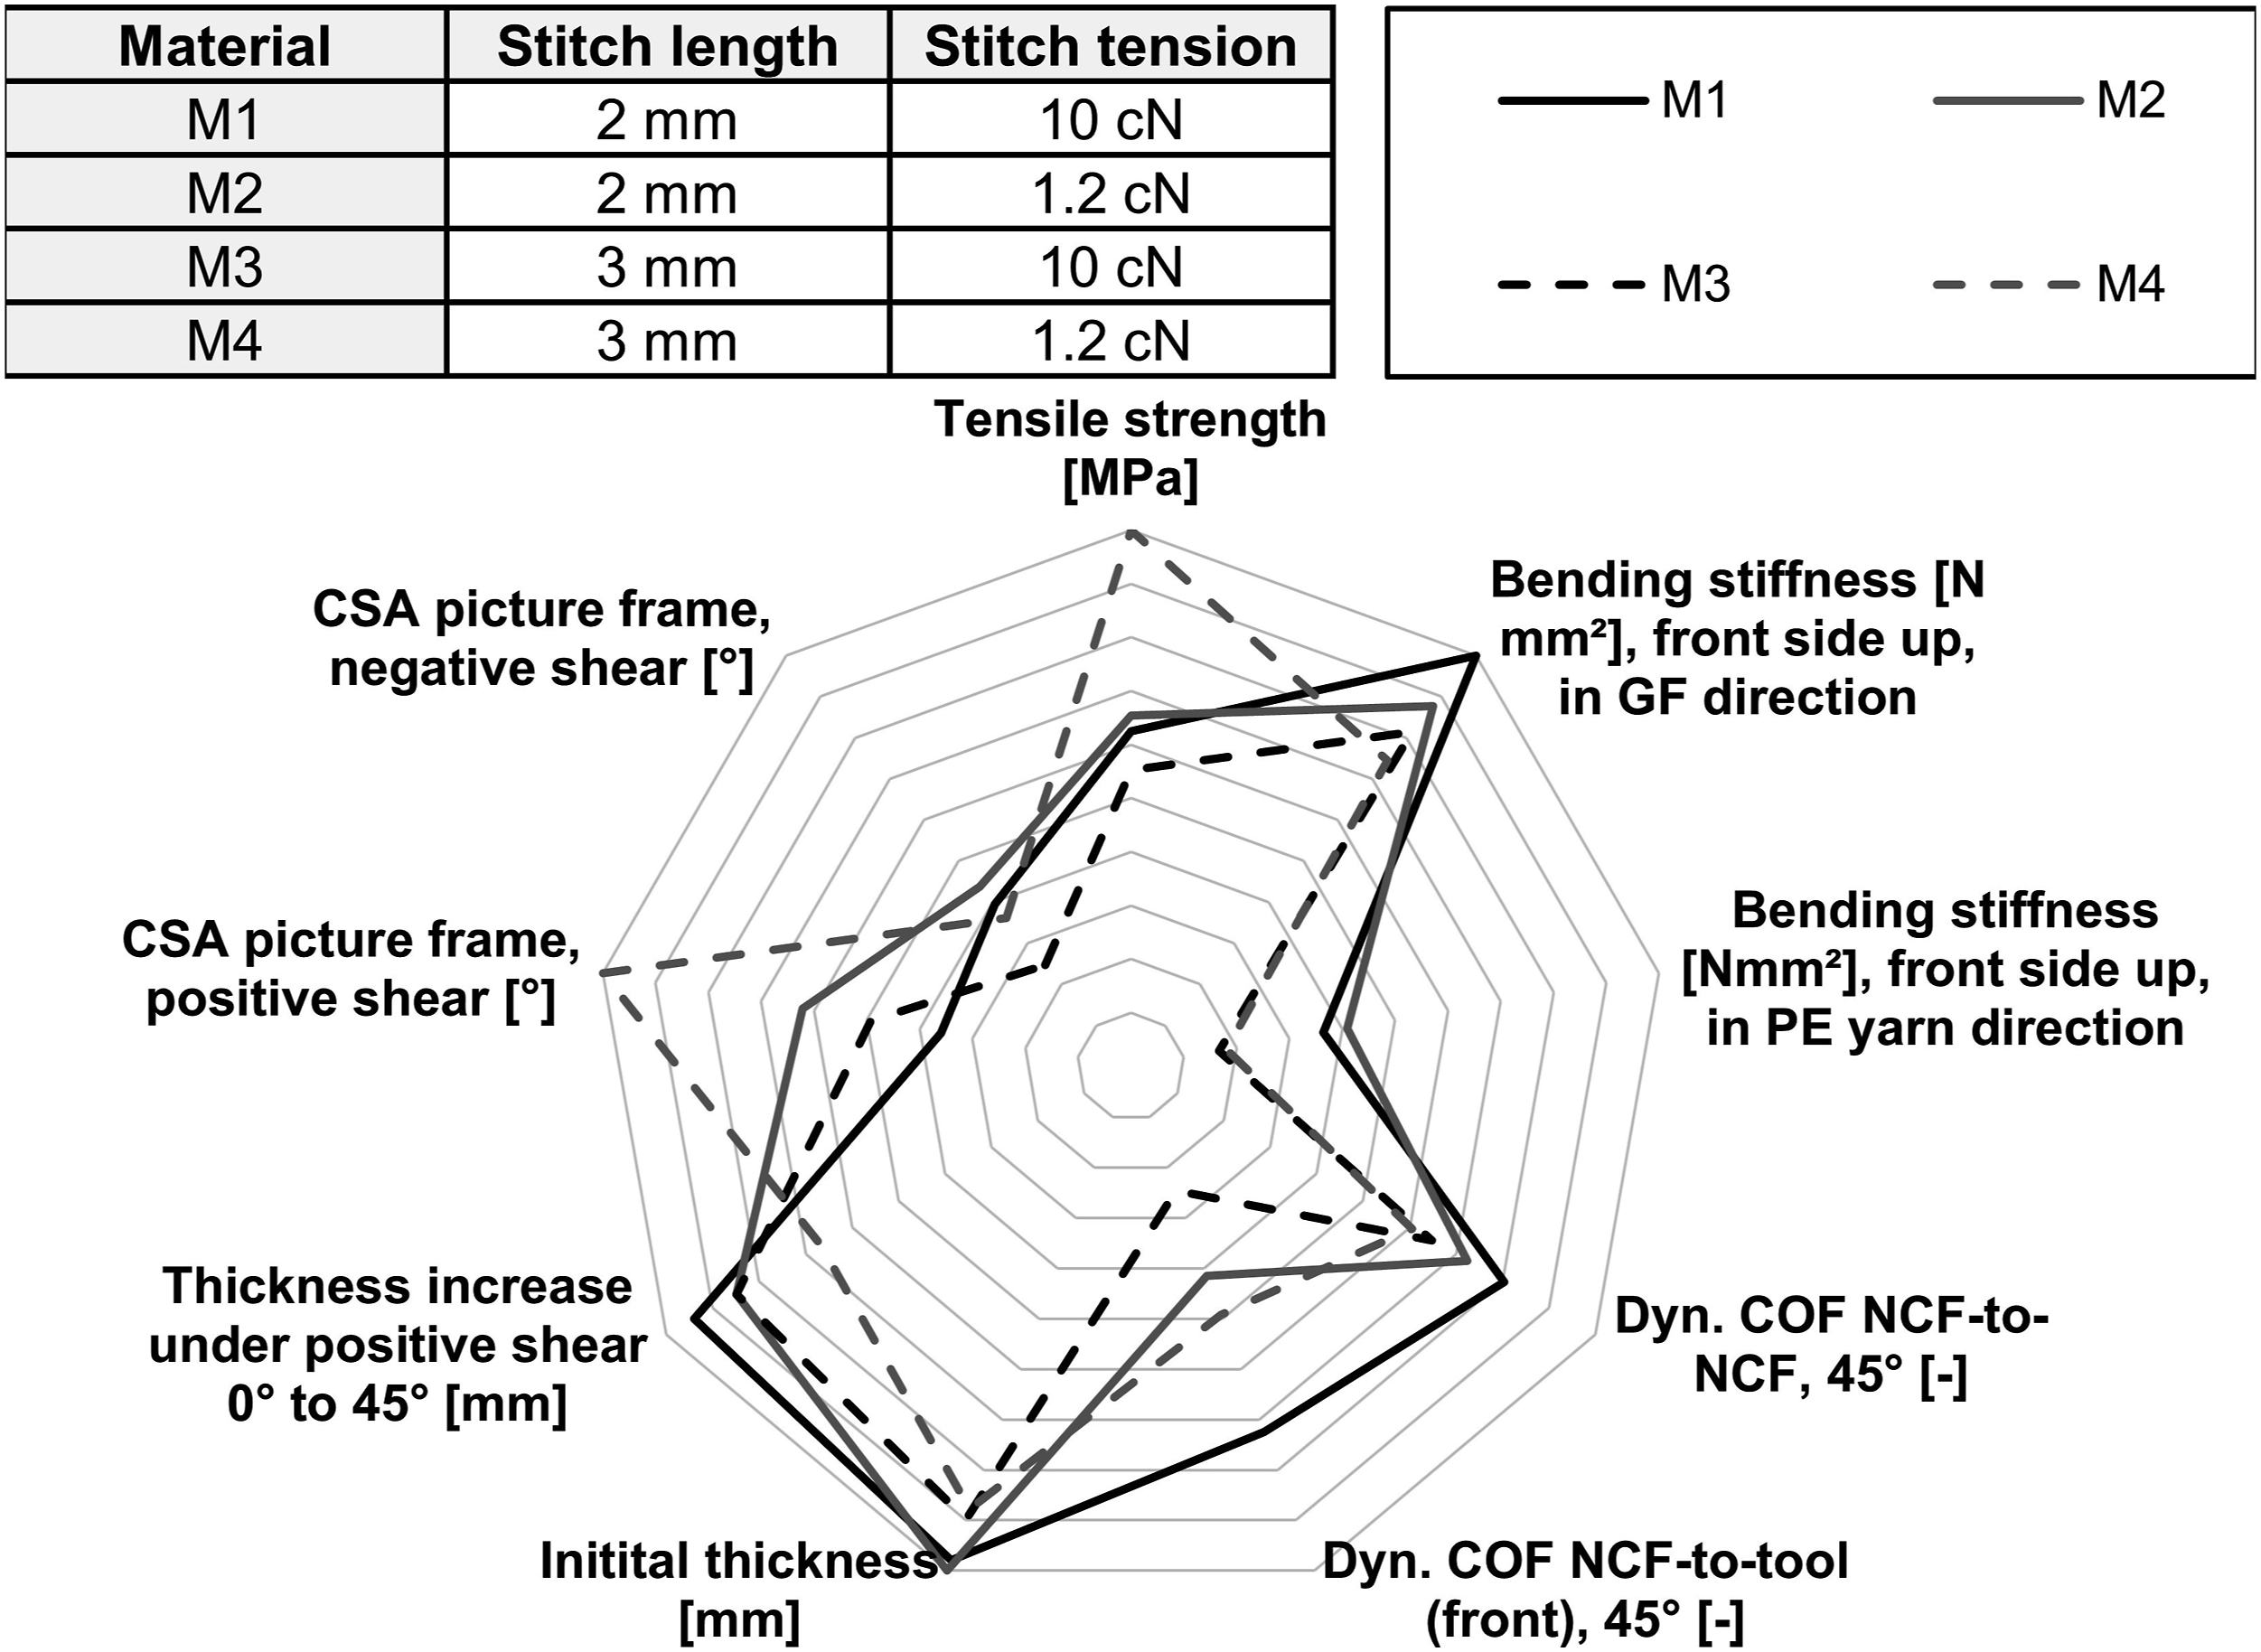
It was found that the NCFs with a higher stitch length and a low stitch tension have the highest tensile strengths amongst the group. The bending stiffness depends on the stitch length, whereas the stitch tension does not play a role. A smaller stitch length makes the NCF stiffer. In addition, the bending stiffness of an NCF is highly anisotropic. The influence of the fibre direction, as well as the direction of the bending have a significant influence. The friction behaviour of NCF-to-NCF friction is significantly determined by the stitch length. At higher stitch lengths, the coefficient of friction is lower. The relative angle of friction and the stitch tension has no influence on the friction behaviour. The thickening of the NCF under shear deformation is only dependent on the stitch length. An increased stitch length leads to less shear resistance in both positive and negative shear during bias extension. Higher stitch tension leads to higher shear resistance only under negative shear. Picture frame test have shown that higher stitch tension reduces the CSA of the NCF under both negative and positive shear, whereas the stitch length was not found to be significant. The drape tests with a double dome geometry have shown that the NCF with a high stitch length and a high stitch tension have a larger area with a shear angle greater than 35°. Visually, more draping defects were observed in the NCF with a high stitch length. The data obtained serve as a basis for the further development of drape simulation models.
The inter-ply sliding phenomenon during shear loading of NCFs was investigated for the first time and the test procedure and results were presented. Since location of marking dots on the fabric as well as force at the boundaries were provided in all the reported experiments, these results are invaluable for training and validation of both model-free and model-based computational mechanics. In the future, further investigations will have to examine the influence of the production parameters on the inter-ply sliding phenomenon.
Footnotes
Acknowledgment
We would further like to thank Johns Manville for providing the glass fibre material used in this project.
Declaration of Conflicting Interests
The author(s) declared no potential conflicts of interest with respect to the research, authorship, and/or publication of this article.
Funding
The author(s) disclosed receipt of the following financial support for the research, authorship, and/or publication of this article: This research is funded by the Deutsche Forschungsgemeinschaft (DFG – German Research Foundation) under project grants GR1311/97-1, IT67/18-1 and SA1822/11-1.