
Abstract
The results of in-plane shear tests performed on 5-hardness satin woven carbon/polyphenylene sulphide and polyetheretherketone thermoplastic prepregs are described in this article. The experimental analyses are based on bias-extension tests performed in an environmental chamber. The results are given for different temperatures on both sides of the melting point. This range of temperature is that of the part during a thermoforming process. The effect of displacement rate is also investigated. The results are given both as load versus displacement curves and as shear-moment versus shear-angle curves. The latter data can be directly used in a thermoforming simulation code. It is shown on a forming simulation example that the temperature and the related change of the shear behaviour have strong consequences on the final composite part. In particular, wrinkles can develop when the process temperature is too low.
Keywords
Introduction
The draping of preimpregnated plies (prepregs) is an important concern in the manufacturing of composite material products. Prepreg draping represents an interesting alternative to the liquid composites moulding (LCM) processes, 1,2 where a resin is injected on a textile preform. The prepreg forming starts with semiproducts, where the matrix is already integrated into the continuous fibre textile reinforcement. This resin can be thermoset or thermoplastic. Thermoforming of thermoplastic prepregs is a fast manufacturing process in comparison with LCM process or thermoset prepreg draping that need a long polymerisation stage in an autoclave. In addition, the composites with thermoplastic matrix are more easily recyclable than thermosetting material. The fibre volume fraction in the final composite part obtained by thermoplastic thermoforming can be high. The forming process must be performed at a temperature close to or higher than the melt temperature of the resin in order to render the textile reinforcement deformation possible. The manufacturing of double-curved parts requires in-plane shear deformations of the composite prepreg to conform to the shape. These shear strains are the main forming mode and they can be large (up to 50°).
Depending on the geometry of the final composite parts, on the reinforcement type (weaving, properties of fibres, etc.) and on manufacturing parameters (tool loads, blank holder, temperature, etc.), double-curved shape manufacturing may lead to defects (wrinkling, porosities, fibre fracture, etc.). Simulation software for composites forming has been developed to predict the conditions for the process feasibility and optimize the main forming parameters. 3 –7 The present article is based on the use of the software developed previously by Hamila et al. 8 –10 These software packages need the mechanical behaviour of the composite ply during forming. As this ply is generally modelled by shell finite elements (or membrane elements if the bending stiffness is neglected), the mechanical behaviour of the prepreg ply during forming is given by the biaxial tensile properties, 11 –14 the in-plane shear properties 15 –27 and the bending properties. 28 –30 In-plane shear is the predominant deformation mode, and the in-plane shear properties are very important for forming simulation. In case of thermoplastic prepreg forming, the in-plane shear behaviour must be measured at high temperatures because the forming is performed above the melt temperature of the matrix. Many works have been done concerning the in-plane shear properties of textile reinforcements at room temperature. 19 –21,23 –27 Some articles have studied the shear behaviour of polypropylene (PP) 18,22,31,32 or polyamide 33 /glass commingled fabrics. The main objective of the present article is to determine the in-plane shear behaviour of thermoplastic prepregs used in aeronautical applications. The analysed textile reinforcement is a carbon 5-harness satin and the matrixes are polyetheretherketone (PEEK) and polyphenylene sulphide (PPS). The experimental tests are performed for different temperatures. This is necessary because the temperature is generally not constant in the part during the forming simulation. Finally, the measured experimental properties are used in prepreg thermoforming simulations. It is shown that a carbon/PPS prepreg forming can lead to winkles or not depending on the temperature during the forming.
In-plane shear behaviour and bias-extension test
In-plane shear moment
During the deformation of a composite reinforcement, the tensile, in-plane shear and bending virtual works can be separated in the virtual work theorem. 8
In any virtual displacement field such as

where
In case of the composite reinforcements or prepregs, the internal virtual work is assumed to be separated into

where
The in-plane shear virtual work is
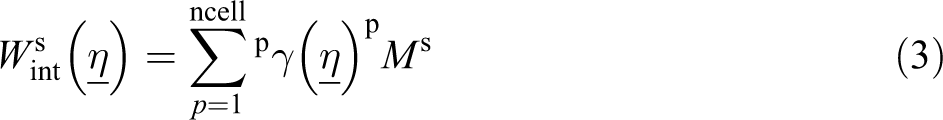
where
Bias-extension test
Many studies have analysed the in-plane shear behaviour of textile materials because it is the principal deformation mode of woven fabrics when they are draped on a double curved surface. 15,23,24,39
Two principal devices are used to analyse the in-plane shear behaviour of textile composite reinforcements and preimpregnated materials: the hinged framework or ‘picture frame’ and the tensile test at 45° or ‘bias-extension test’. An international benchmark has been launched in order to compare the experiments and results obtained by different laboratories. 27 The picture frame is made of a hinged frame with four-side bars of equal length assembled in a tensile testing machine. 21 –26 The specimen within the picture frame is theoretically subjected to a pure shear strain field, that is, angle variation between warp and weft directions without any stretching. The main difficulty in picture frame test is to avoid spurious tensions that can strongly disrupt the results of the test because of the high rigidity of the fabric in the direction of the fibres. 18,25 On the other hand, the frame must be large enough and it is difficult to perform picture frame at high temperature.
The tensile test at 45° or bias-extension test is performed on a rectangular specimen such as the warp and weft directions of the tows are orientated initially at ±45° to the direction of the applied tensile load (Figure 1). When the specimen is stretched from L to L + u, the fibrous and woven nature of the specimen leads to zones with different deformed states. In zone A, the both warp and weft yarns have a clamped end and there is no deformation in this zone. In zone C, the warp and weft yarns have free ends, the nonsliding at crossovers and the stretching of the specimen leads to a pure shear deformation depending on u. In zone B, one yarn direction is clamped at its end, the other direction is free. The stretching of the specimen leads to a shear strain of a value half of that of the zone C.
In the bias-extension test, all the yarns of the sheared zones are free at one of their ends. This is a strong advantage for a pure shear test because the yarns are not submitted to tension. Nevertheless, the bias-extension test can not be performed for very large shear angles because of slippage between the yarns. Consequently, the theoretical behaviour of the specimen is no longer verified.
40
The limit angle before slippage depends on the material but is usually somewhere between 40° and 50°.
22
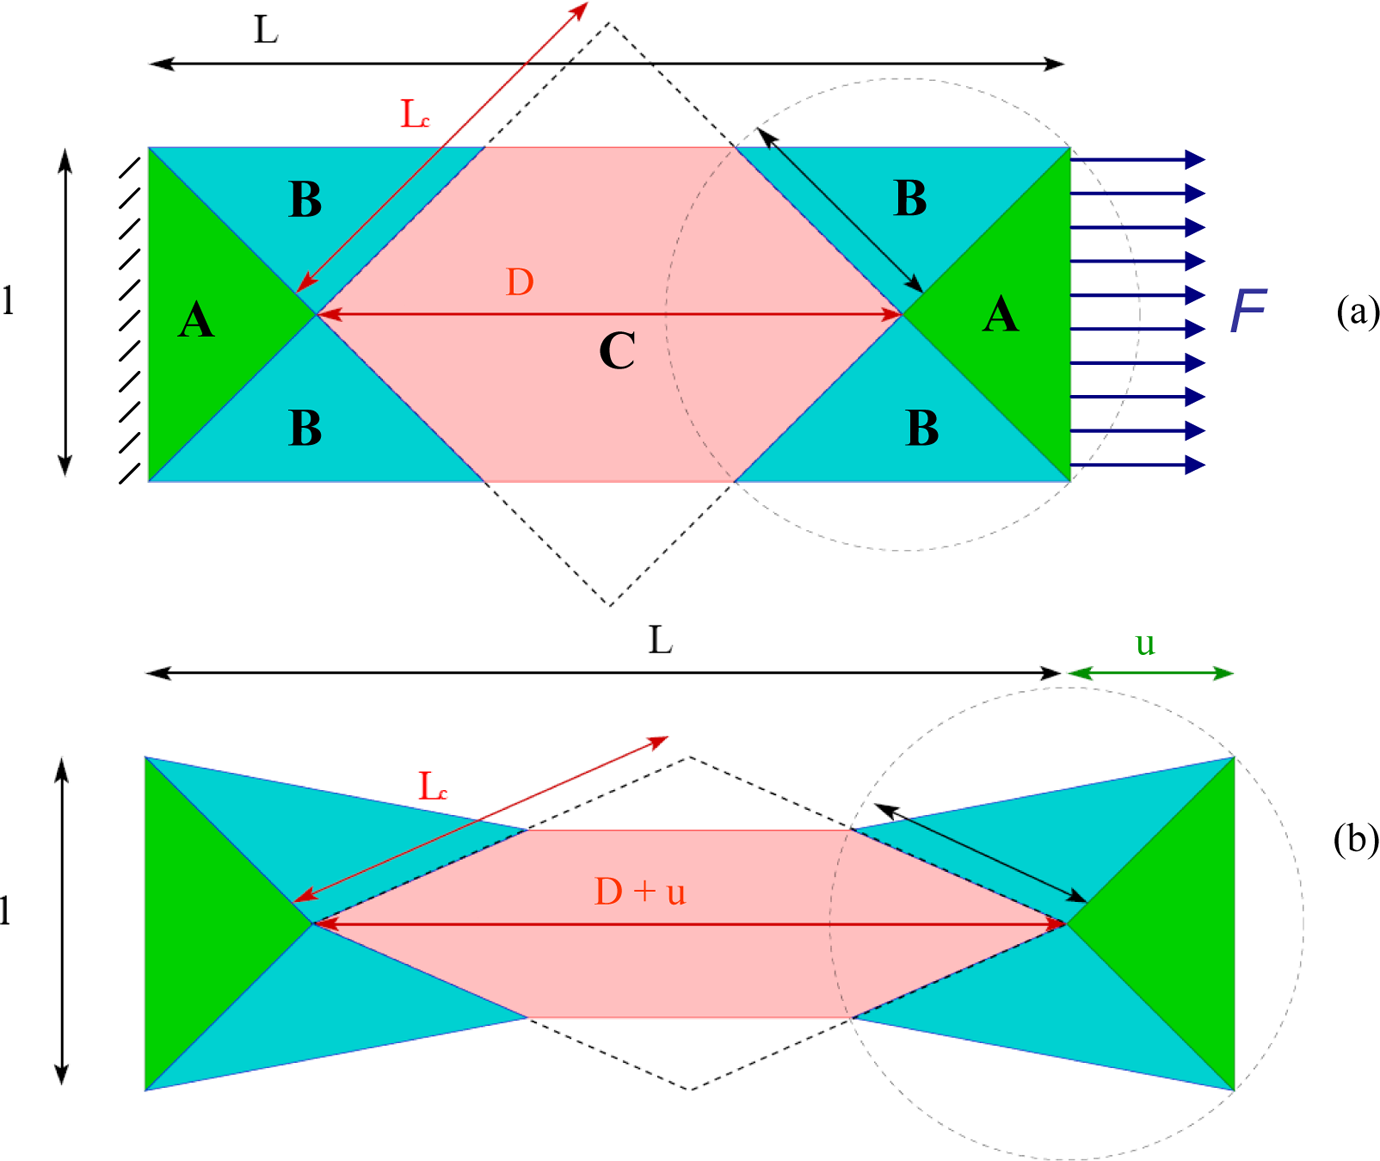
Undeformed (a) and deformed (b) shapes of the specimen in the bias-extension test.
The kinematics of the bias-extension test is based on the mechanical behaviour of textile materials that are very stiff in tension in the yarn direction. It can be used for prepreg materials with fabric reinforcements because the matrix is over (or close to) the melt temperature as it is the case in thermoforming processes (or before the polymerisation in case of thermoset prepreg). Consequently, the matrix is weak and does not modify the kinematics of the test. It only modifies the in-plane shear stiffness.
It is assumed that during the deformation of the woven reinforcement, there is no translation sliding between the warp and weft yarns. Furthermore, the yarns are assumed to be inextensible. The displacement u imposes the in-plane shear angle γ
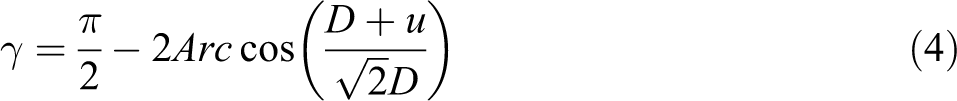
D and u are defined in Figure 1. During bias-extension test, the power made through the clamping force is dissipated in the semishear and pure shear zones. This gives the in-plane shear moment M
s(γ) in function of the clamping force F(γ) for a given shear angle
9
,25,27


where S
B and S
C are the original area of the zones B and C in Figure 1, S
u is the surface of a unit woven cell in the initial configuration.
In-plane shear behaviour at different temperatures
Experimental set-up
The experimental set-up used to characterize the prepreg shear behaviour is shown in Figure 2. The specimen with the surface dimensions of 70 × 210 mm2 (l × L; Figure 1) is placed in an isothermal oven and fixed by two clamps. The spring system applied in clamps avoids the risk of slippage due to the reduction in specimen’s thickness when the resin is at the melt temperature. The force on the specimen is measured by a 500-N (±0.3%) load sensor. The clamp displacement is detected by the internal sensor of the tensile machine.
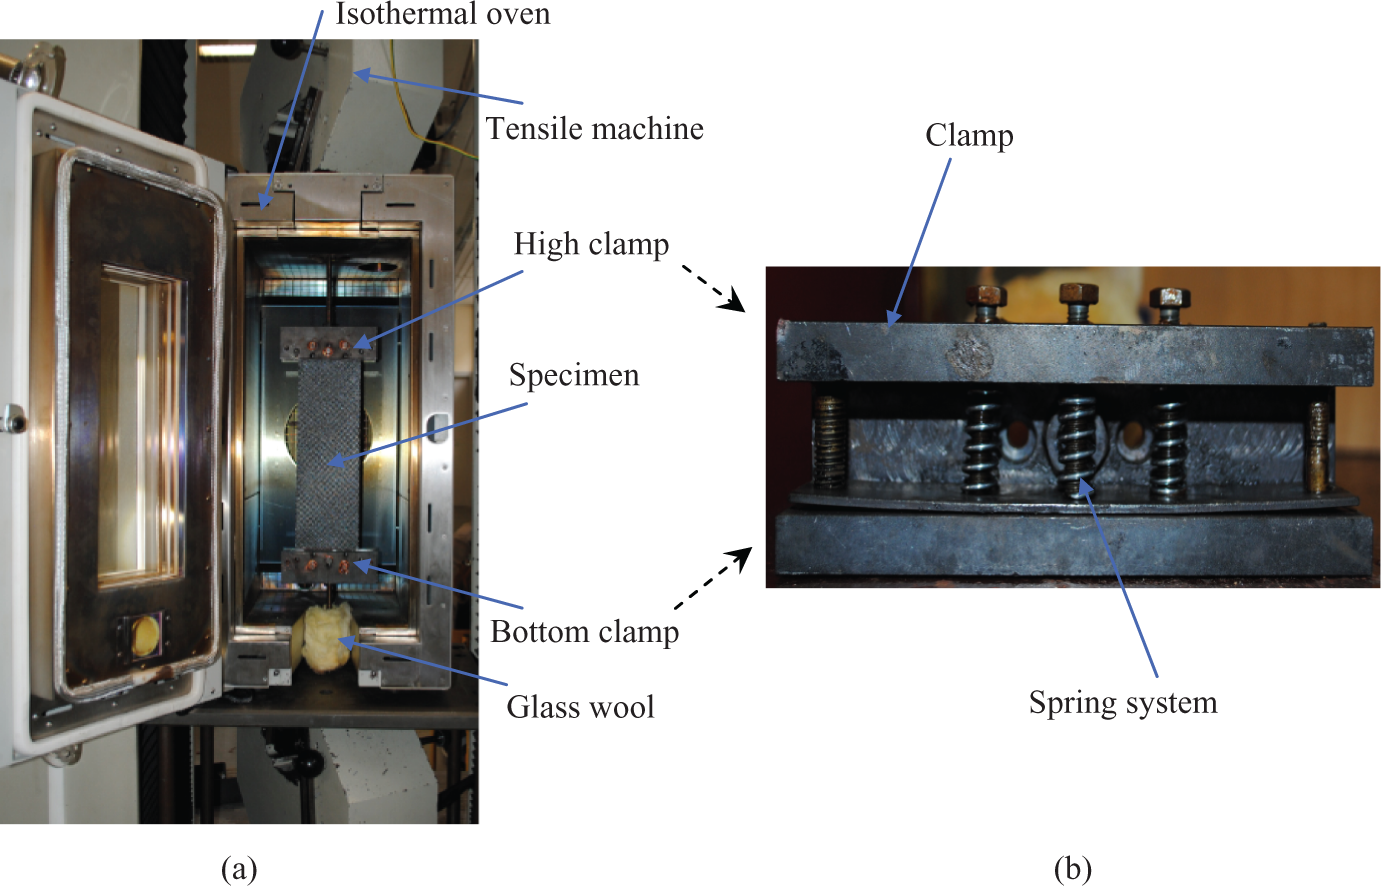
Bias-extension device (a) and application of spring system (b).
Experimental results
Bias-extension tests are performed on carbon/PPS and carbon/PEEK prepregs at different temperatures. The reinforcement is a 5-harness satin. The material properties are given in Table 1.
The principle proprieties of the prepregs utilised.
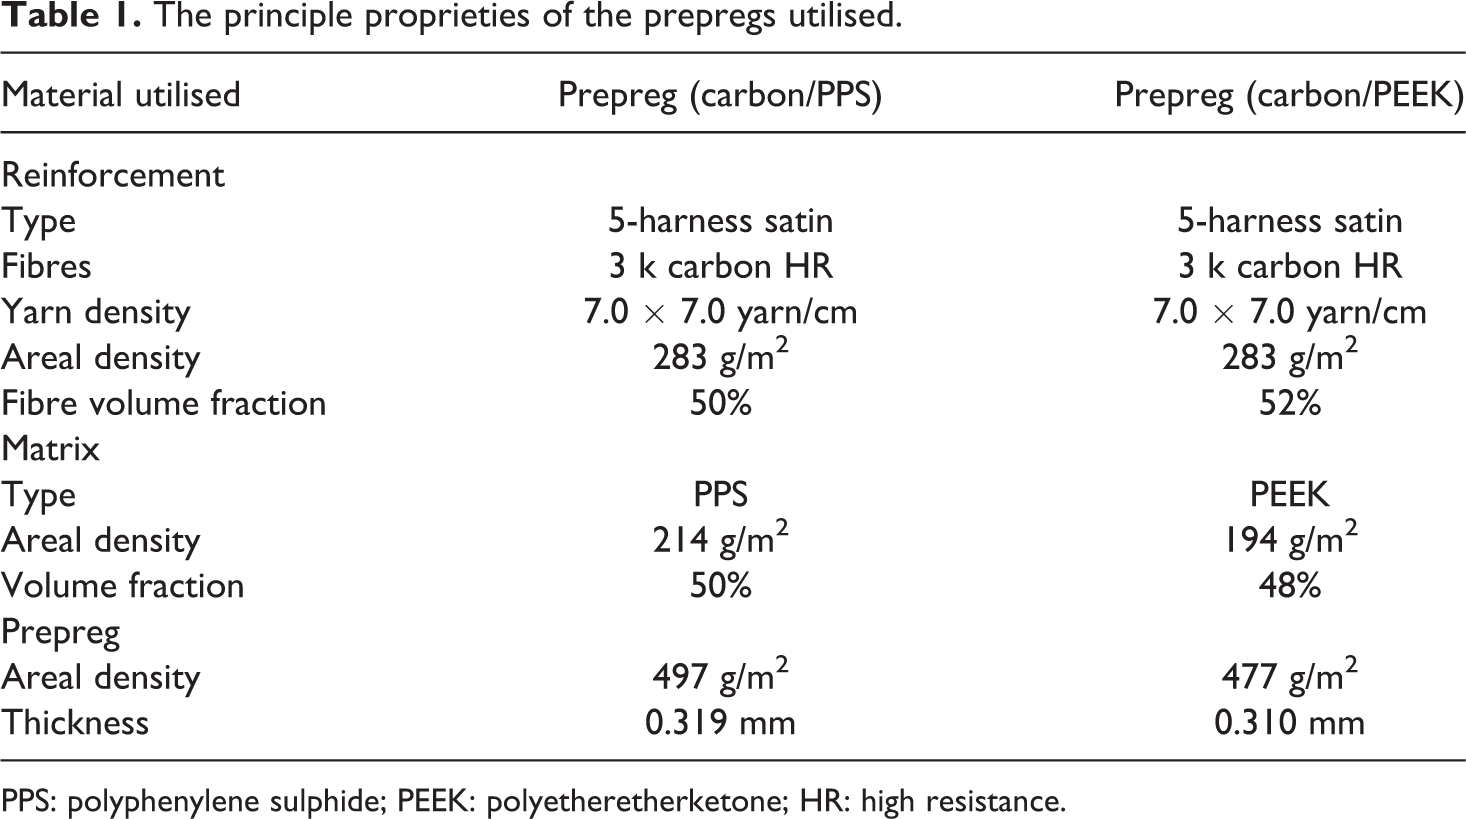
PPS: polyphenylene sulphide; PEEK: polyetheretherketone; HR: high resistance.
Figure 3 shows one of the bias-extension test specimens at room temperature and at a temperature over melting point. At 25°C, the solid resin (the PPS resin in this case) is superimposed on the dry fabric. On the contrary, the resin and carbon fibre are well commingled when the resin is heated above the melt temperature (300°C in Figure 3(a)), and the resin impregnates the reinforcement.
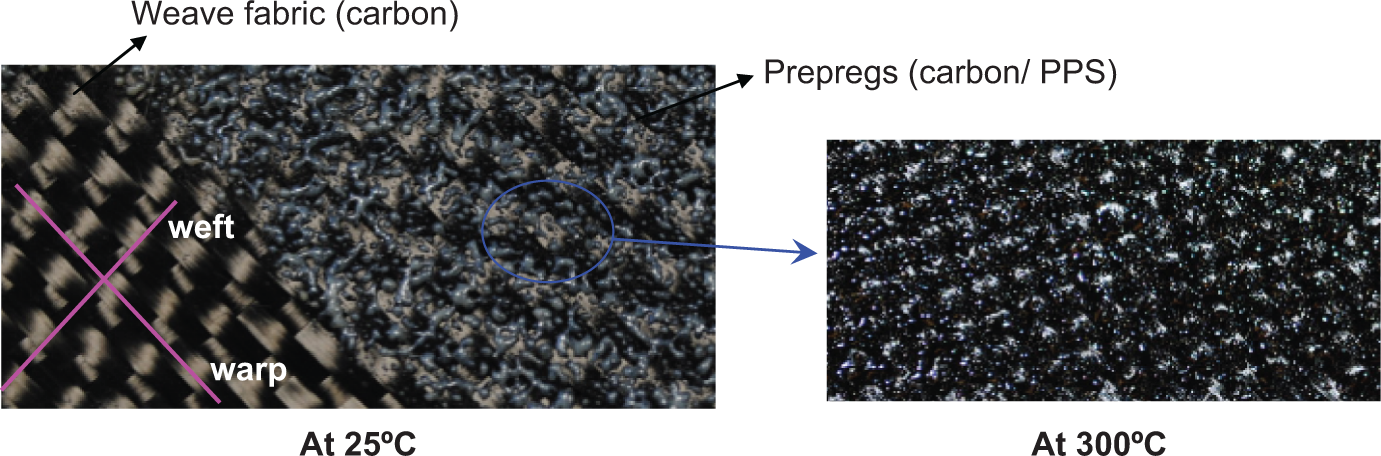
The 5-harness satin/PPS prepreg at room temperature and at 300°C. PPS: polyphenylene sulphide.
Figure 4 shows a carbon/PPS specimen before and after the bias-extension test. The three different zones of the theoretical kinematics of the test (Figure 1) are clearly observed in the deformed configuration. The deformed shape is shown in Figure 4(b) for a 270°C temperature and in Figure 4(c) for a 320°C. Wrinkling is observed in the central part of the specimen at 270°C. There is no wrinkle at 320°C. These wrinkles at a temperature of 270°C, that is, below the melt temperature of the matrix, are due to higher shear stiffness in this case.
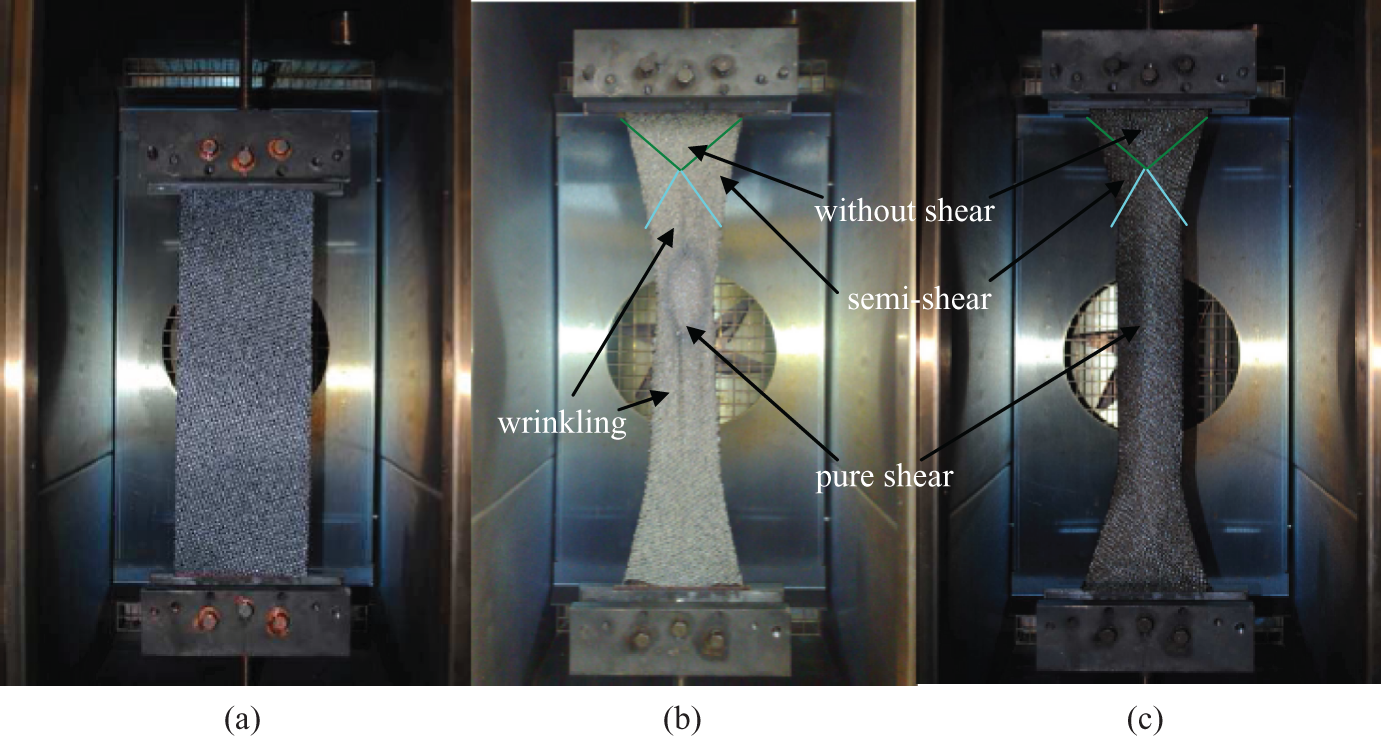
Bias-extension tests performed on a carbon/PPS prepreg in an environment chamber: (a) initial condition; (b) deformed specimen at 270°C; and (c) deformed specimen at 320°C. PPS: polyphenylene sulphide.
Carbon/PPS prepreg
The load versus displacement curves at different temperatures are presented in Figure 5 for 5-hardness satin/PPS. During the tests, the displacement rate is constant and equal to 30 mm/min. The maximum displacement of bias-extension test is 57 mm (i.e. a theoretical 78.5° shear angle in the central zone). The melt temperature of PPS is 282°C. To avoid the oxidation problem during the test under high temperatures, high velocity has been imposed in the temperature augmentation phase (20°C/min). Once the desired temperature is reached, it needs 4 min to stabilize the specimen temperature in oven before the extension stage. It is recommended that the duration of the whole test for PPS material does not exceed 12 min at 300°C or 8 min at 320°C to avoid resin oxidation. 41
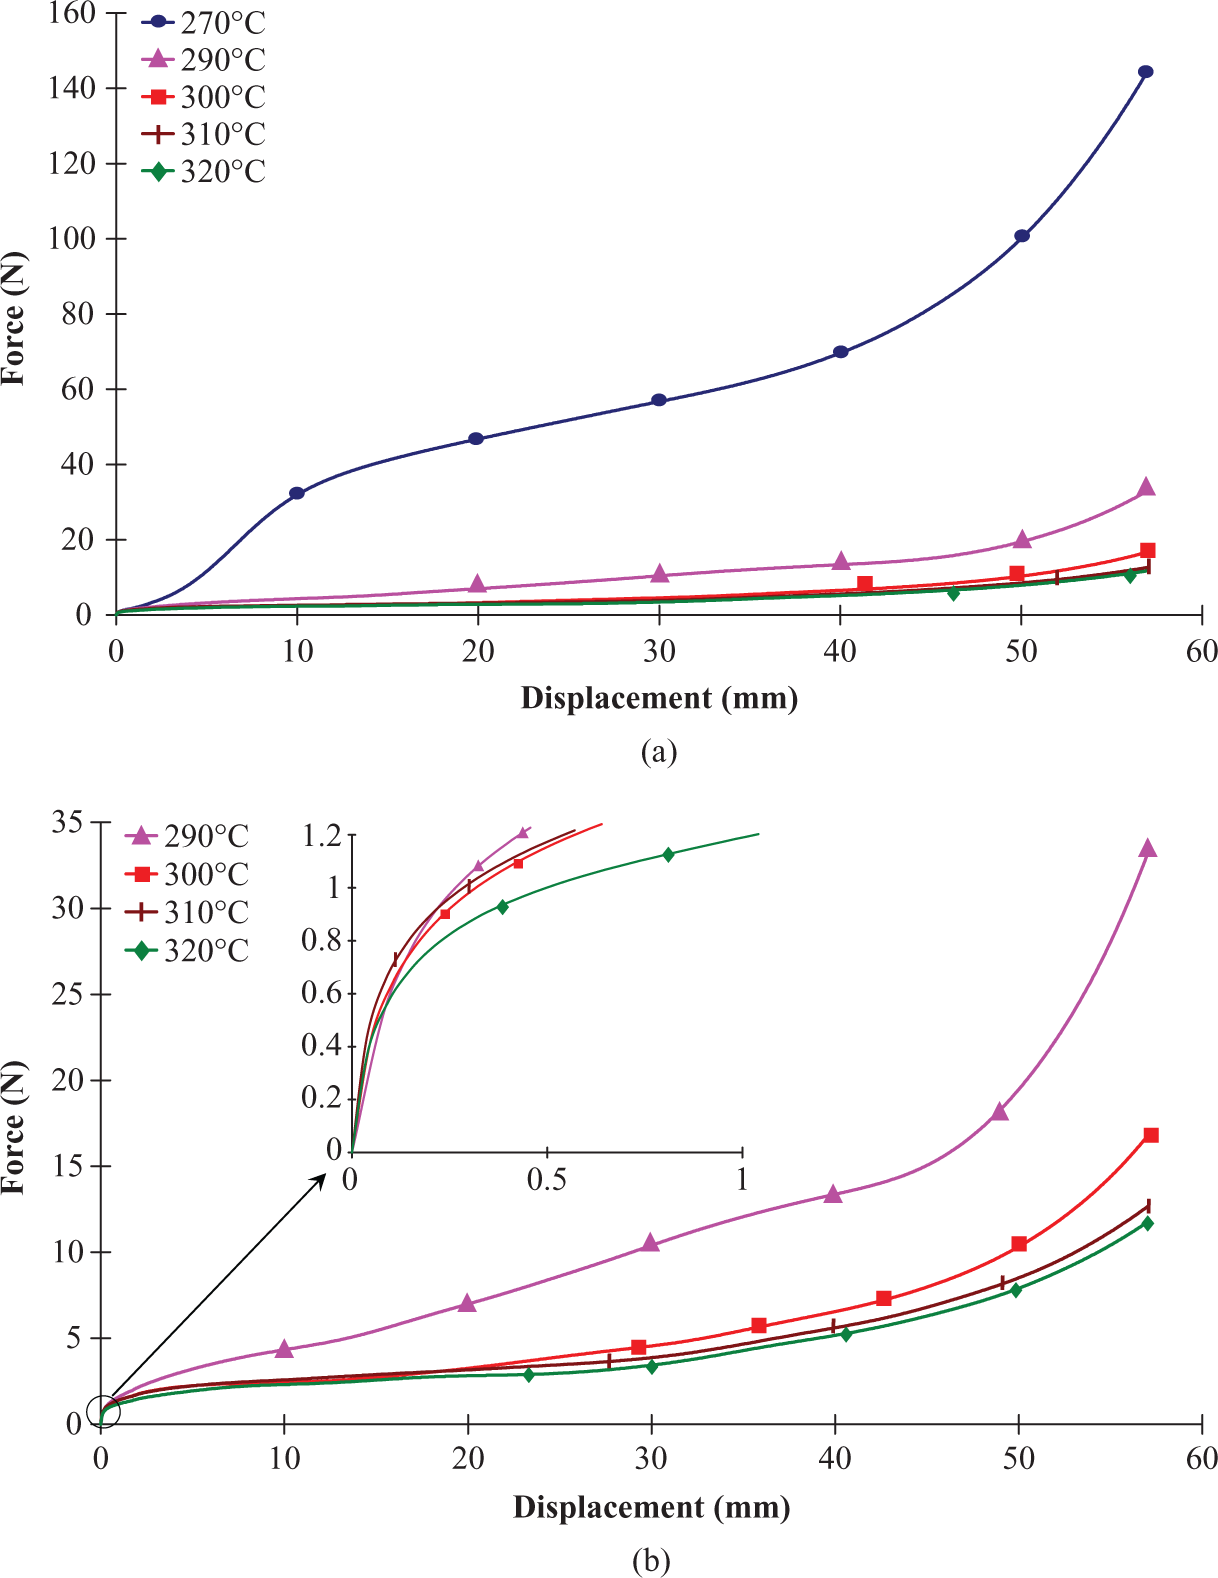
Load versus displacement curves for carbon/PPS prepreg at different temperatures: (a) at all testing temperatures and (b) at the melting conditions. PPS: polyphenylene sulphide.
In Figure 5, the curves show similar evolutions, which can be divided into three main parts. At first, a weak load is necessary to overcome the adhesive friction effects between the yarns to start the intraply shearing. Then, the in-plane shear increases under moderate forces. However, when the shear angle become larger, the load increases noticeably (the corresponding displacement is about 45 mm and the shear angle in the central zone is about 48°). This corresponds to the so-called ‘locking angle,’ although the rigidity increases rather continuously. The in-plane shear behaviour of thermoplastic prepreg materials strongly depends on the temperature. For the curve at a temperature of 270°C, the increasing in the first part is more important than for the others because PPS resin is not completely molten at 270°C. For all shear angles, the specimen at a temperature of 270°C leads to loads on the specimen that are much larger than for higher temperatures. Regarding the curves at temperatures of 290, 300, 310 and 320°C (Figure 5(b)), the first part is short. Then the load increases with the displacement with a weak stiffness until a displacement about 40–45 mm (corresponding to a 45° angle). After this, the rigidity increases strongly. The load versus displacement curves decrease when the temperature increases. The curves at a temperature of 310 and 320°C are almost identical. We observed that winkles appear for large angles in the test performed at 270°C (Figure 4(b)).
Figure 6 shows the shear-moment versus shear-angle curves. The shear-angle is calculated from equation (4). Similarly, there is a first stage where the shear moment increases rapidly until yarn sliding. Then the in-plane shear moment increases in the function of the shear angle with a fairly constant stiffness. There is no increase in the stiffness when the shear angle is large. This is due to the decrease in the width of the specimen that is taken into account in the shear moment calculation. This is the main reason for the difference in the shape between the load/displacement curves and the shear moment/shear angle curves.
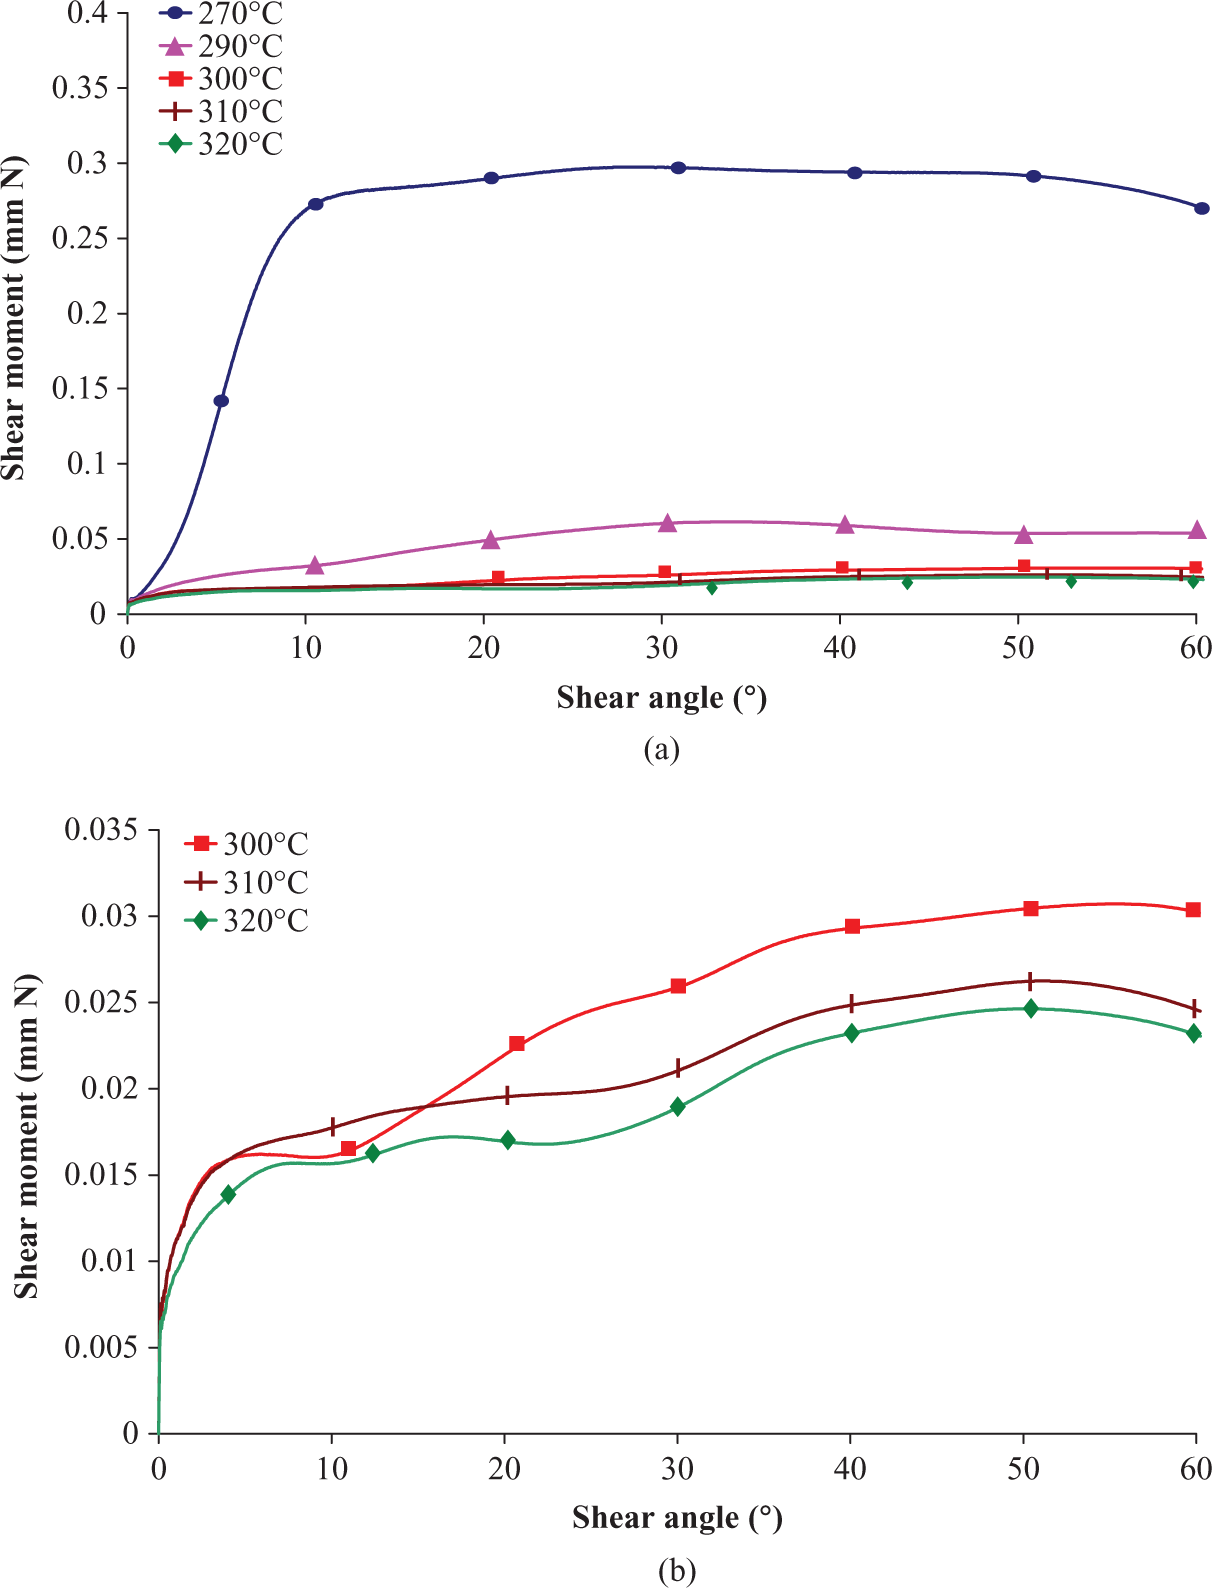
Shear moment versus in-plane shear angle curves for carbon/PPS prepreg at different temperatures: (a) at all testing temperatures and (b) at the melting conditions. PPS: polyphenylene sulphide.
The influence of strain–rate is presented in Figure 7. The temperature is maintained at 300°C and the load versus displacement curves are determined for the displacement rates equal to 15, 30 and 60 mm/min. The three curves in Figure 7 have the same profile. They show that the velocity increase leads to higher loads for a given displacement. Nevertheless, the curves are very similar until a 35-mm displacement (i.e. a 34° shear angle). Furthermore, the slope at the beginning is lower for a higher clamping velocity. The adhesion phenomenon is smaller when the strain–rate is high.
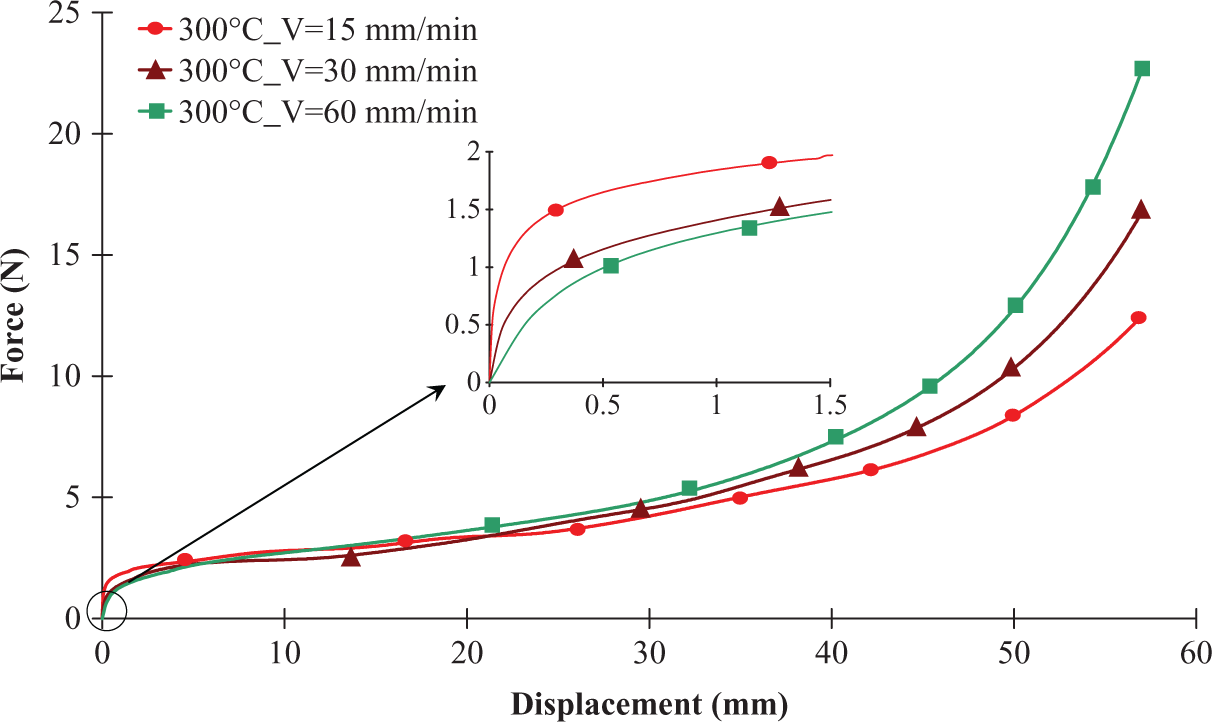
Load versus displacement curves for carbon/PPS prepreg at 300°C for different displacement rates. PPS: polyphenylene sulphide.
The shear moment versus shear angle curves are plotted in Figure 8 for the three displacement rates. Similarly, the speed increases the shear moment during the test excepted at the beginning of the test, where the effect of the speed is opposite, that is, the shear moment is smaller for high speed.
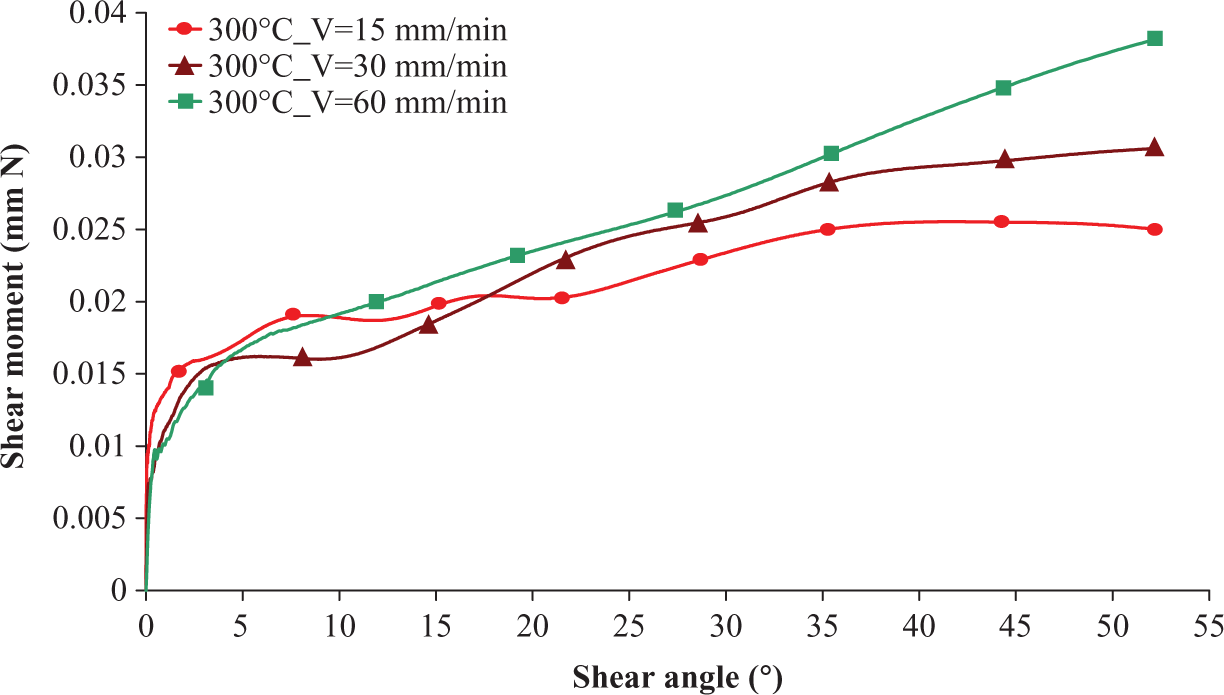
Shear moment versus in-plane shear angle curves for carbon/PPS prepreg at 300°C for different displacement rates. PPS: polyphenylene sulphide.
There is a slight increase in the in-plane shear stiffness when the displacement rate increases. This displacement rate influence can be taken into account in the simulations. Nevertheless, when the speed remains in the range of those of standard forming processes, it is possible to neglect this influence.
Each presented test was repeated three times. A good reproducibility was obtained. An example is presented in Figure 9. The curve describes the scatter in force versus displacement for carbon/PPS prepreg at 300°C for a displacement rate of 15 mm/min. The vertical bars represent the variation of the measurements. The maximum value of the scatter is 0.6 N.
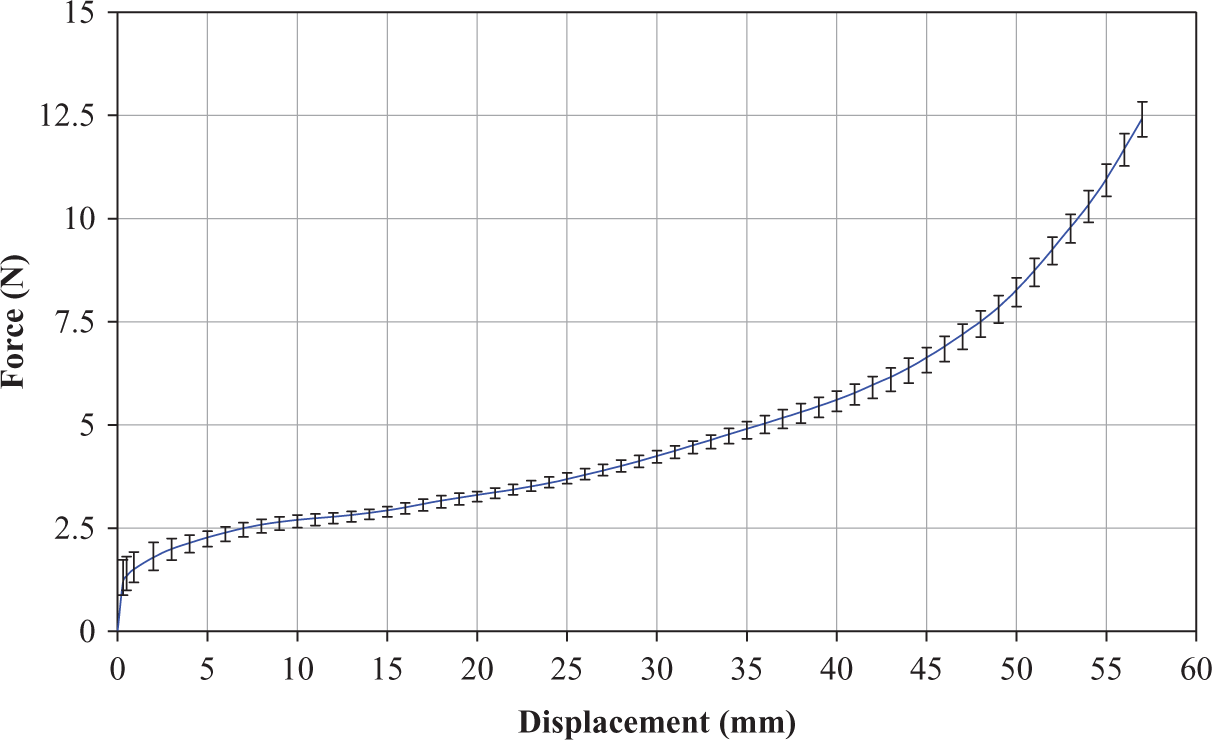
Result of the reproducibility tests for carbon/PPS prepreg at 300°C for a displacement rate of 15 mm/min. PPS: polyphenylene sulphide.
Carbon/PEEK prepreg
The load versus displacement curves for carbon/PEEK prepreg at different temperatures are presented in Figure 10. The displacement rate is constant and equal to 30 mm/min. The maximum displacement of the bias-extension tests is 57 mm (i.e. a theoretical 78.5° shear angle in the central zone). The melt temperature of PEEK is higher than the one of PPS and is equal to 343°C. As for the previous tests, it is necessary to avoid the resin oxidation during the bias-extension test at high temperatures. The temperature augmentation phase is performed at high velocity (20°C/min). Before the extension stage, the specimen temperature is stabilized during 5 minutes. As recommended by the chemical studies, the duration of the whole test for PEEK material does not exceed 28 min at 380°C or 10 min at 400°C. 42
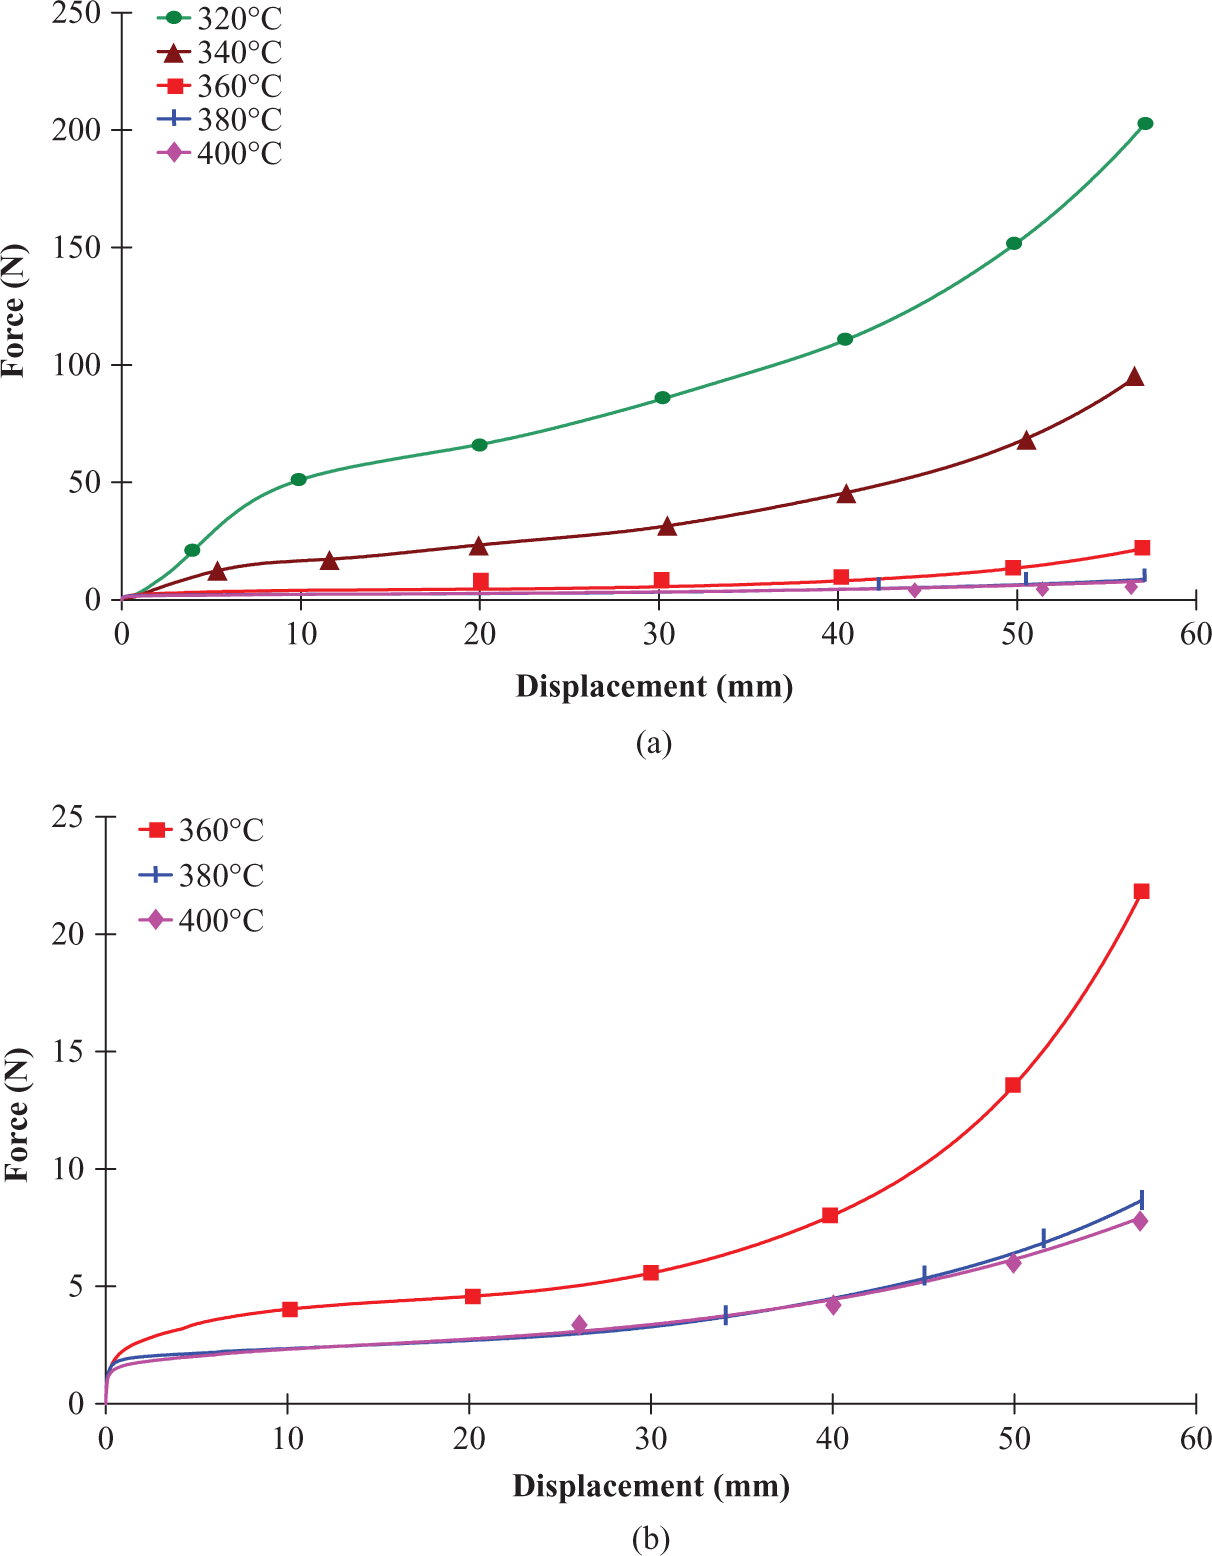
Load versus displacement curves for carbon/PEEK prepreg at different temperatures: (a) at all testing temperatures and (b) at the melting conditions. PEEK: polyetheretherketone.
The load versus displacement curves at different temperatures presented in Figure 10 have a similar shape than those of PPS prepregs. At the beginning, a small zone corresponds to the adhesion of the yarns, and then the stiffness is weak until large displacements for which the rigidity increases. The loads decrease when the temperature increases. The loads are large when the test is performed at a temperature of 320°C. The load versus displacement curves at the temperatures of 380°C and 400°C (i.e. clearly over the melt temperature) are very close.
As it has been shown for PPS in Figure 9, three tests have been carried out for each bias-test for carbon/PEEK prepreg with a similar reproductibility.
The in-plane shear moment versus shear angle curves for carbon/PEEK prepreg at different forming temperatures are shown in Figure 11. The five curves have a similar profile. As already seen in the case of the PPS prepreg, there is no increase in the in-plane shear moment when the shear angles are large (contrarily to the load) because the load increase is offset by the decrease in the thickness of the specimen.
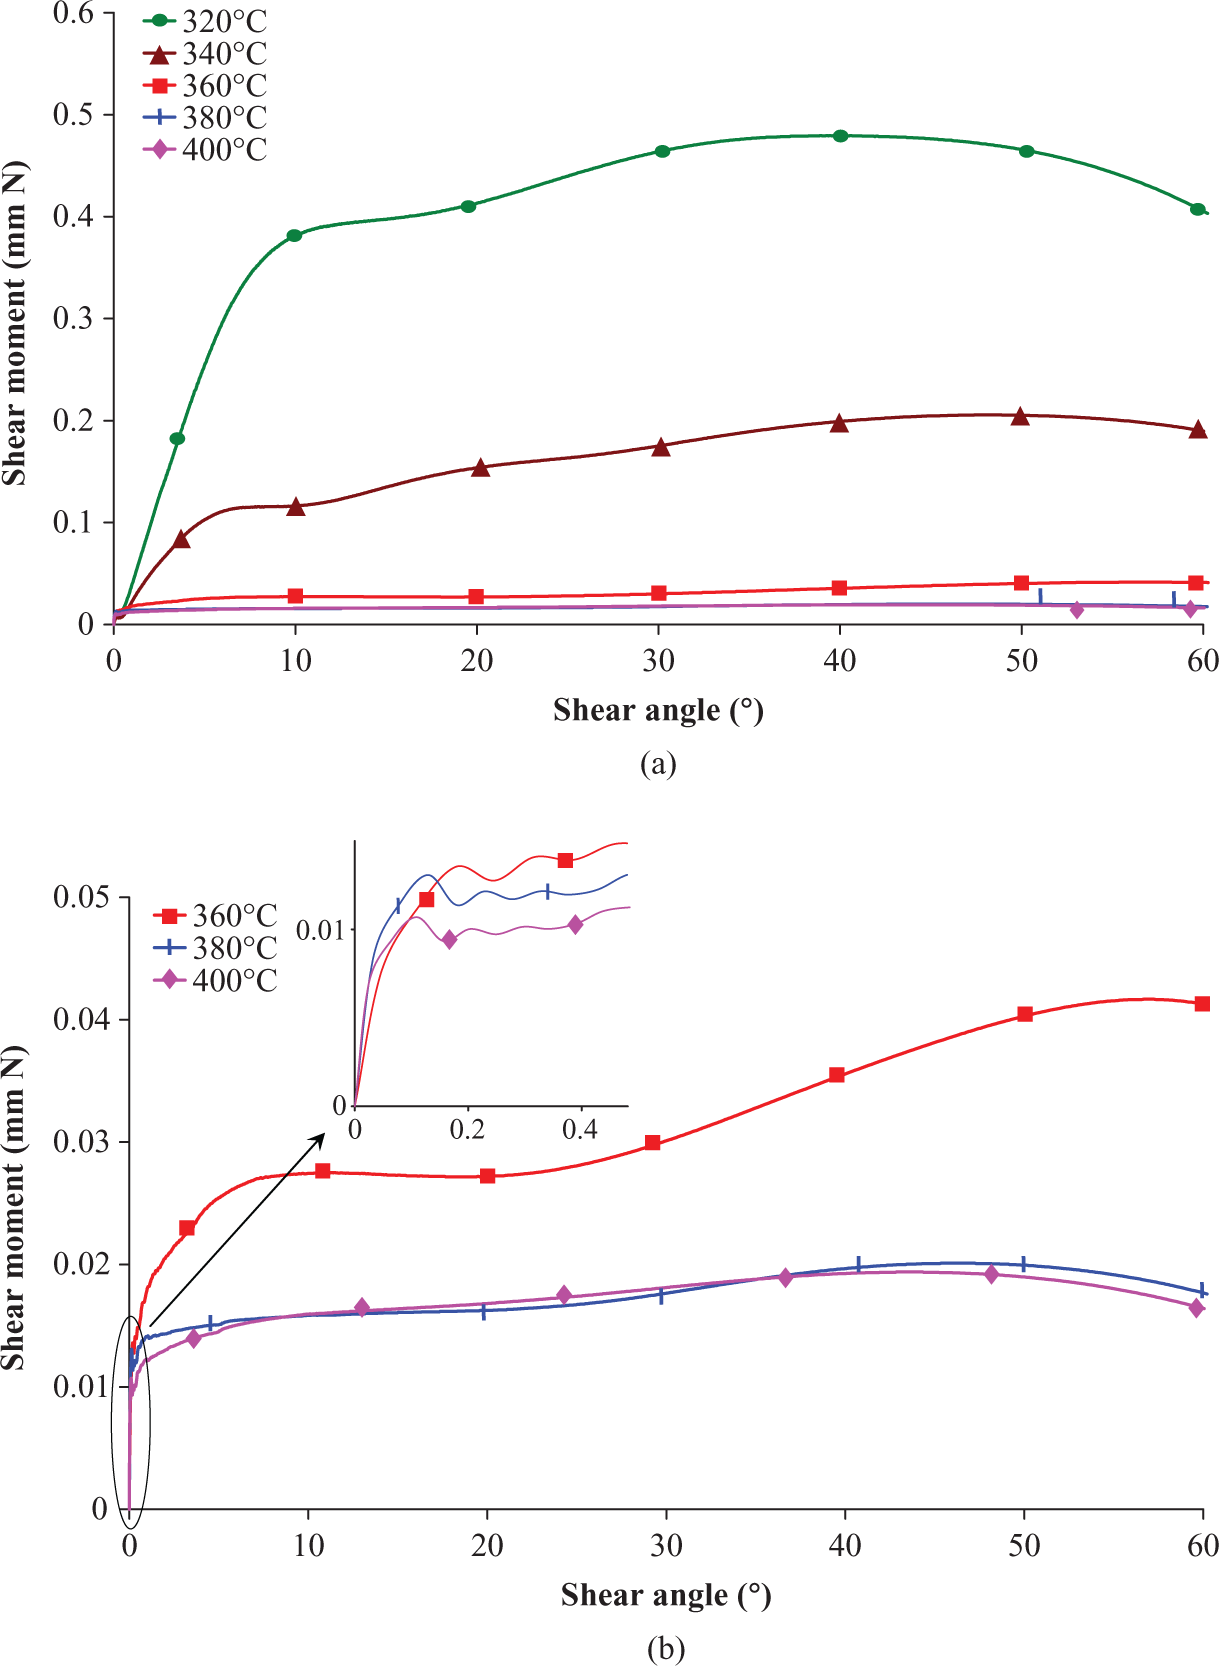
Shear moment versus in-plane shear angle curves for carbon/PEEK prepreg at different temperatures: (a) at all testing temperatures and (b) at the melting conditions. PEEK: polyetheretherketone.
The analysis of the influence of strain–rate is presented for carbon/PEEK prepreg in Figures 12 and 13. The tests are performed at 380°C for speeds of 30 and 60 mm/min. There is a moderate increase in the loads with the displacement rate. This one can be taken into account in the simulation, but in a first approximation, the influence of the speed can be neglected
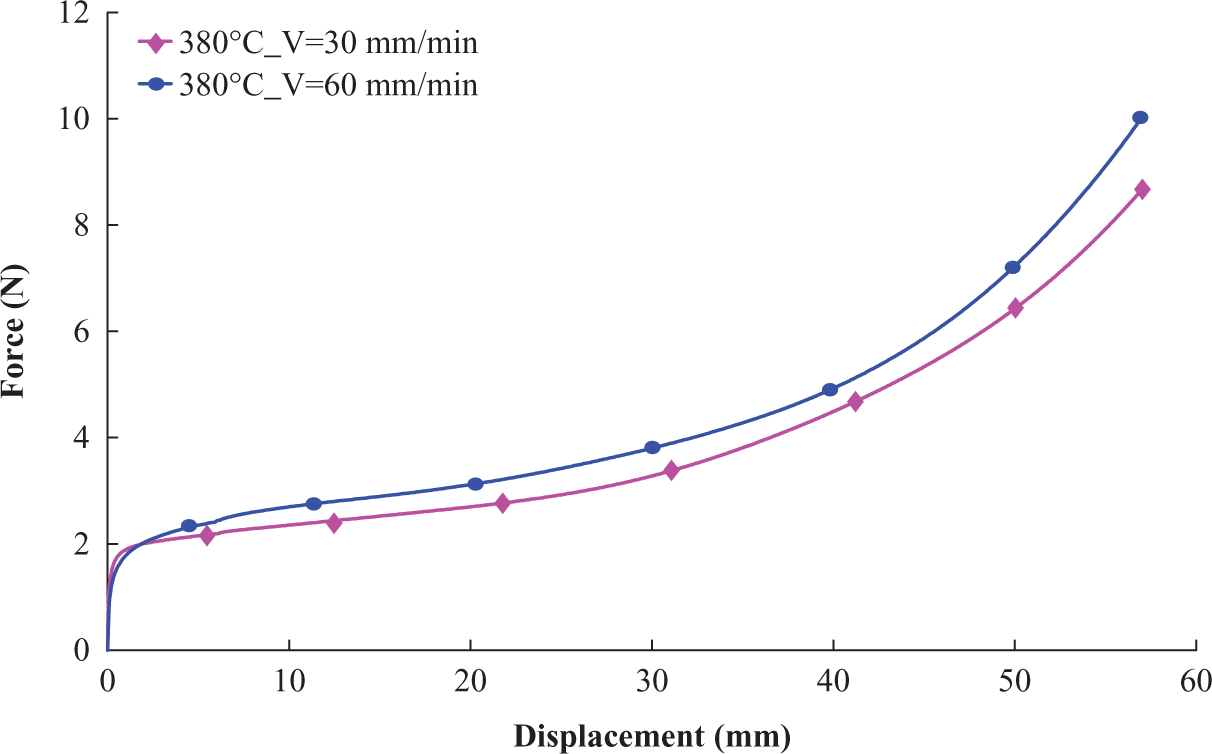
Load versus displacement curves for carbon/PEEK prepreg at 380°C for different displacement rates. PEEK: polyetheretherketone.
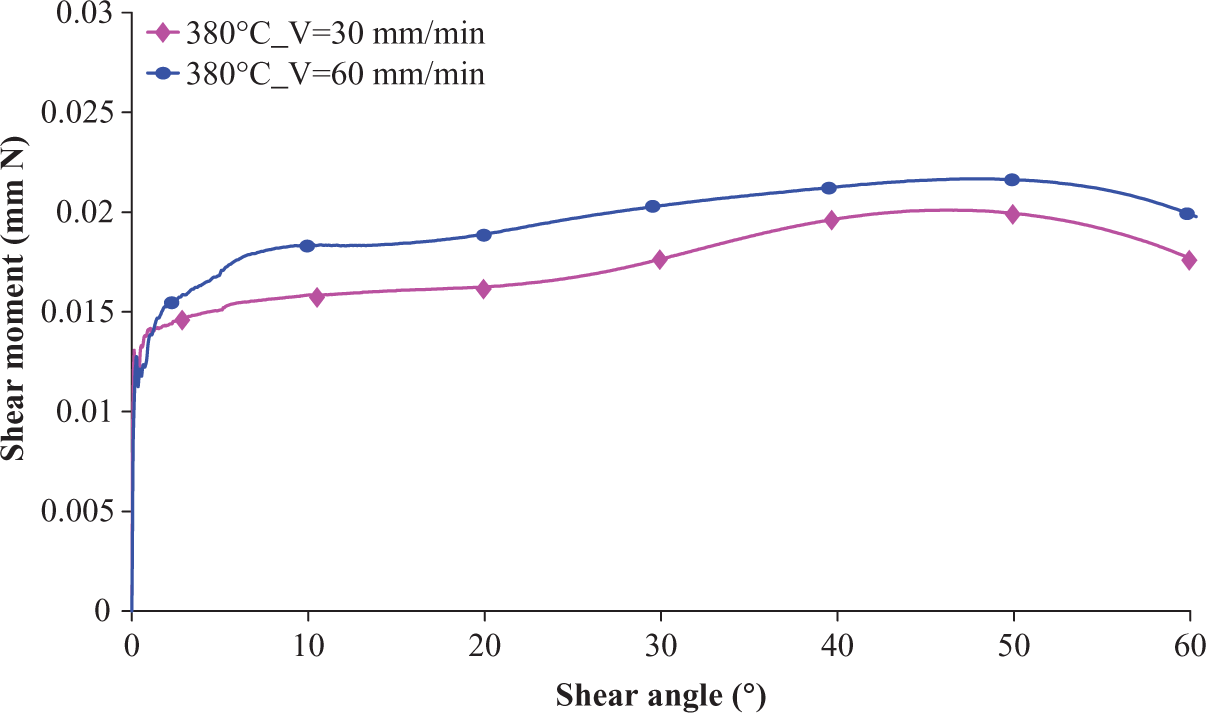
Shear moment versus in-plane shear angle curves for carbon/PEEK prepreg at 380°C for different displacement rates. PEEK: polyetheretherketone.
Forming simulation
The experiments presented in the previous sections show that the in-plane shear behaviour of thermoplastic composite prepregs is temperature dependant. The following forming simulation shows the influence of the temperature during the process.
The finite element simulation of the forming of a carbon/PPS prepreg by a cylindrical punch is performed in Figure 14 at two different temperatures. Figure 14(a) shows the geometry of the tools (punch, die and blank holders). The punch radius is 78 mm. The dimensions of the prepreg blank are 400 × 400 × 0.31 mm3 and the fibre orientation is 0°/90°. The eight blank holders apply a 0.1-MPa pressure during the forming stage.
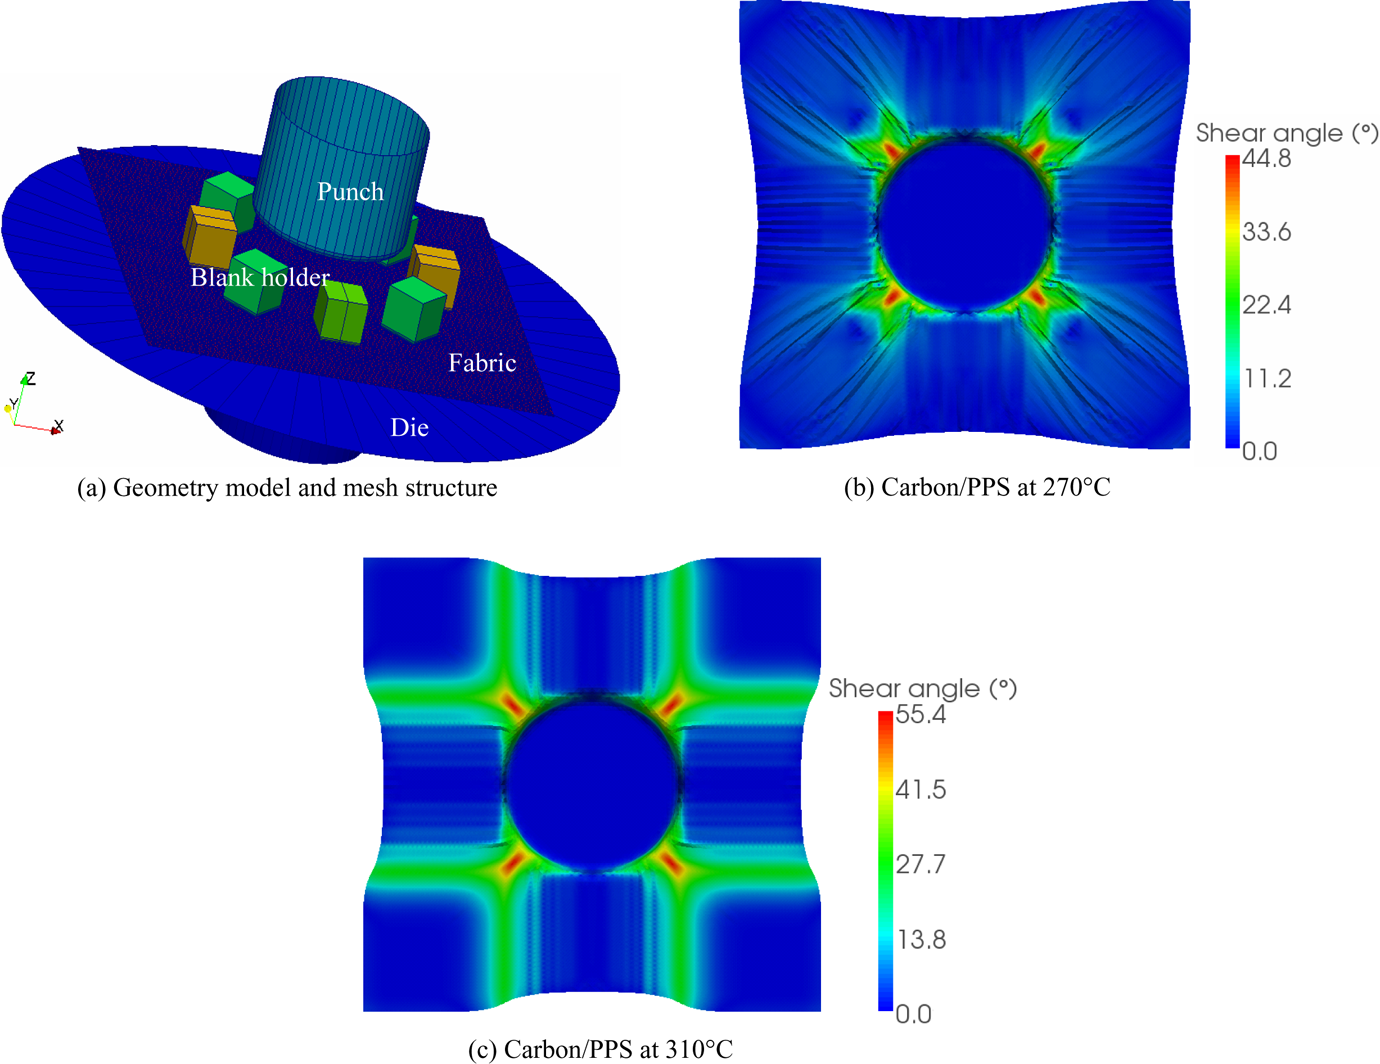
Simulation of a cylindrical forming at two different temperatures.
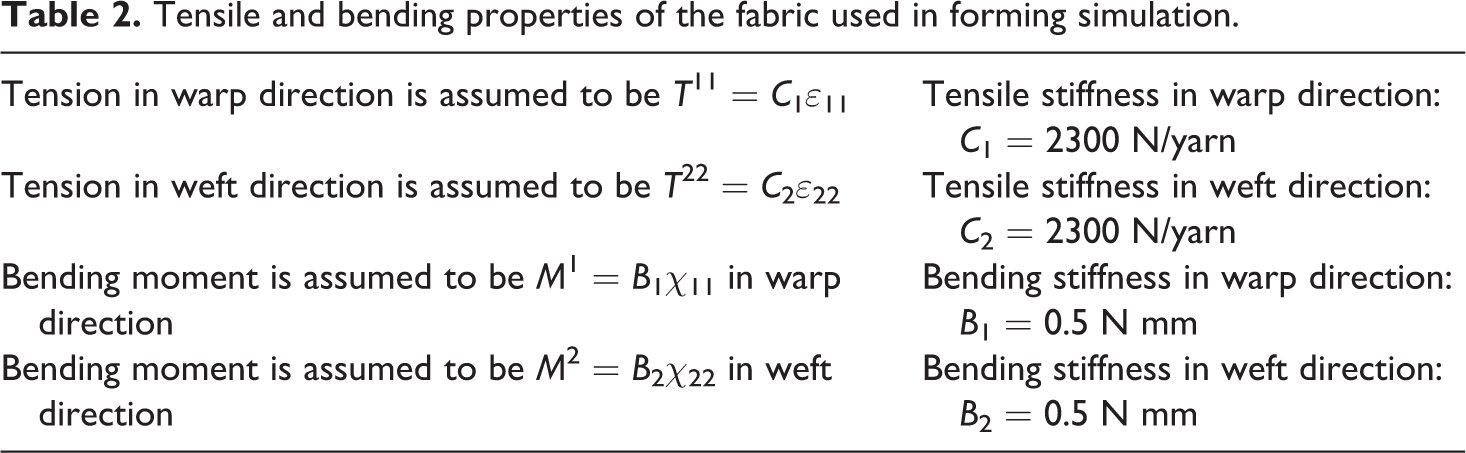
The tensile properties of woven fabrics are complex because the weaving leads to nonlinearities due to the decrease in crimp at the beginning of the loading. Furthermore, it is a biaxial phenomenon, because the warp and weft axial strains are related by the weaving. 11 –14 Nevertheless, because the carbon satin is a balanced fabric with strong tensile stiffness in both directions, the extensions in the yarn direction are very small and these tensile nonlinearities are not of main importance in the forming. For this reason, the woven reinforcement is considered as linear with the same tensile stiffness (2300 N/yarn) in warp and weft directions. The tensile and bending properties used in forming simulation are detailed in Table 2.
Tensile and bending properties of the fabric used in forming simulation.
The in-plane shear moment M
s given in function of the shear angle γ in Figures 6 and 11 was integrated into the numerical model to compute the in-plane shear internal work (equation (3)). In finite element analyses, the virtual internal work on an element e is given by the nodal internal forces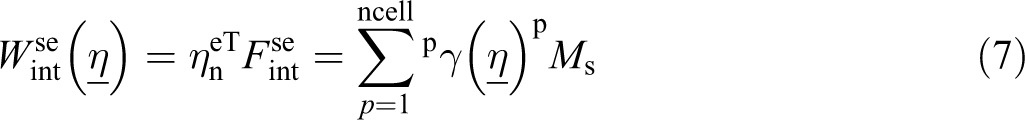
Consequently, the nodal in-plane shear interior nodal load components are (k = 1, 3; l = 1, 3)
B γkl is the components of the virtual in-plane shear–strain interpolation such as

Therefore, the current geometry of the finite element gives the in-plane shear angle that determines the in-plane shear moment by the shear curves (Figures 6 and 11) and the in-plane shear internal nodal forces that are used in the current step of the computation. Details are given by Hamila et al. 8,9
Figure 14(b) and (c) presents the deformed blank in case of two forming simulations corresponding to a 30-mm displacement of the punch. The temperature of the process is fixed at 270 and 310°C (it is assumed to be constant in the blank). The two deformed shapes are different. The maximum shear angle is 44.8° in case of forming at 270°C and 55.4° at 310°C. Furthermore, numerous wrinkles can be observed when the forming simulation is performed at the temperature of 270°C. On the contrary, no wrinkling was observed in the simulation at a temperature of 310°C.
These simulations show that a moderate difference of temperature can lead to important modification of the result of a forming process. For simplicity reasons, the temperature has been assumed to be constant in the part. It is generally not the case and the simulation of a forming process is a thermomechanical problem. Both the temperature and the displacement fields must be computed. The calculated temperatures determine the in-plane shear properties and consequently strongly influence the results of the forming simulation (in particular the wrinkle onset).
Conclusion
The results of shear tests performed on 5-harness satin/PPS and PEEK prepregs using a bias-extension apparatus were described in this article. The tests have been performed for different temperatures below and above the melt temperature. These temperatures are the representatives of those of the different zones of a composite part during a forming process.
Although the studied temperature range is not very large, the in-plane shear properties change much with the temperature in the vicinity of the melt temperature. In particular, when the temperature is 25°C lower than the melt temperature, the shear behaviour is much more rigid. For higher temperatures, the loads decrease with the temperature. On the other hand, when the temperature exceeds the melting point, the load–displacement curve and the in-plane shear behaviour tend to a limit.
The shape of the load versus displacement curves presents three zones. A first small one is due to the adhesion of the yarns, in a large second one, the shear stiffness is small and the load increases slowly with the displacement. Finally, there is an increase in the stiffness due to lateral contact of the reinforcement yarns. The shear moment versus shear angle curve does not present this increase because of the width decrease in the specimen.
A forming simulation example has shown that a too low temperature of the prepreg during the process can lead to wrinkling. The knowledge of the in-plane shear curves for different temperatures allows to determine, by simulation, the feasibility conditions of a forming process without wrinkling.
This study concerns the in-plane shear properties of thermoplastic prepregs. In a future work, the characterization of bending and tensile properties of thermoplastic prepreg at different temperatures will analysed.
Footnotes
Funding
The research work reported in this article was supported in the scope of the project CRISTAL (CRISTAL: Collaborative Project French Ministry of Industry avec le concours des partenaires Armines, Atmostat, Carbone Forgé, CARMA, Daher, EADS IW, Eurocopter, INSA Lyon, MBDA, Schappe Techniques, Snecma, Université de la Méditerranée et avec le soutient financier du Ministère de l’Économie, de l’Industrie et de l’Emploi (DGCIS), des collectivités locales région Rhône Alpes, Conseils Généraux 01 et 06 et du FEDER).