
Abstract
The effects of microfiller addition on the flexural properties of carbon fiber reinforced phenolic (CFRP) matrix composites were investigated. The CFRP was produced using colloidal silica and silicon carbide (SiC) microfillers, 2 D woven carbon fibers, and two variants of phenolic resole (HRJ-15881 and SP-6877). The resins have the same phenol and solid content but differ in their viscosities and HCHO (formaldehyde) content. The weight fractions of microfillers incorporated into the phenolic matrix are 0.5 wt.%, 1 wt.%, 1.5 wt.%, and 2 wt.%. Flexural properties were determined using a three-point bending test and the damage evolution under flexural loading was investigated using optical and scanning electron microscopy. The results indicated that the reinforcement of phenolic resins with carbon fibers increased the flexural strength of the HRJ-15881 and SP-6877 by 508% and 909%, respectively. The flexural strength of the CFRP composites further increased with the addition of SiC particles up to 1 wt.% SiC but decreased with further increase in the amount of SiC particles. On the other hand, the flexural modulus of the CFRP composites generally decreased with the addition of SiC microfiller. Both the flexural strength and flexural modulus of the CFRP did not improve with the addition of colloidal silica particles. The decrease in flexural properties is caused by the agglomeration of the microfillers, with colloidal silica exhibiting more tendency for agglomeration than SiC. The fractured surfaces revealed fiber breakage, matrix cracking, and delamination under flexural loading. The tendency for failure worsened at microfiller addition of ≥1.5 wt.%.
Keywords
Introduction
Phenolic resins are formed by the condensation reaction between phenolic and formaldehyde and have remained a candidate material for the fabrication of fiber-reinforced plastic for structural applications for over 90 years.1,2 There are two categories of phenolic resins, namely, resoles and novolak. Resoles are the preferred phenolic resin composition for the manufacture of fiber-reinforced composites, while novolak is the preferred resin for phenolic molding materials. 2 Phenolic is a choice material for many structural applications owing to its excellent mechanical properties (especially when reinforced with fibers), good thermal resistance, excellent flame retardance, nontoxic combustion products, and relatively low cost. 1 Fiber-reinforced composites with phenolic matrix are used for structural applications in floor panels of aircraft, cabin furnishings, aircraft engine compartments, ballistics application, and oilfield grating.1,3
Phenolic resin is one of the most widely used thermosetting resins for carbon/carbon composite manufacture because it has suitable viscosities for the impregnation of fiber preforms. In addition, it has a sufficiently high carbon yield for the manufacture of carbon/carbon composites with a density of 1.9 g/cm3.3,4 Due to its high carbon yield, phenolic resin is commonly used in the production of carbon/carbon composites via the polymer infiltration and pyrolysis (PIP) process. This is a three-stage process that starts with the manufacture of carbon fiber reinforced plastic (CFRP) using phenolic resole as the matrix. The second stage involves pyrolysis of the CFRP to convert the phenolic resin to amorphous carbon. Evaporation of the volatile content of the phenolic resin leads to a porous carbon-carbon composite, which is densified in the final stage by repeated cycles of impregnation with phenolic resins and subsequent pyrolysis.
The mechanical performance of fiber-reinforced plastics can be enhanced by dispersing microfillers in the polymer matrix. 5 However, the main drawback of the microfiller addition is their agglomeration, which occurs as they adhere to one another due to the van der Waals forces between the particles. A perfect dispersion of different micro or nanofillers in different types of polymer matrices could be very challenging and different tools are used to achieve this. Factors such as physical (solid or liquid) and chemical (thermoplastic or thermoset) states of the polymer matrix, dimensions and content of micro or nanofillers to be added, availability of techniques, and fabrication processes are taken into account when selecting a proper technique for fillers dispersion. 6 Some of the methods employed in dispersing fillers in the polymer matrix include sonication, magnetic stirring, calendering, and ball milling.5–11 The main drawback of sonication is that it is not suitable for highly viscous liquids. However, the sonication process can be aided by using a suitable solvent as a dispersion medium. 5 The dispersion solvent is selected for two main reasons: (1) low viscosity and (2) the ability to lower the viscosity of polymer matrix before polymerization. With the decreased viscosity, the dispersion state of the filler can be improved during the sonication process. Using a combination of dispersion techniques such as sonication and magnetic stirring can further promote homogenous distribution and ensure dispersion of the fillers within the polymer matrix, as opposed to using a single dispersion technique. 5 Atif et al. 5 recommended combining the magnetic stirring technique with ultrasonication. In another, Agbura et al. 12 used dispersion techniques such as sonication, three roll mill (calendering), and magnetic stirring in different combinations to promote nanoclay particle dispersion in epoxy resin.
Previous studies have focused on the ablation resistance of carbon fiber reinforced phenolic (CFRP) composites containing filler materials such as carbon nanotubes (CNTs), 13 graphene, 14 graphene oxide, 15 metal or alloy particles,16,17 nano-clay, 18 ceramic particles, 19 borosilicate glass 20 and nano-silica. 21 Other authors22,23 studied the tribological behaviour of phenolic resin modified with carbon fiber and nano-TiO2, respectively. Pelin et al. 24 investigated the effect of reinforcement with silicon carbide nanoparticles (0, 0.5, 1, and 2 wt.%) on the flexural properties of phenolic. They reported optimization of flexural properties of phenolic with 1 wt.% silicon carbide reinforcement. Kaushik et al. 25 studied morphology and mechanical properties of phenolic reinforced with montmorillonite clay. The fraction of montmorillonite clay in the resin are 0, 0.2, 0.4, 0.6, 0.8, 1, 2 and 4 wt.%. It was observed that the addition of 0.8 wt.% of montmorillonite clay gave the optimum flexural properties. Srikanth et al. 26 studied the addition of zirconia (3.5, 6.5, and 9.5 wt.%) and CNTs (0.5 wt.%) on the mechanical properties of carbon fiber reinforced phenolic composites. Optimum flexural strength was obtained with 0.5 wt.% CNTs while the addition of zirconia did not improve the flexural strength. Sekhar et al. 27 studied the mechanical and thermal properties of phenolic resin modified with natural graphite and graphite bisulfate. Graphite bisulfate was added at 0.1, 0.5, and 1 wt.% addition, while 1 wt.% natural graphite particles were added to the phenolic resin. When compared to the non-modified phenolic resin, the authors reported that optimum flexural strength was obtained with the addition of 1 wt.% graphite bisulfate. On the other hand, flexural strength of the phenolic decreased with natural graphite addition.
SiC has excellent properties such as high-temperature oxidation resistance, thermal shock resistance, superior wear properties, and considerable electron mobility. 28 As a result, they are used in high-temperature applications such as rocket injector grooves and nano-devices such as semiconductor wafers. Colloidal silica, which refers to concentrated stable dispersions of sols made of discrete, dense particles of amorphous silica, 29 has excellent wear resistance. Consequently, they are used as an abrasive in silicon wafers and as an ingredient in ceramic coatings. Improvement in the ablation resistance of CFRP composites and flexural properties of phenolic resin with the incorporation of these filler materials have been well documented in the literature.24–27 However, there is limited information on the mechanical properties of fiber-reinforced phenolic containing these particles within the phenolic matrix. Obviously, there is a great need to develop CFRP composites with superior service lives and long-term durability. Therefore, an understanding of their performance is essential. The aim of this study is to bridge this knowledge gap by investigating the possibilities of enhancing the flexural properties of carbon fiber reinforced phenolic matrix composites through microfiller addition, using colloidal silica and silicon carbide. This would be of great importance whether the CFRP composites are intended for use in structural application or used as base materials in the manufacture of carbon/carbon composites.
Materials and methodology
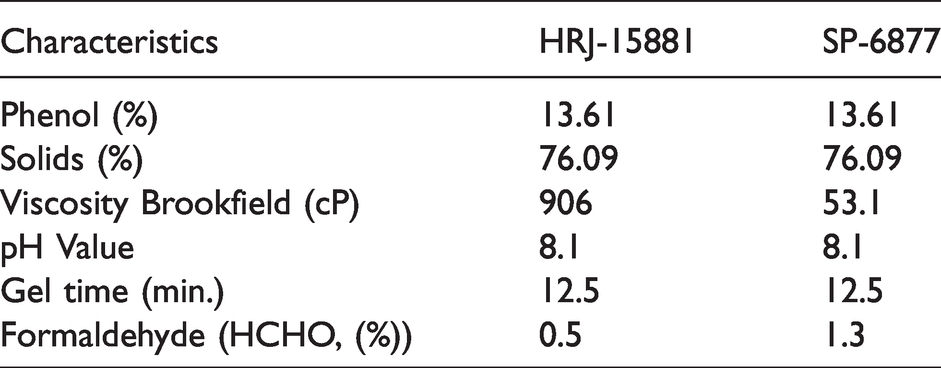
A 3 K, 2x2 twill weave carbon fiber fabric purchased from Fibre Glast Developments Corporation (Brookville, Ohio, USA) was used as reinforcement for the fabrication of the carbon fiber reinforced phenolic matrix (CFRP) composite in this study. The average thickness of each carbon fiber fabric layer is 0.305 mm. Two variations of phenolic resin (resole) supplied by SI Group (Schenectady, New York, USA) was used in this study, with product number HRJ-15881 and SP-6877. Parameters of the resoles are indicated in Table 1, as provided by the manufacturer. Colloidal silica (406), manufactured by West System Inc. (Michigan, USA), and silicon carbide (SiC) produced by Washington Mills (Massachusetts, USA) were used as microfillers for property enhancement of carbon fiber reinforced phenolic in this study. The colloidal silica consists of sand and quartz microparticles with an average particle size of 0.2–0.3 µm and a density of 50 g/L. The SiC has a density of 3.19 g/cm3 and a particle size of 0.3–2.2 µm, as obtained from the carborex safety data sheet.
Chemical analysis for the phenolic resins used in this study.
Dispersion of microfillers in the phenol resoles
The 406 colloidal silica was mixed with polyethylene glycol (PEG) (Carbowax™ PEG-400) supplied by Fisher Chemical, Canada, to form a shear thickening fluid (STF). Shear thickening is an increase in viscosity when the shear rate during mechanical deformation increases to a critical value. 30 The most studied STF is based on the suspension of silica in PEG. 31 The PEG used is made of carbowax with the chemical formula (C2H4OnH2O). Its density is 1.13 g/ml, and has low volatility and good thermal stability. 32 The STF was produced as described by Haro et al.; 32 The Carbowax™ PEG-400 and the colloidal silica were mixed in a ratio of 2:1 and stirred using a magnetic stirrer at 1200 rpm for 3 h at room temperature. After preparation, the STF was then diluted with ethyl alcohol using a ratio of 3:2 and held for 2 h. This mixture was then added to the phenolic resin in appropriate proportions to obtain 0.5, 1.0, 1.5, and 2.0 wt.% of the colloidal silica in the phenolic resin. As an additional step to promote colloidal silica dispersion in the phenolic resin, the mixture was subjected to mechanical magnetic stirring at 1200 RPM for 1 h. This was followed by ultrasonication in a bath using Branson 1510 ultrasonicator for 1 h.
Fine SiC particles were first weighed in appropriate proportions to obtain 0.5, 1, 1.5, and 2 wt.% in the composites. The SiC particles were then mixed with 5 ml ethanol (absolute) to produce composites containing 0.5 wt.% SiC. The volume of ethanol mixed with SiC particles was increased to 6, 7, and 8 ml for composites containing 1, 1.5, and 2 wt.% SiC particles, respectively, to ensure good dispersion of the SiC particles in the ethanol. The essence of the ethanol absolute is to serve as a dispersant for the SiC in the phenolic resin. It is expected that the ethanol will evaporate as the resole is heated during the curing process leaving behind well-dispersed SiC particles in the phenolic resin matrix of the resulting CFRP. The SiC particles mixed with ethanol were then subjected to ultrasonication using a Branson 1510 ultrasonicator for 30 minutes. The ultrasonicated SiC with ethanol was then mixed with the phenolic resin. Afterward, this mixture was subjected to further ultrasonication for 1 h. The mixture was subsequently subjected to magnetic stirring at 1200 RPM for 1 h. The ultrasonication and the magnetic stirring methods complement one another and promote the homogenous dispersion of the microfillers. The order in which they are done should not affect the microfillers dispersion.
Fabrication of CFRP composites
A mold with a rectangular internal cavity having a dimension of 170 mm x 60 mm x 3.5 mm was used to manufacture the flexural test specimens of CFRP composites. The molds were fabricated at the University of Saskatchewan engineering workshop. The composite fabrication procedure consisted of cutting the carbon fiber fabric into rectangular pieces with dimensions of 160 mm x 60 mm. The number of carbon fiber fabric layers 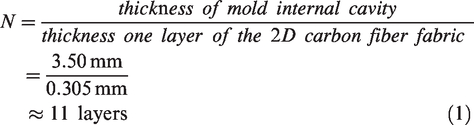
Slide Epoxease mold release lubricant #40614 N manufactured by Infotrac was sprayed on the internal cavity of the mold and was left to dry for 25 minutes. The mold release lubricant aided the easy removal of the CFRP from the mold after manufacturing. Eleven layers of the carbon fiber fabric were stacked together inside the mold cavity. The previously mixed phenolic resins with microfillers were infiltrated into the mold cavity. The mixture slowly impregnated the carbon fiber preform inside the mold cavity with the aid of the gravitational force until the filler-impregnated resin has filled all the voids inside the carbon fiber preforms.
The mold containing resin-impregnated carbon fiber preform was cured using a Parr 4848 pressure reactor autoclave. Using the ramp and soak programming of the autoclave, curing was done by heating the resin at 2 °C/min from room temperature to 120 °C. It was held at 120 °C for 1 h and was subsequently allowed to cool down to room temperature. Curing was done under an argon gas atmosphere under a pressure of 50 bar to ensure the elimination of gaseous by-products of polymerization reactions during curing and thereby reduce the porosity of the CFRP.
Materials characterization
Thermogravimetric analysis
Thermogravimetric analysis (TGA) was carried out using TA instrument model Q5000 (New Castle, Delaware, USA), to evaluate the thermal stability and determine the appropriate curing temperature for the phenolic resin. Each scan was performed in an open platinum pan from room temperature to 1000 °C, using a heating rate of 10 °C/min in a nitrogen gas atmosphere. The flow rate of the balance gas and sample gas are 10.0 ml/min and 25.0 ml/min, respectively. About 30 mg of each sample (HRJ-15881 and SP-6877) phenolic resin was used for the analysis. The mass-loss rate in wt.% was obtained, and the derivative TG (DTG) data (%loss/°C) was calculated from the mass loss data.
Fourier transform infrared spectroscopy (FTIR) analysis
The FTIR uses an infrared absorption spectrum to identify the chemical bonds in the phenolic resin. The spectra produced a profile of the phenolic resin, which is a distinctive molecular fingerprint that can be used to screen the phenolic resin for its functional group. The spectra also provide information on the corresponding covalent bonding. A Renishaw Raman inVia Reflex Microscope (Renishaw Inc, West Dundee, IL) coupled to a Smiths IllumminatIR II™ spectrometer equipped with a diamond attenuated total reflection (ATR) with a capacity of 36X objective was used to obtain the FTIR spectra. The FTIR data were acquired at a resolution of 4 cm−1 and 512 scans per sample and a wavelength range of 4000 – 600 cm−1.
Flexural tests (3-point bending test)
An Instron™ universal testing machine (Model 5500 R manufactured by Norwood, MA, USA) equipped with a load cell capacity of 5 kN was used to perform the three-point bending test according to ASTM D790-17 standard.
33
The dimension of the rectangular tests specimens is 127.0 mm × 12.8 mm × 3.5 mm with a span to depth 
Microstructural Examination
The bulk rectangular plate of CFRP was first sectioned into long strips using a Buehler abrasive cutter (Model 95, C1800) with a water-cooling system. Rectangular specimens cut from the long strips were pre-ground using 320, 500, 800, and 1200 SiC grit emery papers. This was followed by fine grinding using 2000 and 4000 SiC grit emery papers. The final polishing of the samples was done using 5 µm MD-Dac cloth with 5 µm MD-Dac suspension and 1 µm MD-Nap cloth with 1 µm MD-Nap suspension. Optical microscopy was done using a Nikon Eclipse MA 1500 microscope (Melville, New York, USA) coupled with PAX-it software. JEOL-JSM-6010LV (Peabody, MA, USA) scanning electron microscope (SEM) was used for electron microscopic investigation of the polished surface, at an accelerating voltage of 20 kV. The secondary electron (SE) imaging mode was used to obtain the SEM images. Before acquiring the images, the SEM specimens were gold-coated using an Edward S150B sputter coater (BOC Edwards, UK) to prevent charging and improve image quality.
Statistical analysis
Statistical analysis was done using SPSS Statistics 26 software. One-way analysis of variance (ANOVA) with a level of significance of 5% (i.e. 95% level of confidence) was carried out to analyze the effect of microfillers addition on the flexural strength and modulus of the manufactured carbon fiber reinforced phenolic matrix composites.
Results and discussion
Functional groups identification
The FTIR spectra of the HRJ-15881 and SP-6877 phenolic resins are presented in Figure 1(a) and (b) respectively. The corresponding wavenumbers of the peaks are shown in Table 2. The assignment of characteristics absorbance peaks of the spectrum was done based on relevant literature.25,34,35 These peaks helped in identifying the functional groups present in the phenolic resins used in this study.
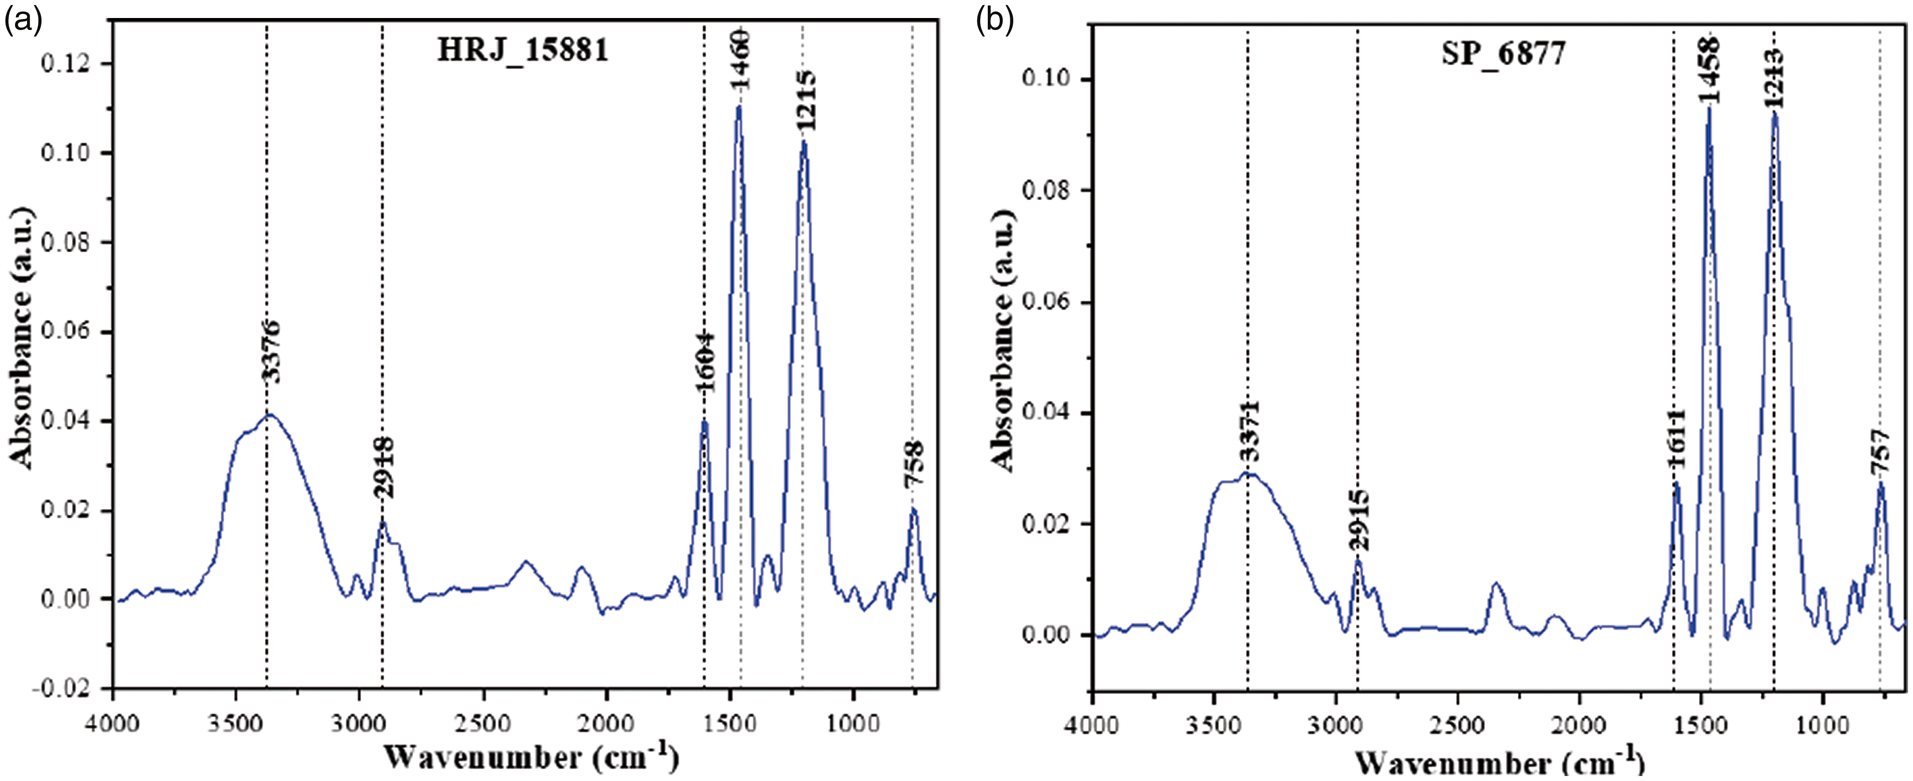
FTIR spectra obtained for the cured phenolic resins.
FTIR spectra functional group assignment.
A blank (empty scan) was run before running the FTIR scans of the phenolic resins, and the reported infrared (IR) spectrums have been background corrected. From Table 2, it could be observed that the wavenumbers for both phenolic resins are similar and consistent with the wavenumbers obtained from literature. The SP-6877 and HRJ-15881 resins both have broad peaks at 3371 and 3376 cm−1, respectively. The absorbance intensity is higher in HRJ-15881 than SP-6877, while the appearance of both peaks is attributed to phenolic-OH stretch. The appearance of mildly sharp peaks at wavenumber 2918 and 2915 cm−1, for HRJ-15881 and SP-6877, respectively, is attributed to C-H stretch. However, the absorbance peak band is higher for HRJ-15881 than SP-6877. Similarly, for other peaks, the wavenumbers for the phenolic resins are in an acceptable range with one another, and with the wavenumbers obtained from the literature. Furthermore, the functional groups attributed to these wavenumbers are shown in Table 2 as well. From the FTIR spectra, it can be inferred that the structure of the cured phenolic matrix in the carbon-phenolic composite is primarily due to methylene bridged phenolic units. 36 Although the two investigated phenolic resins (HRJ-15881 and SP-6877) have the same phenol and solid contents, they only differ in their viscosity (before curing) and formaldehyde (HCHO) content. The slight differences in the peak intensities may be due to the difference in the formaldehyde content of the resins.
Thermal analysis
The TGA and DTG provided information about the thermal stability and the trend of the decomposition process as the temperature of the applied resin increased from room temperature to 1000 °C. The TGA and DTG plots of the as-received phenolic resins are presented in Figures 2 and 3, respectively, while Table 3 shows the cumulative thermal mass loss at different temperature ranges for both phenolic resins used in this study.
TGA plots obtained for the as-received phenolic resins.
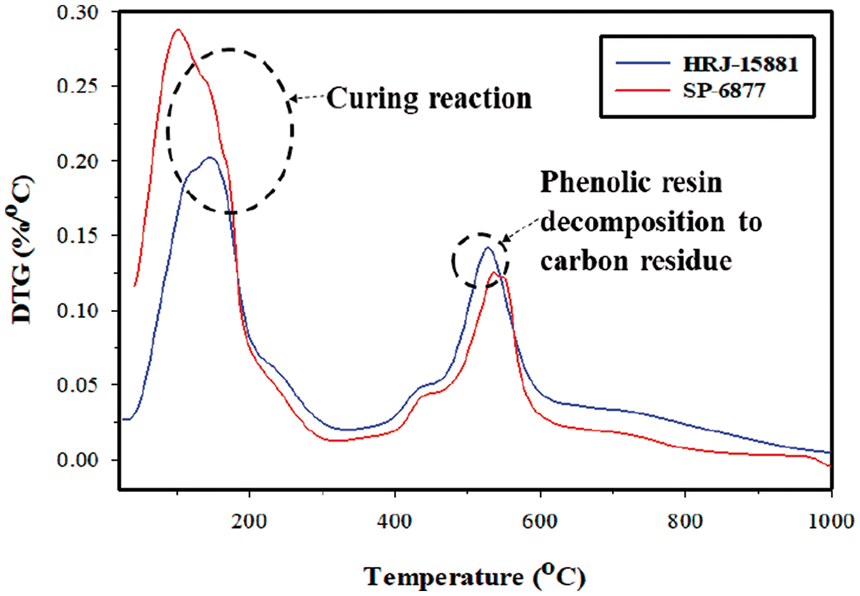
DTG plot obtained for the phenolic resins.
Cumulative thermal mass loss obtained for the resins.
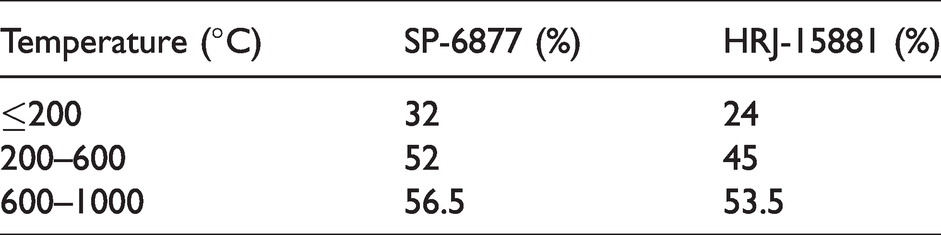
From the TGA plot, both phenolic resins experienced appreciable mass loss in the temperature range from room temperature to 200 °C. However, SP-6877 resin experienced a mass loss that is 8% higher than that of the HRJ-15881 resin in this temperature range. This high mass loss for both resins at a temperature of less than 200 °C can be attributed to the evaporation of the solvent and other volatile materials in both resins. From the DTG plots, there are two prominent peaks for both resins; the first peak lies in the temperature range of 100–130°C while the second lies in the range 460–550°C. The first peak is due to the curing reaction, while the second peak is due to the decomposition of the phenolic resin leaving behind a carbonaceous residue.36–38 According to De Souza et al., 37 there are no significant molecular size changes up to 350 °C; only small molecular bridge transformations occur because of the release of volatile free molecules, notably water and phenol. As the curing reaction started, the increase in these activated volatile free molecules gave rise to the monotonic increase in the DTG curve until it got to the maximum temperature of 100–130°C for both phenolic resoles. As shown in Table 1, both phenolic resins have equal phenol content (13.61%). However, the HCOH (%) content of the SP-6877 is 2.6 times that of the HRJ-15881 and the viscosity of HRJ-15881 is 17 times that of SP-6877. These indicate that there are more solvent content in the SP-6877 resole than in the HRJ-15881. So, the more mass loss experienced by the SP-6877 at temperatures ≤200°C (see Table 3) is due to its greater solvent content than the HRJ-15881.
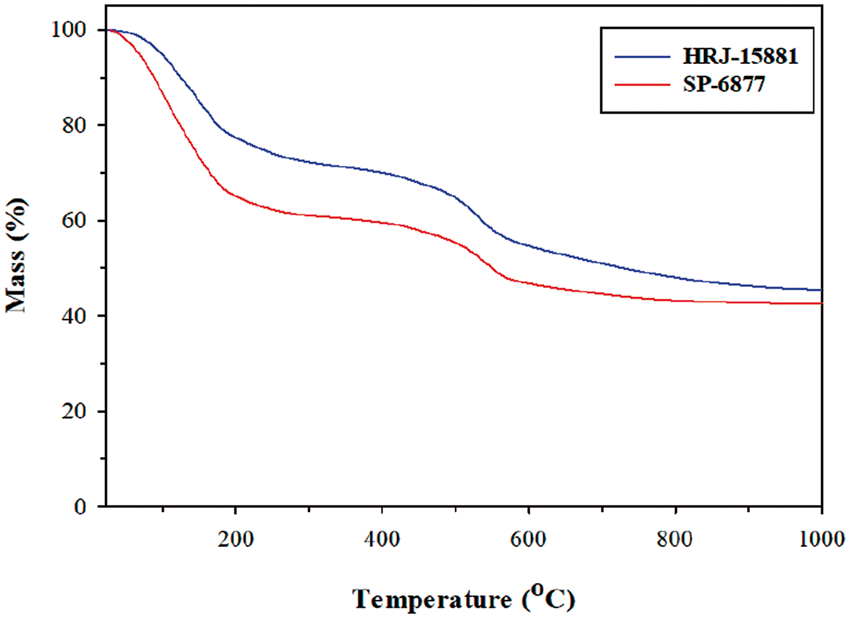
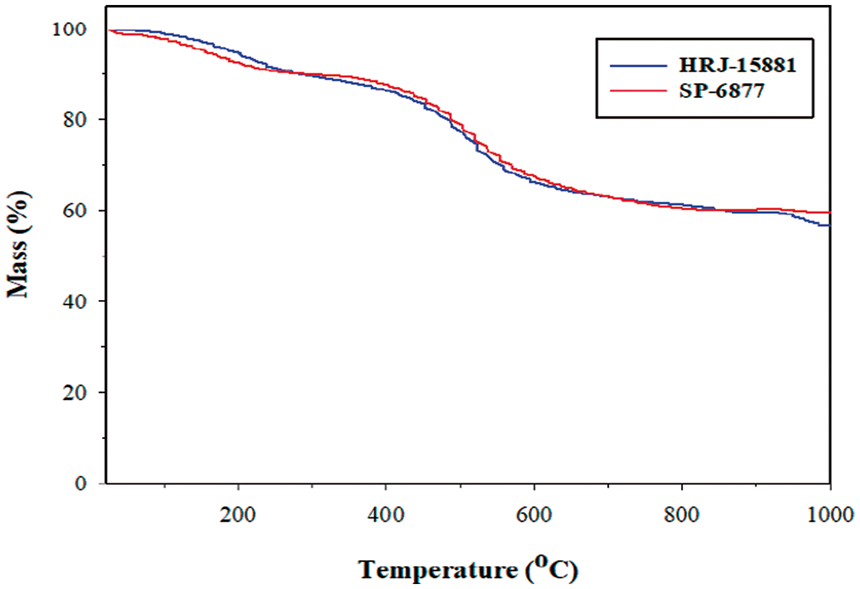
The TGA plots of cross-linked resins are presented in Figure 4. The respective thermal behavior of the two resins after cross-linking is similar. There is a slight difference in the mass loss as the temperature of the cured phenolic resin was increased from room temperature to 1000 °C. This is unlike the significant difference in mass loss observed for the as-received liquid resins shown in Figure 2. This is not unexpected since the major difference between the two resins is in their viscosities. This difference would have been eliminated with the evaporation of the solvents in the resins during the prior curing process of the as-received phenolic resin.
TGA plots obtained for cured phenolic resins.
Above roughly 350 °C, new volatile substances are released, indicating the beginning of a dehydration-condensation reaction 38 during which molecular degradation starts, giving rise to a reduced molecular mass of the phenolic resin. Volatiles such as H2O, CO, CO2, H2, CH4, C2H2, C2H6, phenol, and its methyl derivatives are released, which takes place in the temperature range of 350–800°C during pyrolysis of the phenolic resin. The condensation of molecules from aromatic rings and the volatilization of these compounds lead to the weight loss and shrinkage of the phenolic resin.36,37,39 At about 700 °C, the phenolic resin is then converted slowly to amorphous carbon.
Microstructural examination
Typical optical and scanning electron micrographs showing the microstructure of the obtained carbon fiber reinforced phenolic (no filler addition) after curing are presented in Figures 5 and 6, respectively. There were no noticeable differences in the microstructural features of both phenolic resins. So, the images of CFRPs fabricated using SP-6877 resin matrix were used as a representative of both resins for microstructural examination. The SEM micrograph indicates good wetting and impregnation of the carbon fiber preforms by the phenolic resin. The good bonding between the fiber and the matrix can also be observed from the microstructures.
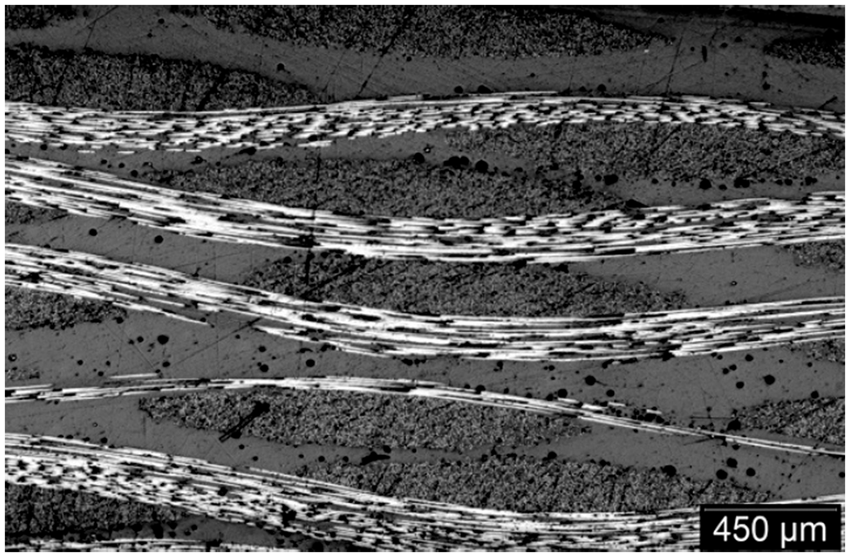
A typical optical micrograph of a specimen of as-manufactured SP-6877 based carbon fiber reinforced phenolic (CFRP) composite without fillers.
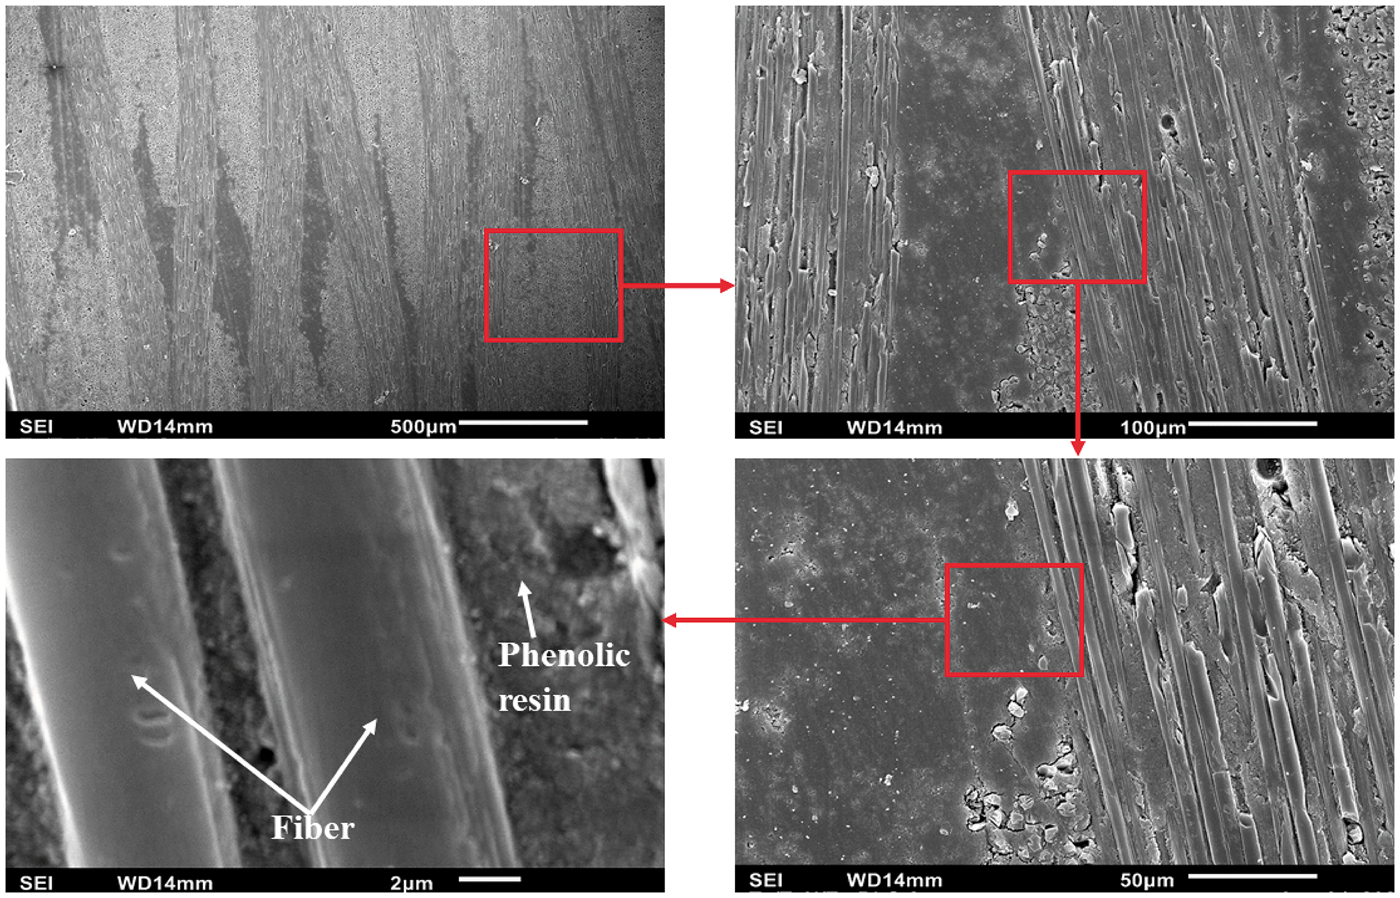
SEM micrographs of a specimen of as-manufactured SP-6877 based CFRP composite containing no fillers.
Flexural properties
Typical stress-strain curves of cured unreinforced phenolic resin and carbon fiber reinforced phenolic are presented in Figure 7. The carbon fiber is denoted with the acronym CF in the figure. The trends of the flexural stress-strain curve for the carbon fiber reinforced phenolic with microfillers (SiC or colloidal silica) are similar. However, the flexural-strain curves for the carbon fiber reinforced phenolic with a SiC microfiller are used as the representative of the carbon fiber reinforced phenolic with microfillers in the figure. It can be observed that the flexural stress-strain curve for the unreinforced cured phenolic resin is linear until it gets to the maximum stress, after which a sudden drop in stress occurs indicating brittle failure. This behavior is expected of a phenolic that is characteristically very stiff and brittle.3,40
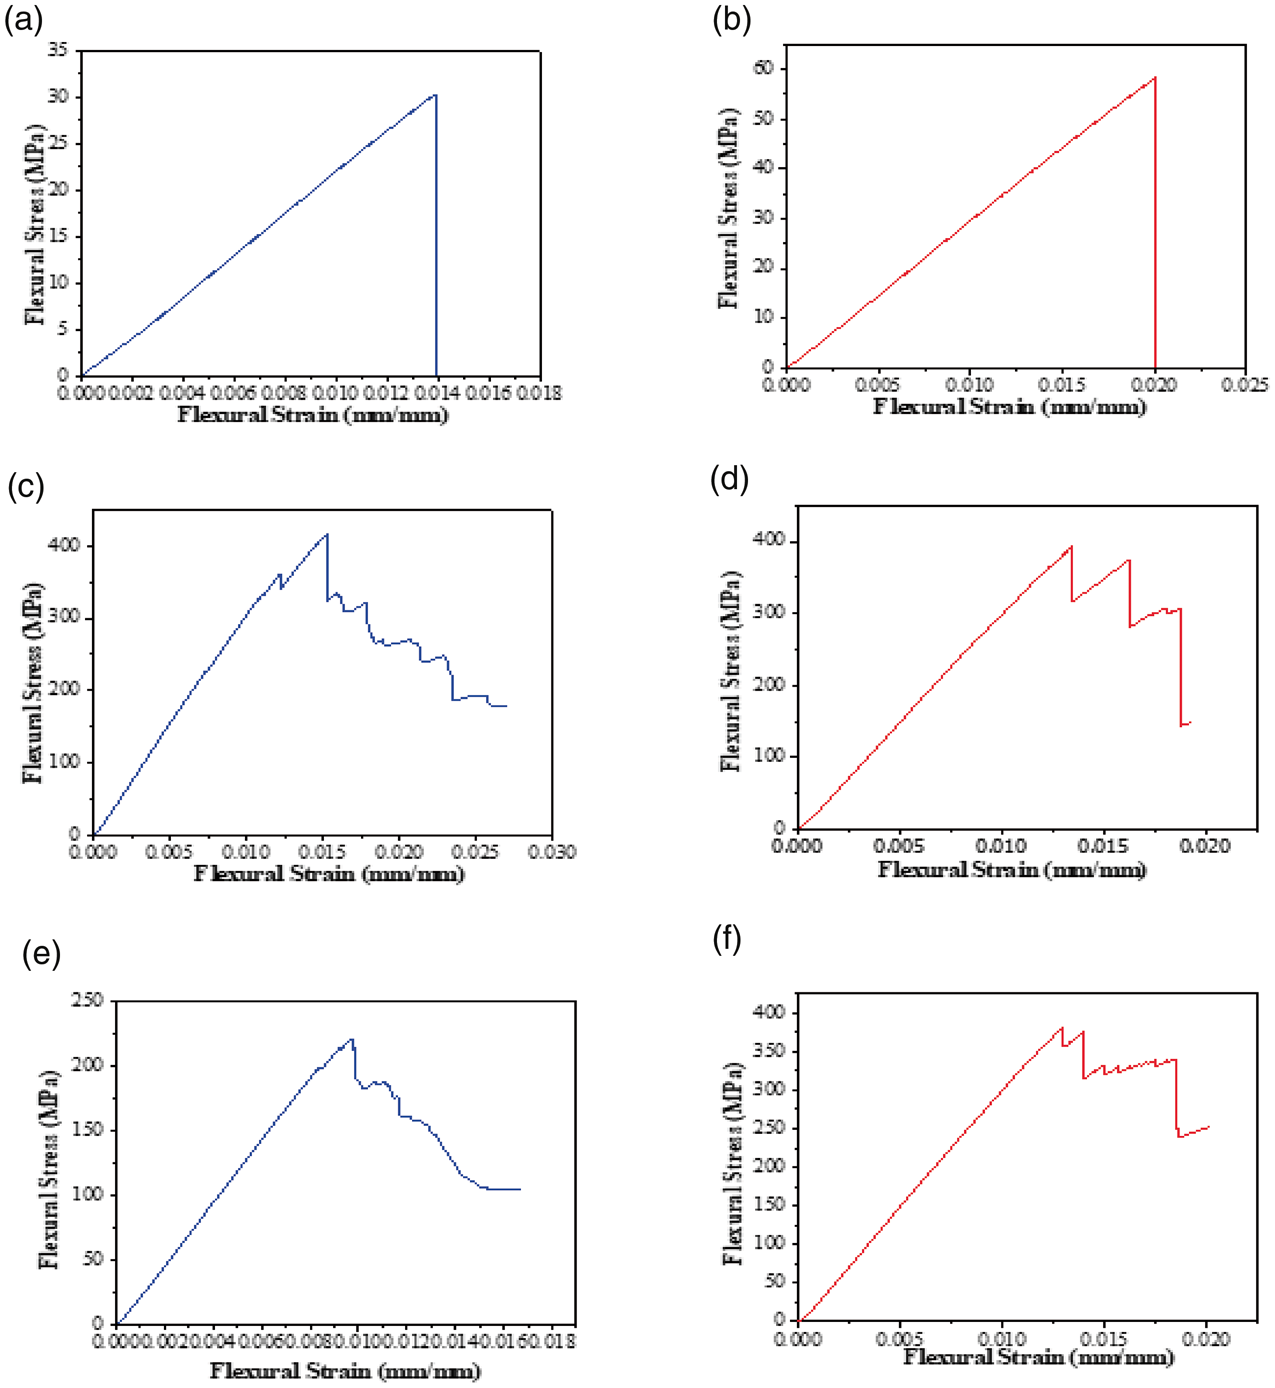
Flexural stress-strain curves for unreinforced cross-linked phenolic (a,b), carbon fiber reinforced phenolic without microfiller (c,d), and carbon fiber reinforced phenolic containing microfiller (e,f).
The flexural stress-strain curves for the carbon fiber reinforced phenolic (with or without microfiller addition) are characterized by discontinuities caused by matrix and fiber bundle cracking followed by crack-bridging or deflection. The first major drop in stress in the stress-strain curves of fiber-reinforced thermoset has been attributed to the first ply failure. 40 The first ply failure occurs when one of the layers making up the composite materials fails. However, the composite material can still retain more load due to other layers that are yet to fail. Subsequently, the intermittent increase and decrease of the composite’s load-carrying capacity result from matrix cracking or fiber failure followed by crack deflection or crack bridging at the next fiber-matrix interface as crack propagates.
The flexural properties of each cured phenolic with and without carbon fiber reinforcement are compared in Figure 8. The addition of carbon fiber as reinforcement to the individual phenolic resins led to a composite with significantly higher flexural strength and modulus than an unreinforced phenolic. The flexural strength of the carbon fiber reinforced HRJ-15881 is 508% higher than that of the cross-linked monolithic phenolic without fiber reinforcement. Similarly, the flexural strength carbon fiber reinforced SP-6877 is 909% higher than that of monolithic crosslinked SP-6877 phenolic. Similarly, the flexural modulus of the reinforced HRJ-15881 and SP-6877 are respectively 930% and 1257% higher than those of unreinforced phenolic. This significant improvement in flexural properties reflects the function of the carbon fiber as the main load-carrying component of the composite material. The phenolic matrix holds the fibers together and also protects the fibers from environmental degradation. The load is transferred between the fiber and the matrix across the fiber-matrix interface. 3 Carbon fibers characteristically have high strength and modulus.3,41,42 The high strength of the composites confirms the good wetting of the fiber surface by the resin and a strong fiber-matrix interface. Phenolic resin is a brittle thermoset, and reinforcement with the carbon fibers serves to provide toughness.
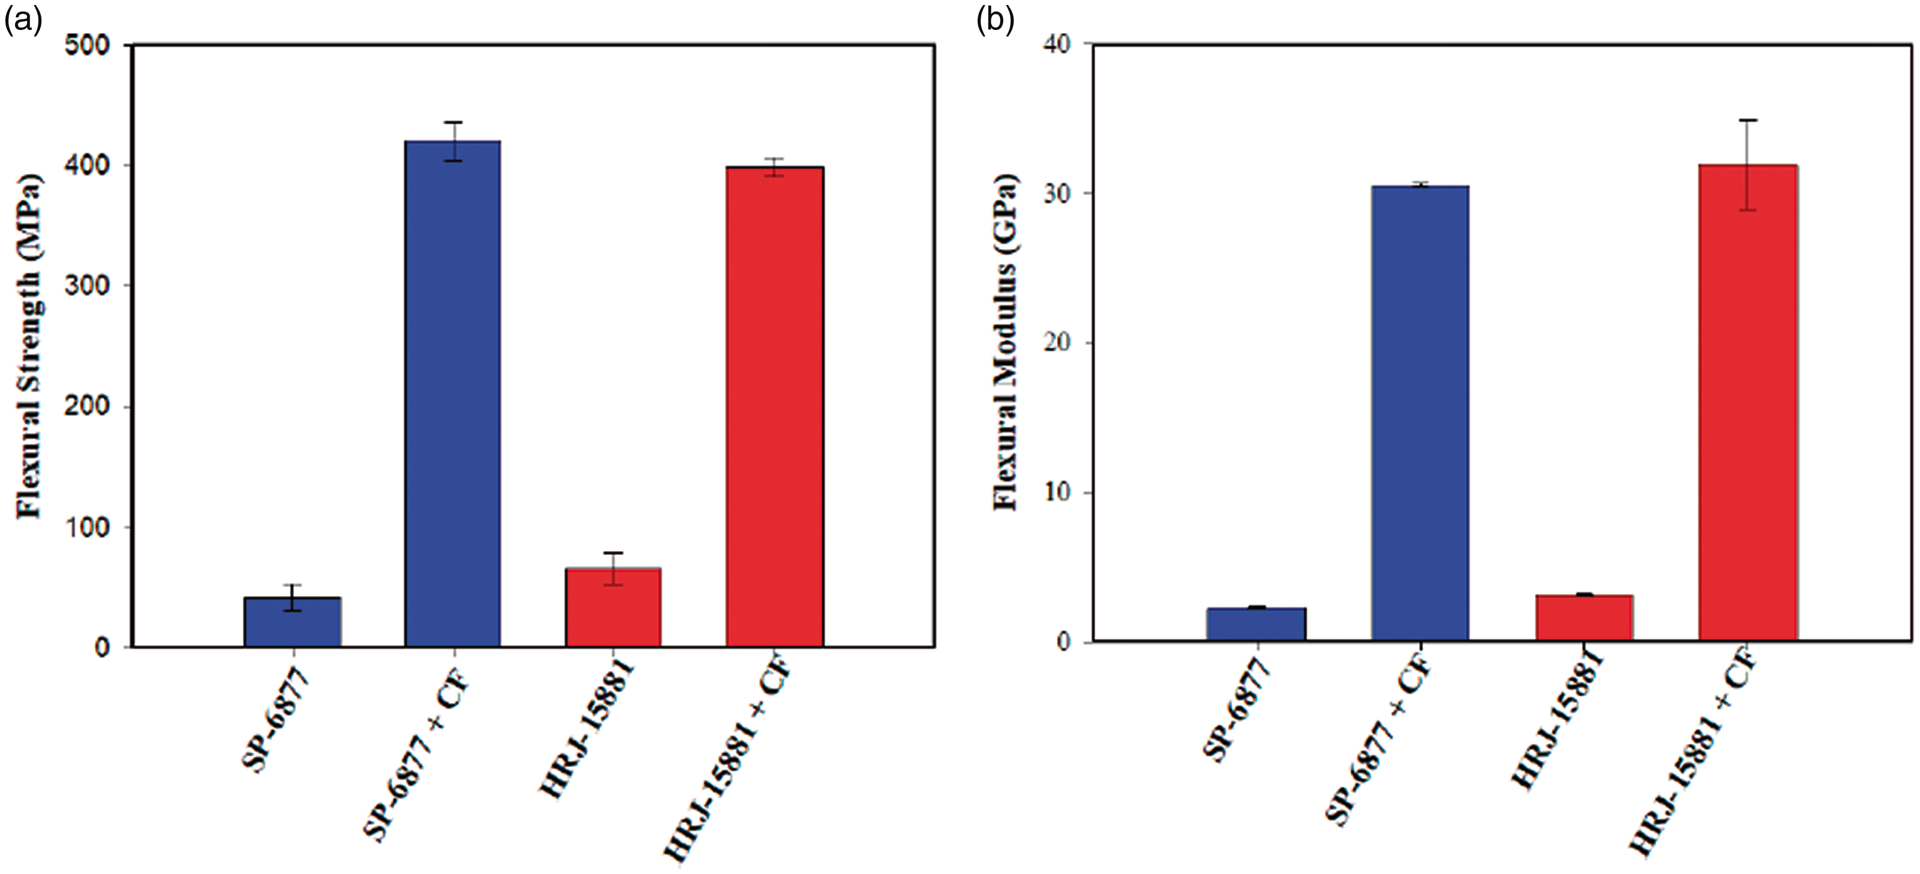
Effect of carbon fiber reinforcement on (a) flexural strength and (b) flexural modulus of cross-linked phenolic resin.
The effects of microfiller additions on the flexural properties of the carbon fiber reinforced phenolic are summarized in Figures 9 and 10, for the SiC and colloidal silica addition respectively. The composites containing no microfillers in the CFRP composite are designated by 0 wt.%. The rests are designated in terms of the weight fraction of added microfillers in the CFRP, i.e. 0.5, 1, 1.5, and 2 wt.%. For CFRP composites containing no microfillers, better flexural strength was obtained for CFRP made with the phenolic resin SP-6877 as the matrix than for the one having HRJ-15881 matrix. However, the flexural modulus is about the same for CFRP manufactured with both phenolic resins.
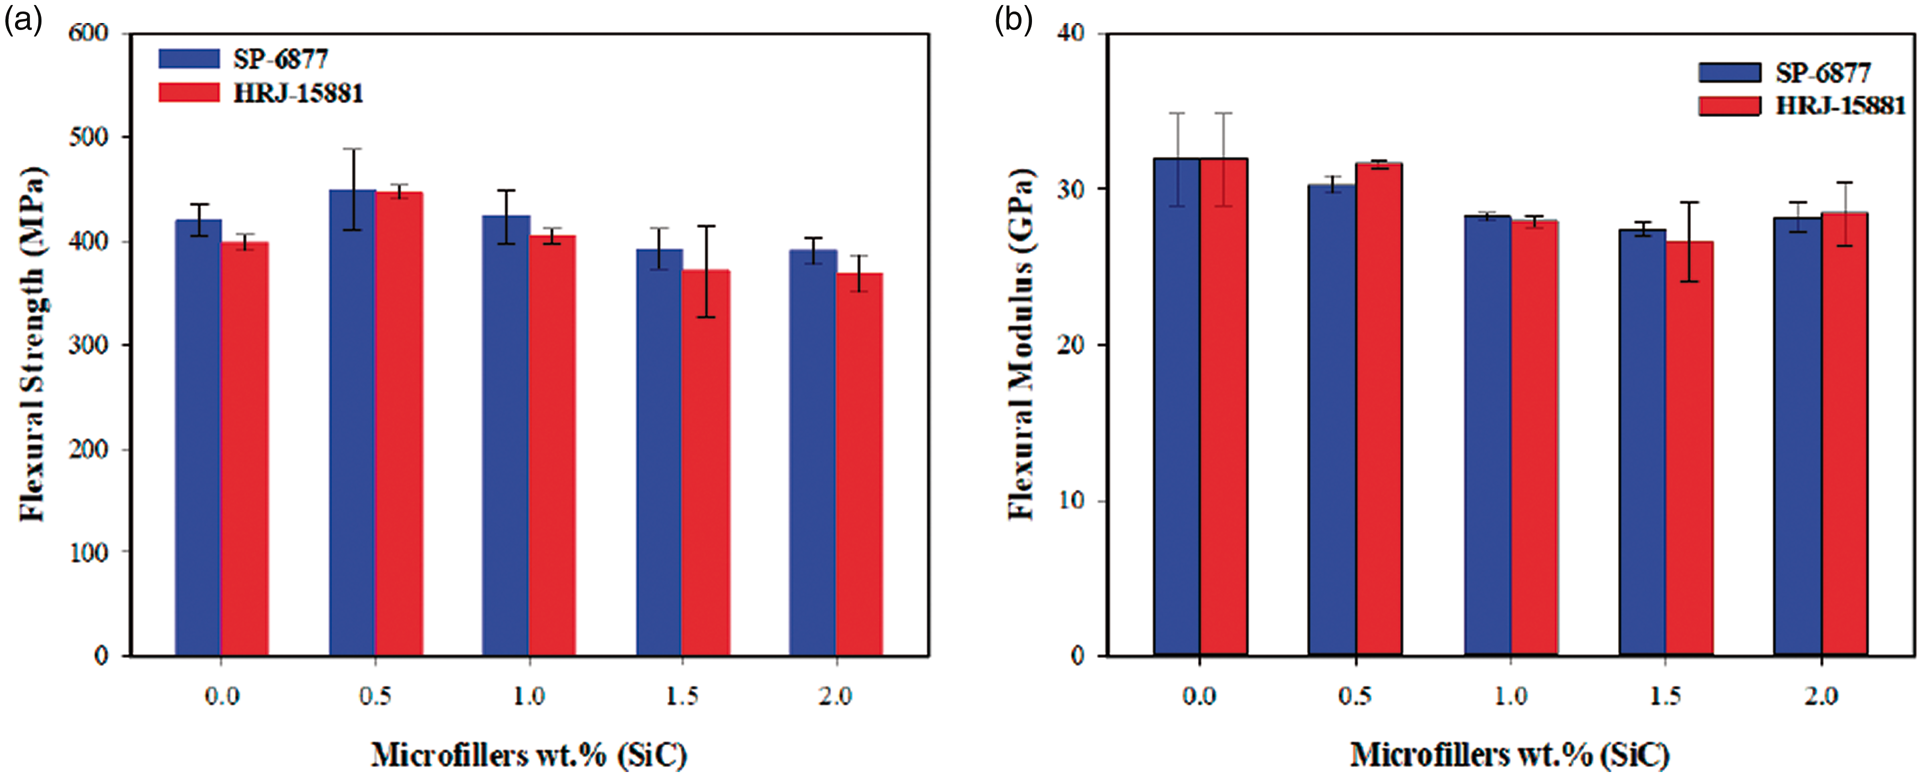
Flexural properties of carbon fiber reinforced phenolic composites with SiC microfiller addition: (a) flexural strength and (b) flexural modulus.
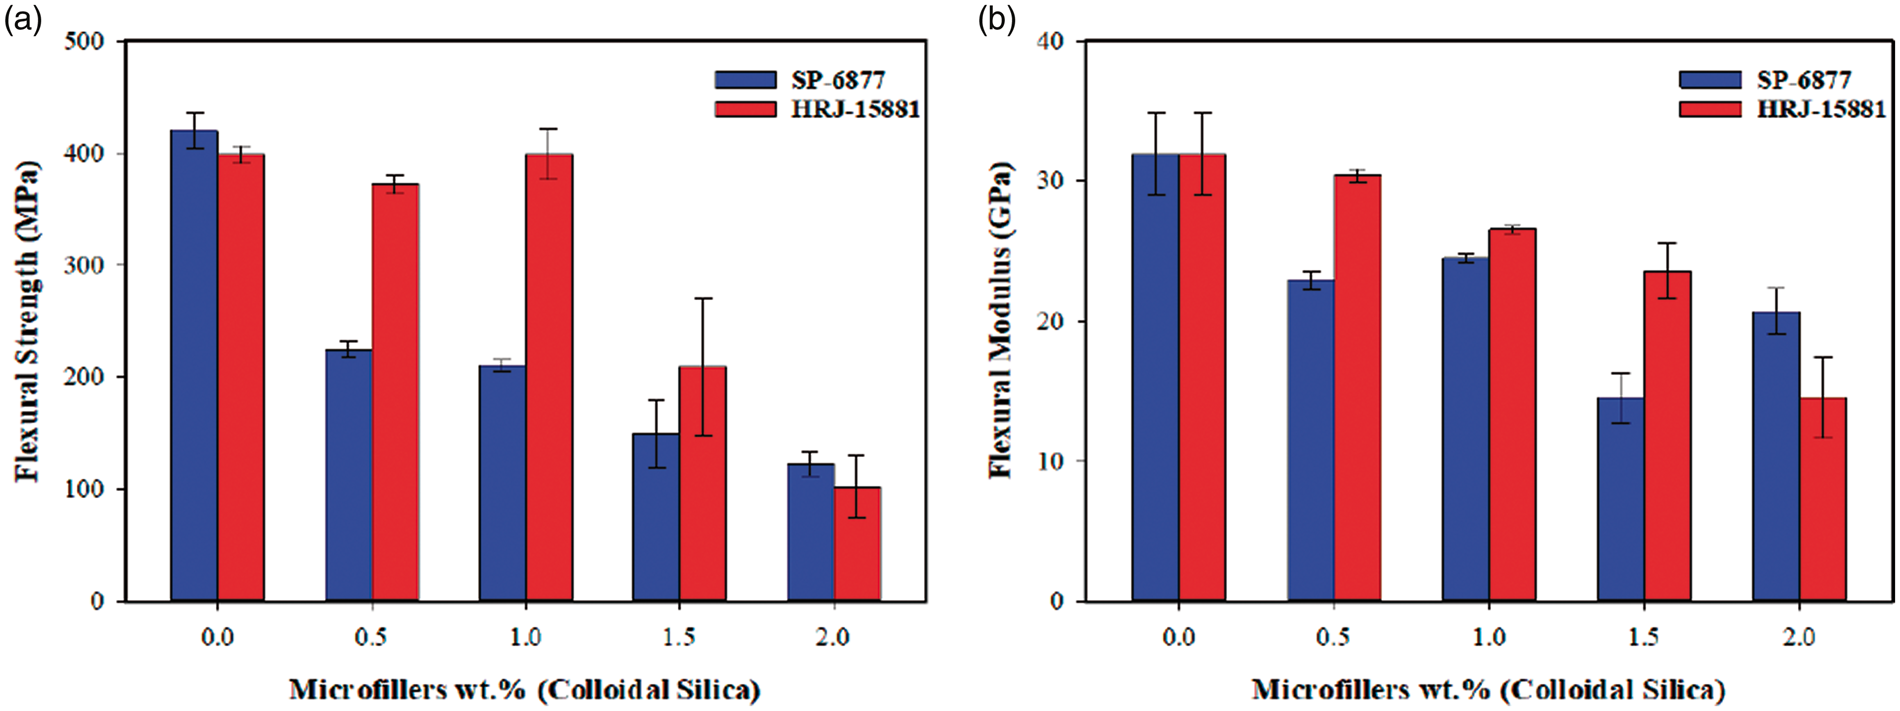
(a) Flexural strength and (b) modulus of carbon fiber reinforced phenolic composites, with and without colloidal silica addition.
For both phenolic resins, the flexural strength increased with SiC addition up-to 1 wt.% before it started to decrease with a further increase in filler content to 1.5 wt.%. The addition of SiC at 0.5 wt.% gave a better flexural strength than at 1 wt.%. Thus, the highest flexural strength was obtained with 0.5 wt.% SiC particle addition. The increase in flexural strength could be attributed to factors such as enhanced interfacial bonding between the fiber and the resin, as a result of the presence of SiC microfiller. 43 Furthermore, the good dispersion of the microfiller in the matrix can offer an additional load-bearing capacity of the matrix and contribute to the observed increase in flexural strength. The decrease in flexural strength at higher microfiller addition might be a result of microfillers agglomeration leading to a higher tendency for matrix cracking.5,25,44 There is no improvement in flexural modulus with SiC addition. However, the highest flexural modulus was obtained for 0.5 wt.% SiC addition in comparison to 1, 1.5, and 2 wt.% SiC addition.
The flexural strength and modulus of carbon fiber reinforced phenolic did not improve with colloidal silica addition for both phenolic resins as shown in Figure 10. Without colloidal silica addition, the flexural strength of SP-6877 based CFRP composites is slightly higher than those made with HRJ-15881. However, with colloidal silica addition, the flexural strength and flexural modulus of CFRP composites made from SP-6877 resin are lower than their HRJ-15881 resin counterparts at filler loadings of 0.5–1.5 wt.%. It is not clear why the flexural strength and flexural modulus are higher for CFRP composites made from SP-6877 resin than those made from HRJ-15881 resin at a colloidal silica addition of 2.0 wt.%. The observed reduction in flexural strength and modulus of the composites containing colloidal silica fillers may be due to the effect of particle agglomeration. The results of flexural property test obtained in this work are in good agreement with the results obtained by Srikanth et al. 26 who studied the effect of the addition of zirconia (3.5, 6.5, and 9.5 wt.%) and CNTs (0.5 wt.%) on mechanical properties of CFRP composites. The authors obtained optimum flexural strength with 0.5 wt.% CNTs, while the addition of zirconia deteriorated the flexural strength. In another work by Pelin et al., 24 optimum flexural properties were obtained at 1 wt.% SiC nanoparticles addition to phenolic resin. Sekhar et al. 27 also obtained optimum flexural strength with the addition of 1 wt.% graphite bisulfate to phenolic resin.
Statistical analysis
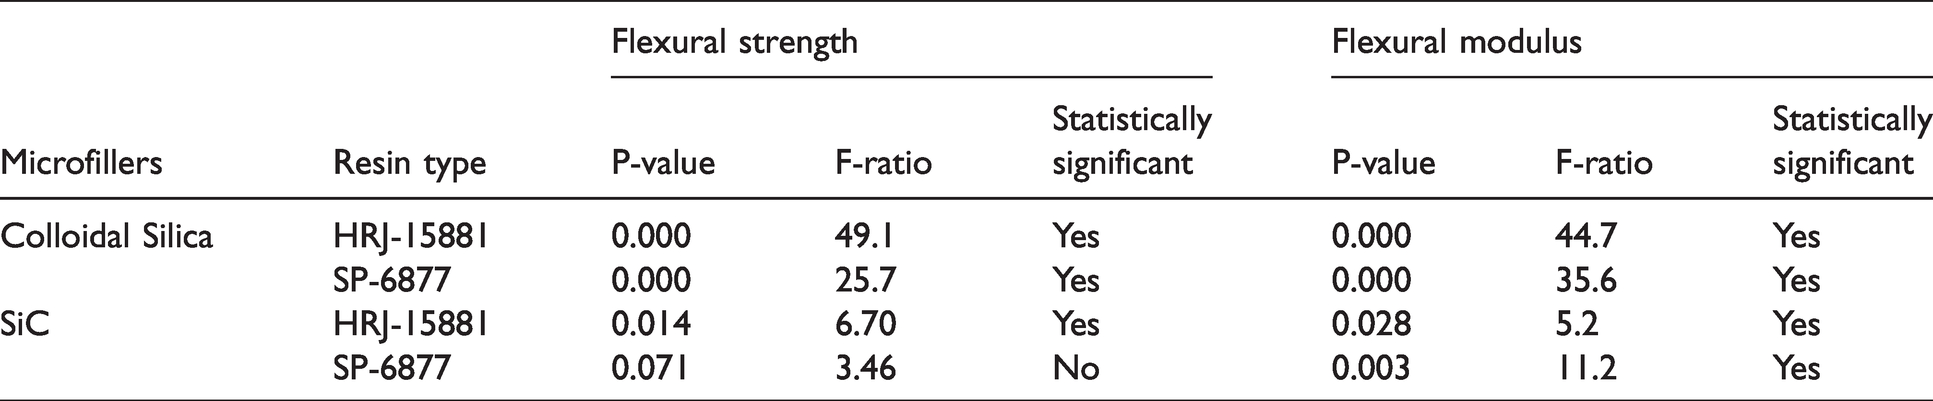
A single factor (microfillers effect) ANOVA was carried out to determine whether the change in the flexural properties of the produced CFRP owing to additions of colloidal silica and SiC microfillers is significant or not. The results of the ANOVA test are presented in Table 4 for the CFRP composites containing colloidal silica and SiC microfillers. When the P-value is less than 0.05 and the F ratio (F/Fcritical) larger than 1, the difference between the mean values is considered to be significant. It can be seen from the ANOVA table that differences in flexural properties of the composite samples are statistically significant except for the flexural strength of the CFRP composites made with SP-6877 containing SiC microfiller.
ANOVA test results for flexural properties of CFRP composite containing microfillers.
Fractography of the CFRP under flexural loading
Optical fractography
CFRP composites prepared using HRJ-15881 and SP-6877 phenolic resins exhibited similar failure characteristics when tested in three-point bending. As such, only representative micrographs of their failed specimens will be presented to avoid duplication. A typical optical micrograph showing the failure mode of the flexural test specimen of HRJ-15881 based CFRP composite without SiC microfiller is presented in Figure 11. Similar failure features were observed for specimens SP-6877 based composite containing no fillers. Figure 12 shows representative failed specimens of SP-6877 and HRJ-15881 based CFRP composites containing different amounts of SiC microfillers.
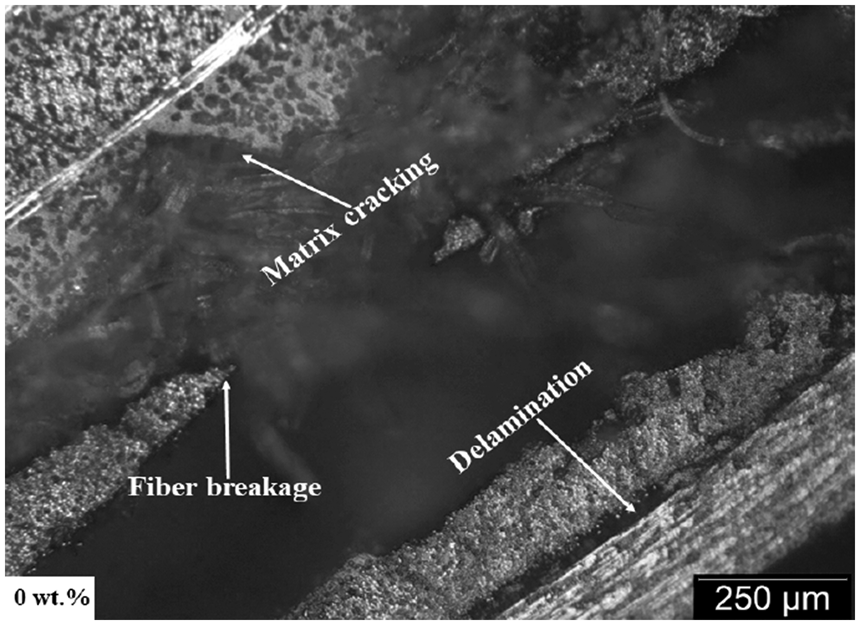
Optical micrograph showing damage in flexural test specimens of HRJ-15881 based CFRP composite without microfillers.
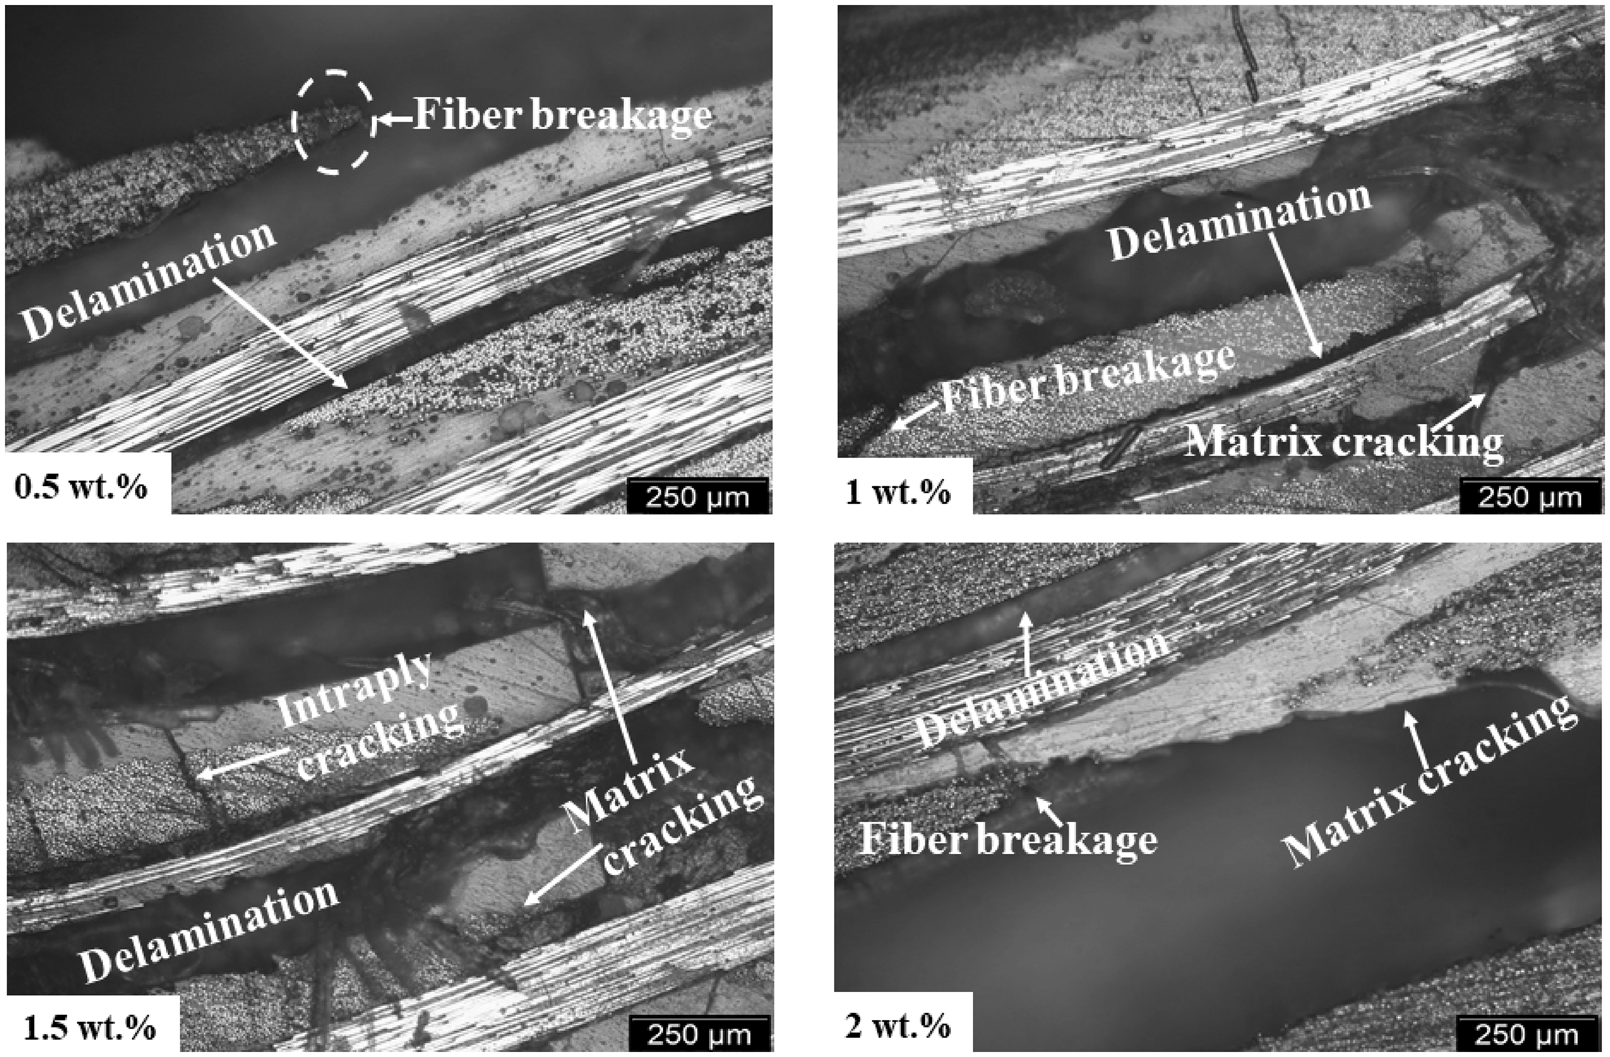
Optical micrographs showing damage evolution in flexural test specimens of CFRP composites with SiC microfillers addition. (a) and (b) based on SP-6877 matrix and (c) and (d) based on HRJ-15881 matrix.
For the flexural test specimens without microfillers and with low SiC addition (≤1 wt.%), fiber breakage, matrix cracking, and delamination are the observed failure modes. With increasing SiC addition (≥1.5 wt.%), the failure tendency became worse with the occurrence of intra-ply cracking and more severe matrix cracking (Figure 12). This damage evolution could be attributed to poor filler-matrix adhesion with increasing microfiller content. As the flexural load is applied, the agglomeration sites for these microfillers could serve as a point where failure starts. So, the decrease in flexural properties with microfillers addition obtained in ‘Flexural properties’ section might be as a result of these failure tendencies worsening with increasing microfillers addition. A similar trend of the damage mode becoming worse with colloidal silica addition was also observed. It is pertinent to note that the optical fractography of the CFRP containing SiC microfiller was used as a representative of the CFRP containing microfillers in this section. However, the SEM fractography showing detailed damages of the CFRP containing SiC and colloidal silica microfiller individually are presented in the next section. Furthermore, it can be observed that irrespective of the resin used as the matrix, the extent of flexural failure became greater with increasing microfiller additions. This will be discussed in the subsequent sections.
SEM fractography
SEM micrographs showing damage modes in the CFRP composite without microfillers are shown in Figure 13. As observed in the optical micrograph of Figure 11, delamination, matrix cracking, fiber breakage, and fiber pull-out are the predominant failure modes.
SEM micrographs of specimens of HRJ-15881 based CFRP composite without microfillers which were tested in 3-point bending.
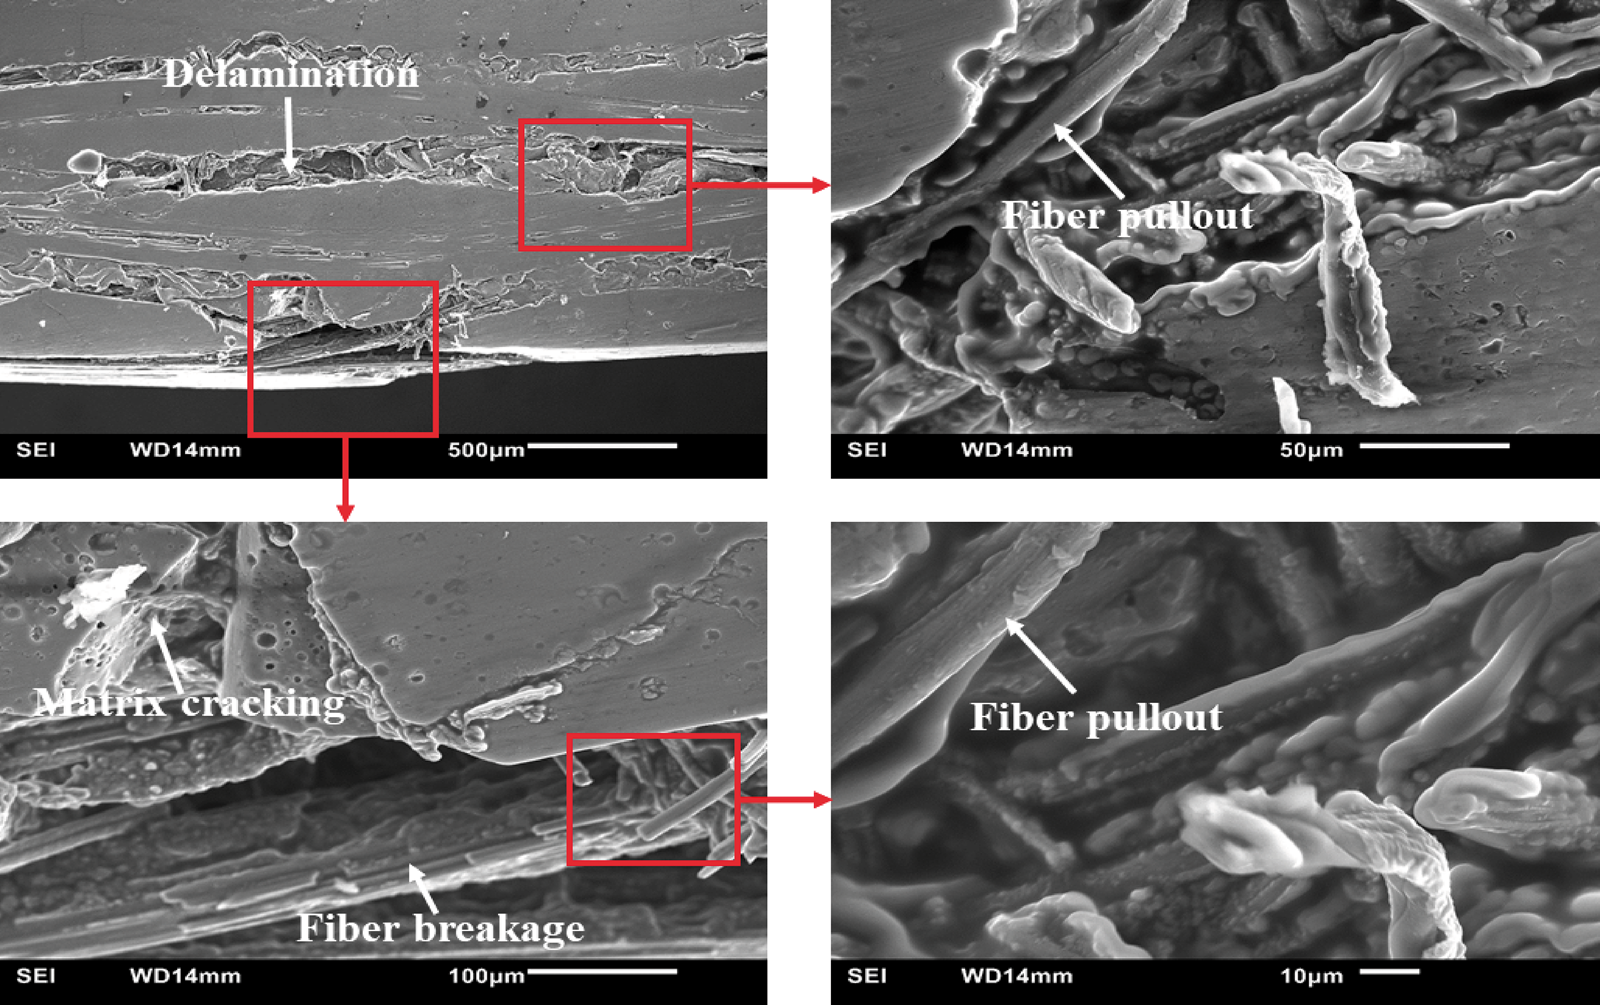
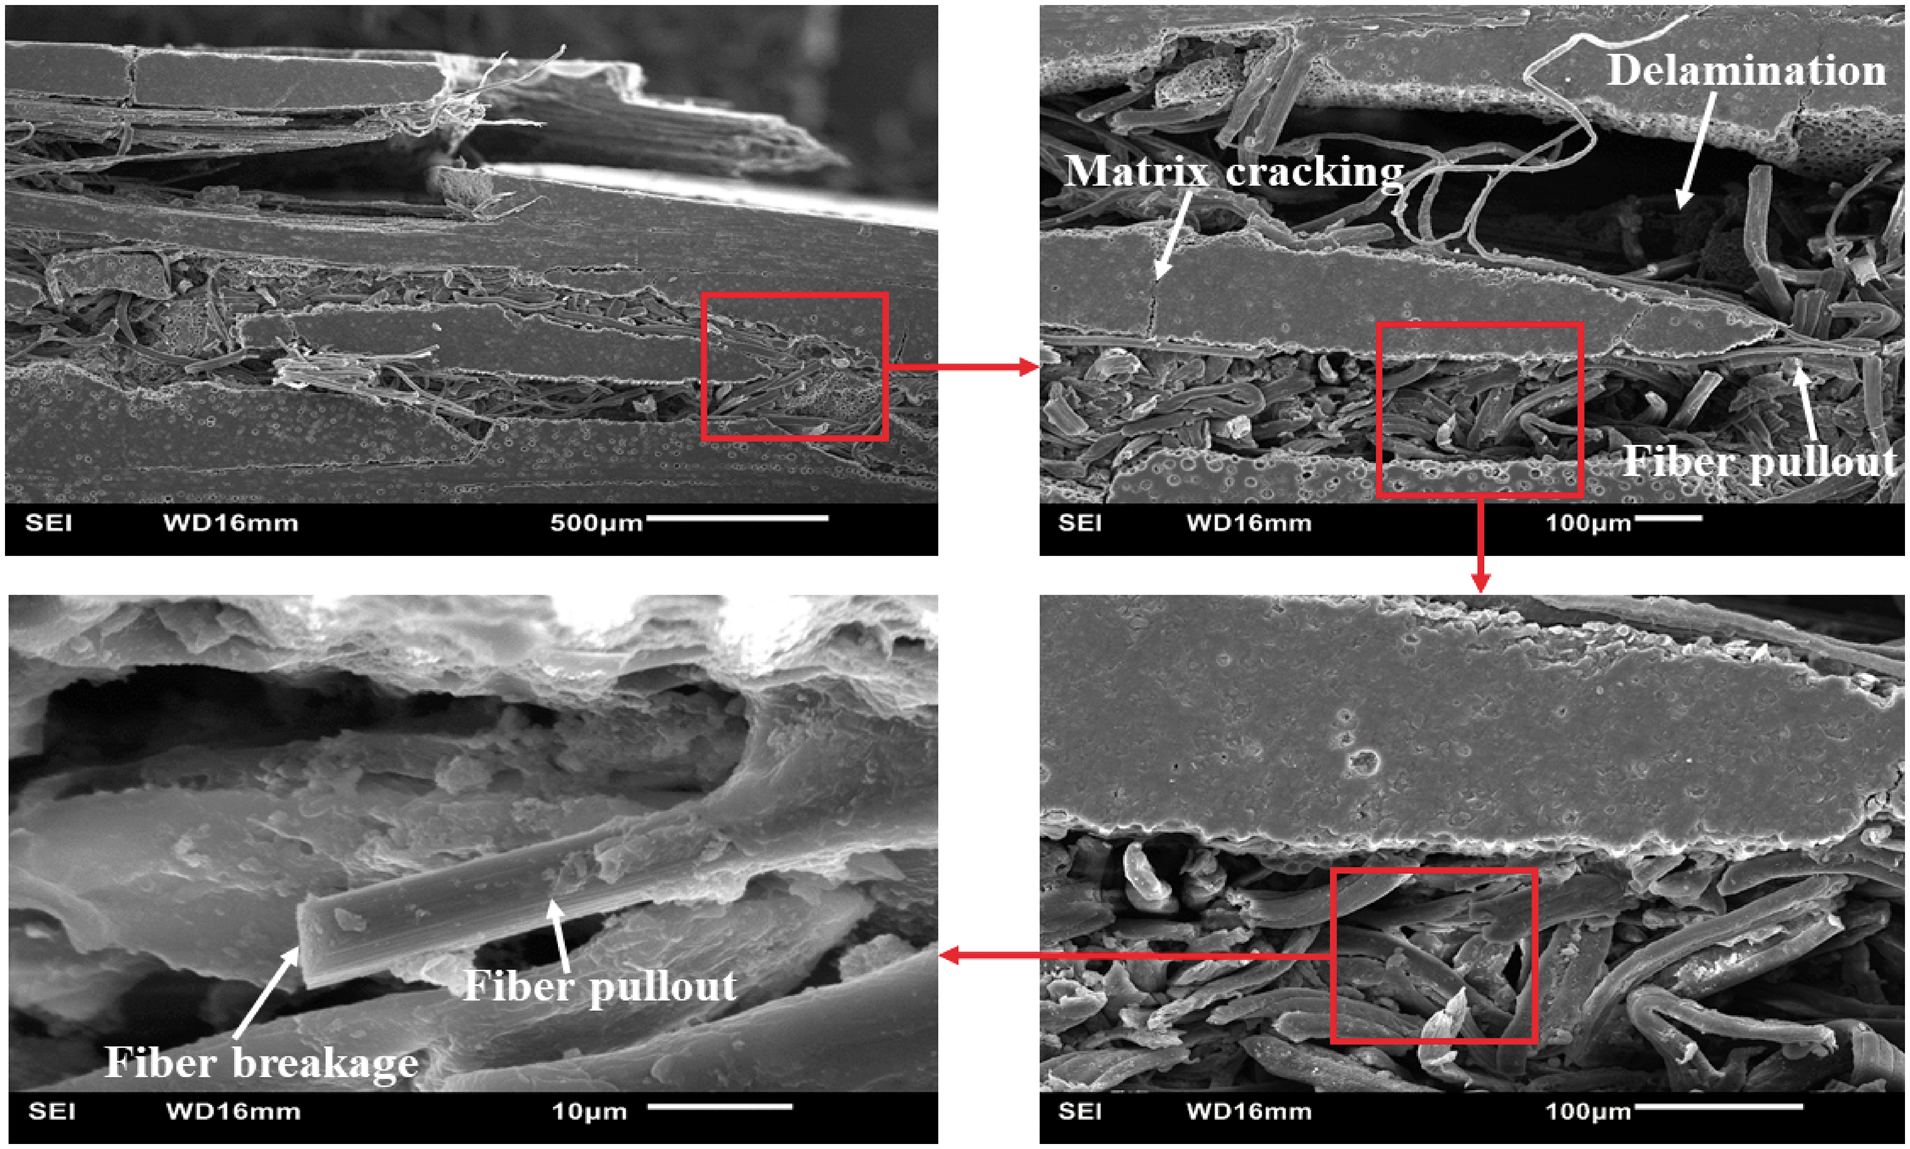
For the CFRP composites containing SiC microfillers, two test specimens representing composites containing low (0.5 wt.%) and high (2.0 wt. %) microfiller addition that failed under flexural load were further examined using SEM. The obtained SEM micrographs showing the level of damage in the flexural specimens are presented in Figures 14 and 15. Figure 14 shows the SEM micrographs of fractured specimens of SP-6877 based CFRP composite containing 0.5 wt.% SiC, while Figure 15 shows the SEM micrographs of the fractured specimens of HRJ-15881 based CFRP composite containing 2.0 wt.% SiC.
SEM micrographs showing detailed damage in flexural test specimens of SP-6877 based composite containing 0.5 wt.% SiC.
SEM micrographs showing detailed damage in flexural test specimens of HRJ-15881 based composite containing 2 wt.% SiC.
The SEM micrographs showing detailed damages of the fractured CFRP specimens containing 0.5 wt.% SiC indicate delamination, fiber breakage, fiber pull-out, and matrix cracking as the predominant failure modes. Also, from Figure 14, it could be seen that the fractured fibers that are pulled out are still well-positioned and secured in the phenolic resin. The SEM micrographs confirm good interfacial adhesion between the fibers and the phenolic resin matrix.
When SiC addition to the CFRP was increased to 2 wt. %, fiber breakage, delamination, matrix cracking, and fiber pull-out became more severe. Also, intra-ply cracking appeared as an additional failure mode (Figure 15). A greater amount of the fiber pull-outs can be observed compared with the CFRP composite containing 0.5 wt.% SiC. Overall, optical and SEM micrographs showed that the failure became more intense in the CFRP composite at high content of SiC addition (≥1.5 wt.%).
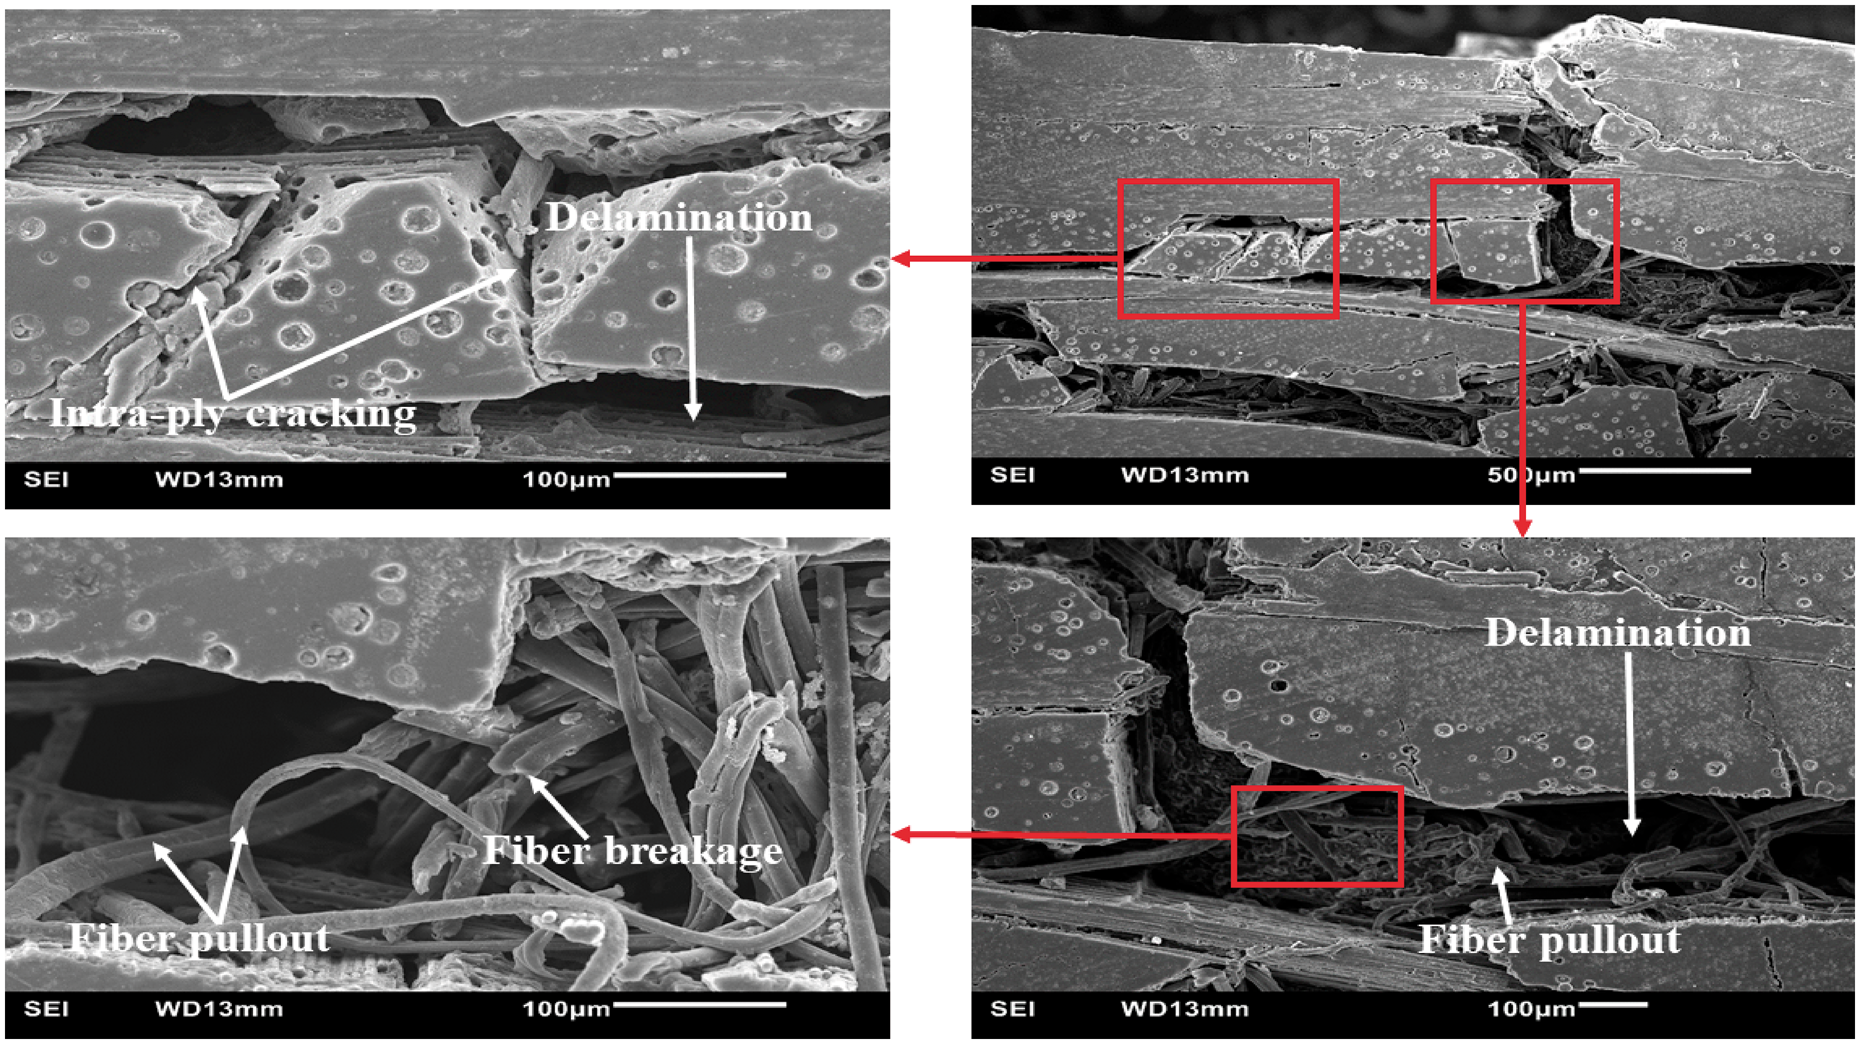
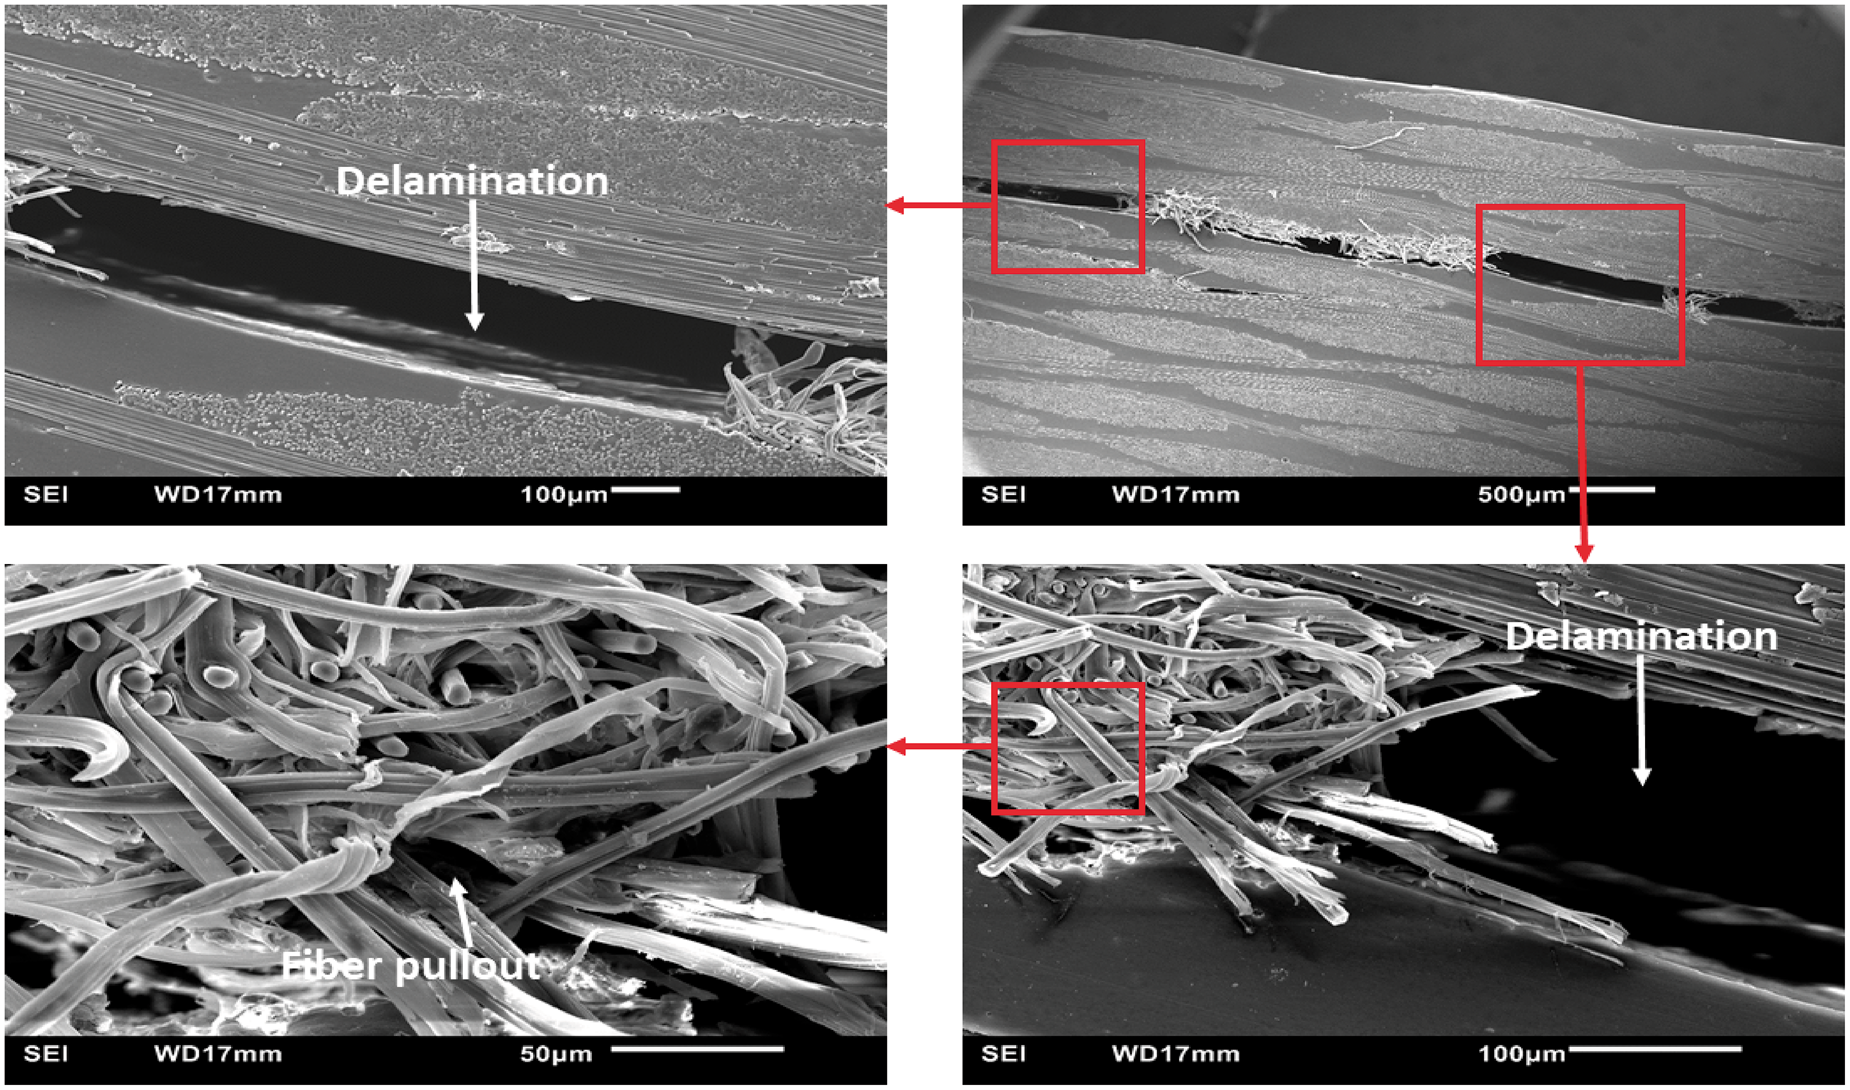
Typical SEM micrographs of failed specimens of CFRP composites containing 0.5 wt.% and 2 wt.% colloidal silica microfiller are presented in Figures 16 and 17, respectively. The composite shown in Figure 16 is based on HRJ-15881 matrix, while that in Figure 17 is based on SP-6877 matrix. As can be seen, the predominant damage modes are delamination, fiber pull-out, and fiber breakage.
Typical SEM micrographs obtained for failed specimens of HRJ-15881 based CFRP composite containing 0.5 wt.% colloidal silica.
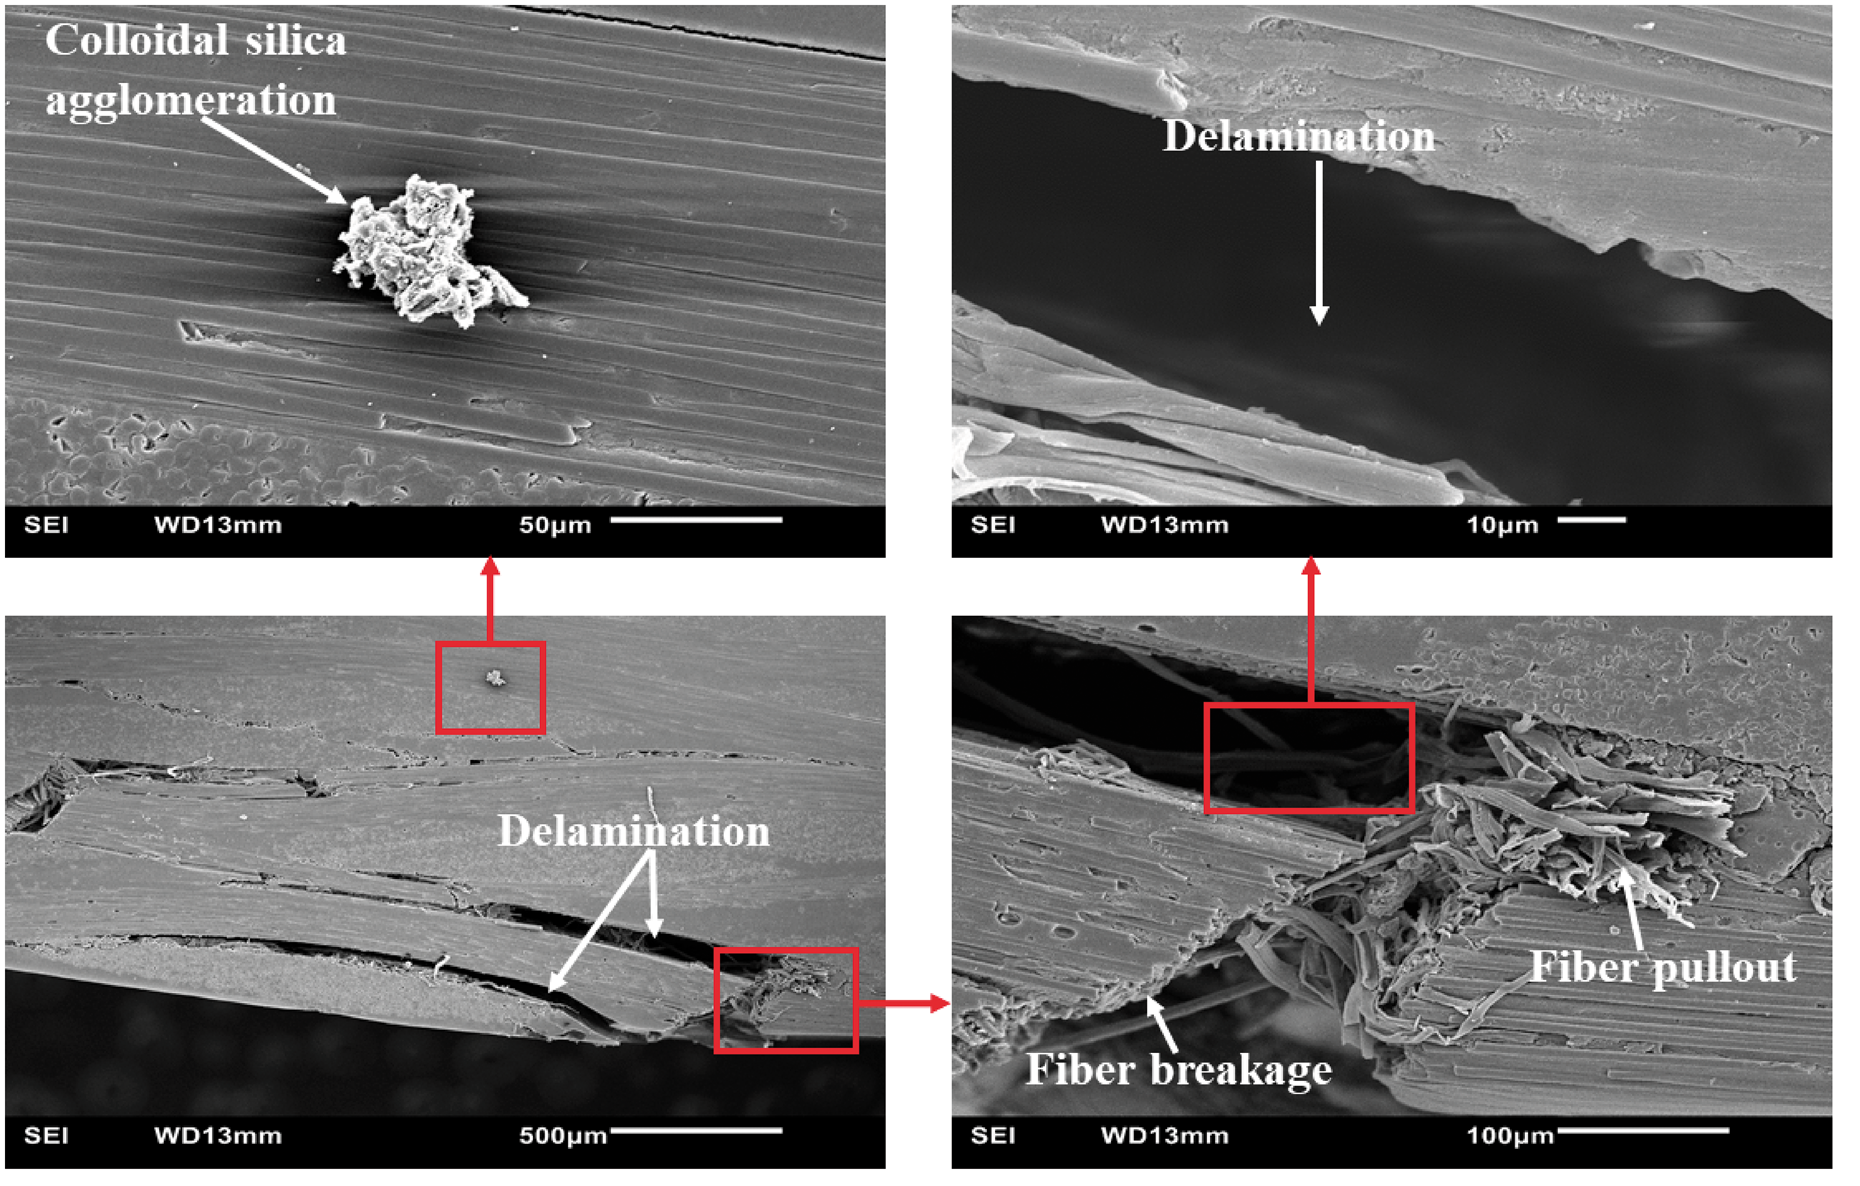
Typical SEM micrographs obtained for failed specimens of SP-6877 based CFRP composite containing 2 wt.% colloidal silica.
For the HRJ-15881 based CFRP composite containing 0.5 wt.% colloidal silica (Figure 16), delamination and fiber pull-out can be observed. For the SP-6877 based composite with colloidal silica content of 2 wt.% (Figure 17), similar damage modes are observed. However, these damages became severe owing to colloidal silica agglomeration. This trend is similar to that observed for specimens of CFRP composites containing SiC microfiller.
Conclusions
In this study, the possibility of improving the flexural properties of CFRP through suitable microfillers addition was investigated. The CFRP composites were produced using colloidal silica and silicon carbide (SiC) as microfillers, 2 D woven carbon fibers, and two variants of phenolic resole resins (SP-6877 and HRJ-15881). Without microfillers addition, the reinforcement of both phenolic resins with carbon fibers increased their flexural strength and flexural modulus by over 500%. The flexural strength of the obtained CFRP composites increased with SiC filler addition not exceeding 1 wt. %. However, no noticeable increase in flexural modulus occurred. The flexural strength and modulus did not increase with colloidal silica addition (as compared to SiC microfiller addition) owing to particle agglomeration. Microscopic examination of the failed specimens after flexural testing showed fiber breakage, delamination, and matrix cracking as the main damage modes. However, the tendency for composite failure increased at high microfiller addition (≥1.5 wt.%). Thermal analysis results revealed that the decomposition of the phenolic resin matrix to carbonaceous material started at 460–550 °C.
Footnotes
Acknowledgments
The authors would like to express gratitude to SI Group and Washington Mills, for supporting this research study through the provision of the needed phenolic resins and the SiC particles, respectively.
Declaration of Conflicting Interests
The author(s) declared no potential conflicts of interest with respect to the research, authorship, and/or publication of this article.
Funding
The author(s) disclosed receipt of the following financial support for the research, authorship, and/or publication of this article: The financial support of the Natural Science and Engineering Research Council (NSERC) of Canada through an award of the Discovery Grant (RGPIN 2017-05751) is also appreciated.