
Abstract
Fiber-reinforced plastic (FRP) composite structures produced via additive manufacturing (AM) offer excellent specific strength for applications such as aeronautics and automobiles. However, the AM-made FRP composites have experienced limited deployment as their structural integrity can be influenced by printing parameters and process-induced defects. These defects can cause nonlinear mechanical responses when under bending-type deformation, causing premature failure due to accumulated microfracture. In this study, flexural and mode I fracture responses of 3D-printed fiber-reinforced plastic (FRP) composites were analyzed using three-point bending (3PB) and double cantilever beam (DCB) tests on samples reinforced with continuous carbon fiber (CCF) and continuous glass fiber (HSHTG) samples. The highest flexural modulus and strength are reported as 29.5 GPa and 457.1 MPa for CCF samples and 12.7 GPa and 268.8 MPa for HSHTG samples. The mode I fracture toughness (GIC) of the 3D-printed composites reinforced with continuous carbon and glass fiber were characterized with samples of varying laminae sequences. The crack initiation GICs for CCF and HSHTG samples are reported as 1015 and 1100 J/m2. It was observed that the crack propagation GIC fluctuated throughout the crack propagation processes, and the damping induced by nonuniform interfacial discontinuities was evident. GICs were also observed to vary with the laminae sequences. Fracture responses in 3PB and DCB tests were compared, and failure modes associated with reinforcing strategies were identified using microscopic and fracture analysis. It is concluded that the combined effects of complex flexural loading and the AM-specific characteristic anisotropy result in self-arrested crack propagation and fluctuating GIC. The results of this study give insights into determining key processing parameters in laminated FRP structures made of layer-by-layer AM processes, considering the effects of their characteristic geometrical discontinuities on the respective failure mechanisms.
Keywords
Introduction
Continuous fiber-reinforced plastic (FRP) composites are well known to have high specific strength, adequate toughness, and outstanding environmental resistance1,2 for structural applications and lightweight design. FRP composites are competitive in applications across transportation, sporting goods, and energy industries for combined benefits in structural performance and life cycle energy savings.3,4 Increasing interest in making FRP with various additive manufacturing (AM) technologies is a recent trend as it enables accessible, functional prototyping in small quantities5,6 while meeting performance demand on strength, stiffness, and durability.7,8 Performance requirements were pursued using design for additive manufacturing (DfAM) 9 approaches to enable performance-driven design, efficient manufacturing workflow, and building objects otherwise impossible to build.3,10 However, structural integrity and reliability concerns can hinder the proclaimed benefits due to mesostructural anisotropy. 11 In order to prevent unexpected failure of the components, assessments of the process-structure characteristics and their relevant failure mechanisms are crucial. Interfacial debonding, matrix cracking, delamination, and fiber breakage are the most critical failure modes that could cause premature mechanical failure in FRP composites.1,12 Delamination, in particular, poses a significant threat to laminated composites due to localized stress concentrated over the interfacial areas that possess discontinuities and properties mismatch. 13 Addressing these potential failure scenarios through refined DfAM strategies and fracture mechanisms can enable the full potential of the additively manufactured fiber-reinforced plastic (AMFEP) composite materials in critical applications.
Developed initially to resolve analytical incoherency for the stress singularities ahead of the fracture front, 14 fracture mechanics has branched out as an interdisciplinary engineering subject due to its practical use in applications. 15 First pioneered by Griffith’s and Barenblatt’s16–18 work on linear elastic fracture mechanics (LEFM), fracture mechanics were expanded to include nonlinear elasticity and practical measurement methods by Irwin 19 and Rice. 17 In short, fracture mechanics describes and quantifies the effects of localized fractures and determines criteria for crack propagation. The use of empirically derived fracture parameters, such as fracture toughness and energy release rate, enables reliable modeling of the failure phenomenon. 20 Various standardized techniques were developed to quantify fracture toughness, for example, compact tension (CT), single-edge notched bending (SEB), and double-cantilever beam (DCB).15,21 DCB test gained wide popularity for laminated fiber-reinforced plastic (FRP) composite plates to assess the susceptible delamination with sample geometry that can avoid spurious disturbance of fiber alignment.22,23 Correction factors were developed to mitigate deformation-induced nonlinearity during mechanical tests, such as beam bending, arm rotation, and geometric distortion.24–26 Although LEFM effectively quantifies the toughness of different dominating fracture modes, analyzing failure by combinatorial stress in the presence of unknown mode mixity and coupling effects of tensile, shear, and compression can still be nontrivial. This can be especially complicated for inherently anisotropic AM structures with voids distributed stochastically within.
Failure mechanics of AMFRP structure are studied using fracture mechanics and composites mechanics approaches. AMFRP was most often made with extrusion-based additive manufacturing (EBAM), 27 which is advantageous in its broad material compatibility and sturdy machine architecture.28,29 Validation and optimization of the performance and printing qualities were studied extensively with engineering statistics30–34 and fracture toughness35–49 methods. Although EBAM represents 70% 5 of the AM machines deployed worldwide, no known fracture standards were explicitly proposed for validation of AM structure accounted for their characteristic nonlinearity. Although articles investigating the process-structure-properties relationship of AM objects were published in large quantities, a definitive optimization route to couple the effects of the print pattern30,42,50 and processing conditions51,52 is still under active development. Structural decohesion occurs within the discontinuities introduced by the process’s line-by-line and layer-by-layer nature, resulting in difficulties in assessment compared to conventional laminated structures.53–55 Susceptible sites of failure within the AM-made FRP composite structure include interfaces such as fiber-matrix, intralayer in-between raster, interlaminar regions, wall-infill, and geometric-induced discontinuities. In order to aid in establishing the link from observed mechanisms to practical criteria, failure modes need to be identified empirically and coupled with relevant quantifiable properties, such as fracture toughness. A comparison of flexural responses under different boundary conditions, such as DCB and 3PB tests, can be helpful in identifying the structural weaknesses of the characteristic mechanical response of AM-made structures, which was not found during the literature research.
This research investigated the mechanical responses of 3D-printed FRP composite beams with three-point bending and double cantilever beam tests. Flexural samples were designed to understand the AM-made CFRP’s flexural responses and their correlation to the fiber fraction. 3PB samples were tested to find a correlation between failure mechanisms under flexure and reinforcing configurations. DCB samples for carbon-carbon and glass-glass interface were designed, manufactured, and tested using an alternative pre-crack method to achieve precise GIC measurement with improved geometrical symmetry. Three variants of DCB samples were tested for each interface type to evaluate the effects of bending stiffness on the mode I fracture toughness GIC. Flexural responses were analyzed using fractography, and the minimal effective reinforcing fiber fraction was discussed. The characteristics of GIC data were analyzed using ANOVA to correlate the varying mechanical responses with corresponding lamina stacking sequences.
Methodology
Material and equipment
Printer and material specifications used in this research.
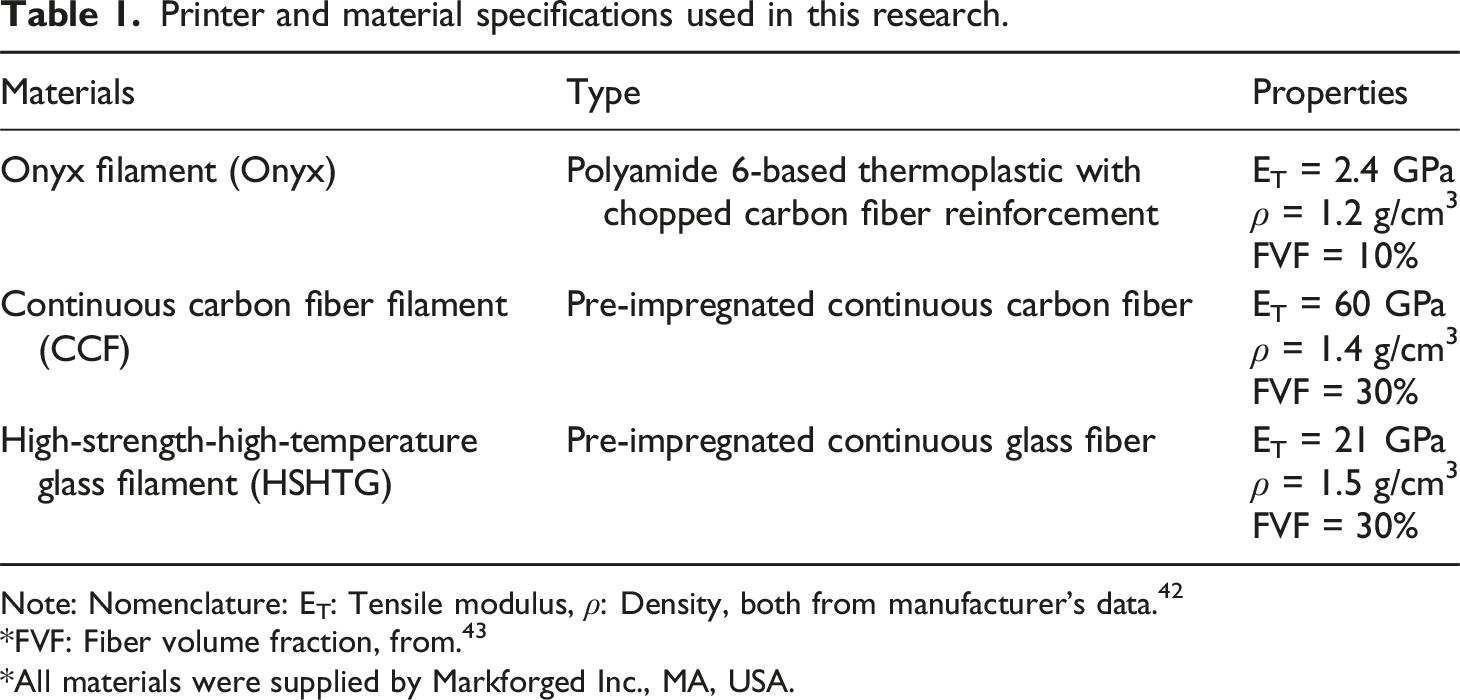
Note: Nomenclature: ET: Tensile modulus,
*FVF: Fiber volume fraction, from. 43
*All materials were supplied by Markforged Inc., MA, USA.
Sample configurations and characteristics
Flexural samples
The three-point bending samples were printed according to procedure A, ASTM D790 - standard test methods for flexural properties of unreinforced and reinforced plastics and electrical insulating materials.
59
The dimension of the sample is set with a length (L) of 35 mm, a width (b) of 12.5 mm, and a depth (d) of 2 mm, which results in a span-to-depth ratio close to the minimally required 16:1, according to the standard.
59
The engineering drawing and illustration of the flexural behavior are shown in Figure 1. The instantaneous load, Pi, and the instantaneous deflection, Di, are recorded for further analysis. Engineering drawing of the three-point bending test, sample dimensions, and schematics of flexural bending AMFRP.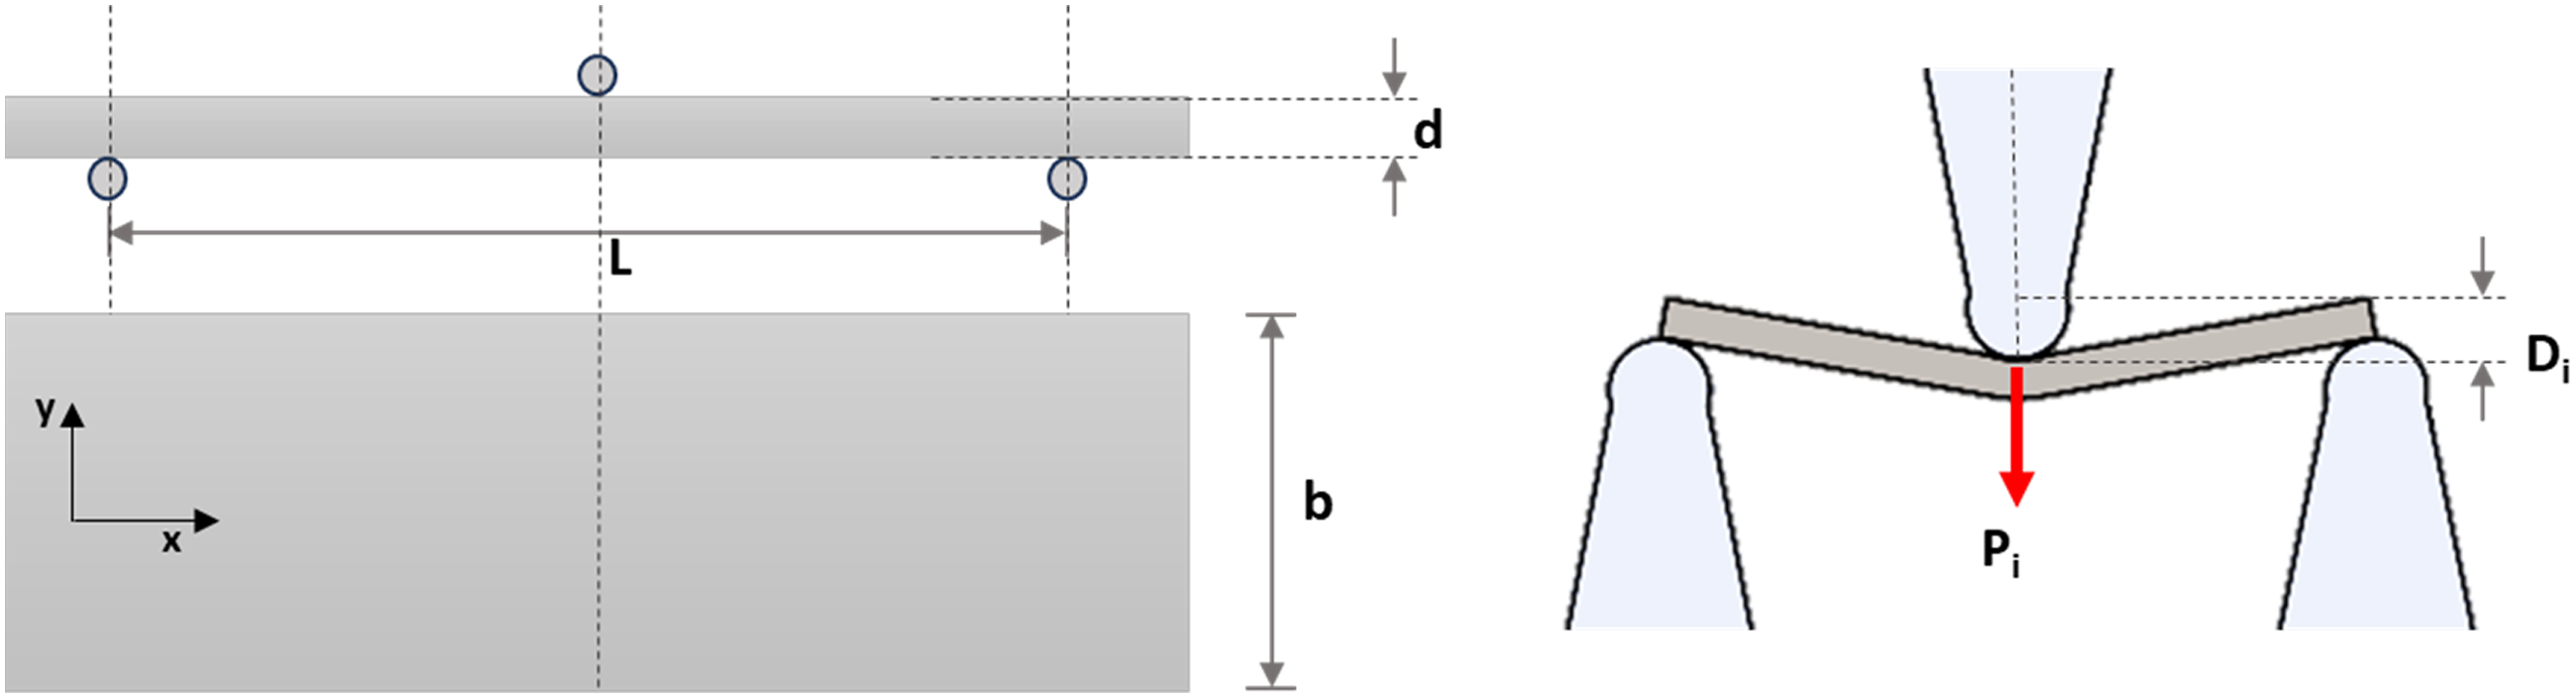
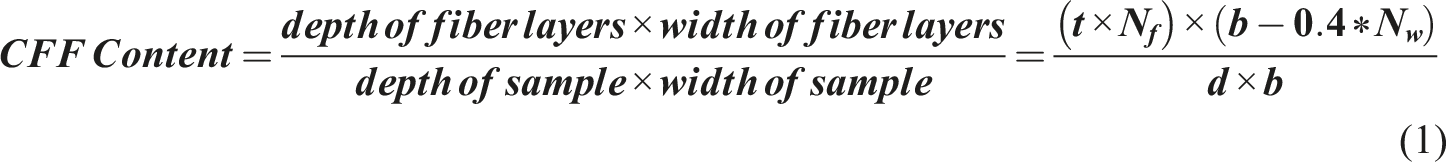
Configuration of all three-point-bending samples.
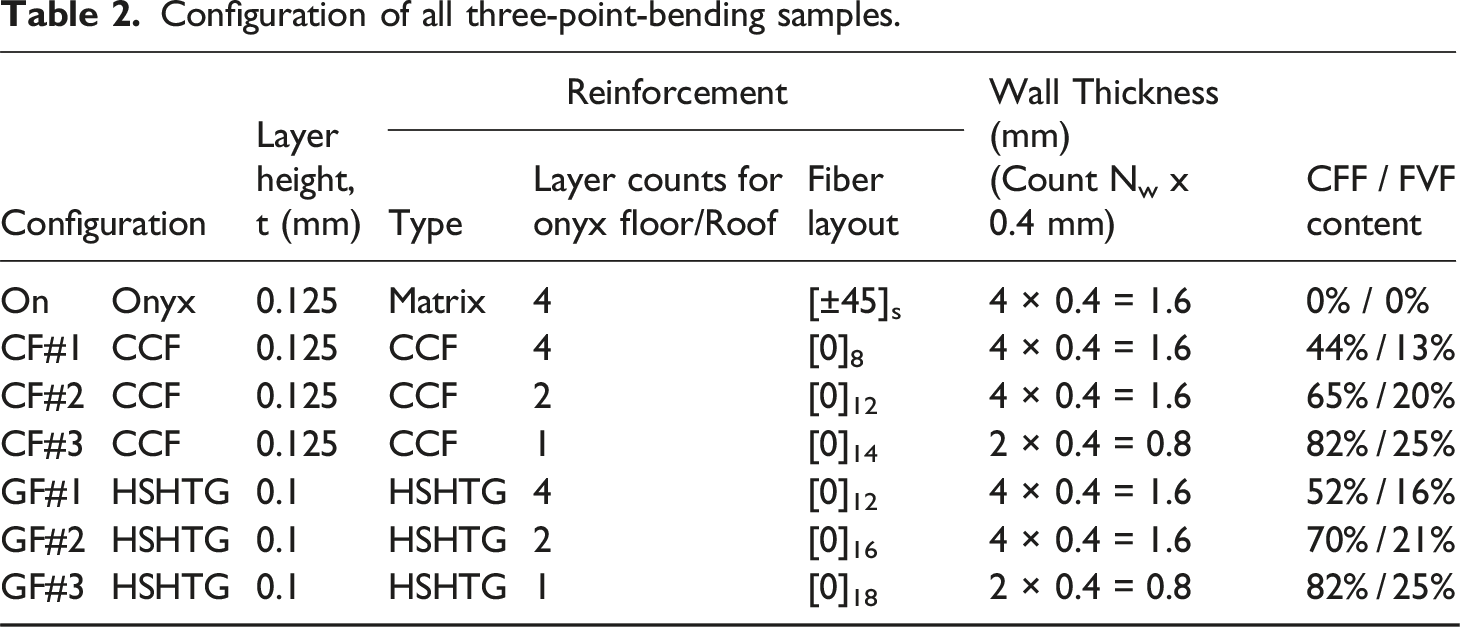
The fiber volume fraction (FVF) represents the estimated volume fraction of 0° continuous fibers based on the sample’s representative mid-section. The CFF content was converted to FVF content using a 30% fiber volume fraction as reported in microscopic evidence from the literature53,56,57 for CCF and HSHTG materials. In this study, the corresponding fiber fraction will follow this convention to compare the mechanical responses between different studies with a unified framework.
DCB samples
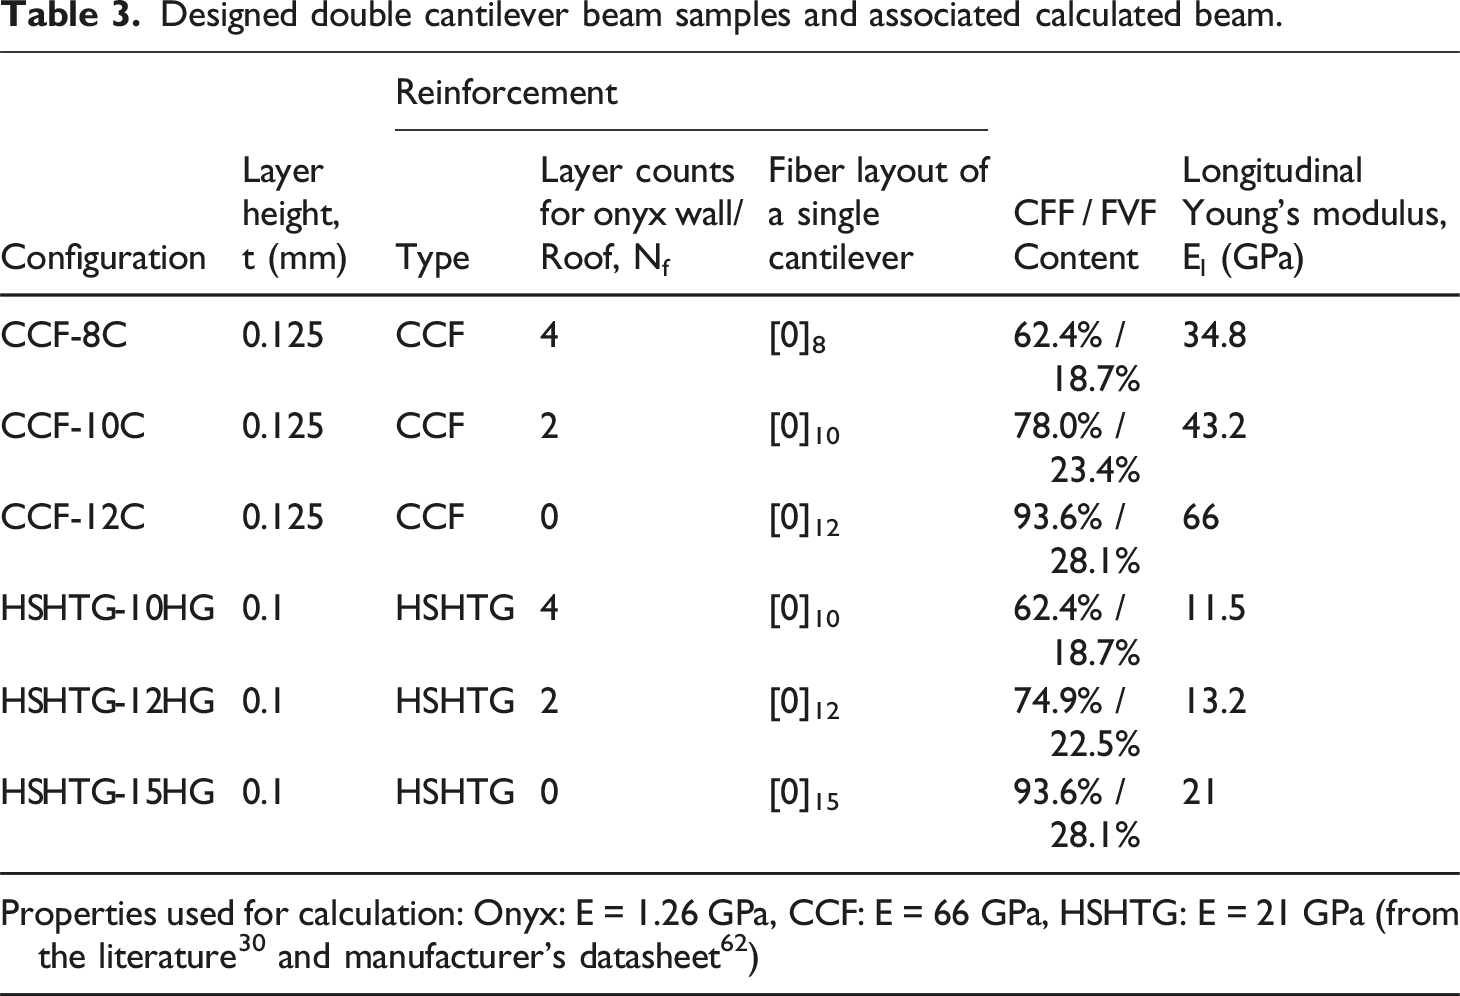
Double cantilever beam samples were designed to characterize the mode I fracture toughness of AMFRP composites for CCF-CCF interfaces and HSHTG-HSHTG interfaces and their variation under different beam compositions. The procedure followed for the test is the ASTM D5528 - Standard Test Method for Mode I Interlaminar Fracture Toughness of Unidirectional Fiber-Reinforced Polymer Matrix Composites. The engineering drawing, dimension details, and schematic of the DCB test are shown in Figure 2(a). The beam was symmetrically loaded to avoid asymmetrical bending, as confirmed by video analysis, showing equivalent bending angles of the double cantilever beams. Asymmetrically bent double cantilevers will induce non-negligible GII terms during data reduction,21,37 leading to inaccurate GIC values using the prescribed formulations. A 3 mm thickness was nominally selected based on the suggested values by the ASTM standard.
21
The prepared samples and the samples undergoing mode I loading are shown in Figures 2(b) and 2(c). (a) Engineering drawing and dimensions, (b) Samples marked with length interval to track crack propagation, and (c) Test setup schematics of the double-cantilever-beam test.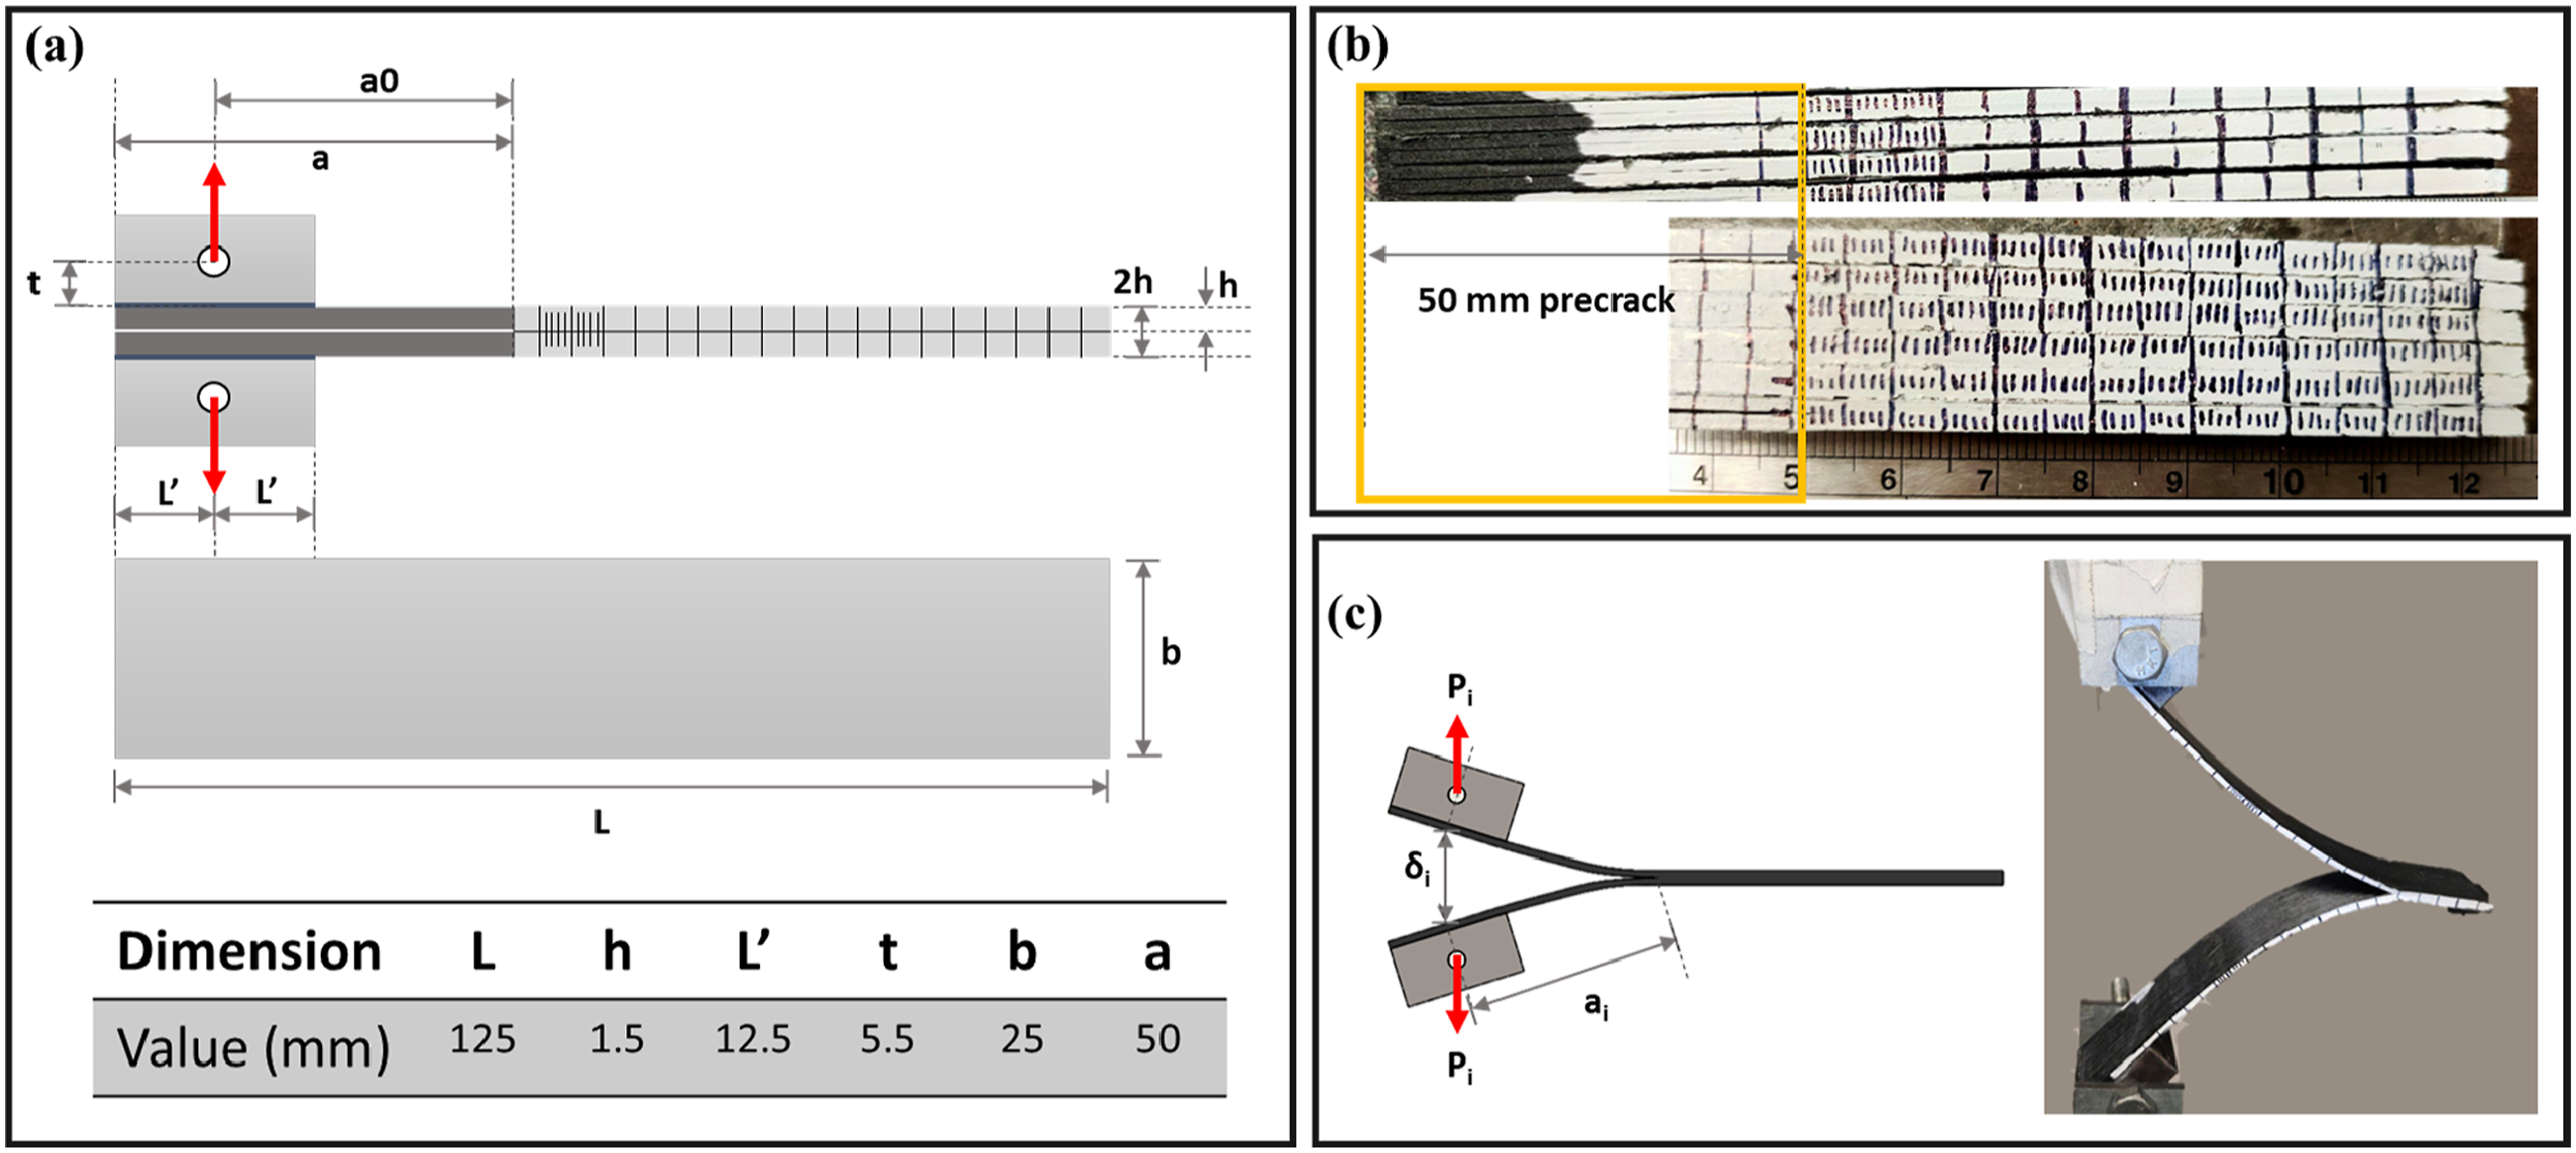
Each CCF beam comprised 24 layers of 0.125 mm thick layers, as opposed to 30 layers of 0.1 mm thick layers for HSHTG specimens, both forming 1.5 mm thick cantilever arms for the DCB tests. A preliminary trial with a nonadhesive insert was conducted according to the ASTM standard. 21 However, the insert created printing artifacts from insufficient adhesion and asymmetric cooling conditions, resulting in nonuniform mixed-mode bending during the DCB tests due to the unbalanced flexural rigidity. Alternatively, a mold release solution, Loctite Freekote 770-NC, was used to introduce the pre-crack on one end of the central surface. Printing was paused after completion of the lower half, followed by applying three layers of 770-NC using a slightly dipped quadri-folded laboratory wipe with adequate time intervals to allow drying and forming of thin nonadhesive layers. Printing was then resumed to finish the production of the samples. The method avoids insert-induced asymmetric flexural rigidity, which can cause tilted openings and subsequently compromised results, as shown in the pilot experimentations.
Designed double cantilever beam samples and associated calculated beam.
Mechanical testing
Both mechanical tests were conducted using an Instron 1331 system with a 22 kN (5k lb) force load cell and a suitable testing fixture prescribed by associated ASTM standards. The machine is equipped to record data at a frequency of 100 Hz. The test setups and the sample being tested are shown in Figures 3(a) and 3(b). Machine setup for (a) Three-point bending test and (b) Double cantilever beam test.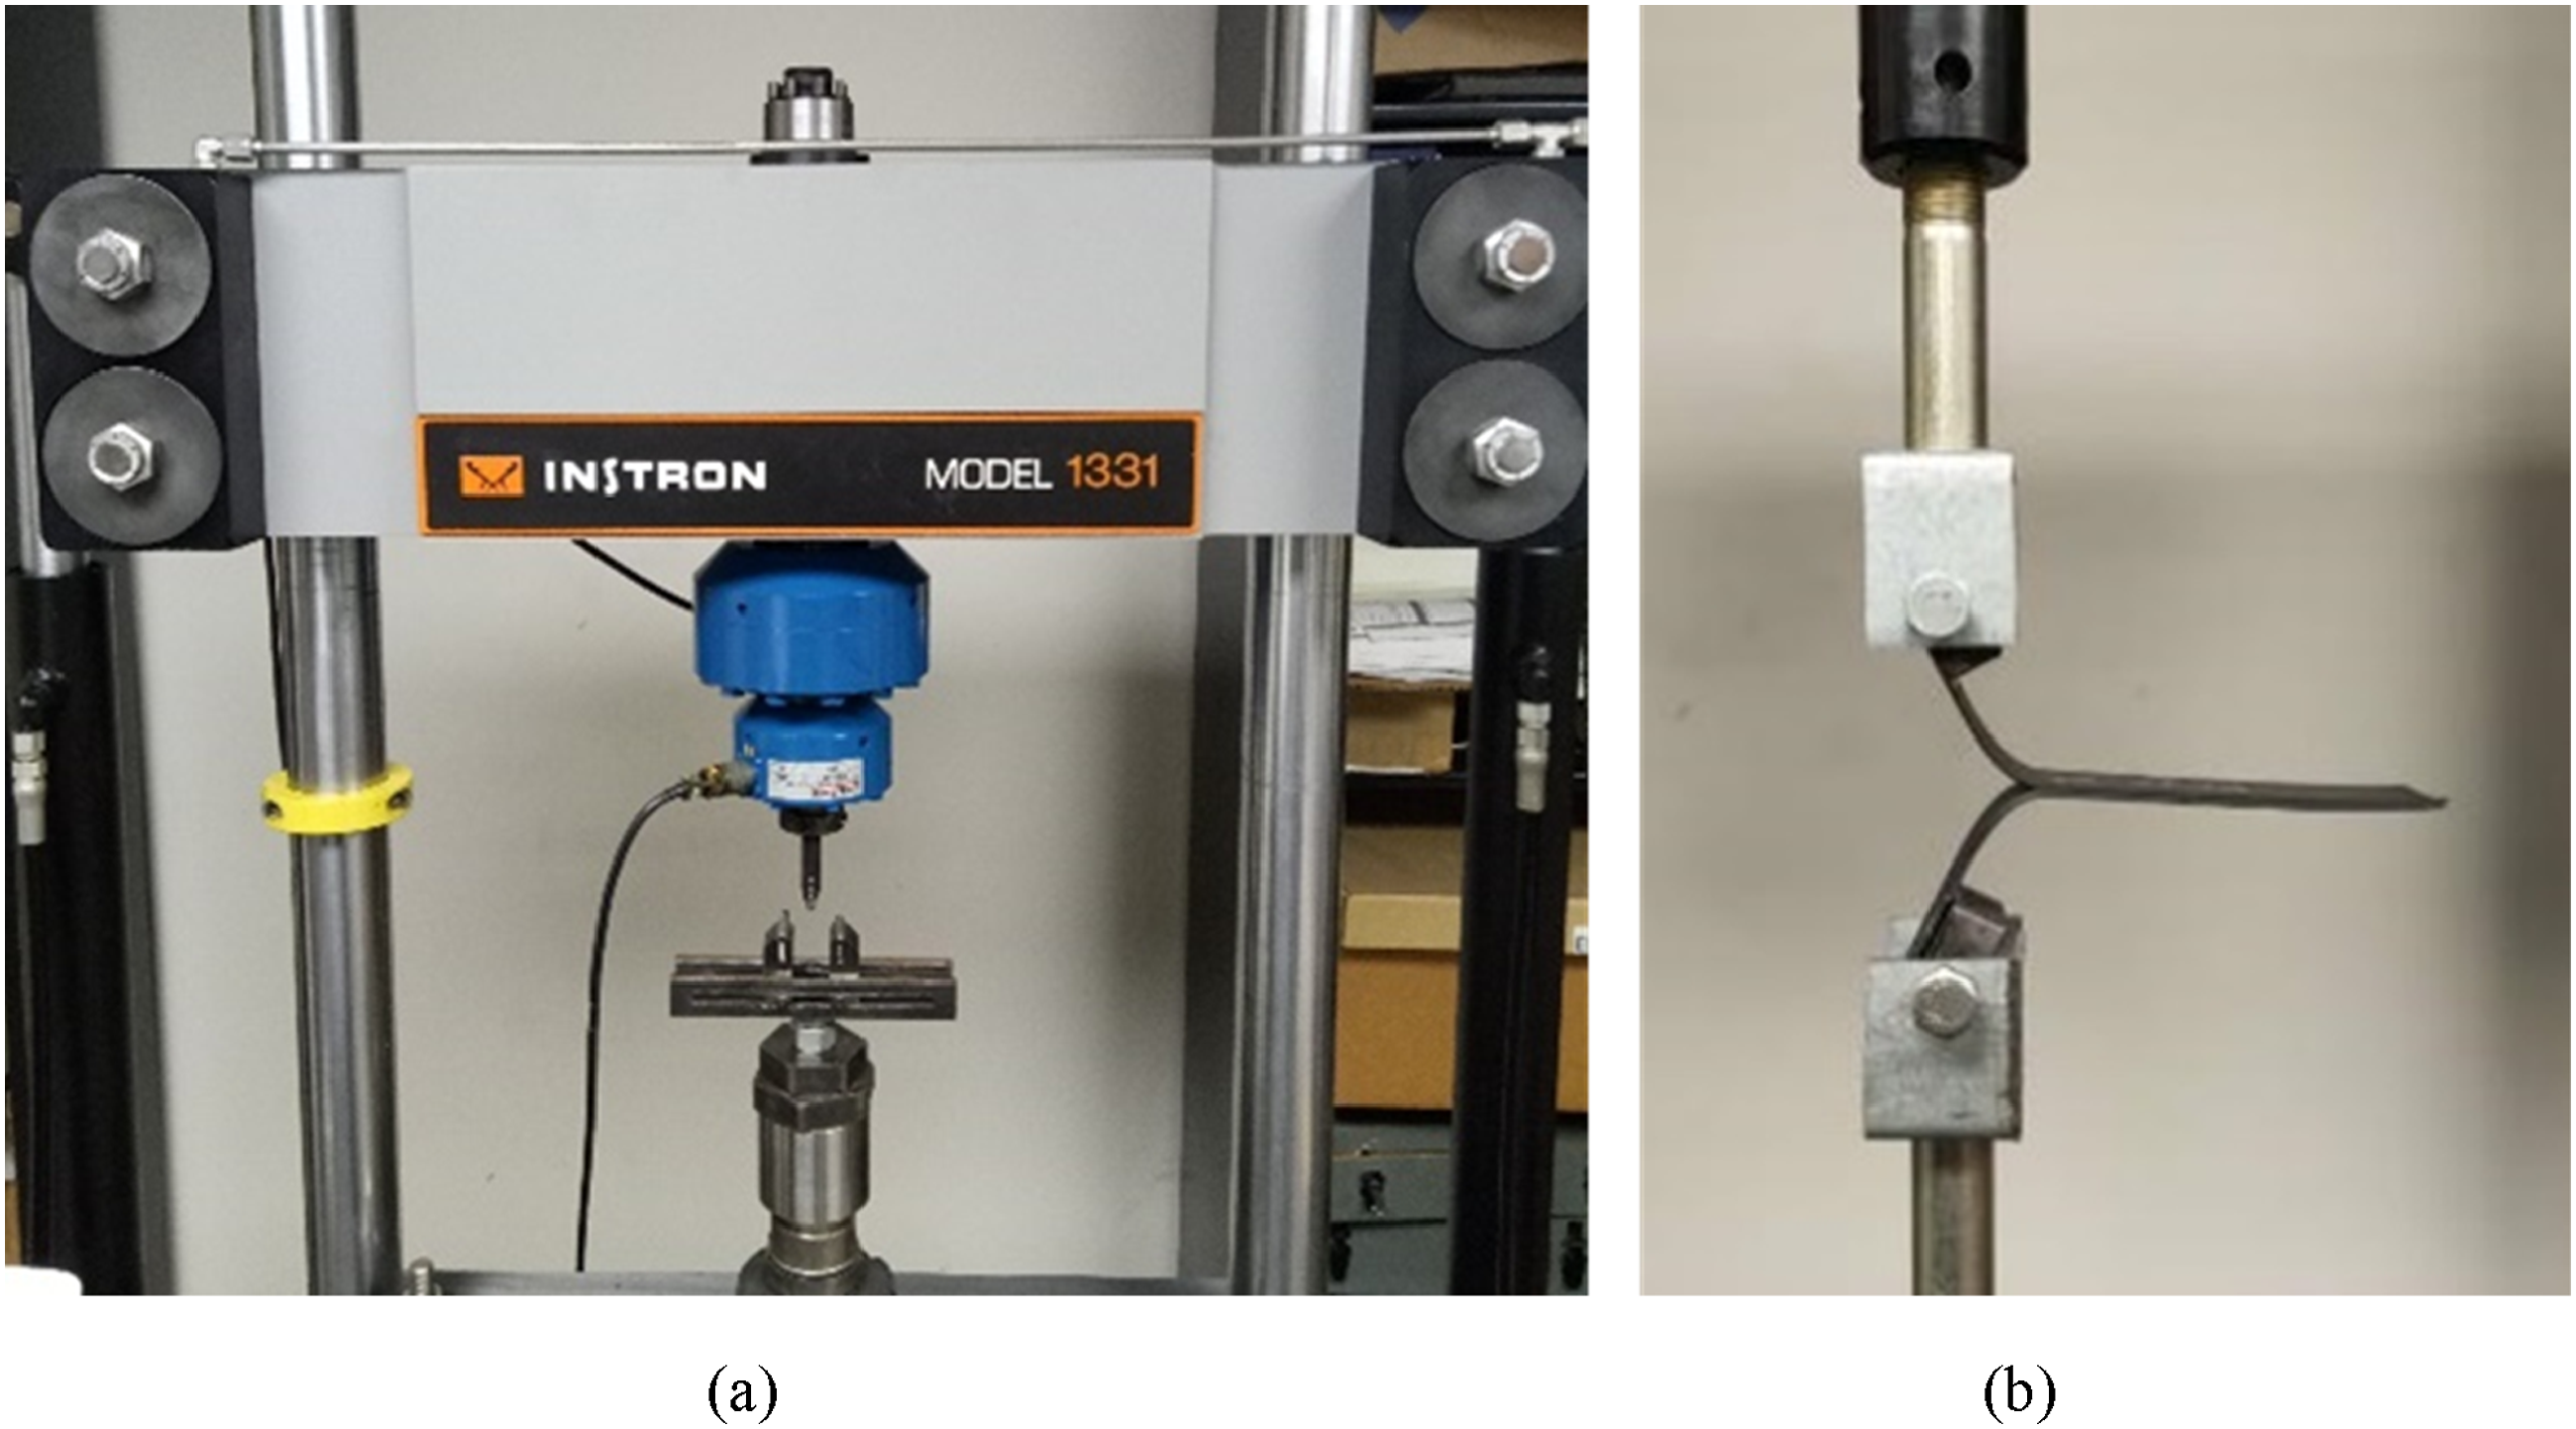
Flexural Tests
Three specimens were tested for each configuration. A proper fixture with a 5 mm diameter nose, as required by ASTM D790, was used for all the three-point bending tests. The samples were marked on the edges of the support span and the center line to ensure that they were aligned with the loading fixture and that the loading was applied correctly. The load-deflection (Pi, Di) data were collected for further analysis of flexural properties. Based on the ASTM D790 formulation, a proper load speed is to be calculated by equation (2) as below: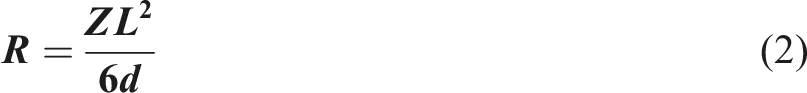
DCB tests
Before each test, all DCB samples were opened carefully along the pre-cracked middle interface. Adhesives were applied to the sample and the bonding blocks using Loctite 414 and Loctite 496 superglue until they were partially cured to facilitate strong bonding. The sample and the loading blocks were then compressed for at least 30 minutes to ensure strong interfacial adhesion and prevent debonding due to triaxial loading. All samples were first loaded onto the fixture for a pre-crack stage until a 50 mm pre-crack was reached. The selection of 50 mm pre-crack is based on the presumed boundary conditions to ensure the samples have a length-to-depth ratio of less than 10 to achieve proper stiffness-calibrated correction for GIC calculation as prescribed by the standard.
21
The sample was unloaded, returned to its original position, and reloaded until failure. All tests were recorded with multiple moving microscopes
21
with the associated lifting and railing mechanisms, as shown in Figure 4(a). The sample loaded onto a load block and undergone mode I fracture testing is shown in Figure 4(b). The moving microscopes, namely the Dino-Lite 0.8MP and the Jiusion endoscope, were used to record the crack opening with a moving fixture that has mobility in both X- and Z- directions to track crack propagation length. Traction length was monitored and synchronized with the machine-logged opening load and separation displacement for GIC calculation. For a valid test, the DCB samples were expected to maintain horizontal on their free end, indicating a proper load transfer toward the crack front from the central plane. Incidents of undesired responses, such as asymmetric opening or flexural failure of the beam, were recorded and analyzed separately. (a) The traveling optical microscope setup for the DCB test, and (b) The DCB setup and tracking of crack propagation.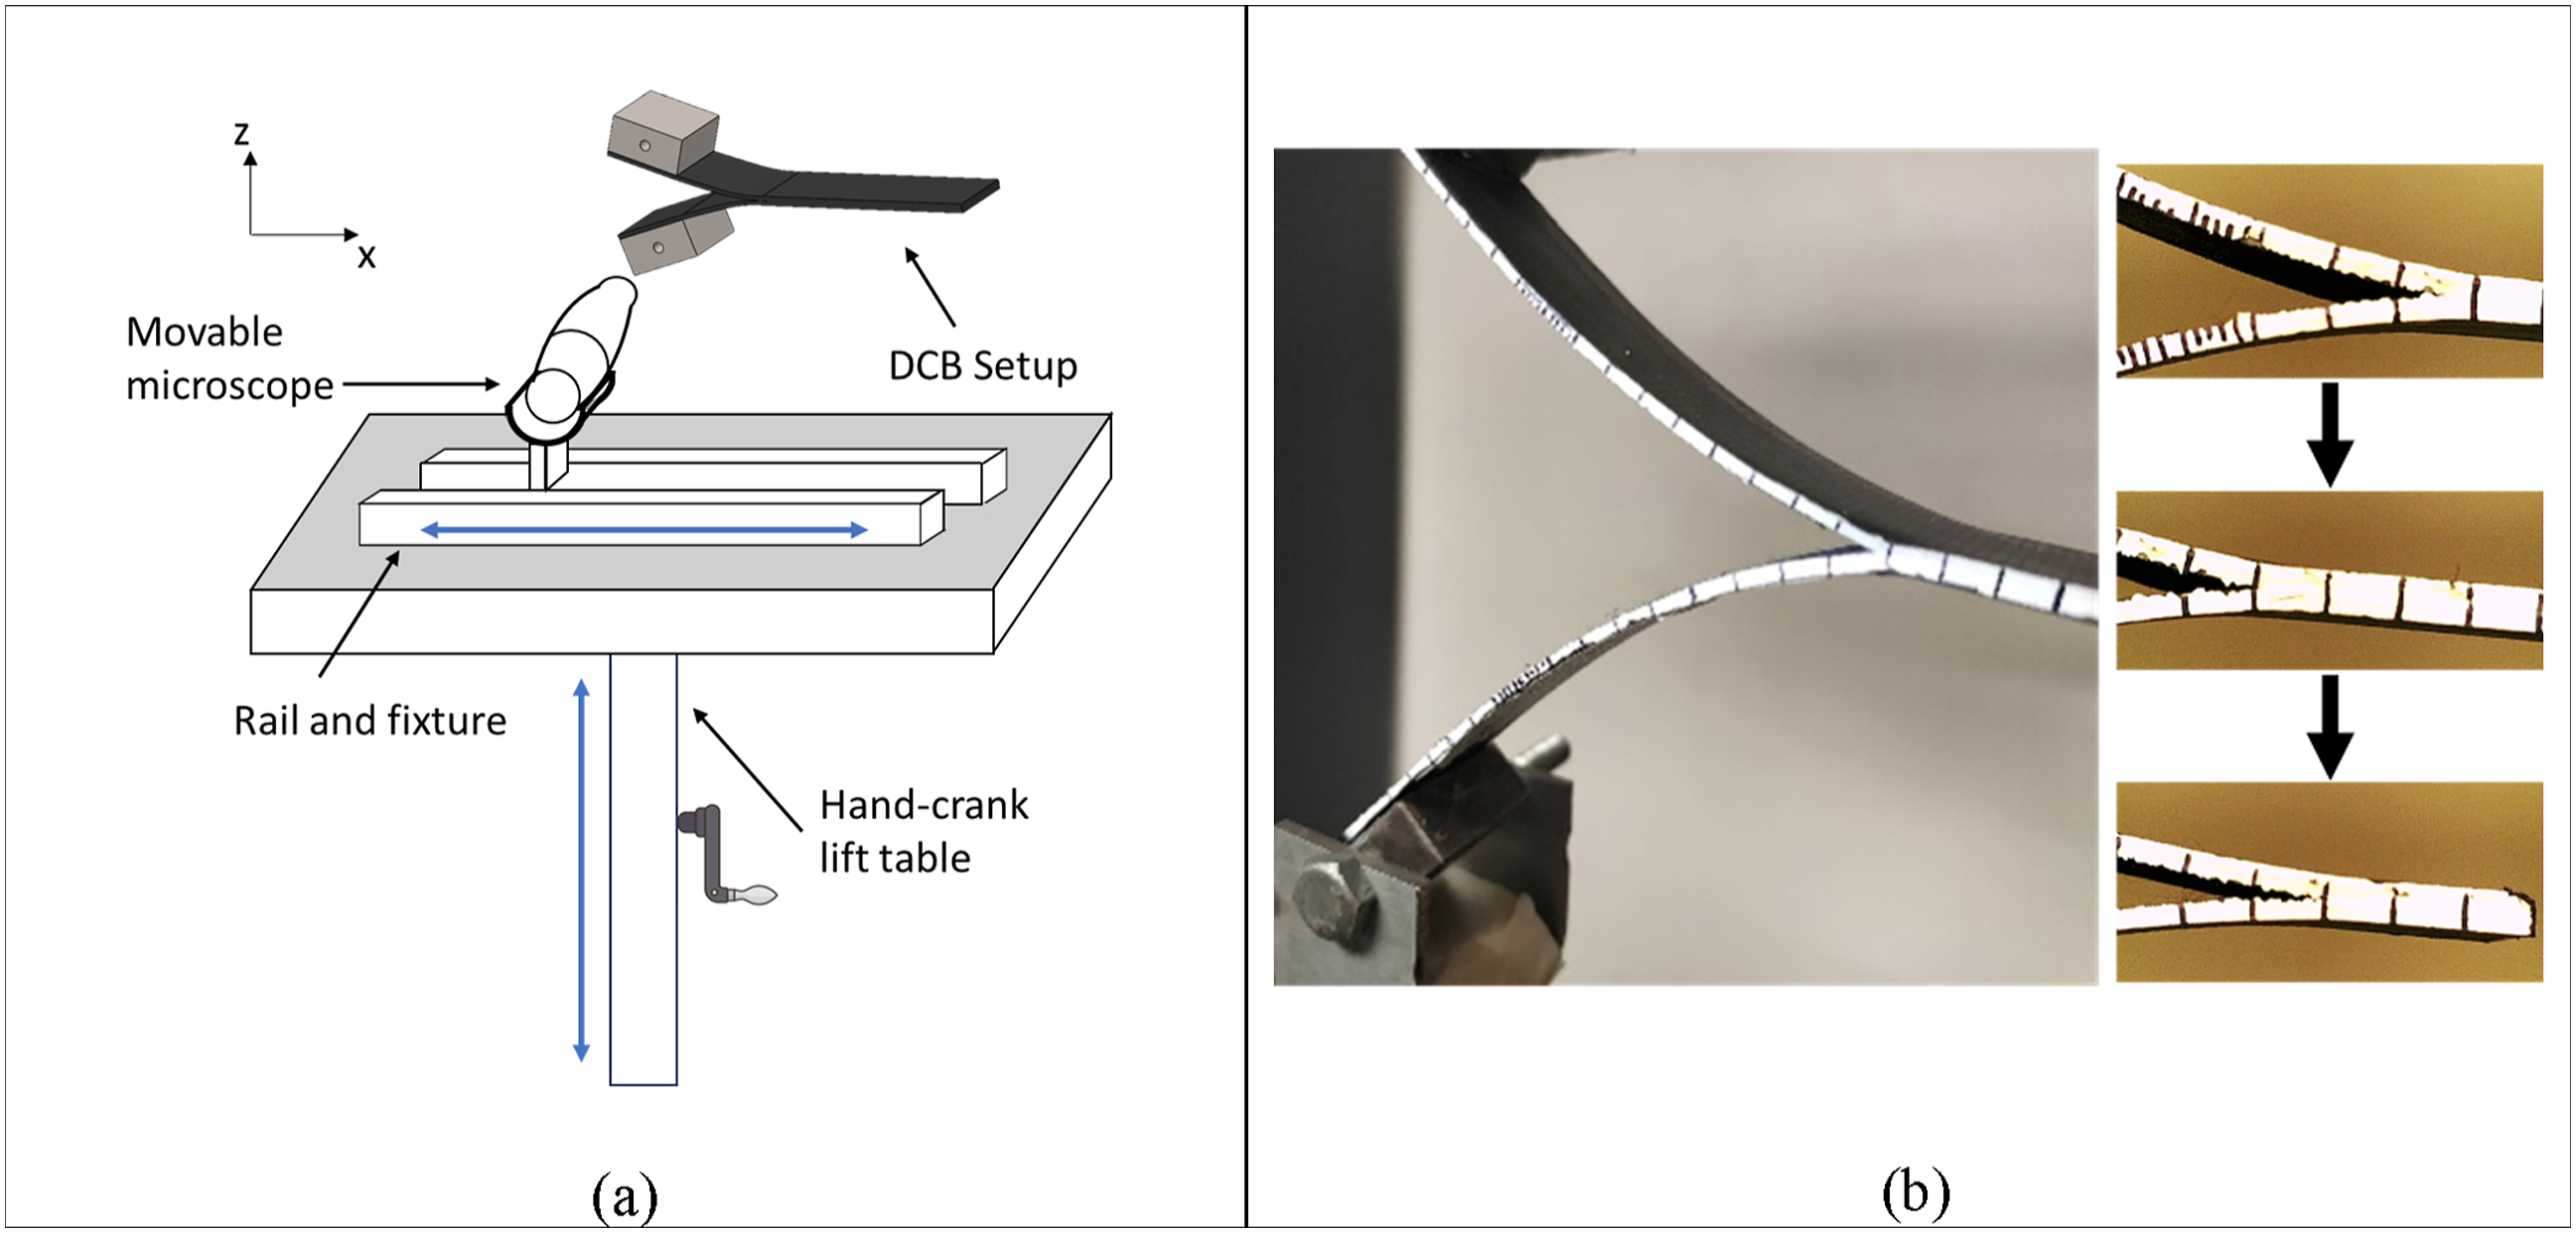
Data reduction
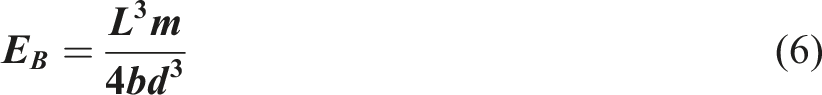
The flexural data were recorded in pairs of (deflection Di, load Pi) and processed regarding ASTM D790 for the flexural modulus and flexural strength of three-point bending tests following the equations below:
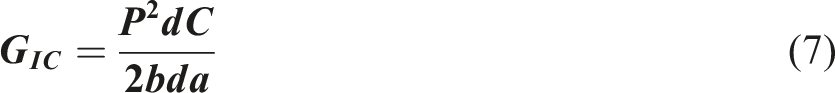

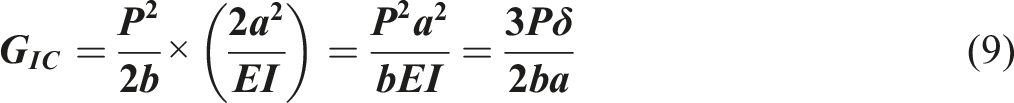
Further derivation of some of the corrections can be found in Ref. 24,25,63 for shortening of the bending arm, large deflection correction, and the geometrical correction of the loading block. The full MBT formulation is: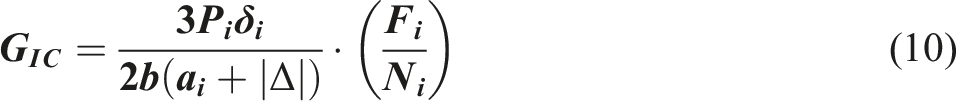
for which Fi and Ni are correction factors for rotation of the loading block and large displacement,26,63 and L′ is the half T-tab length, as shown in Figure 2. An investigation of the deviation of the centroid of the flexural rigidity within the arms shows a negligible difference in the calculated GIC (<1%). Therefore, correction for this effect is not needed in this case by changing the formulation of t, replacing the distance between the load block bond line and the centroid of flexural rigidity from 0.75 mm, the halved thickness of one arm of the double cantilever, to 0.25 mm, 0.125 mm, and 0.15 mm toward the opening interface for 8 C/10G, 10C, and 12G, respectively. The shifted centroid is due to the lamina stack-up sequence of continuous fiber and the Onyx layers varying by the configurations. The equivalent centroid was found by finding the height of the centroid plane when the flexural rigidity is equal between the upper and the lower halves of the beam. The crack length [ai] was replaced by [ai+ 
Variation and fluctuation for the observed GIC were evident during the pilot study. Therefore, statistical treatment was applied to harmonize the datasets for comparison. The processed GIC data were disseminated into initial and propagation GIC and grouped to find statistical significance between and within configurations. Nine initial values were calculated using the NL method for crack initiation GIC for carbon-carbon and glass-glass interfaces as stated in the standard. 21 Two other representative values were distilled from the data for comparison: an average of the crack length corresponding to an opening of 50-85 mm and the median value for each data series, of the nine tests for each material type. The dynamic GIC evolution along the crack propagation process, data points were grouped into initial, median, and average categories to perform ANOVA treatment. At least 20 GIC values were used for each sample for the statistical assortment to create the median and the average value.
Result and discussion
Flexural test result
The flexural properties of AMFRP samples are reported in Figure 5. A general trend for a positive correlation for higher flexural properties with respect to higher CFF content is evident. The flexural stress-strain curves for both CCF and HSHTG samples are shown in Figure 6. (a) Flexural strength and (b) flexural modulus for CCF and HSHTG samples. Flexural stress-strain curve for (a) CCF and (b) HSHTG samples.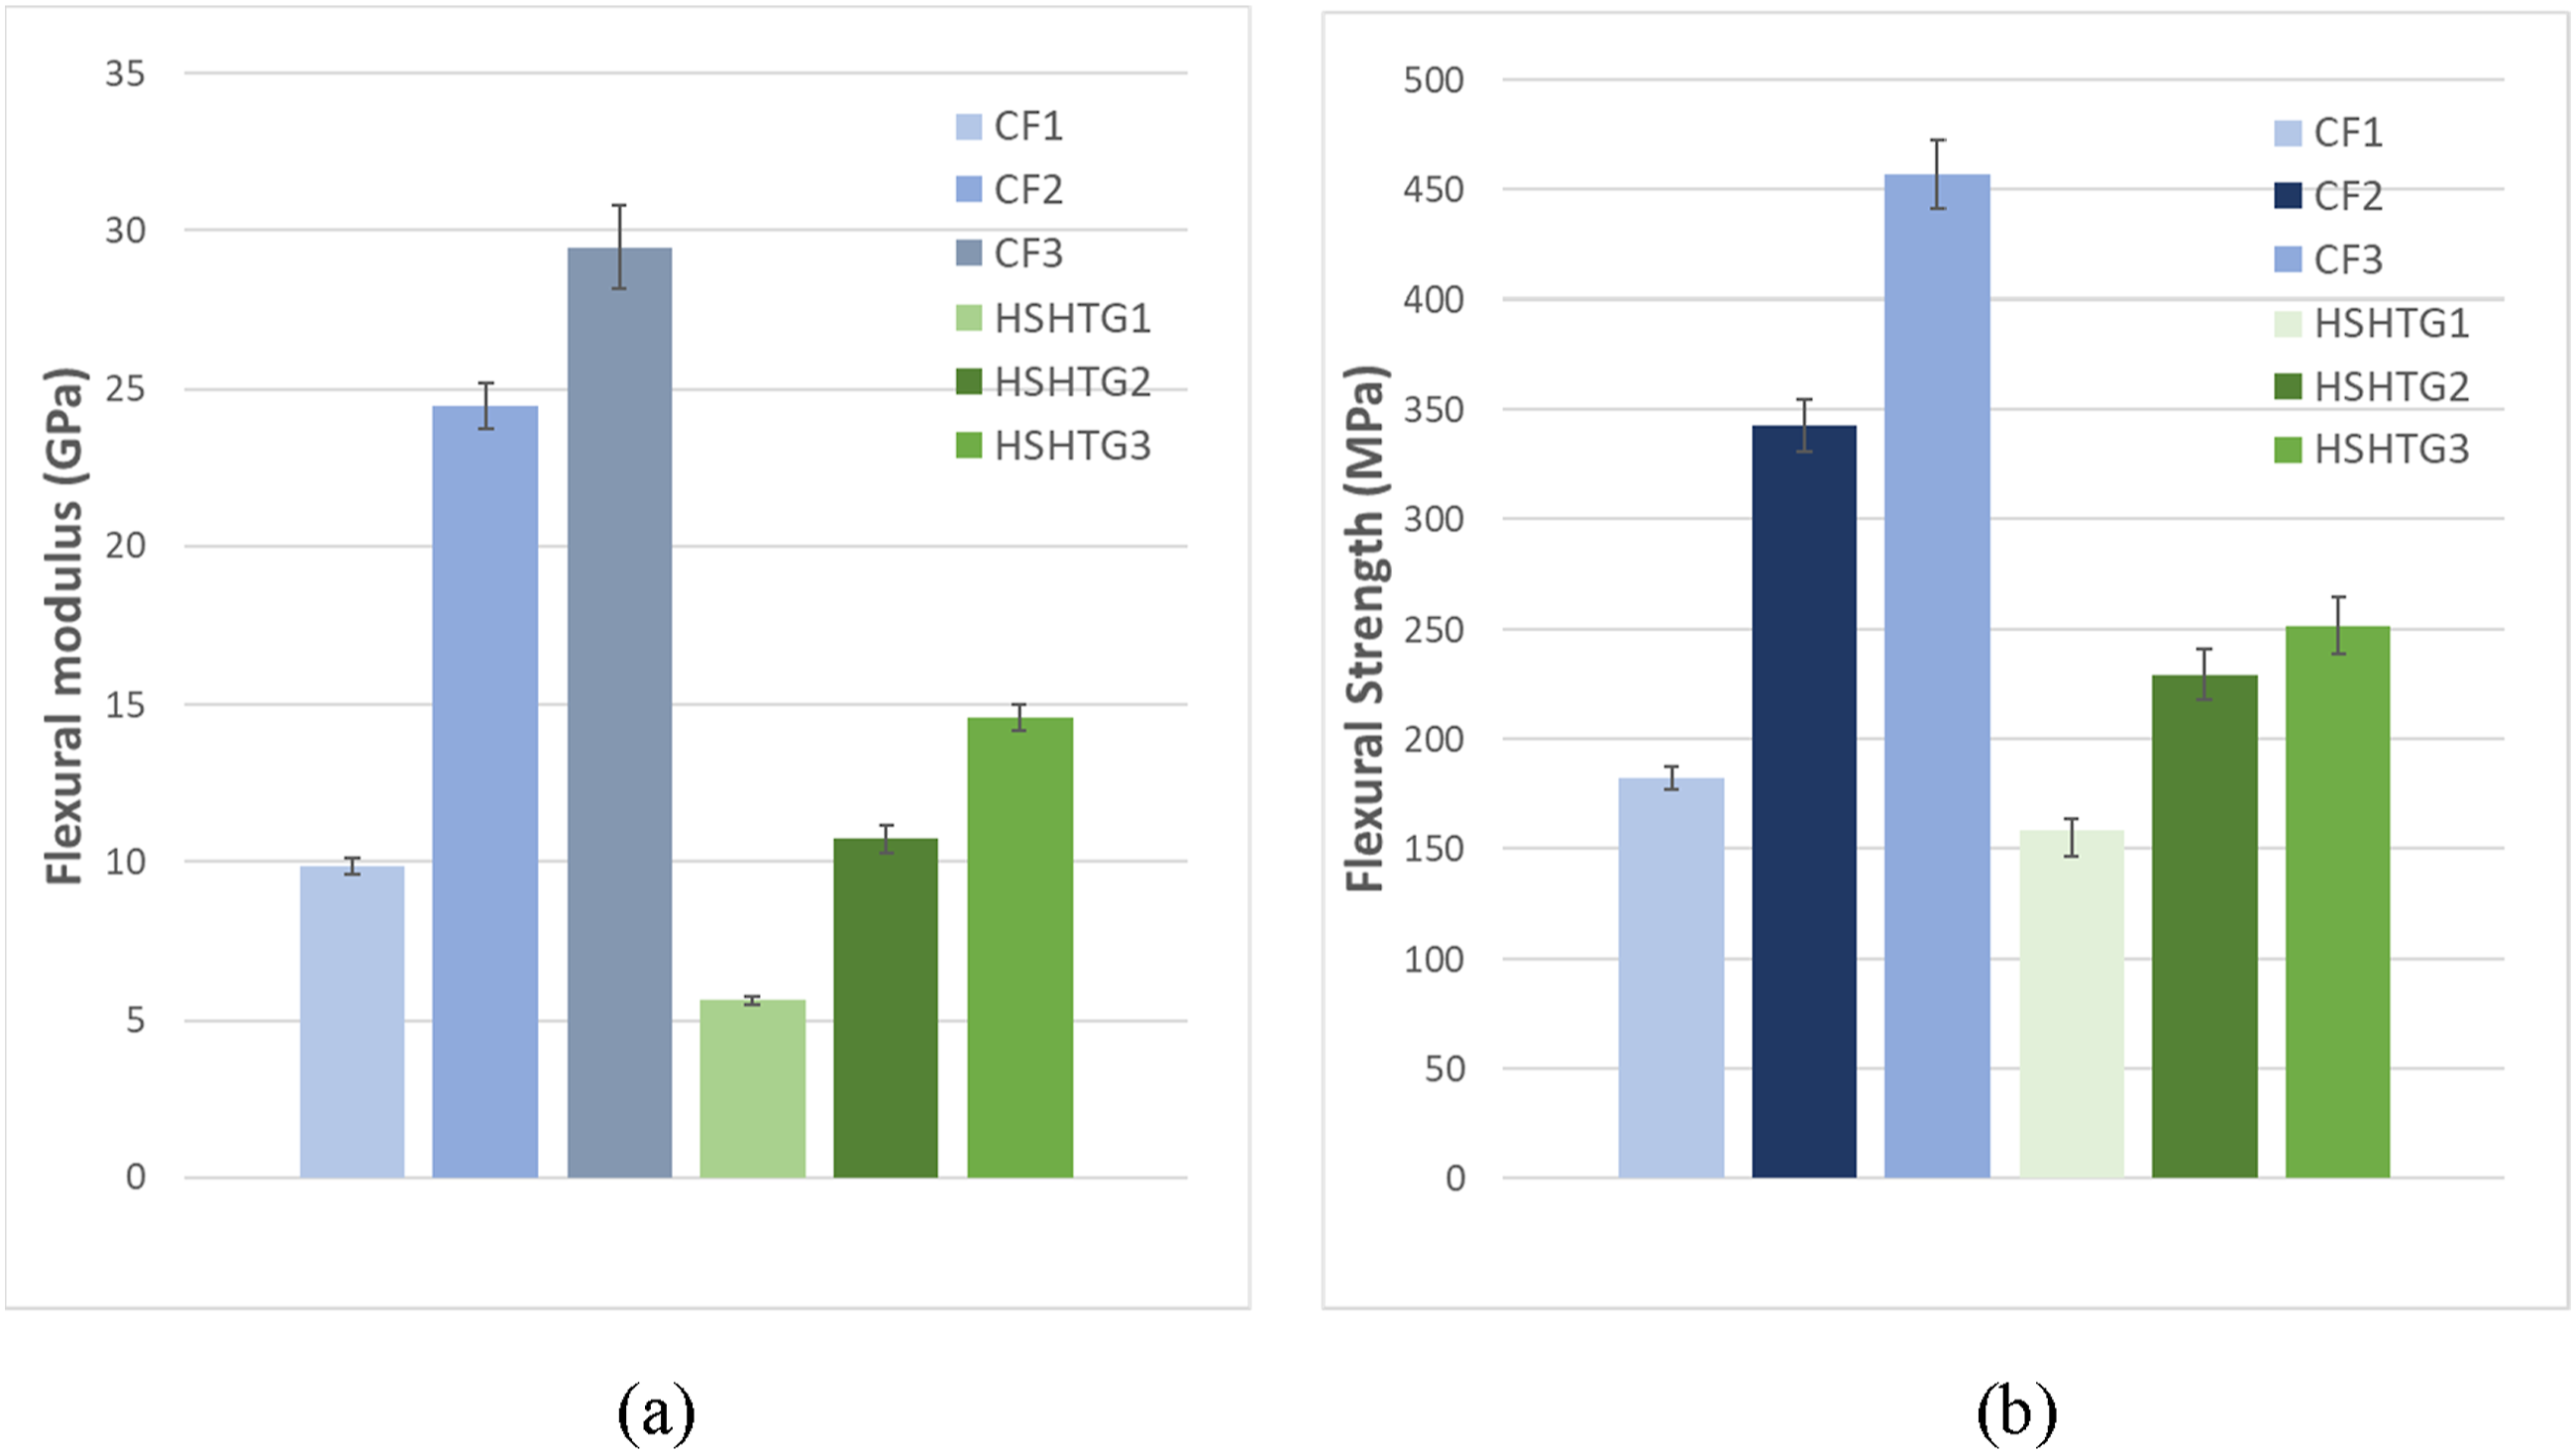
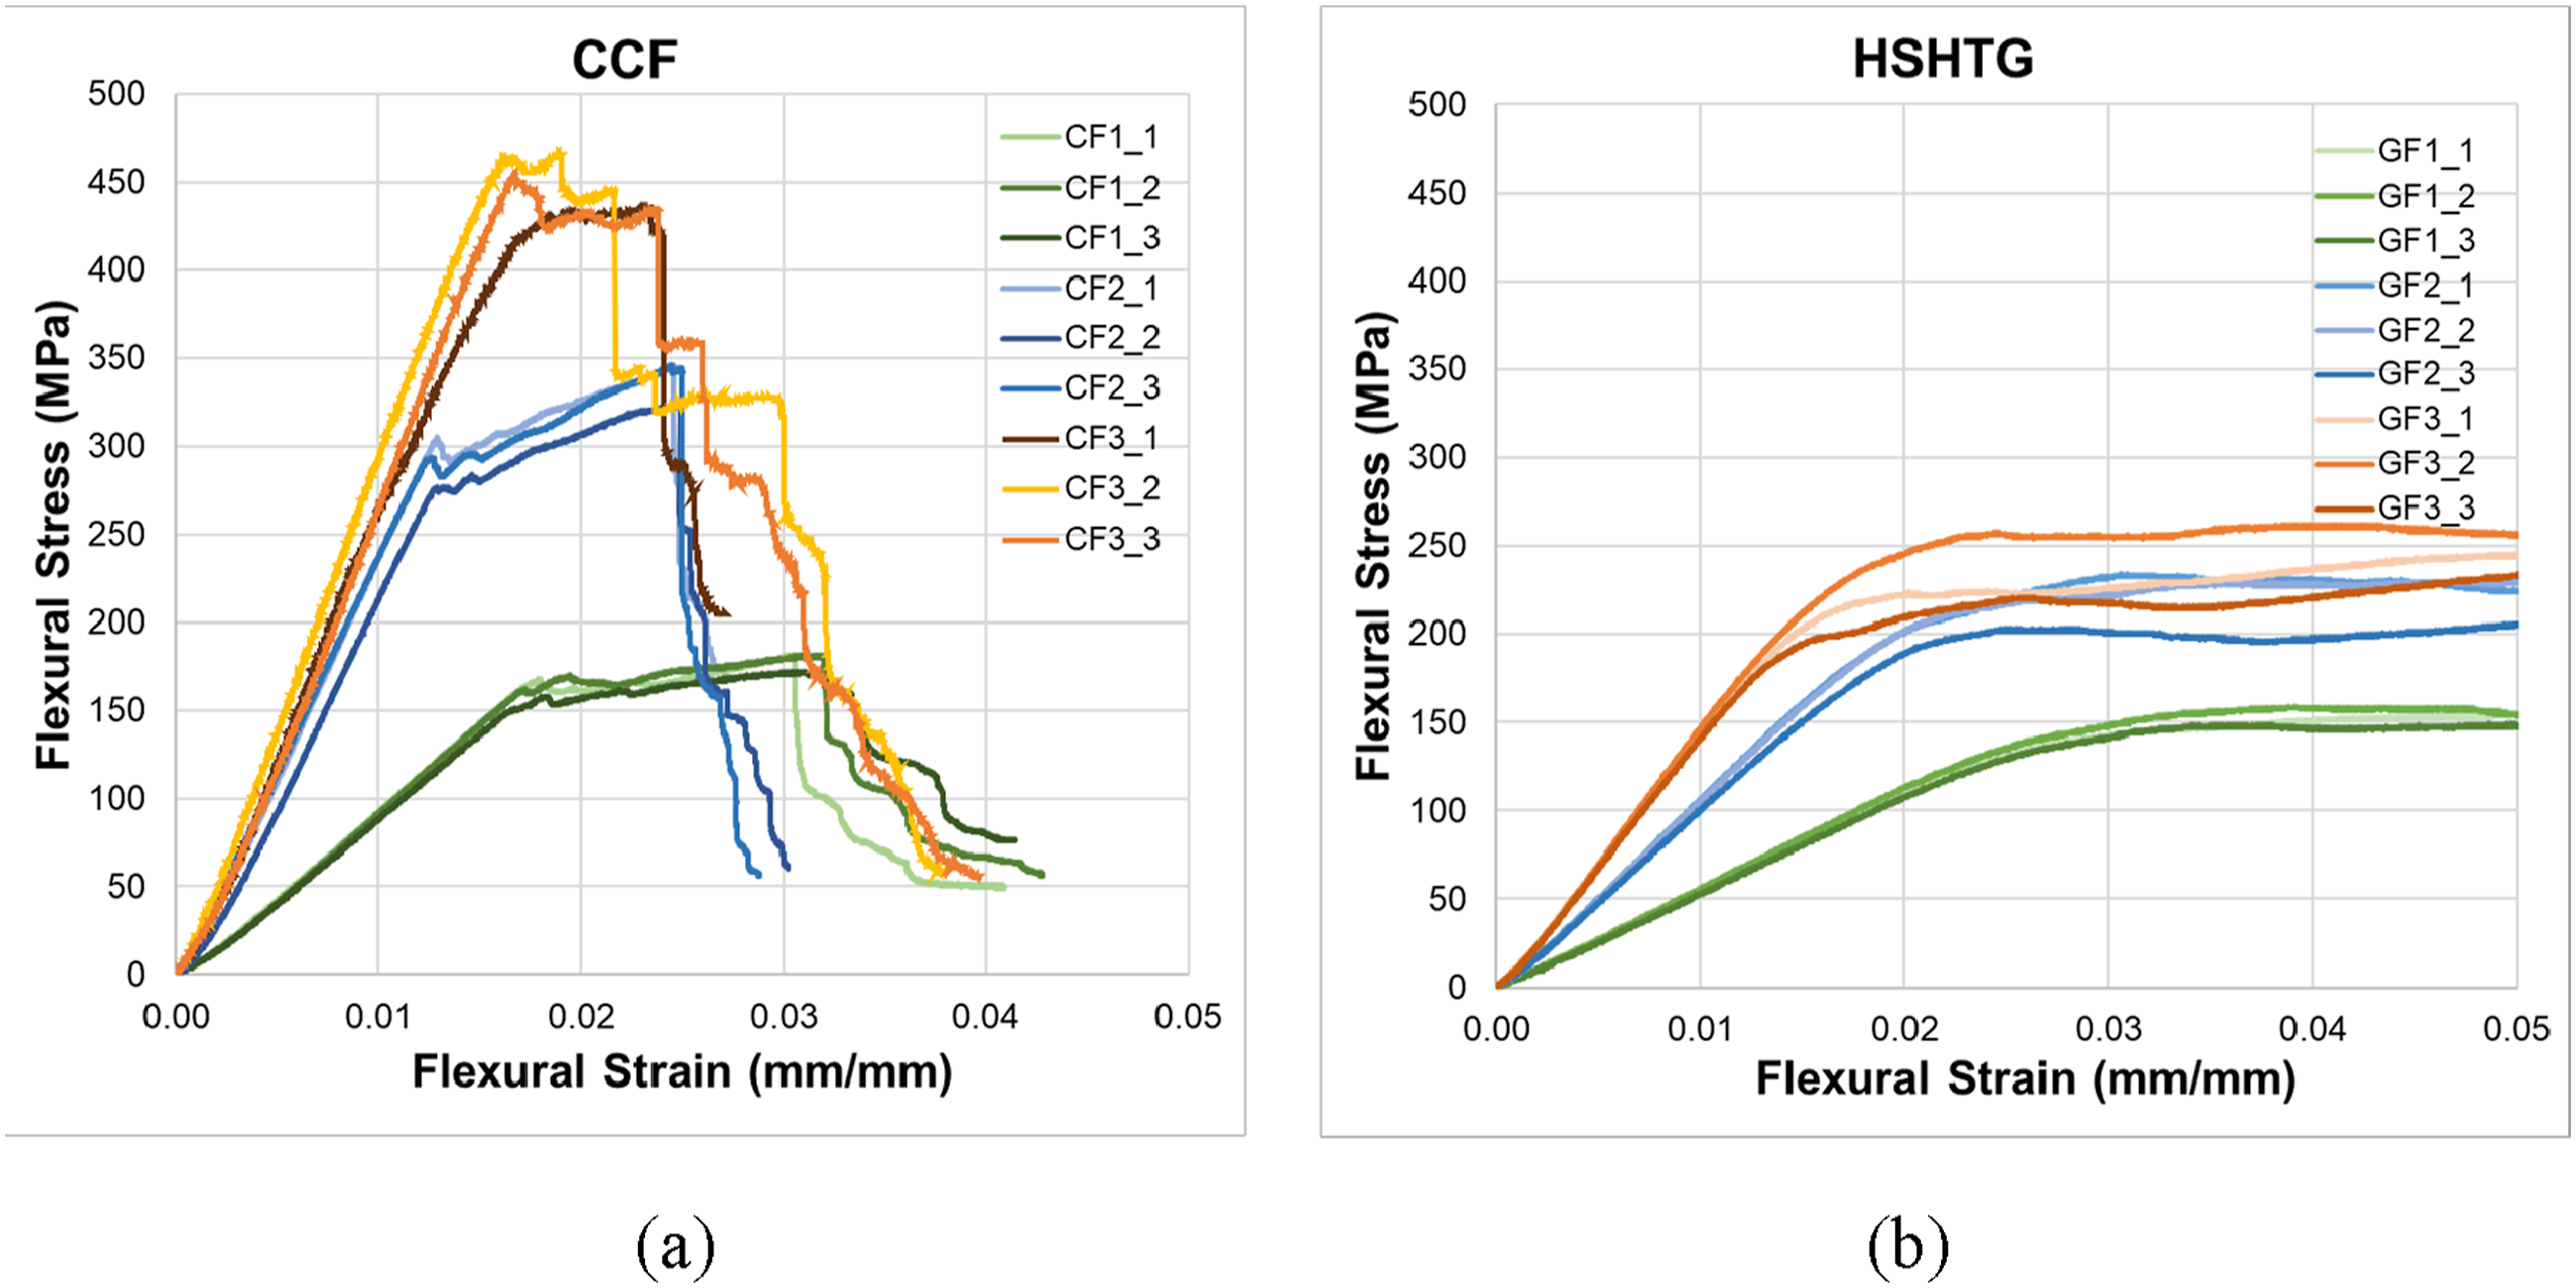
Due to the high anisotropy of the laminated FRP composite structure, the surface layer underwent concentrated compressive stress exerted from the circular load head. The responses manifest the characteristic nonlinearity governed by the layer-by-layer construct and the stochastic void distribution for AM-made FRP composites, synergizing the anisotropy of fiber-matrix mismatch, intralaminar, and interlaminar discontinuities. Differences in the flexural responses for CCF and HSHTG were identified: CCF presented a multi-stage load drip, and HSHTG samples presented a prolonged plateau of plastic deformation. Differences between the two responses highlight the threshold of least-bonded interfaces for two compositions, for which one can introduce measures to improve the bonding quality of specific sites by tuning printing parameters. The multi-stage load drop in CCF indicates the stagewise loss of bending stiffness as the fracture is initiated by in-plane and interlaminar shear stress, causing crack propagation alongside load-dropping delamination. The effects were described and evidenced in the uCT images and fractography. 64 In contrast, HSHTG samples show no load drops once a plateau of flexural stress is reached, indicating the material systems are less susceptible to delamination due to a higher strain limit. The plateau of plastic deformation was further investigated and corroborated with the fracture characteristics of HSHTG samples under similar flexural loading for the DCB test in the following sections.
Under complex loading conditions, the fracture of each load drop can be monitored and correlated to specific fracture phenomena.
65
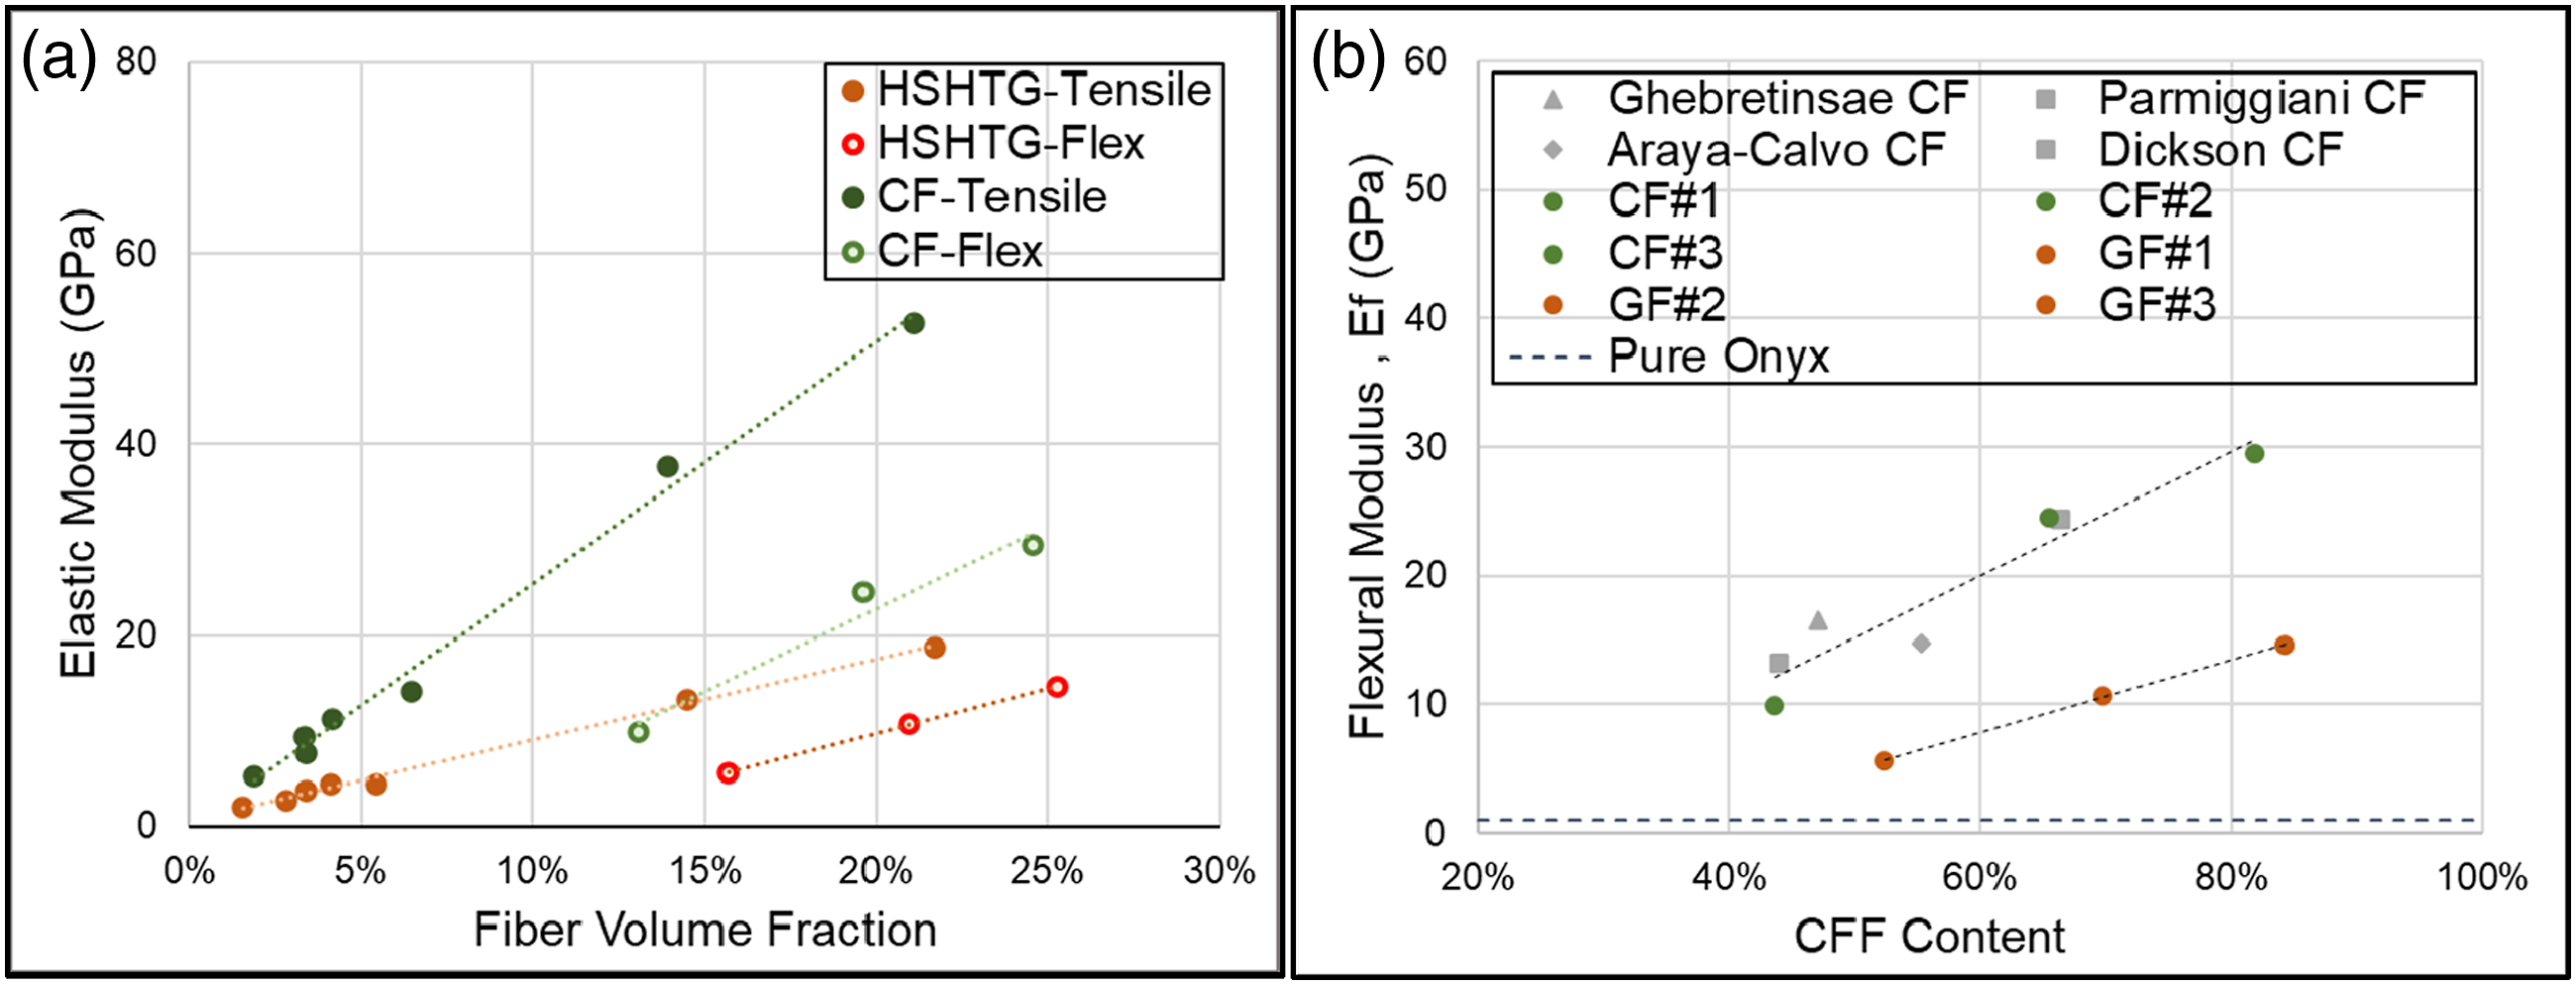
Comparisons were made to correlate the mechanical responses to the configured fiber volume fraction. By the comparison shown in Figure 7(a), at the same level of fiber fraction and irrespective of the reinforcing strategies, the flexural modulus was of lower value than the tensile modulus previously reported.
53
This trend is not universal for all FRP composites since thermoset-based FRP composites typically display a higher flexural modulus than tensile due to various toughening and fracture mechanisms.65,66 The result is consistent with the data provided by the manufacturer datasheet, which corroborates the statement that these 3D-printed structures present a lower flexural modulus than their tensile modulus,
67
possibly due to inherent interfacial bonding and fiber distribution issues from the 3D printing processes. A compilation of flexural modulus for both CCF and HSHTG samples was provided in Figure 7(b) to corroborate the proportional reinforcing effects regarding the fiber fraction. A linear regression was provided for composite beams with symmetrical fiber layout with at least one enclosed wall enclosure for structural integrity. Compared to the conventional CFRP composites, the strain limit for flexure of 3D-printed CFRP has a much higher capacity, resulting from the elastoplastic matrix, the voids that act as plasticizers, and a much lower FVF. The lower FVF also limit the performance of the 3D-printed CFRP compared to conventional structural composites, which normally would be implemented at a 50%–60% FVF.
68
Result of DCB tests and mode I fracture toughness
The compiled mode I fracture toughness values for interfaces of 3D-printed CF-CF and HSHTG-HSHTG composites are shown in Figure 8. Data were filtered to include only data points of steady crack propagation according to the standard, for which noisy data points right after a crack jump were filtered out due to the combined effect of oscillation and loss of proper tension.
21
The crack initiation GIC values were determined by situating the load-displacement relationship with the instantaneous tangent of the curve to identify the away-from-linearity intersection, also known as the NL method. The crack initiation fracture toughness from the NL method was determined to be 1015 ± 166 J/m2 for CF-CF and 1100 ± 114 J/m2 for HSHTG-HSHTG interfaces. The value reported is 20%–30% higher than longitudinally reinforced CF/epoxy composites with higher fiber content
72
and is equivalent to epoxy-based composites reinforced with a 65% volume fraction of unidirectional glass fiber.
73
Mode I fracture toughness for crack initiation and crack propagation for (a) CCF-CCF and (b) HSHTG-HSHTG.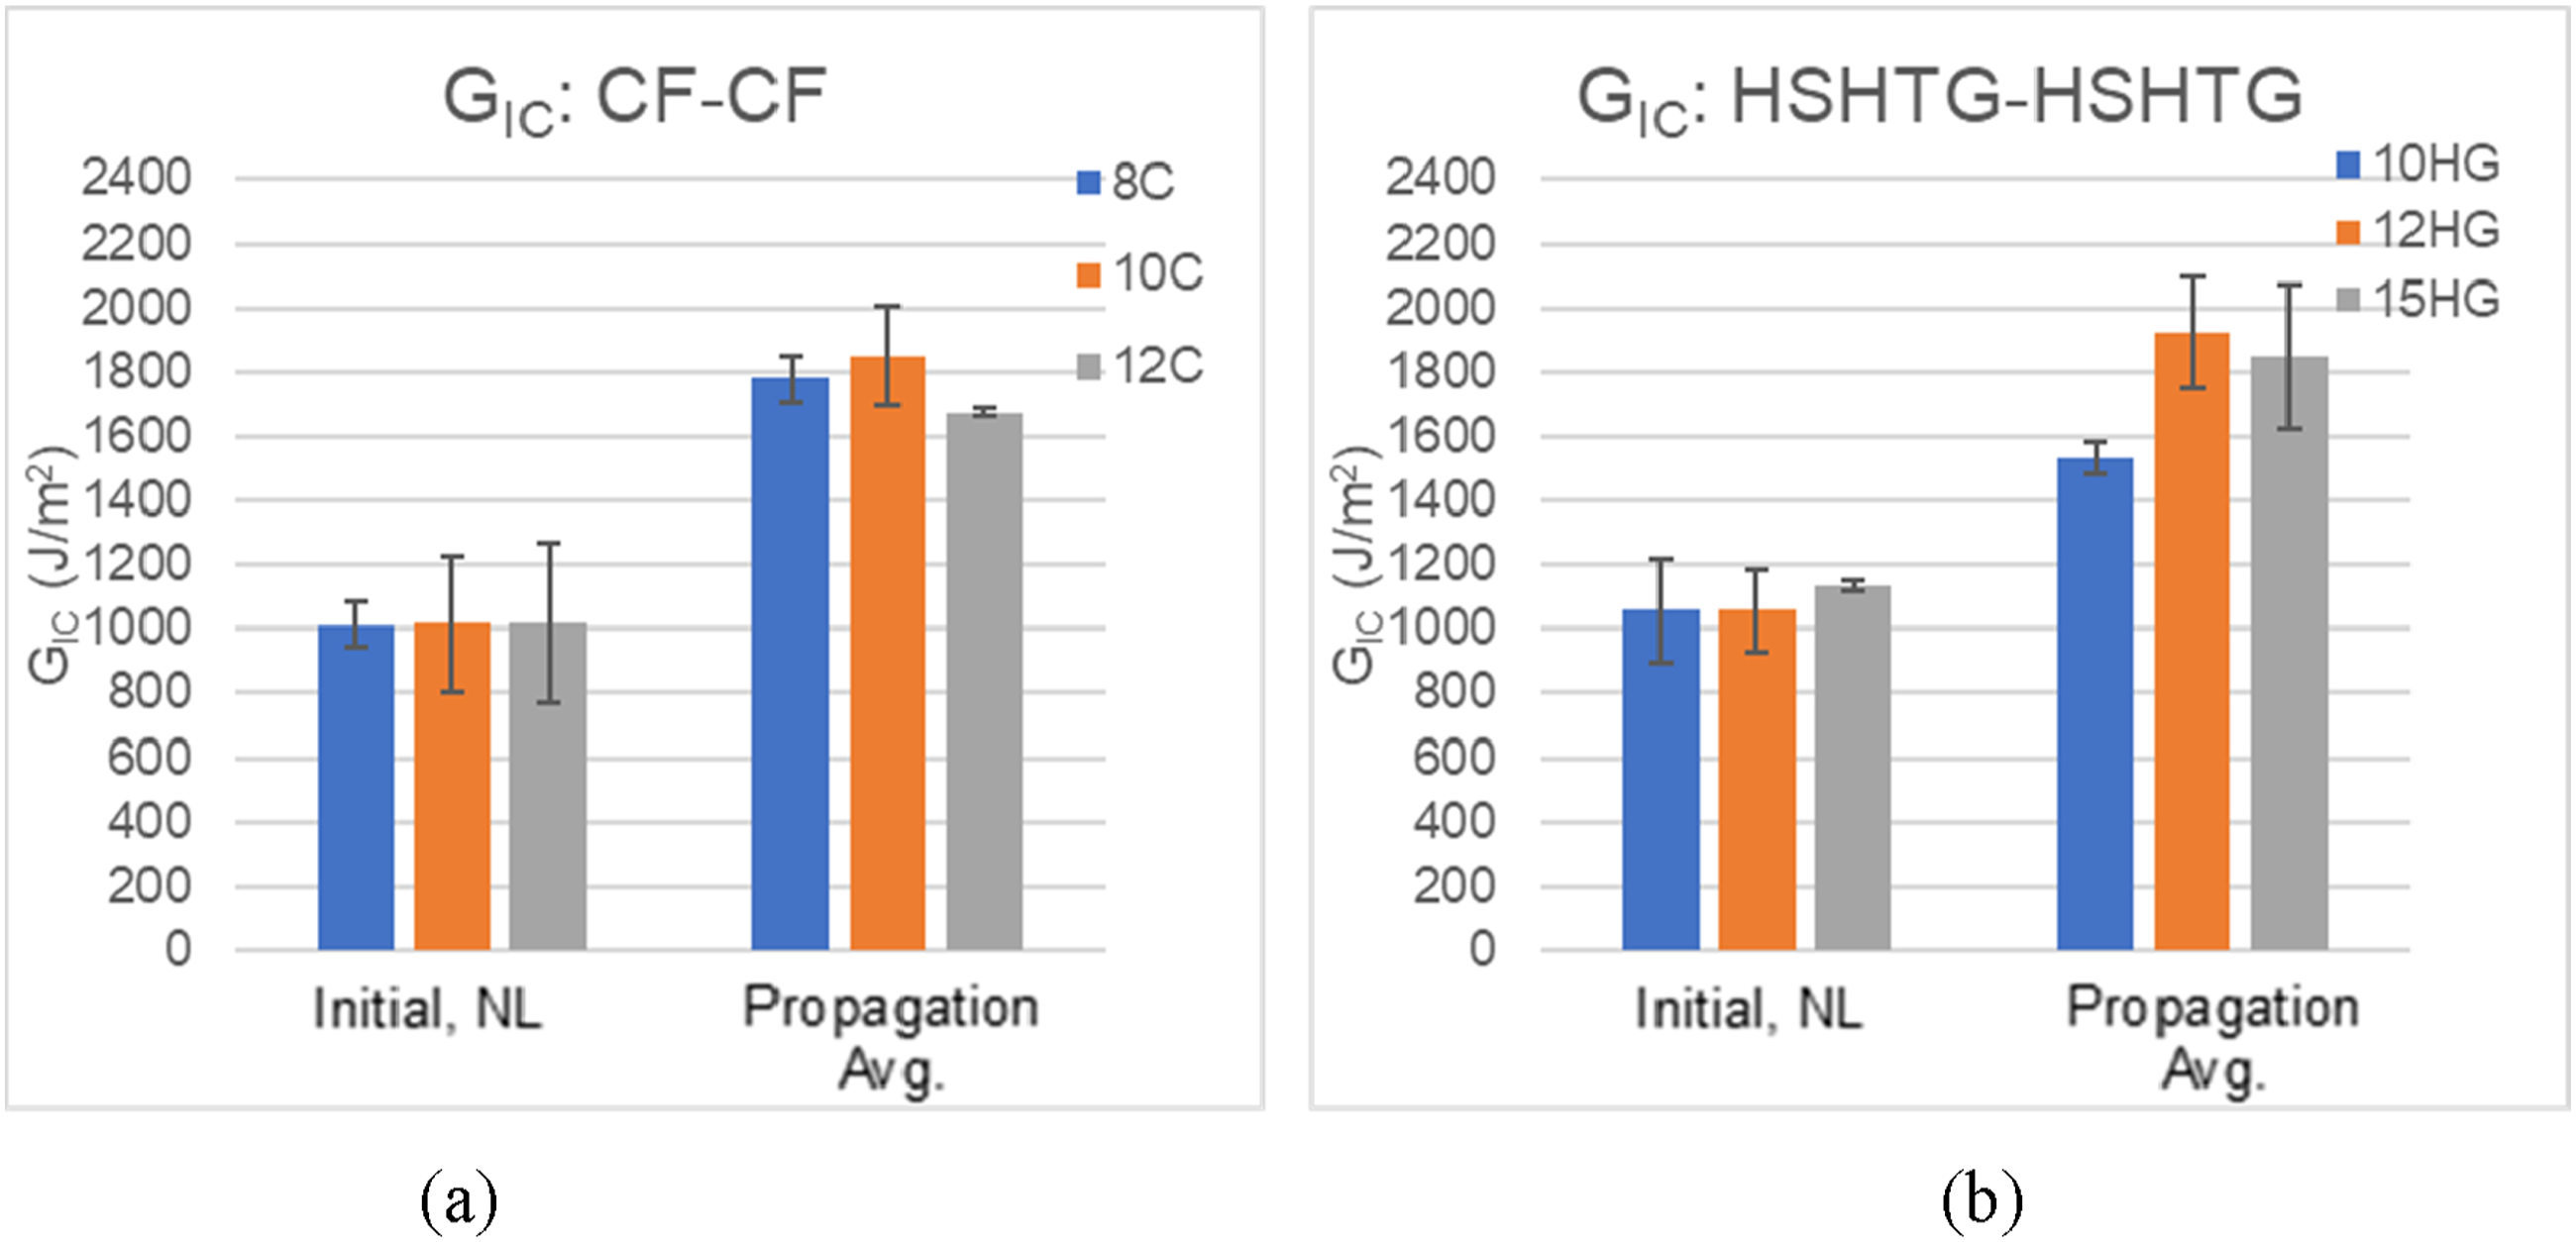
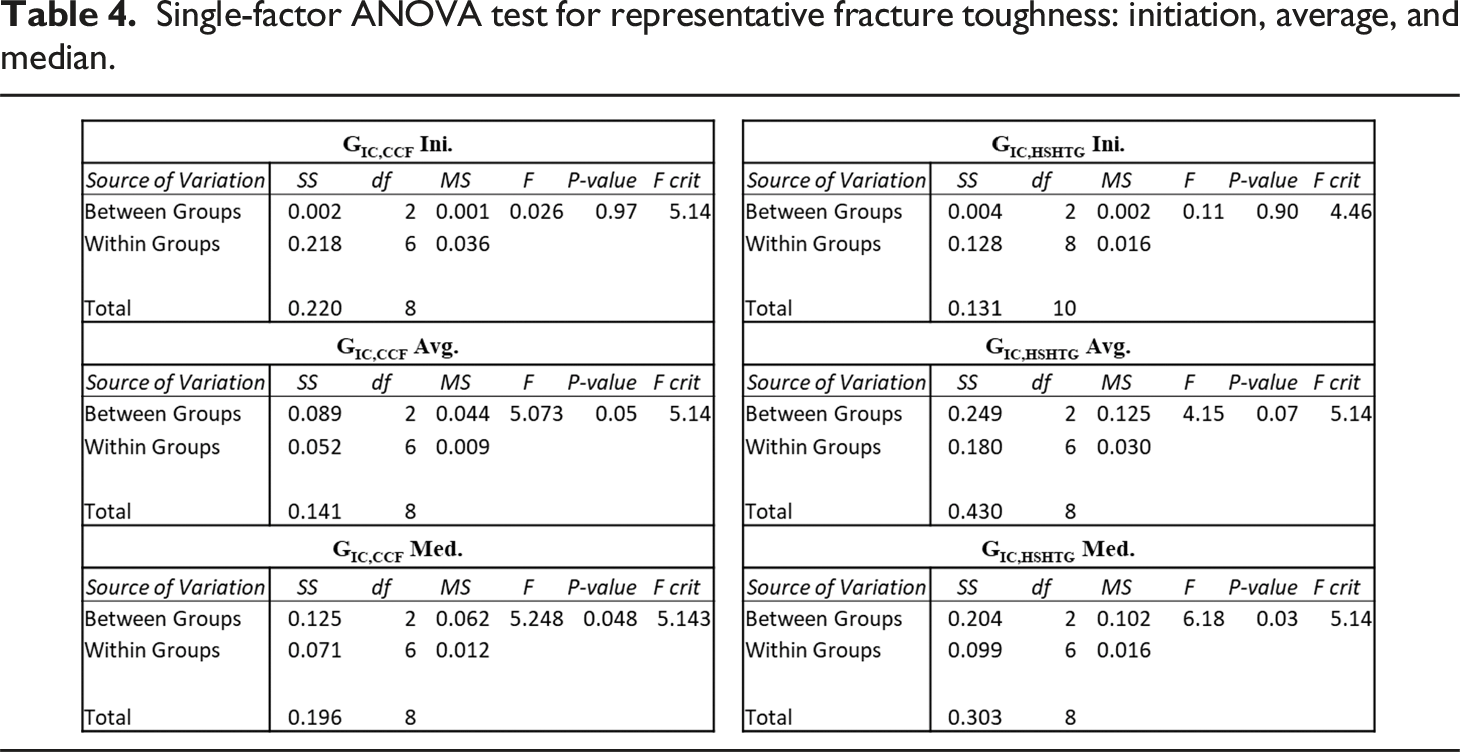
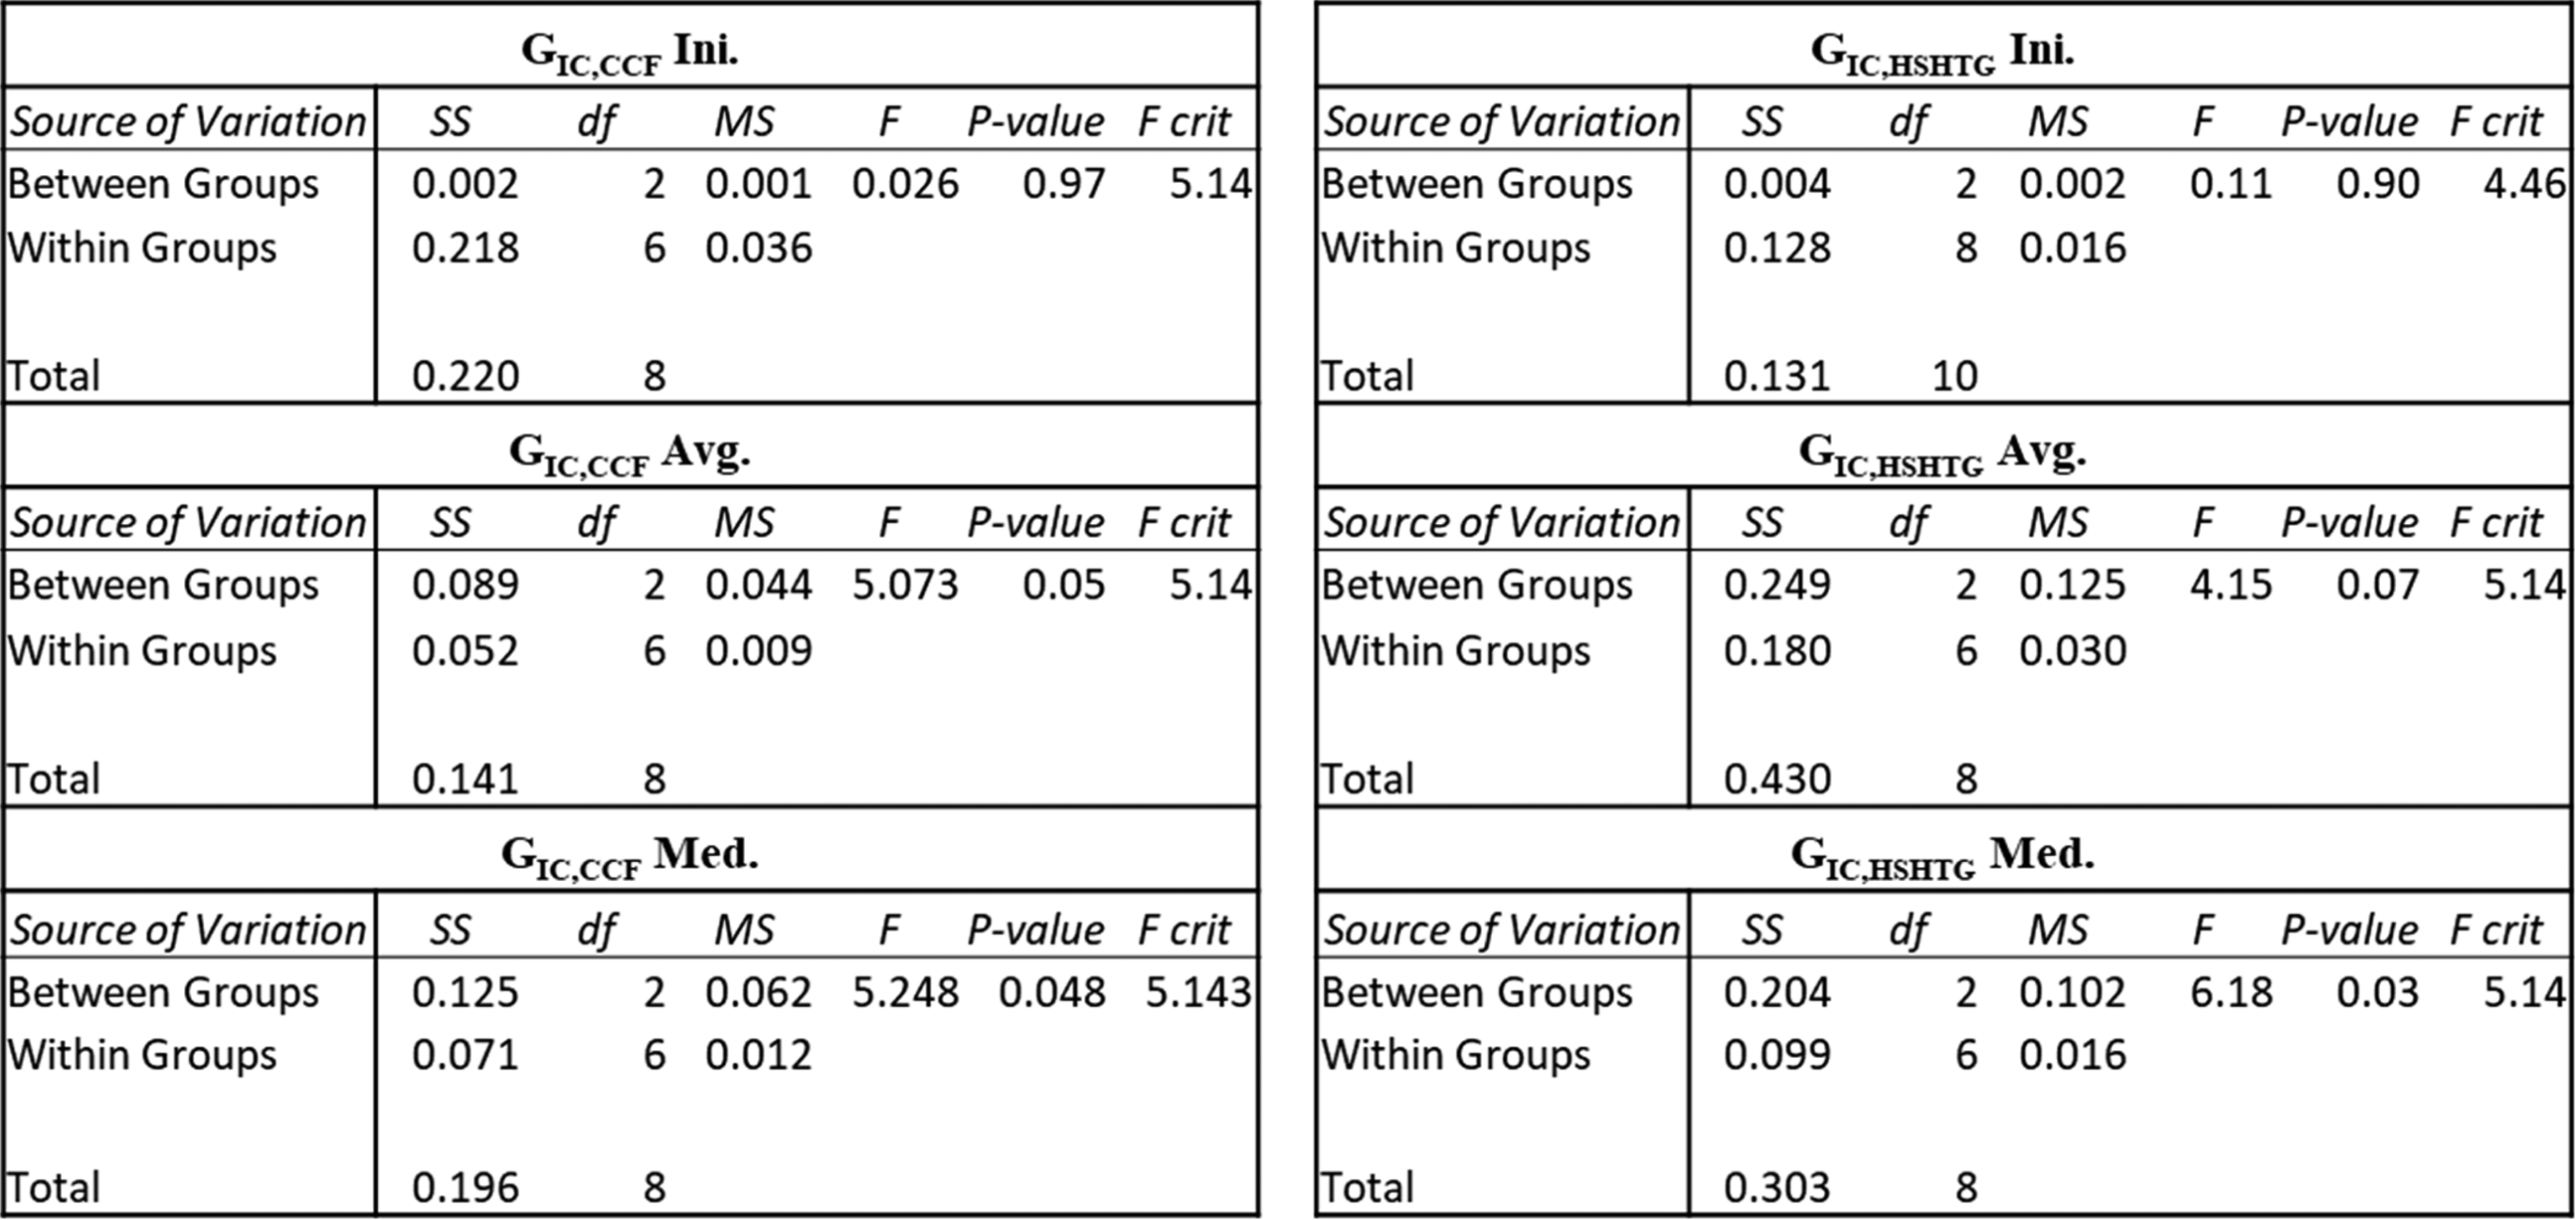
Single-factor ANOVA test for representative fracture toughness: initiation, average, and median.
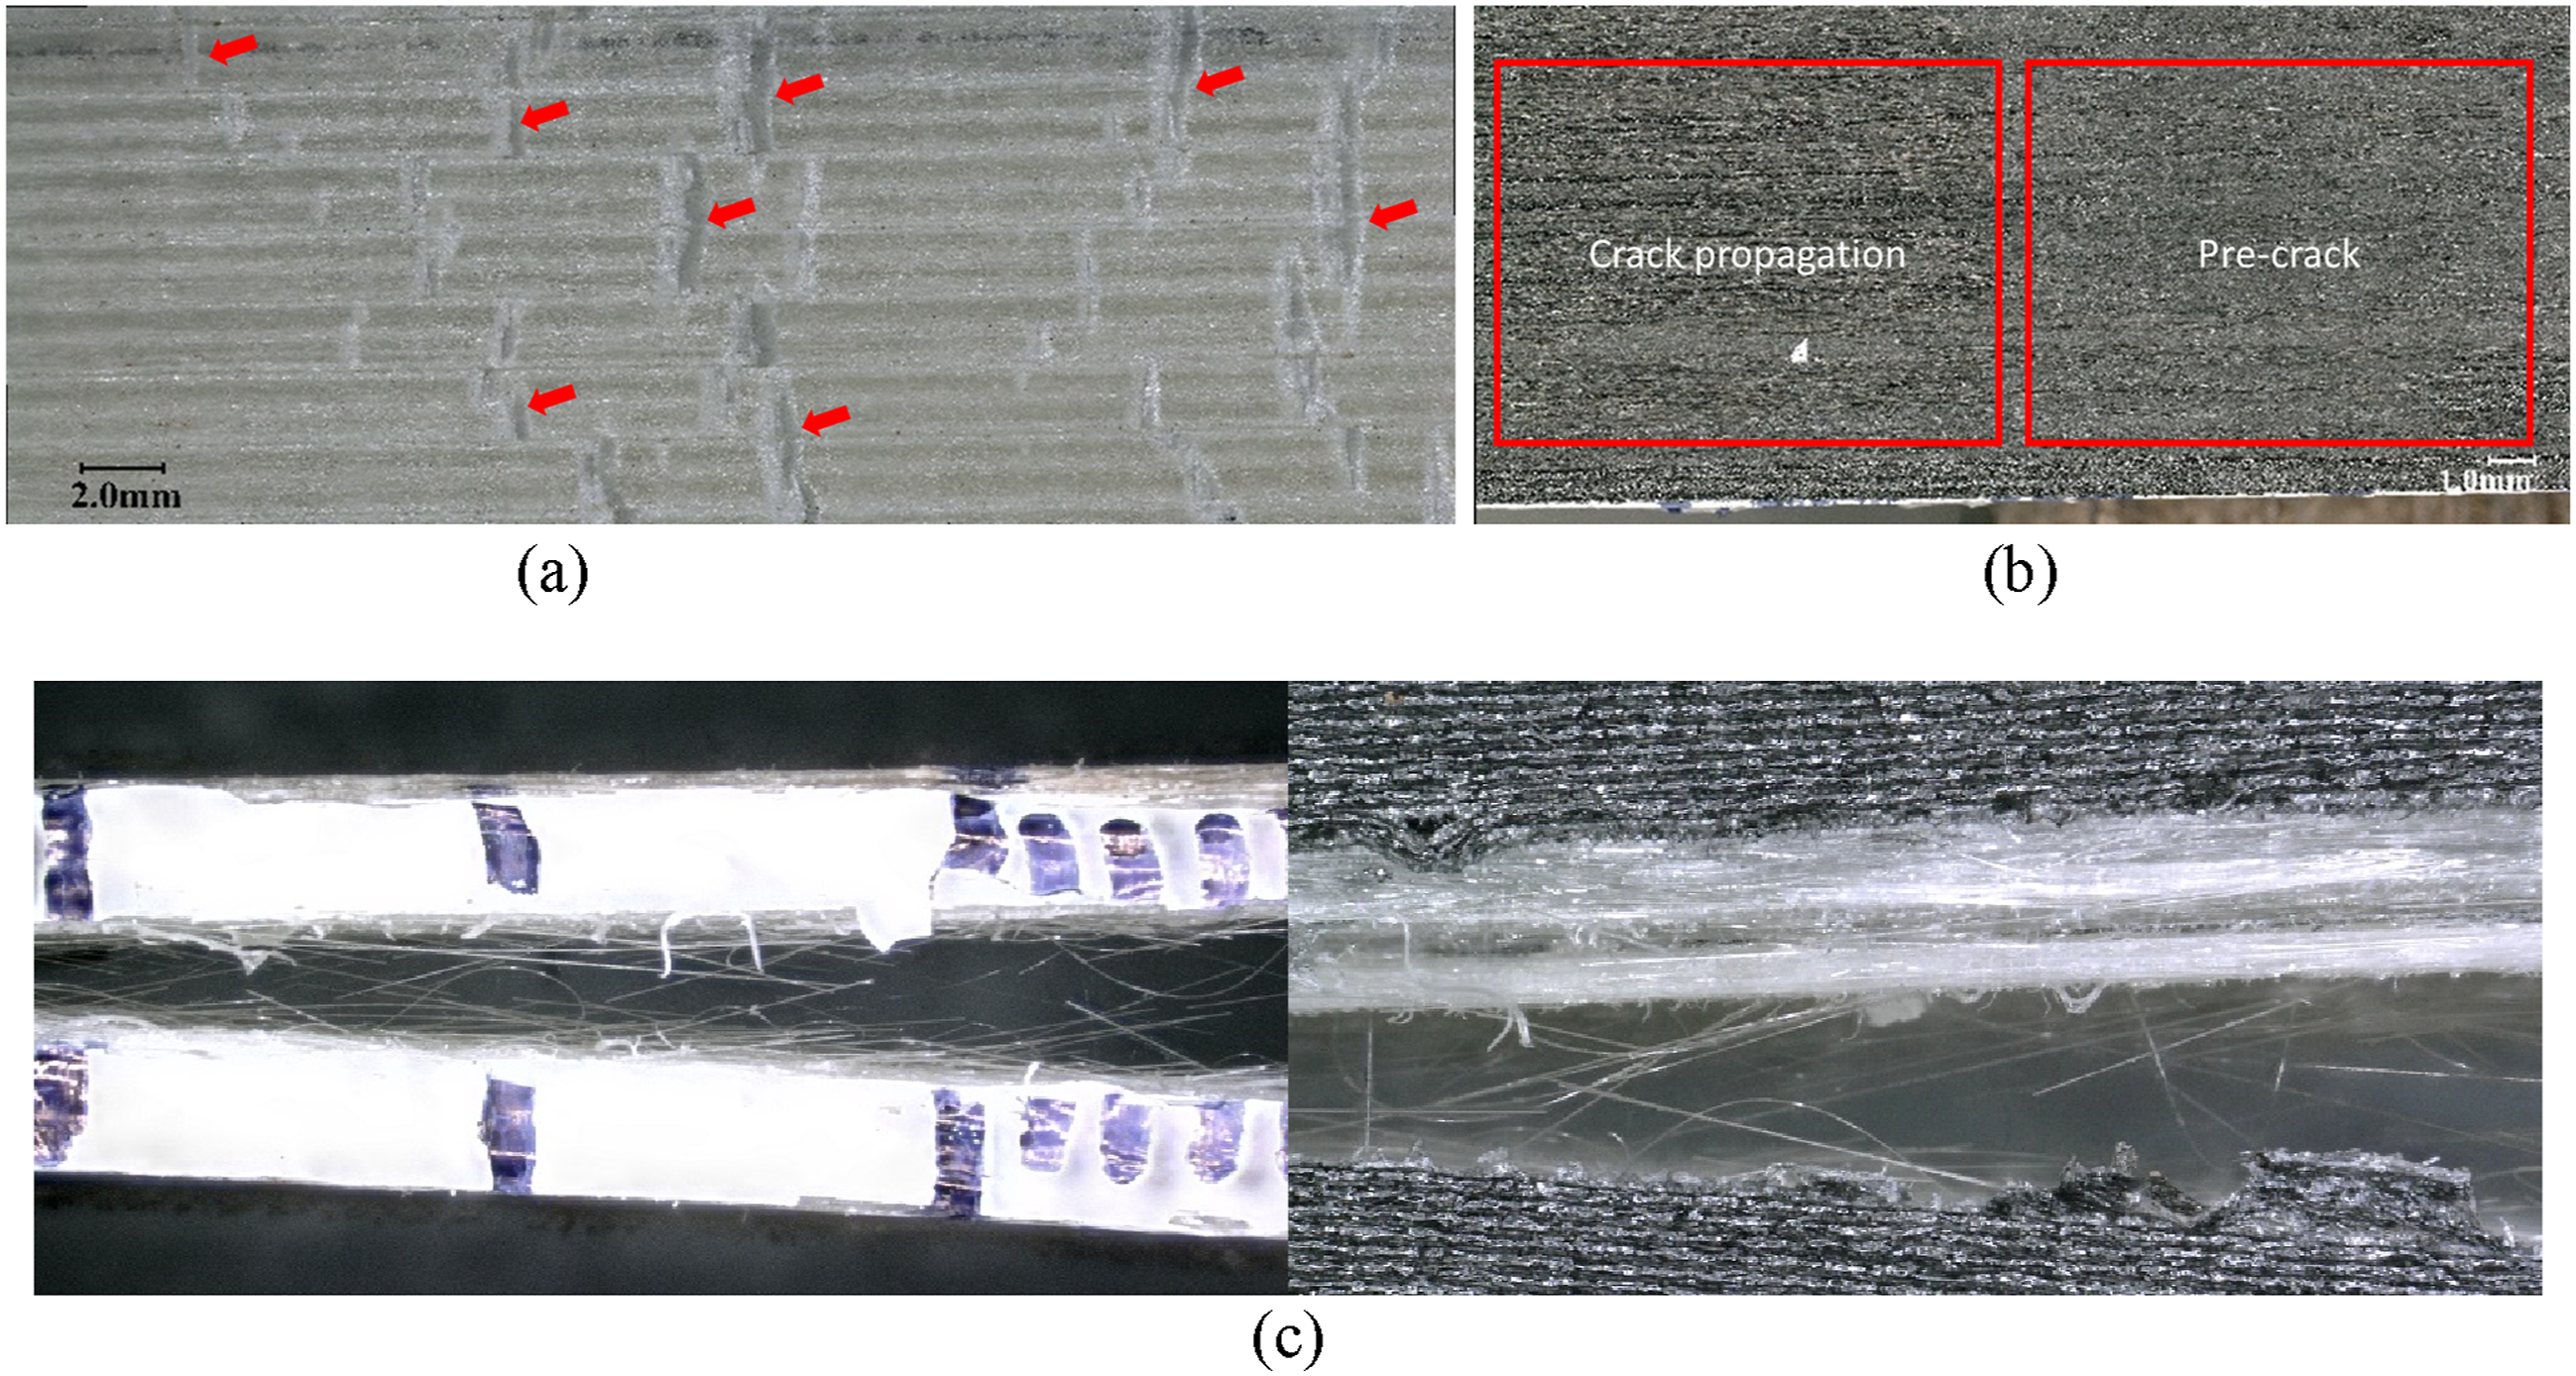
(a) The upper side of the HSHTG samples signals microcrack coalescence over the outermost fiber layer, (b) Fracture surface of the CCF samples, (c) Fiber bridging on the side of DCB samples for HSHTG (left) and CCF (right).
Figure 9(a) shows the kinked fiber band arrested the propagation of matrix cracking between the boundaries of extruded raster material perpendicular to the unidirectional fibers. The effect of these kinked bands manifests the localized bending of the composite extrudite initiated at the opening crack front, as shown in Figure 4(a) , while the other end of the beam was loaded against the other cantilever and stayed horizontal. This result in localized oscillation across the crack propagation front in a nonuniform manner corroborates the fluctuated crack propagation GIC for HSHTG samples, especially for HSHTG samples with higher fiber fractions that exaggerated the compressive loading on the outermost surface. Figure 9(b) shows the surface of the CCF sample on the crack opening interfaces. The difference in morphologies between the surface after the crack propagation (left) and the pre-crack (right) indicates the incidents of fiber pullout from the surfaces, favored by the off direction pulling load perpendicular to the reinforcing direction. Voids can be observed in the crack propagation regime, corroborating with these incidents of partial peel-off of the continuous fiber yarn. The peeled-off fiber bridged over to the other cantilever surface, causing a load increase and resulting in resist crack opening and a higher calculated GIC. The fiber bridging can also be observed in Figure 9(c) from the endoscopic microstructure images for the side view of the opening of the HSHTG sample. The distribution of fiber bridging can be clearly identified across the interlaminar region from the image scanned through the depth of the crack opening interface.
Comparison of available GIC data from literature and comparison to this research.
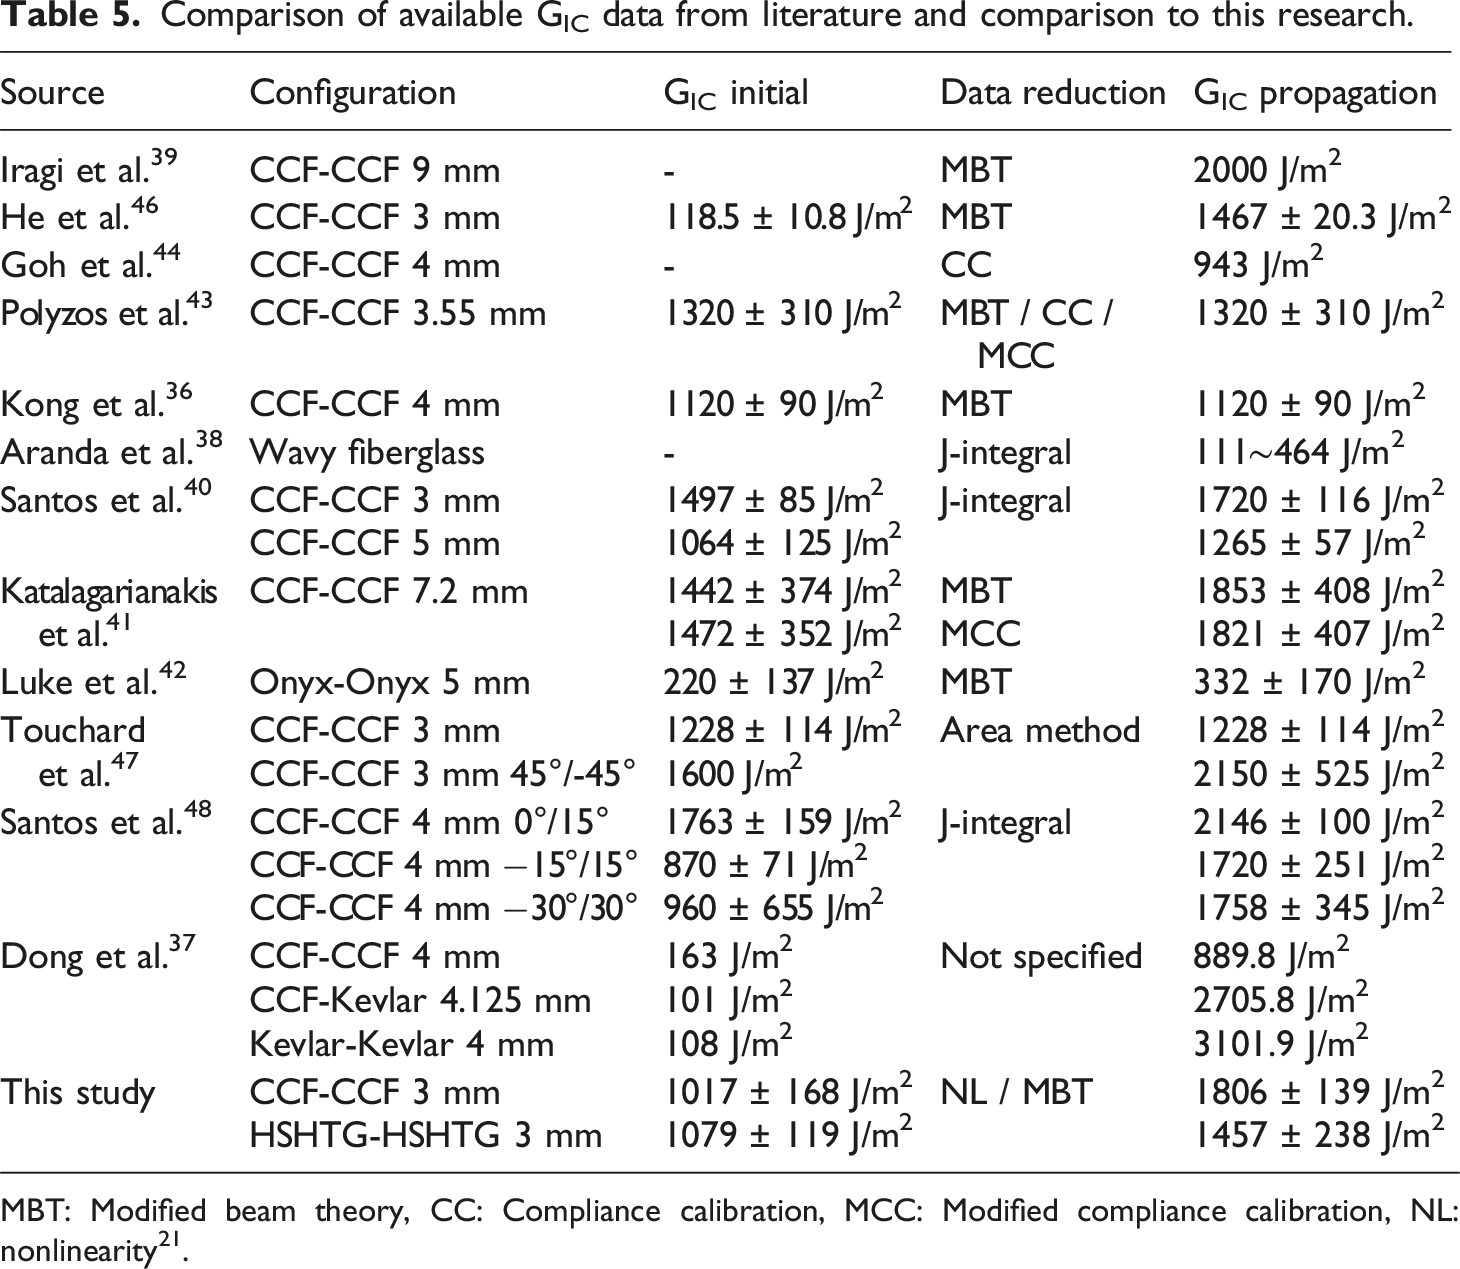
MBT: Modified beam theory, CC: Compliance calibration, MCC: Modified compliance calibration, NL: nonlinearity 21 .
Load-displacement, variability, and R-curve
The load-displacement relationship and R-curve are essential information for predicting fracture phenomena using numerical simulation, such as finite element analysis and understanding the resistive mechanisms of crack propagation. The recorded load-displacement curve for crack initiation and propagation is shown in Figure 10. Although the calculated initiation GIC values were consistent across the design configurations, the progressive load responses positively correlate to a higher instantaneous bending stiffness for samples reinforced with higher fiber fractions. The abrupt propagations, or crack jumps, were observed in most CF samples. Crack jump manifests the unsteady crack propagation due to the inherent structural anisotropy and the interaction between constituents during structural damping. Due to structural inhomogeneity, the beam can undergo various events that induce a toughening effect during interfacial debonding, resulting in higher resistance to crack propagation. The stochastically distributed defects and discontinuities from the printing process permitted these localized fracture events, which are considered favorable during practical applications as they would toughen the interface and hinder crack propagation. Variability, initiation GIC from different methods, and trends of all GIC along the progression of crack propagation are shown in Figure 11. Although a consistent trend of deviation GIC variability was not evident, it was more pronounced during the second to third stages of the crack propagation when the beam underwent geometrical bending that promoted nonlinear responses. The deviation corroborates with the observed damping of the beams due to an unsupported free end during a crack jump. A general trend of increasing GIC caused by an accumulative fiber bridging between the lamina that inhibited the crack route was observed, as shown in Figure 9. Reduced load-displacement curve for crack propagation in (a) CCF and (b) HSHTG samples. Comparison of all mode I fracture toughness for crack initiation and crack propagation regarding the nominal crack length for (a) CCF and (b) HSHTG samples.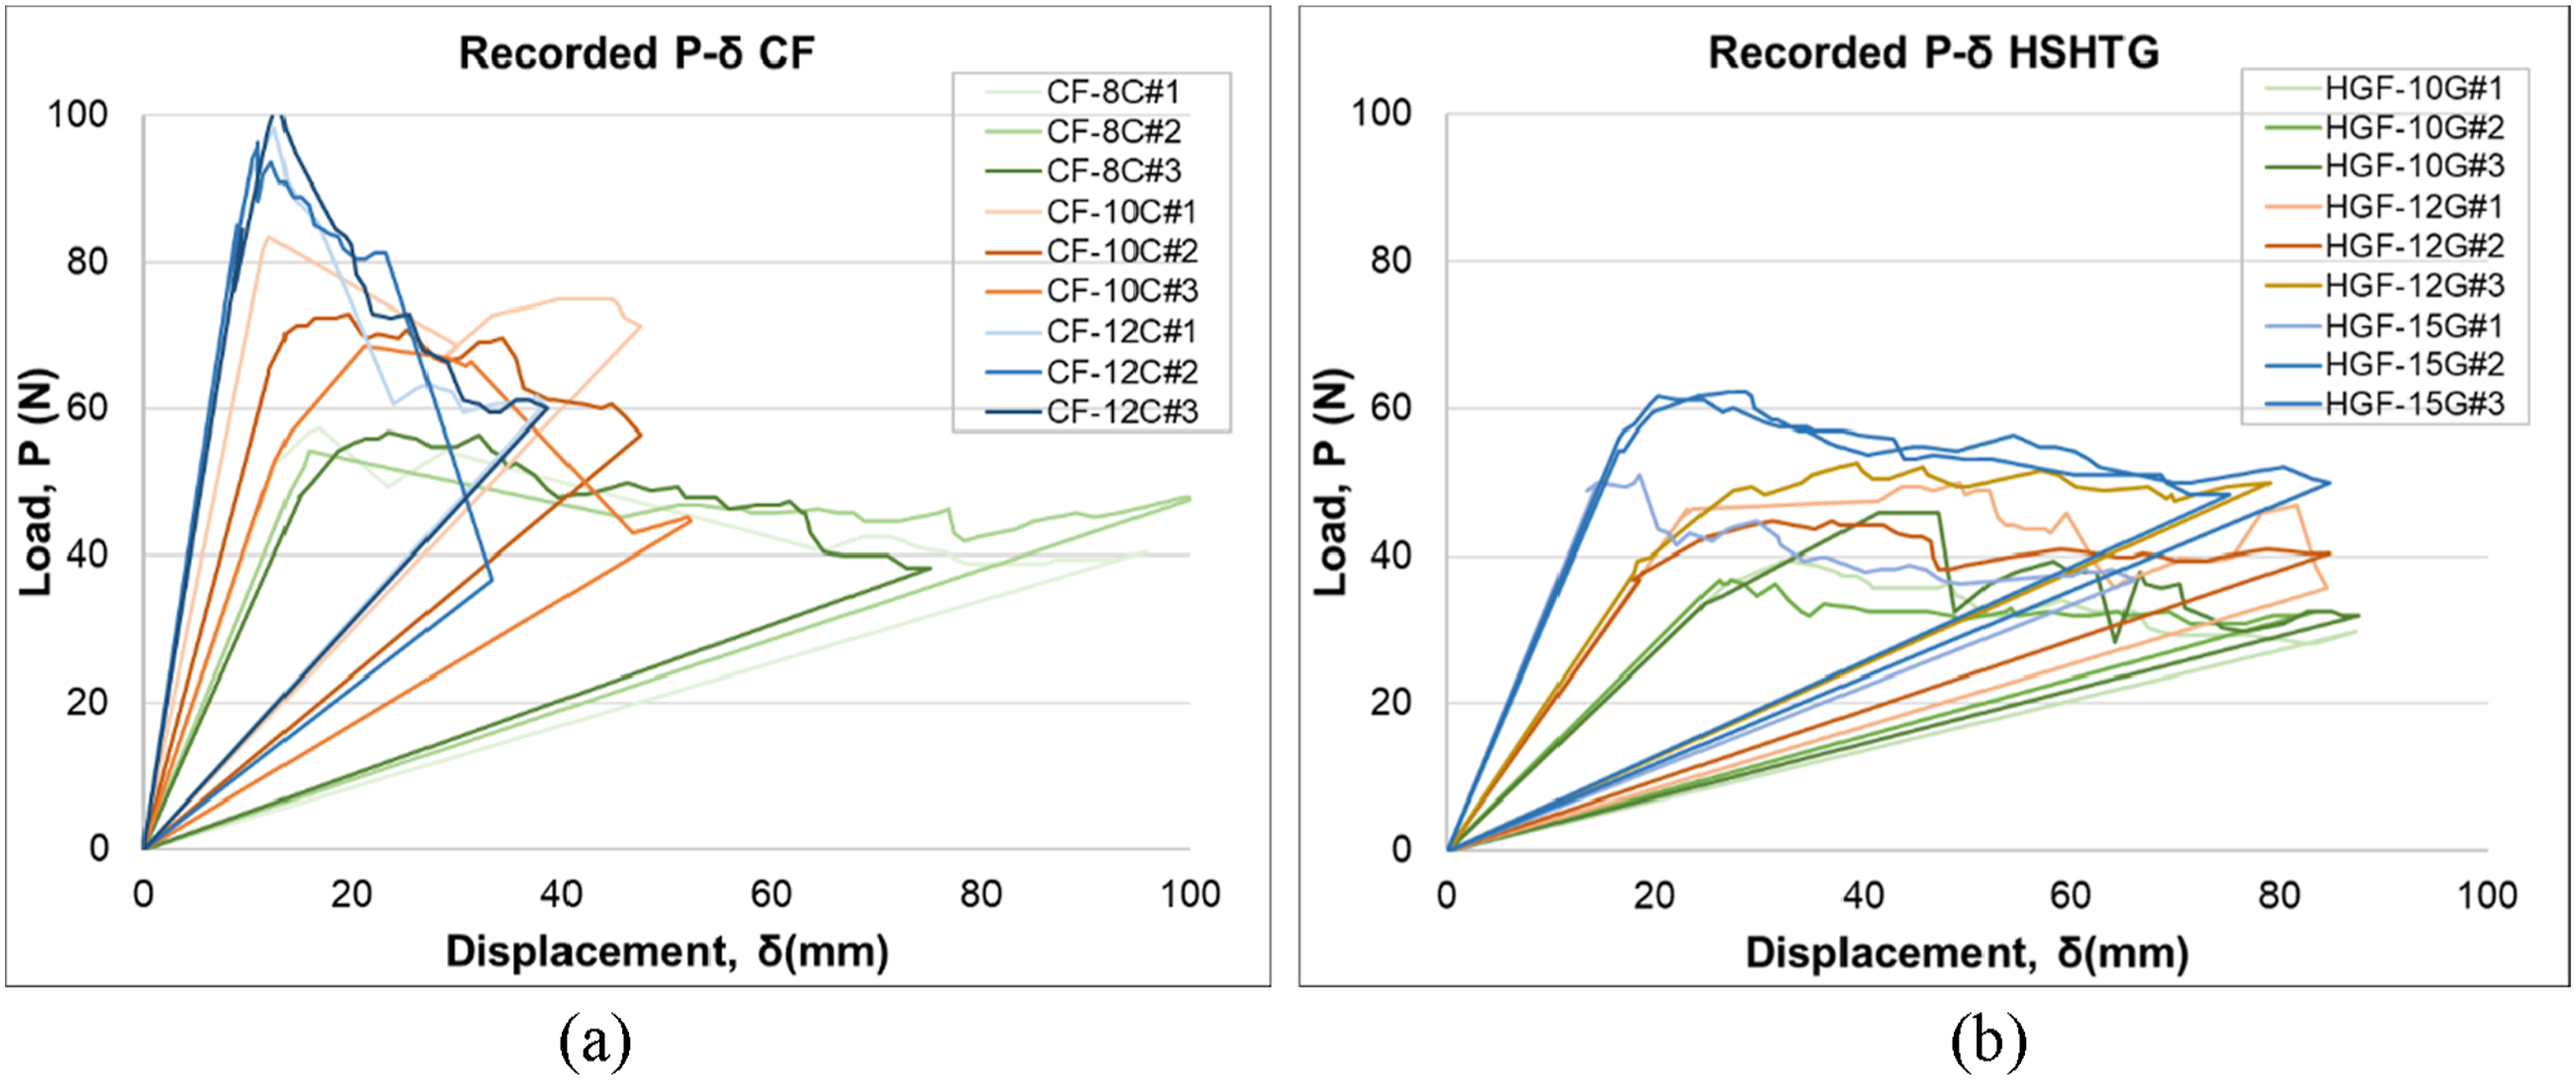
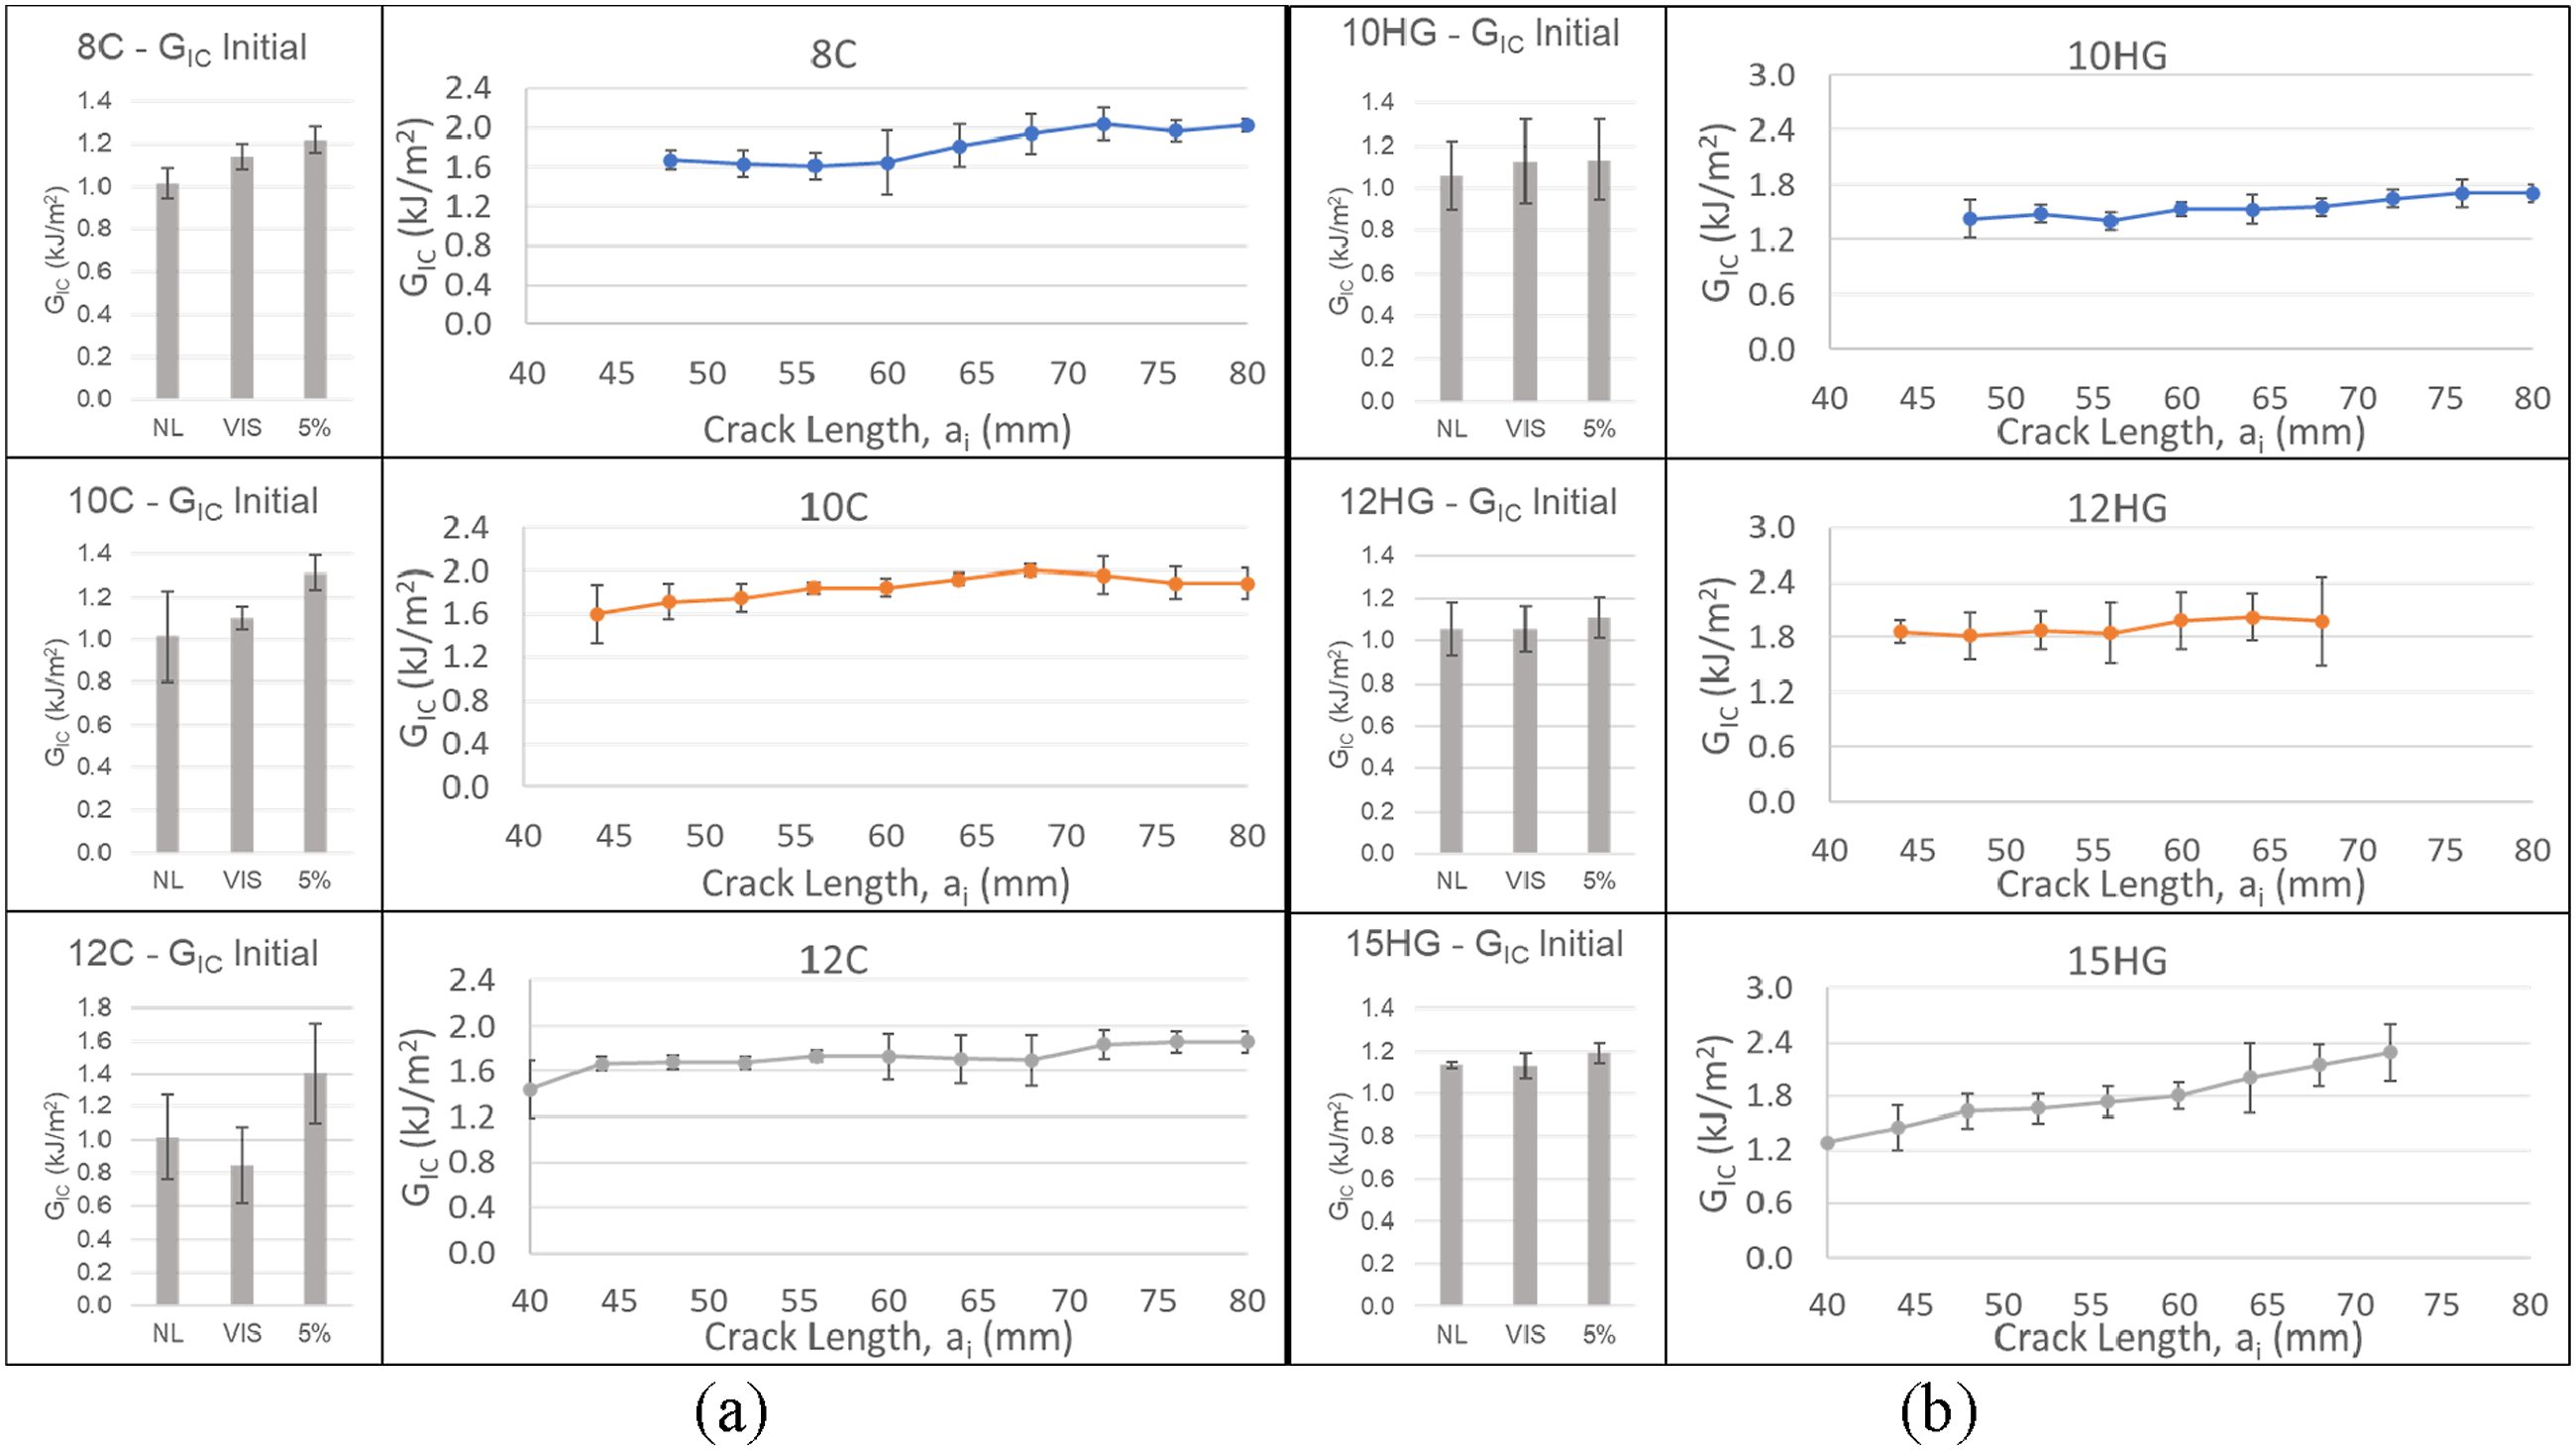
Relatively consistent crack propagation was observed for the 8C samples, which is evident in a smaller overall variability due to its higher flexibility and lesser dynamic oscillation since it has a lower fiber fraction compared to the 10C and 12C samples. The consistency of the propagation GIC of the higher stiffness 10C and 12C samples was plagued by more severe oscillation during crack growth, leading to greater variability in fracture toughness. This suggests that increased stiffness in CF-CF samples, while beneficial to restrict bending-related nonlinearity, can result in higher localized stress concentrations and a less predictable crack path. For HSHTG samples, an opposite trend of more stable crack initiation and propagation is observed with respect to a higher fiber fraction. While fiber bridging that impedes crack growth occurs in both CF and HSHTG materials, it is more pronounced in HSHTG samples, where it resists the damping effect and acts as a localized spring that stabilizes crack propagation from crack propagation, resulting in higher fracture toughness and lower variability. Overall, the stacking sequence and fiber fraction play critical roles in the corresponding trend of propagation GIC along the crack length. The differences in fracture toughness are still governed by the material’s threshold strength to plastic deformation and beam stiffness rather than fiber bridging.
Resistance curves were plotted for all DCB tests in Figure 12. A logarithmic regression curve was constructed for each figure to visualize the distribution and the increasing trend of the calculated GIC. An increased GIC along the crack propagation was observed, and it is aligned with the reported toughening mechanism in the previous sections. Toughening mechanisms, such as the accumulative fiber bridging, localized kinked fibrous extrudite, and others, provide additional resistance for crack propagation over the frontier of the cracking interface. Within the CCF samples, extensive peeling effects over the interfacial layers were more pronounced in 8C and 10C and not so much in the 12C samples. 8C and 10C samples experienced higher peeling stresses due to lower flexural rigidity from their lower fiber fraction. In comparison, the 12C sample has a higher flexural rigidity that would limit beam flexure, reducing fiber bridging and interfacial stiffening, resulting in a smoother R-curve. Fiber bridging can be exaggerated whenever an extensive oscillation arises by a sudden crack jump, causing an unsteady crack propagation. Although the nonlinearity observed in AM-made laminated structures due to printing artifacts and stochastic voids can cause unbalanced strain energy release, definitive evidence of these composites’ susceptibility to delamination is still inconclusive. The reduced load-displacement curve for crack propagation for all DCB samples.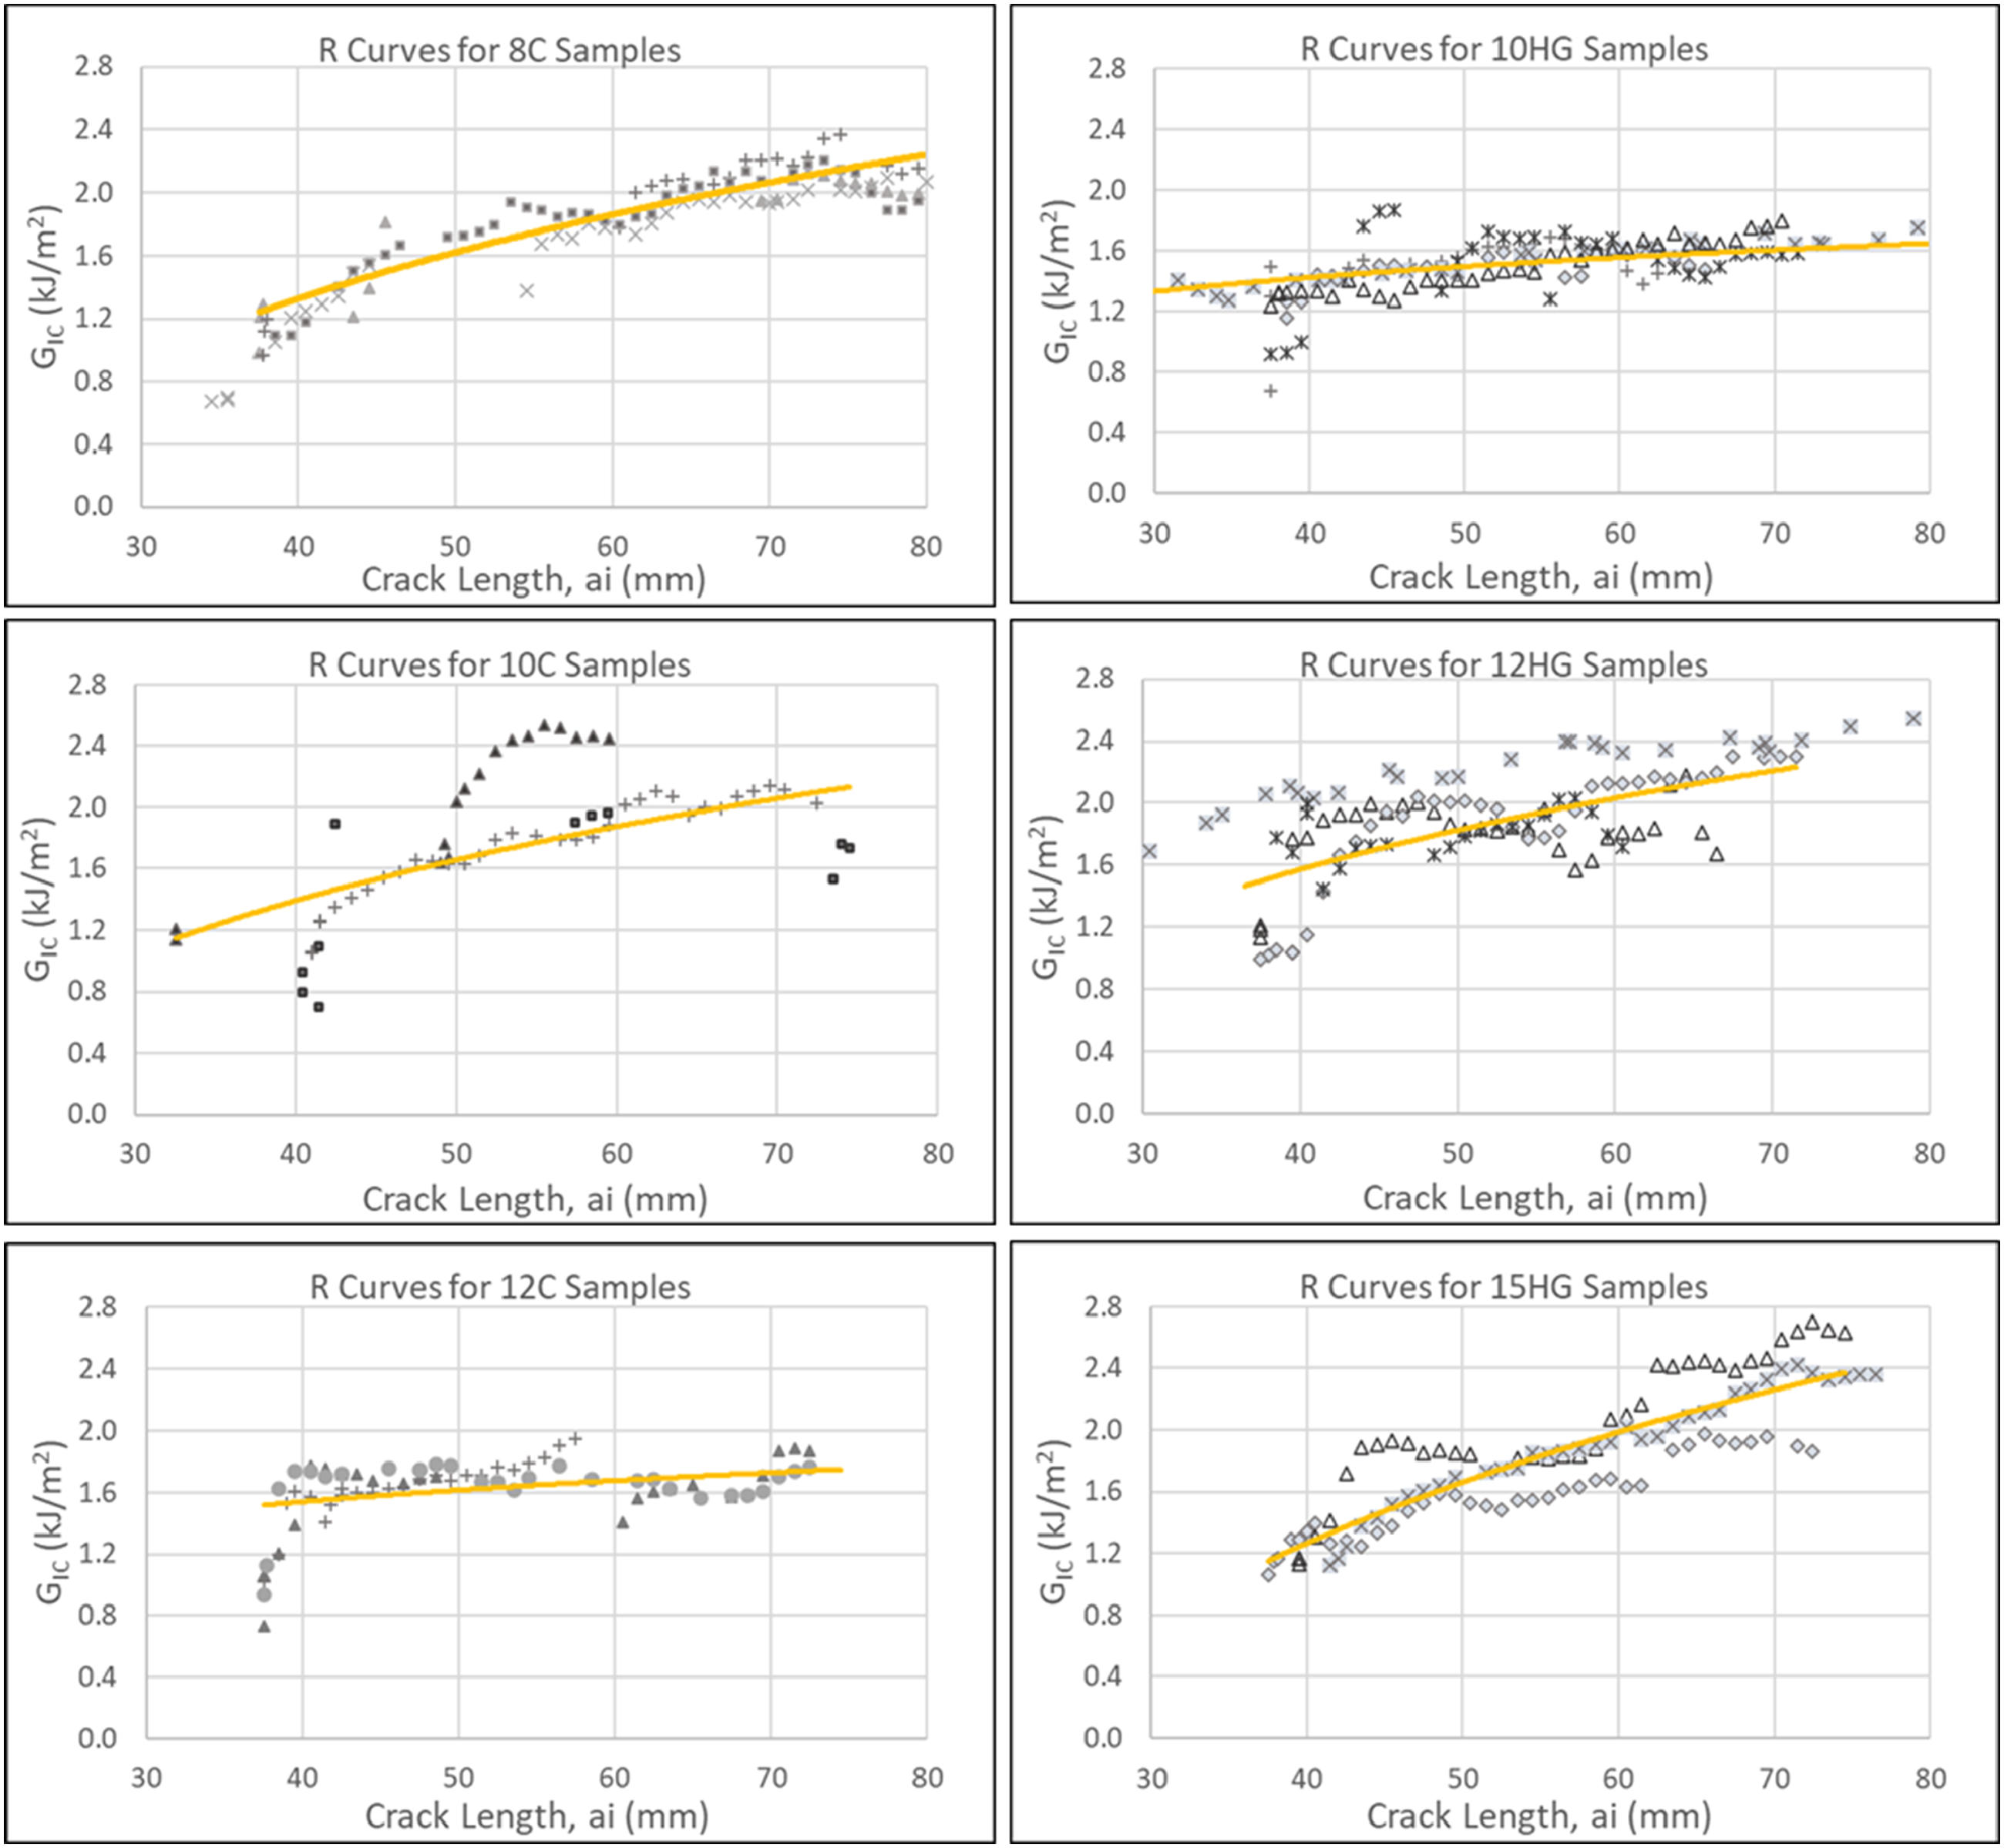
Although mesostructural similarity of AM structures governs the overall fracture sequences and responses of CCF and HSHTG samples, the trend of HSHTG samples differed from CCF samples: the crack grew more steadily in 10HG compared to 12HG and 15HG. Although 12HG and 15HG have a higher bending stiffness that should restrict extensive bending, the premature kinked bands developed over the outermost glass fiber layers would promote additional geometrical nonlinearity, resulting in a higher GIC synergized with the interfacial fiber bridging. Comparatively, the 10HG samples were more flexible as the more flexible Onyx matrix protected their outermost surfaces from the coupled compression and bending stresses. As a result, the resistance curve shows a steadier trend. Although the beam flexures differently between the configurations, the initial GIC remains reasonably consistent within samples of the same interfacial material groups. Observation on the 15HG samples after DCB tests corroborates the premature bending as the samples display extensive sectional permanent deflection initiated on the outermost laminae.
Conclusions
Flexural responses, flexural properties, mode I fracture responses, and mode I fracture toughness of 3D-printed continuous FRP laminated composite samples with different materials and reinforcing sequences were investigated. The highest flexural properties reported are 12.7 GPa for HSHTG and 29.5 GPa for CF samples, both with a 28% effective fiber volume fraction converted from experimental findings. The relationship between flexural modulus and the fiber fraction was graphed for engineering design purposes. A comparison shows a lower flexural modulus than the tensile modulus for 3D-printed continuous FRP, indicating a trend consistent with the manufacturer’s data and literature and different from their conventional thermoset counterparts. Differences in 3PB responses for CCF and HSHTG samples with the same printing processes highlight the complexity of the fracture phenomenon that synergizes material behaviors regarding differences in their micro-, meso-, and macro-structure across different length scales. A stagewise fracture was observed for CCF samples compared to a plateaued yielding for HSHTG samples, and the underlying mechanisms were corroborated with fractography analysis and other evidence from the literature. Based on empirical data from this study, the CFF content was found to be positively correlated to higher flexural properties. Trends of the FVF-modulus correlations were plotted for reference in the design.
Mode I fracture toughness GICs for CCF and HSHTG-reinforced AMFRP were characterized. The calculated crack initiation GIC value is consistent for CCF and HSHTG configurations regarding the interface type, providing a reference value to assess the fracture phenomenon and simulate the responses of opening-mode fractures and resistance. Increasing crack propagation GIC was observed along the opening procedures, resulting from localized fracture events such as bending, fiber bridging, fiber breakage, and inter-raster kinking. A single-factor ANOVA was used to determine the variability within and between groups of configurations. It was found that the initial GIC does not vary significantly by laminae sequences and can be used as material properties of a specific type of interface for future analysis for samples of specific dimensions. In contrast, statistical significance was found for characteristic crack propagation GIC for the different configurations. This implies that the crack can propagate unstably in the later stage of the crack propagation, while the incidents of stress concentration and fracture jump to an adjacent interface could arise differently by sample configuration. The observations highlight a possible scheme to arrest localized fracture during propagation by introducing geometrical designs that promote secondary strain energy release phenomena, such as fiber bridging and intralaminar fracture. The effect of laminated sequences on two continuous FRP materials was examined. The crack initiation GIC data for CCF and HSHTG were also compiled and compared with available literature data. The flexural rigidity variation of the beam does modify the laminated FRP plate’s crack propagation responses, while the initial crack behaviors remain relatively consistent. Cautious should be taken when designing load-bearing laminated structures made of AMFRP composites since resistance to crack initiation and propagation can vary as the structure undergoes combined compression, shear, peel, and through-interface crack propagation. Future work will be to implement the dataset into fracture simulation using cohesive zone modeling, mode-mixity studies of fracture toughness under extensive bending, and validation of AMFRP failure mechanisms using a digital image correlation (DIC) system. Future research to quantify the threshold strength by their mechanisms can be done to avoid design flaws and premature failure. More work can also be conducted to quantify the effect of each localized fluctuated delamination, crack propagation, and coalescence fracture responses to their corresponding mechanistic toughening model.
Footnotes
Acknowledgements
The authors are grateful to NASA SBIR Contract #: 80NSSC19C0134 for funding this investigation. The authors gratefully acknowledge the resources the University of Alabama at Birmingham IT-Research Computing group provided for high-performance computing (HPC) support and CPU time on the Cheaha compute cluster.
Declaration of conflicting interests
The authors declared no potential conflicts of interest with respect to the research, authorship, and/or publication of this article.
Funding
The authors disclosed receipt of the following financial support for the research, authorship, and/or publication of this article: This work was supported by the Alabama Space Grant Consortium (SBIR #80NSSC19C0134).