
Abstract
In this paper, quasi-static and dynamic compression experiments were carried out on polyethylene foam by a universal material testing machine and a drop tower impact device. The mechanical response characteristics and energy absorption capacity of polyethylene foam under quasi-static and moderate strain rate (4 × 10⁻³–102s−1) loading conditions were obtained. An improved constitutive model of strain-rate term coupling strain and strain rate was established based on the Sherwood–Frost phenomenological constitutive model and Johnson–Cook constitutive model. Low Density Foam model combined in the finite element software ABAQUS with the improved constitutive model was used as the parameter definition of polyethylene foam material in the simulation. The drop-tower impact tests at different heights were simulated, and the simulation results were compared with the actual drop tower impact test results. The results showed that the peak acceleration errors between simulation and experiment were less than 7.1%, verifying the accuracy of the constitutive model. This study provides a method of constitutive models and finite element simulation to the performance of polymer foams.
Keywords
Introduction
Products are often subjected to falling, impact, vibration, and other external effects in the transport process. 1 Cushioning energy absorption materials are widely used to avoid damage to products in the transport process. 2 Polyethylene foam is a kind of polymer closed-cell foam material that is widely used as a cushioning energy absorption material for electronic products, porcelain, and other products due to its light weight, strong energy absorption capacity, and strong resilience.3–7
Polymer foams exhibit different mechanical properties under various compression loading rates.8–10 At present, most studies have focused on the mechanical properties of polymer foam under quasi-static compression (material strain rate: 10−4–10−1 s−1) and high-speed impact (material strain rate will exceed 102 s−1) through universal material testing machine and the Hopkinson bar.11–15 The strain rate of dynamic deformation caused by falling or collision during transportation of polymer foams is at intermediate strain rate, but a limited number of research have been on the mechanical properties of polymer foam within the range of intermediate strain rate (1 s−1 to 102 s−1).16–18 Chen 16 obtained the dynamic mechanical characteristics of two kinds of expanded polystyrene (EPS) at intermediate strain rates of 2–280 s−1 using an INSTRON experimental machine. According to experimental data, the empirical relationships of dynamic strength, Young’s modulus, and energy absorption of EPS at different strain rates were obtained. Tateyama 17 obtained the mechanical response of polyethylene foam film at intermediate strain rate by using the drop-tower impact device. Through X-ray computed tomography images and Schlieren images, they revealed the structural deformation characteristics and gas flow of bubbles during the impact process. Yang 18 used an improved drop-tower impact device and shock tube device to impact polyethylene foam. The energy absorption capacity of polyethylene foam under different loading rates was evaluated, and the loading rate was considered to have a significant impact on energy density. However, these studies mainly revealed the strain rate effect of polymer foam materials through experiments, and the stress–strain constitutive model at intermediate strain rate was not constructed to describe the mechanical response of polyethylene foam in the whole deformation stage under impact load.
Numerous researchers have proposed constitutive models to describe the mechanical properties of polymer foam materials.19–22 The most representative models were the Sherwood–Frost and Johnson–Cook constitutive models. Sherwood and Frost 23 studied the uniaxial compression properties of polyurethane foam; density and temperature were considered on the basis of previous studies, and a more comprehensive phenomenological compression constitutive relationship framework for polymer foam materials was proposed. In the Sherwood–Frost constitutive model, the strain rate term refers to the research results of Nagy. 24 In Nagy’s work, only the stress variation of polyurethane foam at 0–0.5 strain was studied. However, polymer foams may experience a large strain when used as cushioning pads. In addition, a number of researchers have used the Johnson–Cook model to describe the strain rate effect in the constitutive relationship of polymer foam.24,25 Johnson and Cook 26 established the Johnson–Cook constitutive model considering the influence of strain rate and temperature when studying the plastic flow yield behavior of metal materials under high-speed impact. However, the metal material is an elastic–plastic material, and the micro-structure deformation mechanism of polymer foam material is different from that of metals. 20 Whether its model can accurately describe the mechanical properties of polymer foam remains to be discussed.
On the other hand, finite element analysis is increasingly used to evaluate the protective effect of cushioning pads in the dynamic drop process. At present, when polymer foam cushioning materials are used as cushioning pads for package drop simulation, the stress–strain data obtained by polymer foam under quasi-static state are mostly used as material parameters for simulation calculation.2,27,28 Mills 27 established two kinds of polyethylene foam cushioning pads with complex structures in ABAQUS software, simulated multiple falls of packaging parts using these two kinds of cushioning pads, and evaluated the cushioning effect. Ozturk 28 carried out the finite element simulation of multiple compression loading and unloading of polystyrene foam for packaging and obtained the cushioning curve after single and multiple loadings. Lu 2 constructed the constitutive model of polyethylene foam under multiple loading and unloading conditions by hyperbolic function and simulated the mechanical response of polyethylene foam continuous multiple drops using the hyper foam model and Mullins effect in ABAQUS software. However, the material model of foam used in these works was independent of the strain rate but dependent on the experimental data and was not defined by the constitutive model. It is noteworthy that the constitutive model of materials is not only the basis for understanding the mechanical behavior of materials but also a necessary condition for numerical simulation.29–31
In this work, the compressive mechanical properties of polyethylene foam at intermediate and low strain rates were studied. Constitutive model including low and medium strain rates is established based on Sherwood–Frost and Johnson–Cook constitutive models. The constructed constitutive model can accurately describe the stress response of polyethylene foam under quasi-static and impact loads with a large strain. Finally, the drop tower impact test was simulated by using the constitutive model and the Low Density Foam model in ABAQUS finite element software, and the results were verified and analyzed.
Experimental work
In the experimental work, the polyethylene foam with nominal density of 20 kg/m3 (the materials were manufactured by Anhui Bromake New Materials Co., Ltd) was used as the test object.
The size of polyethylene foam sample was 100 × 100 × 45 mm3 (length × width × thickness). The prepared specimen was pretreated at a constant temperature and humidity incubator for 24 h before the experiment. Temperature and humidity were set at 23°C and 50% relative humidity, respectively.
To study the strain rate sensitivity of polyethylene foam, we carried out quasi-static compression and a drop tower test in the main direction (perpendicular to the foam plate) to obtain the mechanical response of polyethylene foam at intermediate and low strain rates.
Quasi-static compression test
The quasi-static compression test was carried out on the Instron 3369 universal material testing machine. The loading heads of the device were compressed at speeds of 12, 120, 360, and 480 mm/min, which corresponded to material strain rates of 4 × 10⁻³, 4 × 10⁻², 0.12, and 0.16 s−1, respectively. These tests were conducted thrice for each strain rate.
Intermediate rate compression test
The motion process of drop tower impacting polyethylene foam is shown in Figure 1, where H is the drop height, l is the thickness of polyethylene foam, m is the mass of mass block, and Schematic of mass block impacting polyethylene foam process.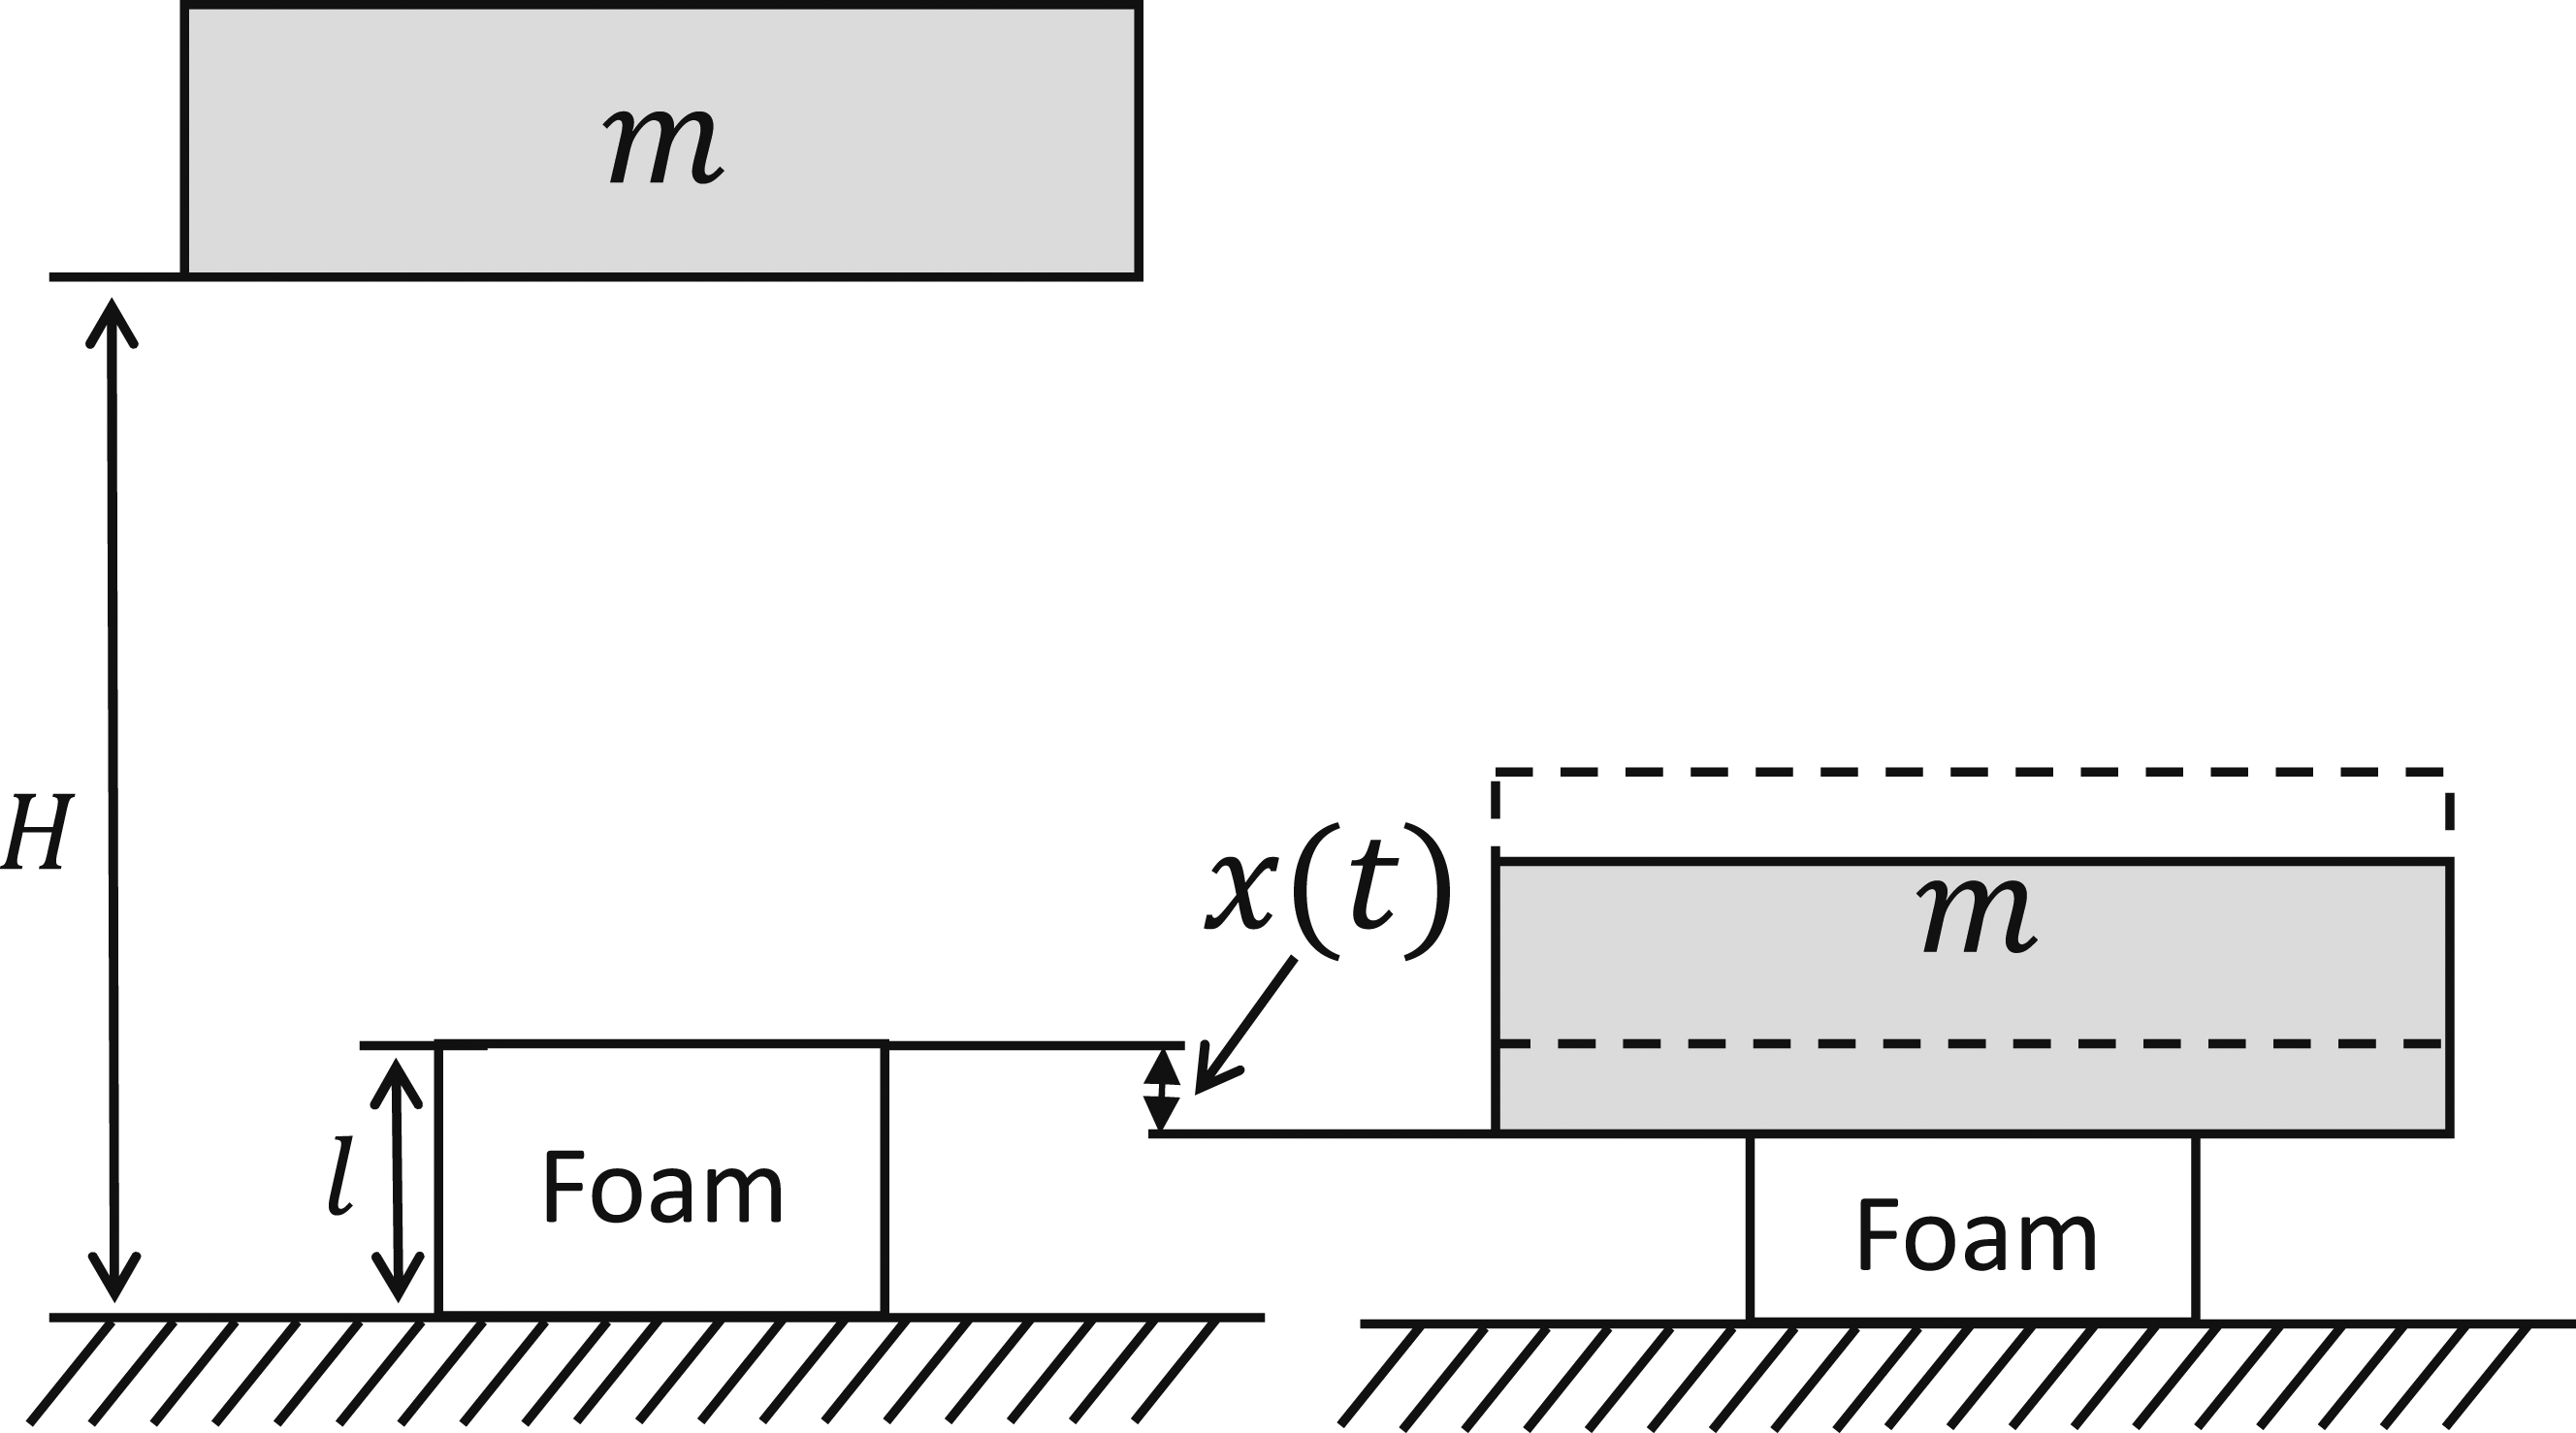
The impact mass block was released at the H height, and the time when the mass block fell to the foam was set as 0.
The motion equation of mass block was shown in equation (1):

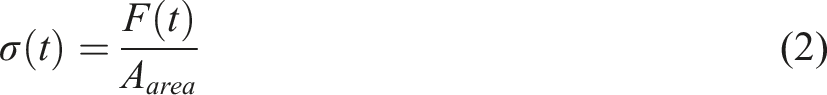
The stress produced by impact force of polyethylene foam was
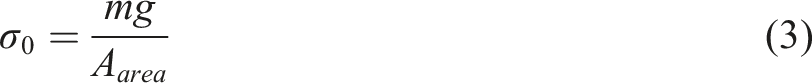
The static stress of impact mass on polyethylene foam was
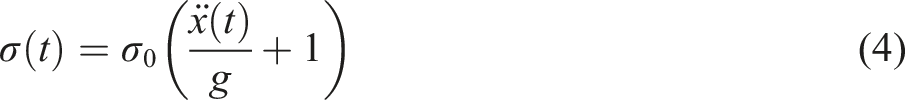
Substituting equations (1) and (3) into equations (2) and (4) was obtained:
The acceleration obtained by the sensor was expressed as dimensionless G of the multiple of g:
Substituting equation (5) into equations (4) and (6) can be obtained:

The strain response of polyethylene foam was obtained by equation (7):
The deformation of the foam was obtained by equation (8):
The strain of the foam was obtained by equation (9):
When the drop tower contacted with the foam, the initial strain rate was obtained by equation (10).

The drop-tower impact test has been widely used for the characterization of intermediate strain rate impact properties of foams.32–34 In this work, the impact test of polyethylene foam was carried out by using the drop-tower test device. The drop-tower impact device (DY-3, Shaanxi university of science and technology) is mainly composed of a mass block, two slide rails (the mass block moves linearly along it), an acceleration sensor, a signal converter, a high-speed camera group, and a computer (Figure 2). Schematic of the drop-tower impact device.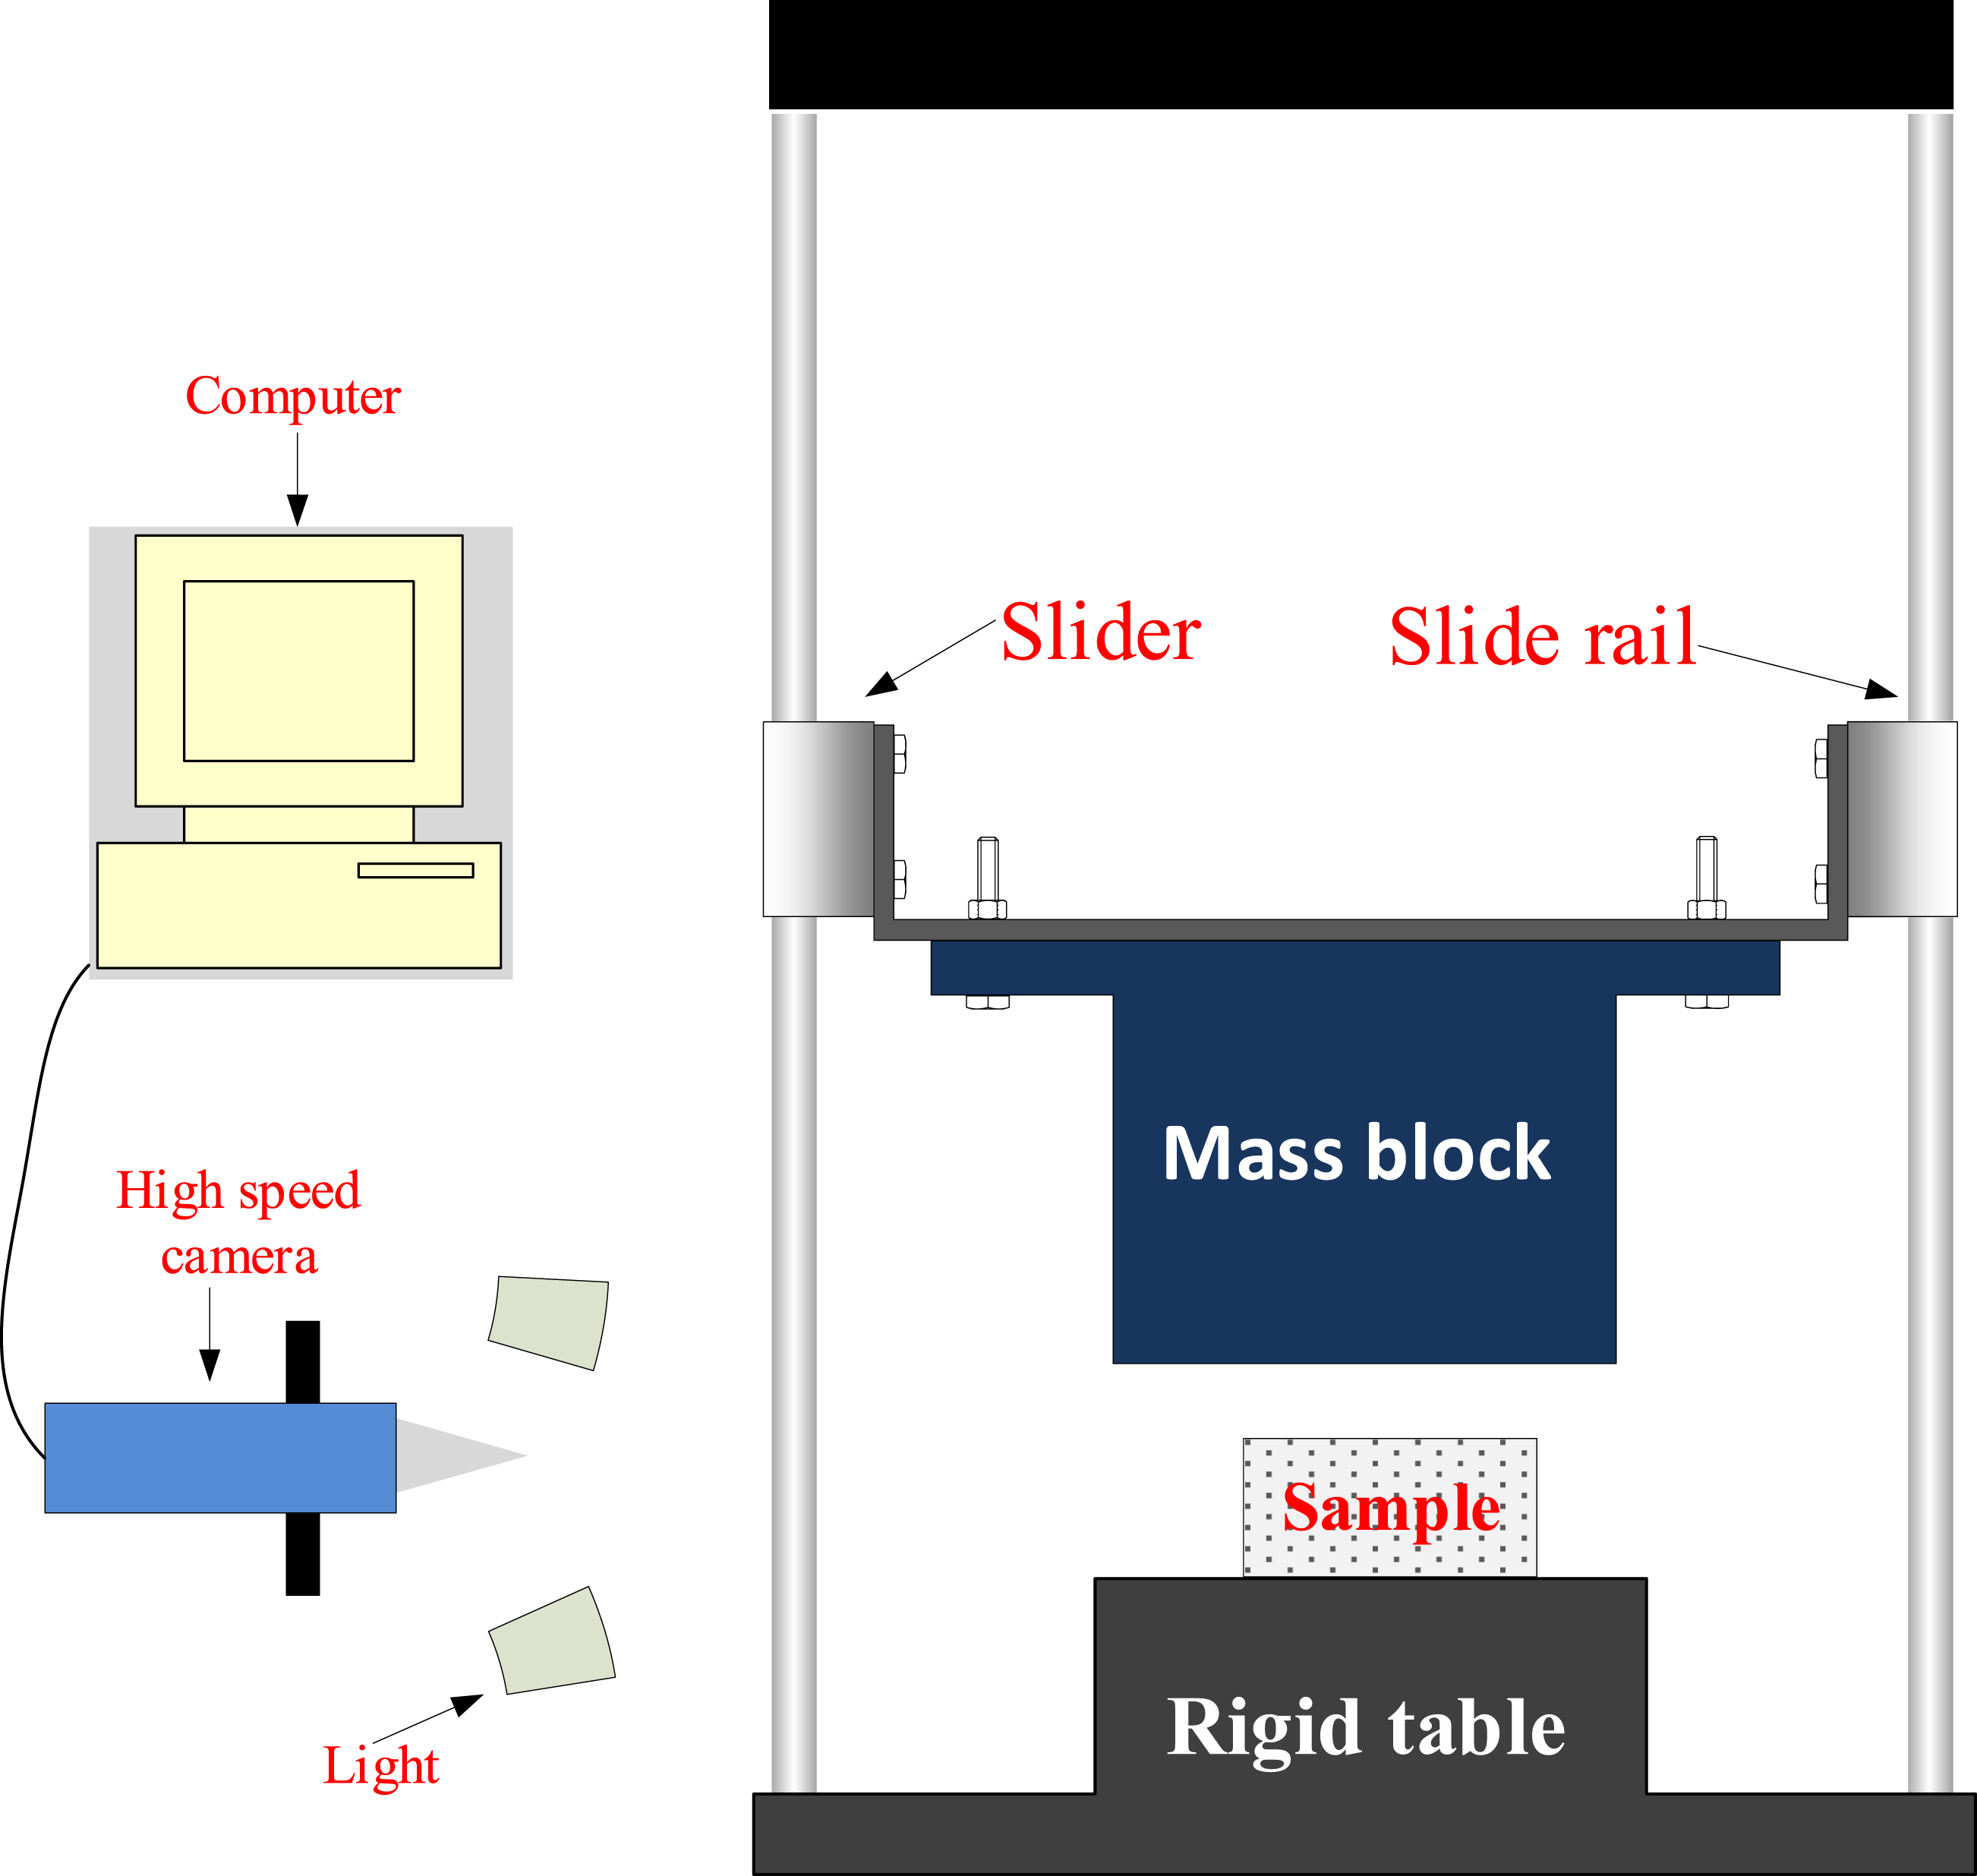
In accordance with the ASTM D1596 standard test method for dynamic impact cushioning characteristics of packaging materials, the drop heights were set as 460, 660, 760, and 970 mm. The experiment was repeated five times at the same height. The mass block was 7.93 kg.
The errors between the velocity of mass block and theoretical calculation are due to the friction resistance and air resistance between the mass block and the sliding rail. A high-speed camera (Motion Pro YL-4) was used to correct the impact velocity of the mass block. The initial velocity of the mass block captured by the high-speed camera at the impact heights of 460, 660, 760, and 970 mm were 2710, 3340, 3670, and 4210 mm/s, respectively.
The dynamic compression deformation process of polyethylene foam during impact was shown in Figure 3 by the high-speed camera when the height of mass block was 760 mm. Dynamic compression deformation process of polyethylene foam captured by high-speed camera.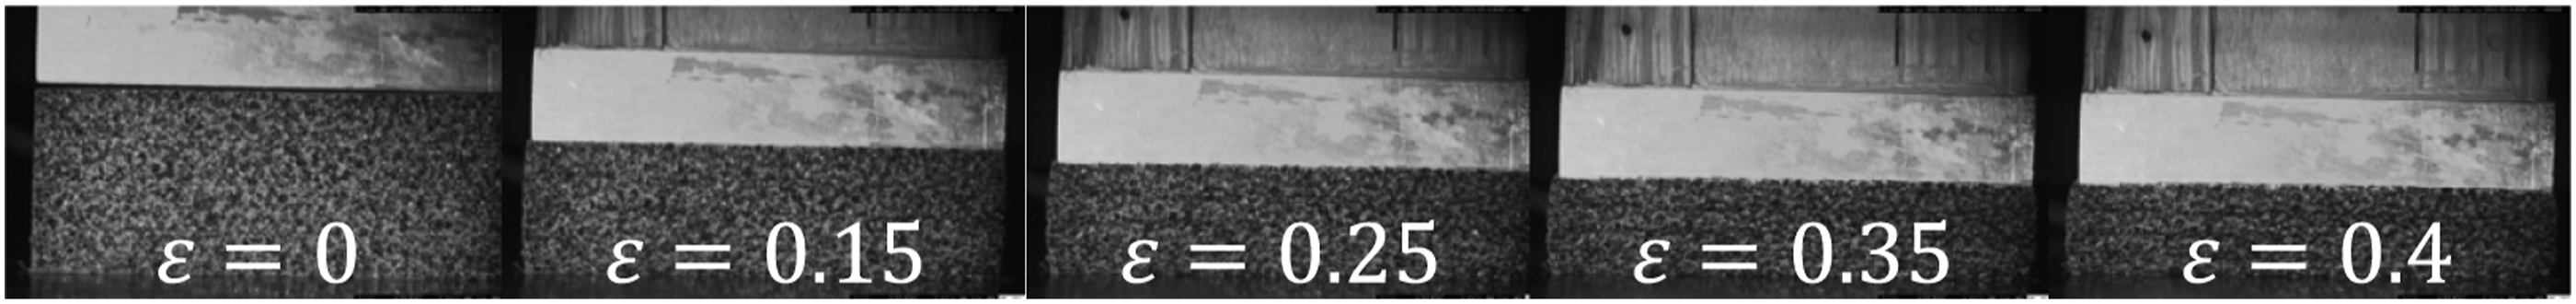
The stress–strain response of polyethylene foam under drop-tower impact load was calculated by equations (6) and (9). The acceleration–time curve of the mass block at 760 mm drop impact heigh was shown in Figure 4(a). The stress–strain curve of polyethylene foam was shown in Figure 4(b). (a) Acceleration–time curve and (b) stress–strain curve.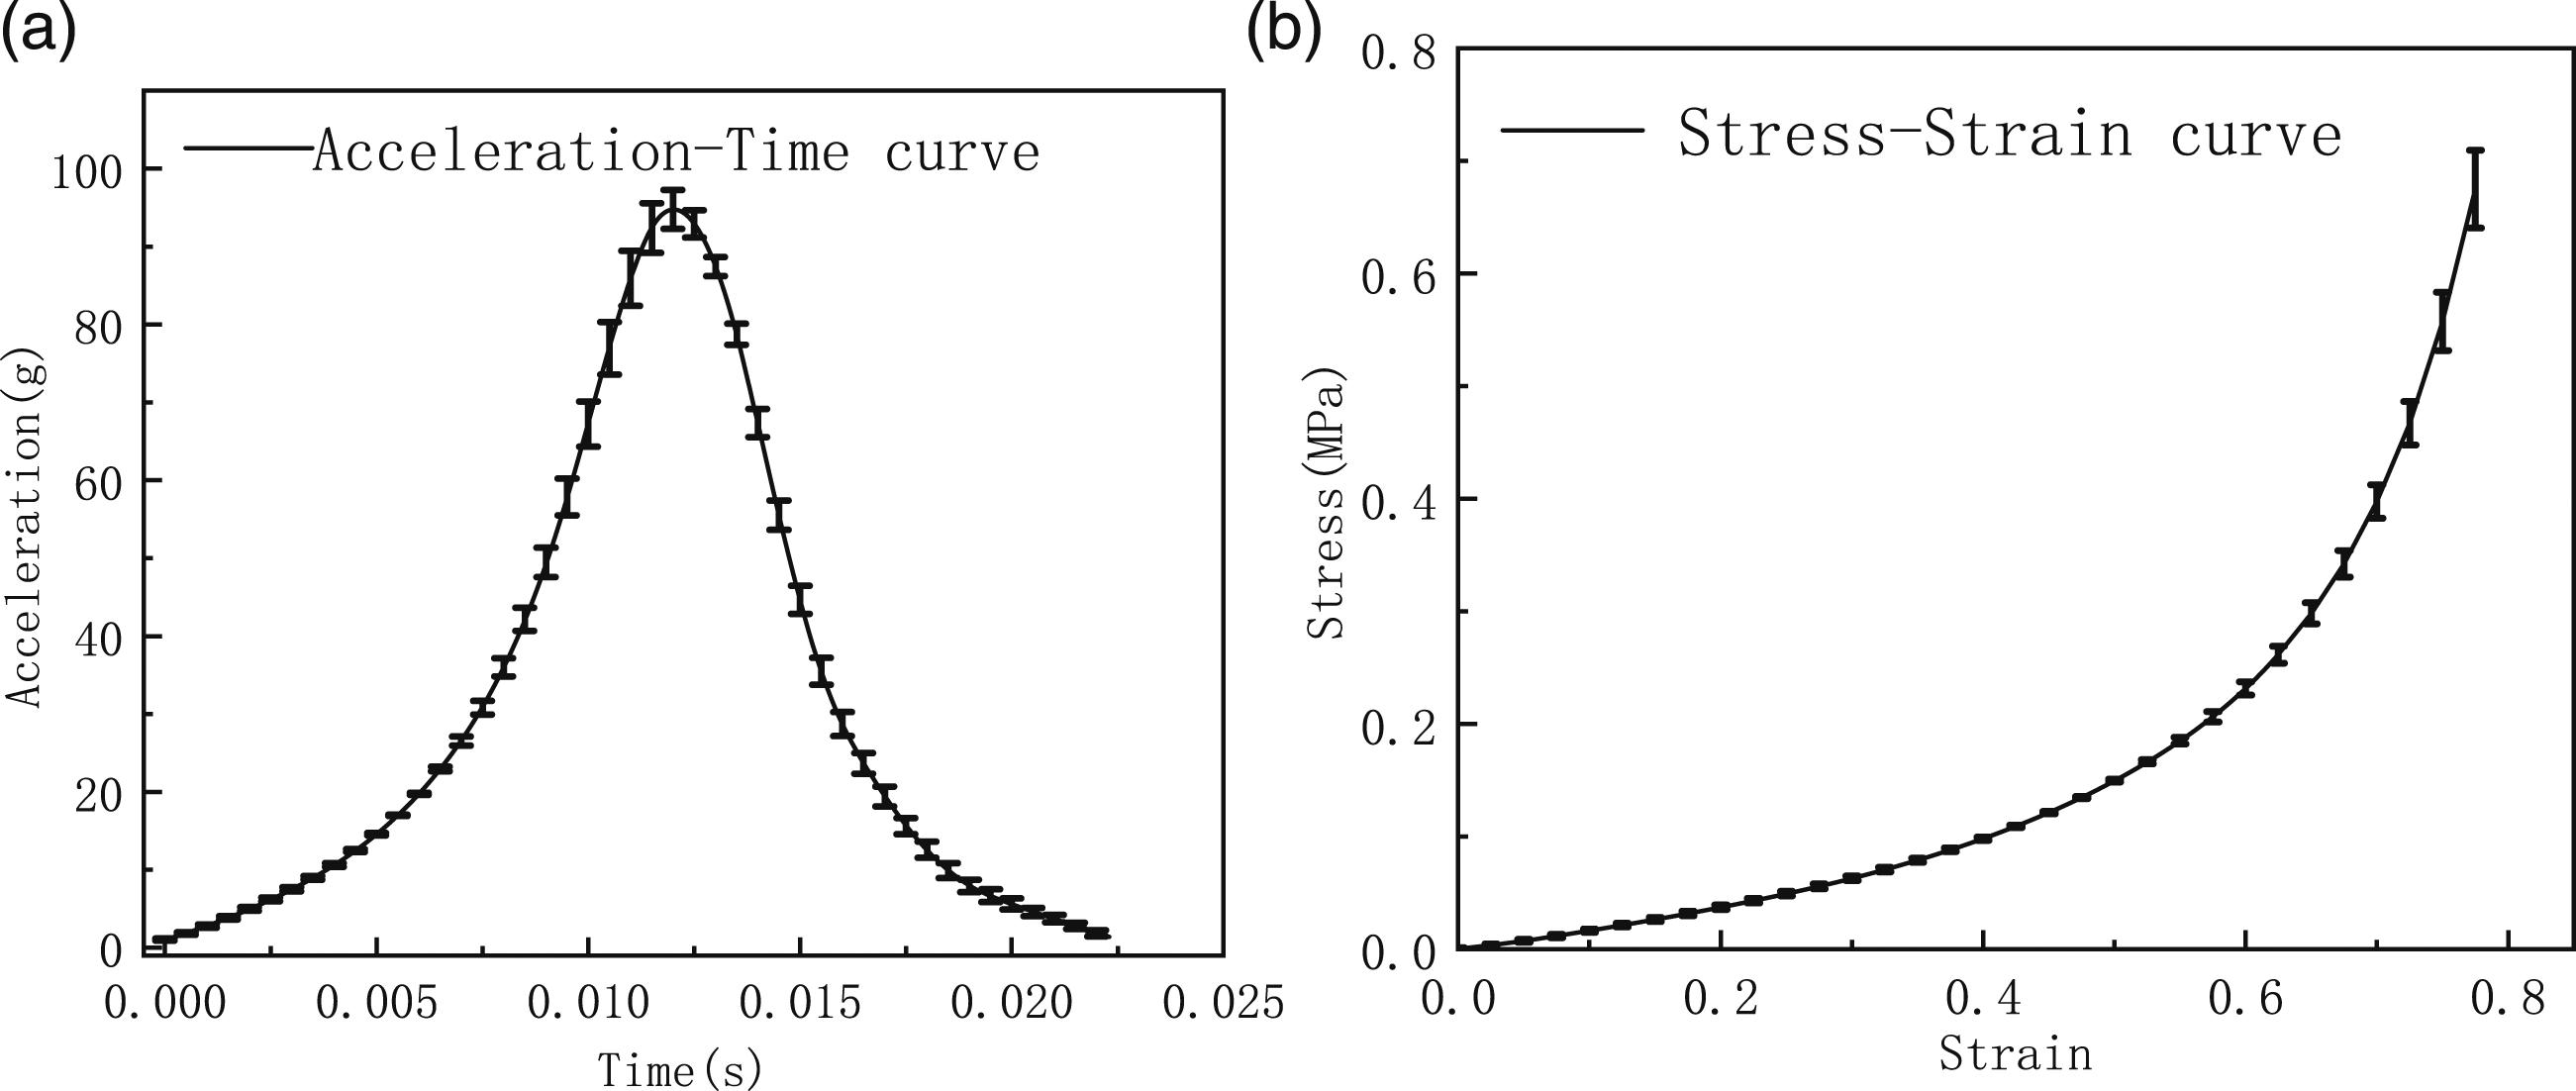
Construction of the constitutive model
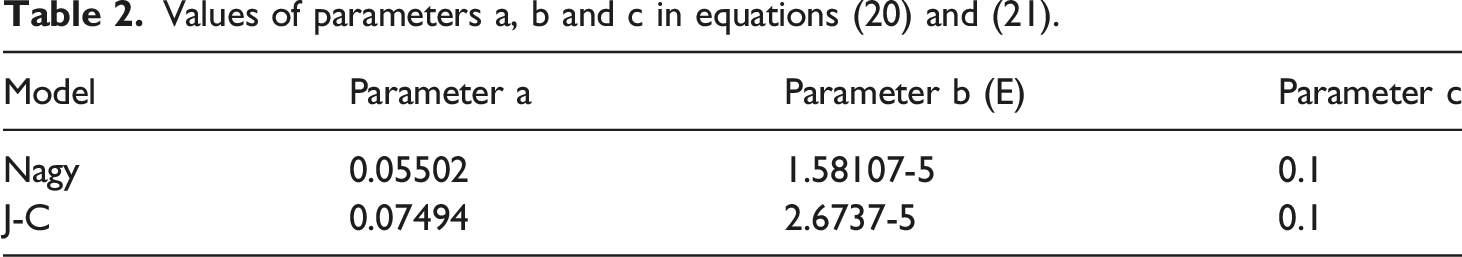
The constitutive model with the strain rate effect was constructed based on the experimental results of the polyethylene foam under quasi-static compression and drop-tower impact loading. The Nagy model and Johnson–Cook constitutive model were improved.
Sherwood–Frost constitutive model framework was used, as shown in equation (11).

The strain rate term of Nagy
35
was applied in the Sherwood–Frost constitutive model. The influence of strain and strain rate on stress cannot be decoupled. The strain rate term is defined as follows:
The Johnson–Cook constitutive model is composed of three parts, which characterize the strain hardening, strain rate strengthening, and thermal softening effect of materials (equation (13)).

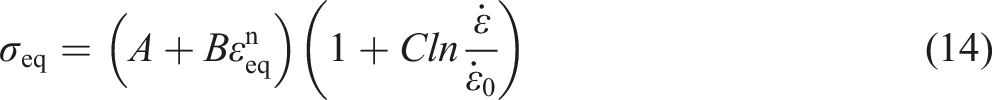
In this paper, the thermal softening effect of materials is ignored. The equation (13) is simplified as equation (14):
Construction of shape function term
A polynomial function was used to describe the shape function in the Sherwood–Frost model. In this work, the polynomial function was used to describe the stress–strain curve of materials as a shape function:

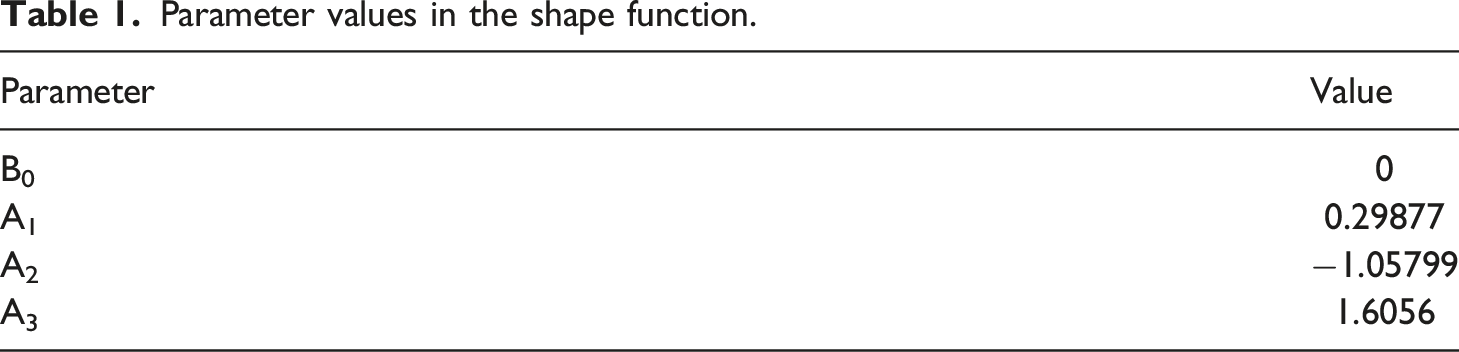
In equation (15), the stress and strain data were fitted with uniaxial compression experiments at Fitting of shape function to experiment data. Parameter values in the shape function.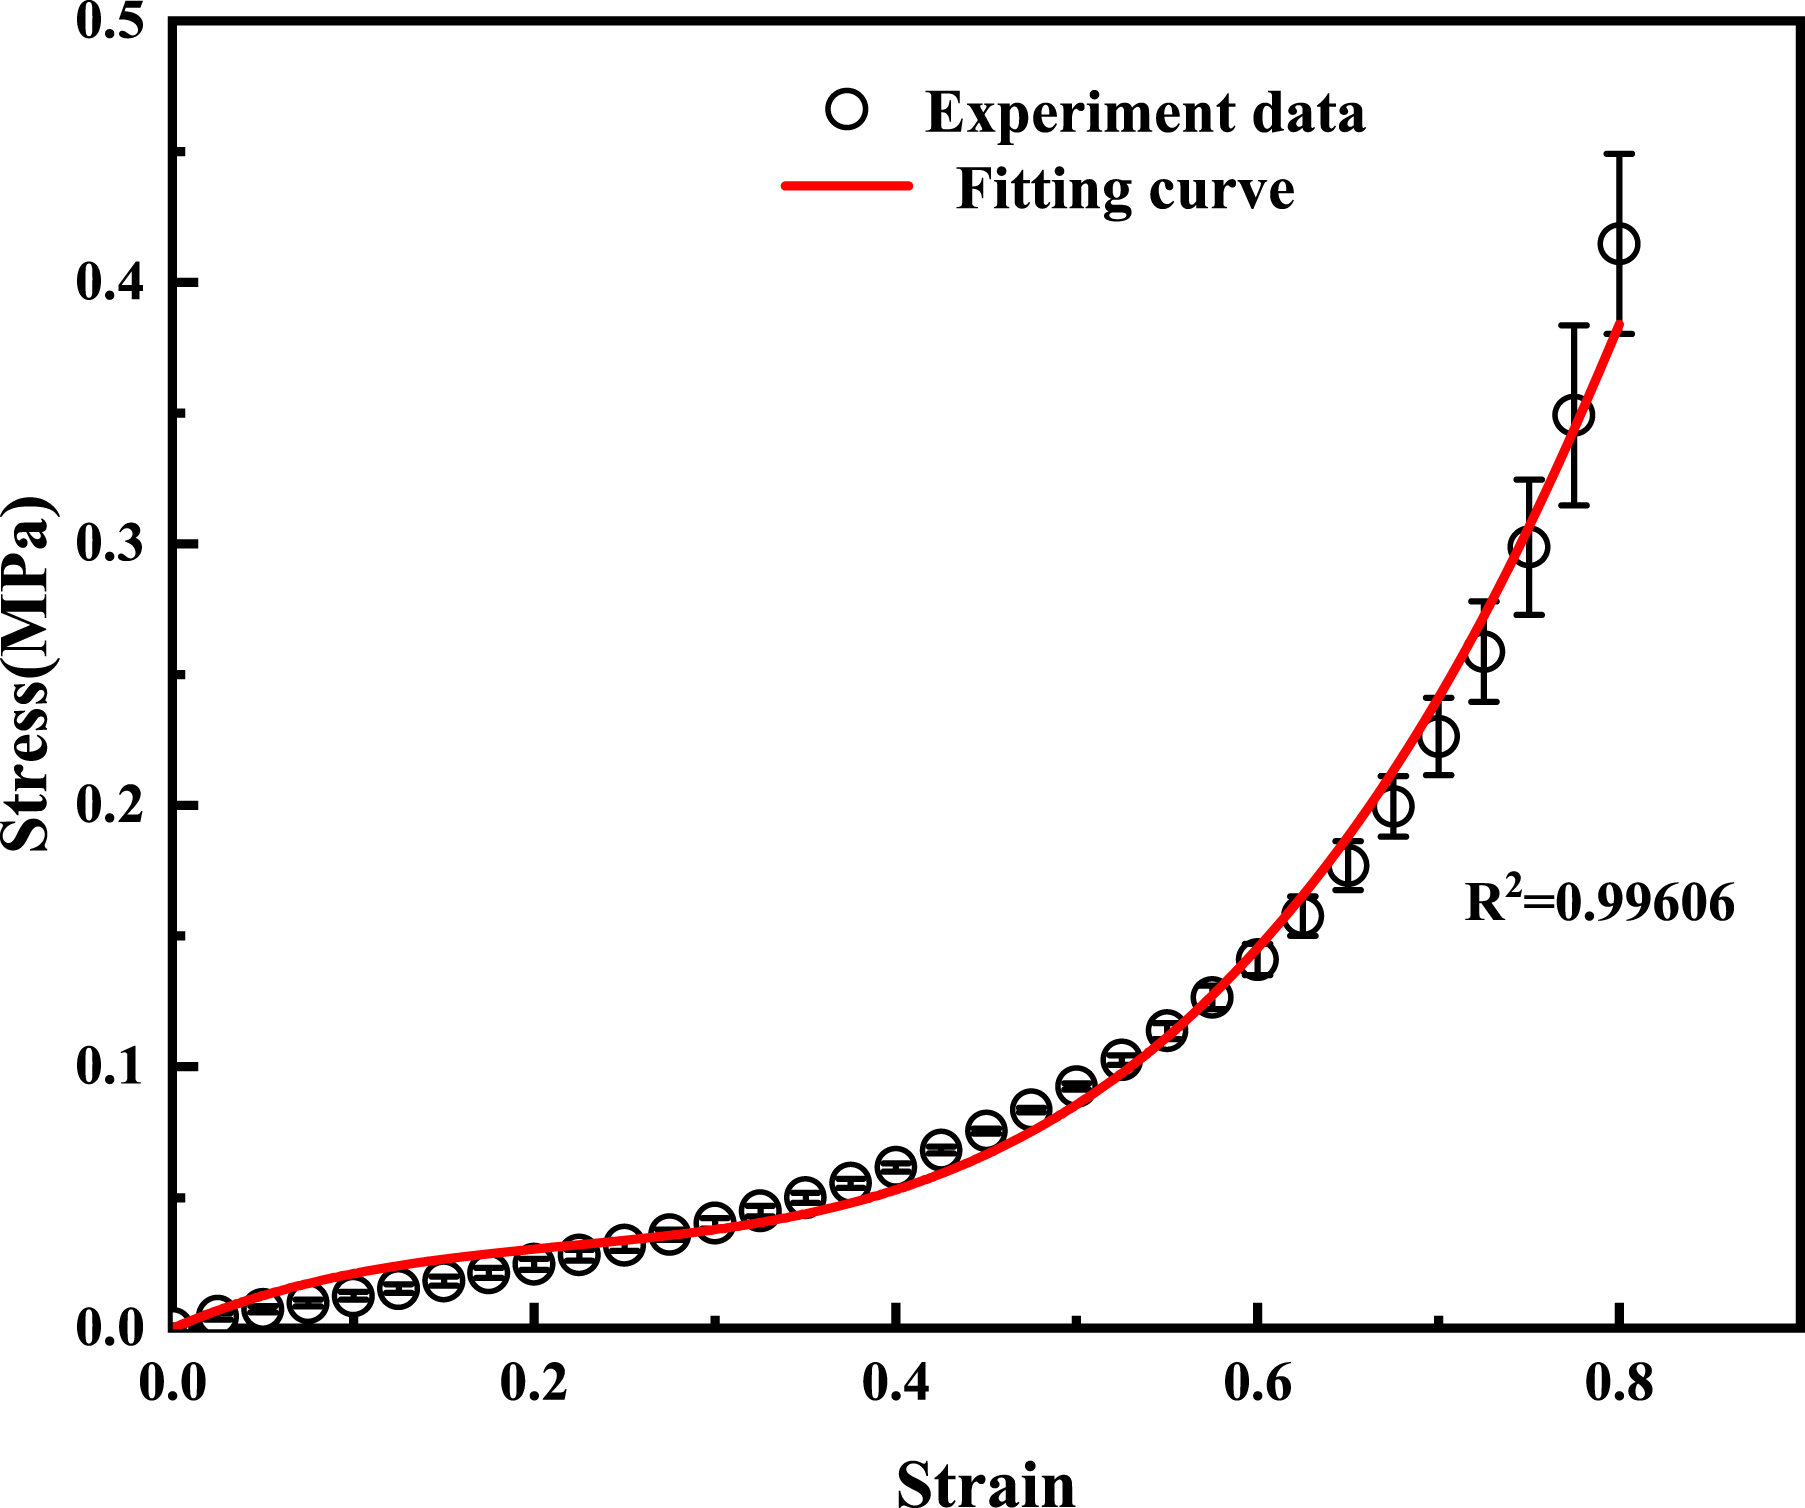
Construction strain rate term
The influence of strain rate on the stress
The stress–strain data of polyethylene foam at 4 × 10⁻³, 4 × 10⁻², 0.12, and 0.16 s−1 strain rates were obtained by quasi-static compression test, and the stress–strain data of polyethylene foam at 66.7, 80, 85.78, and 96.89 s−1 strain rates were obtained by drop-tower impact device in Figure 6. Stress–strain curves of polyethylene foam at different strain rates.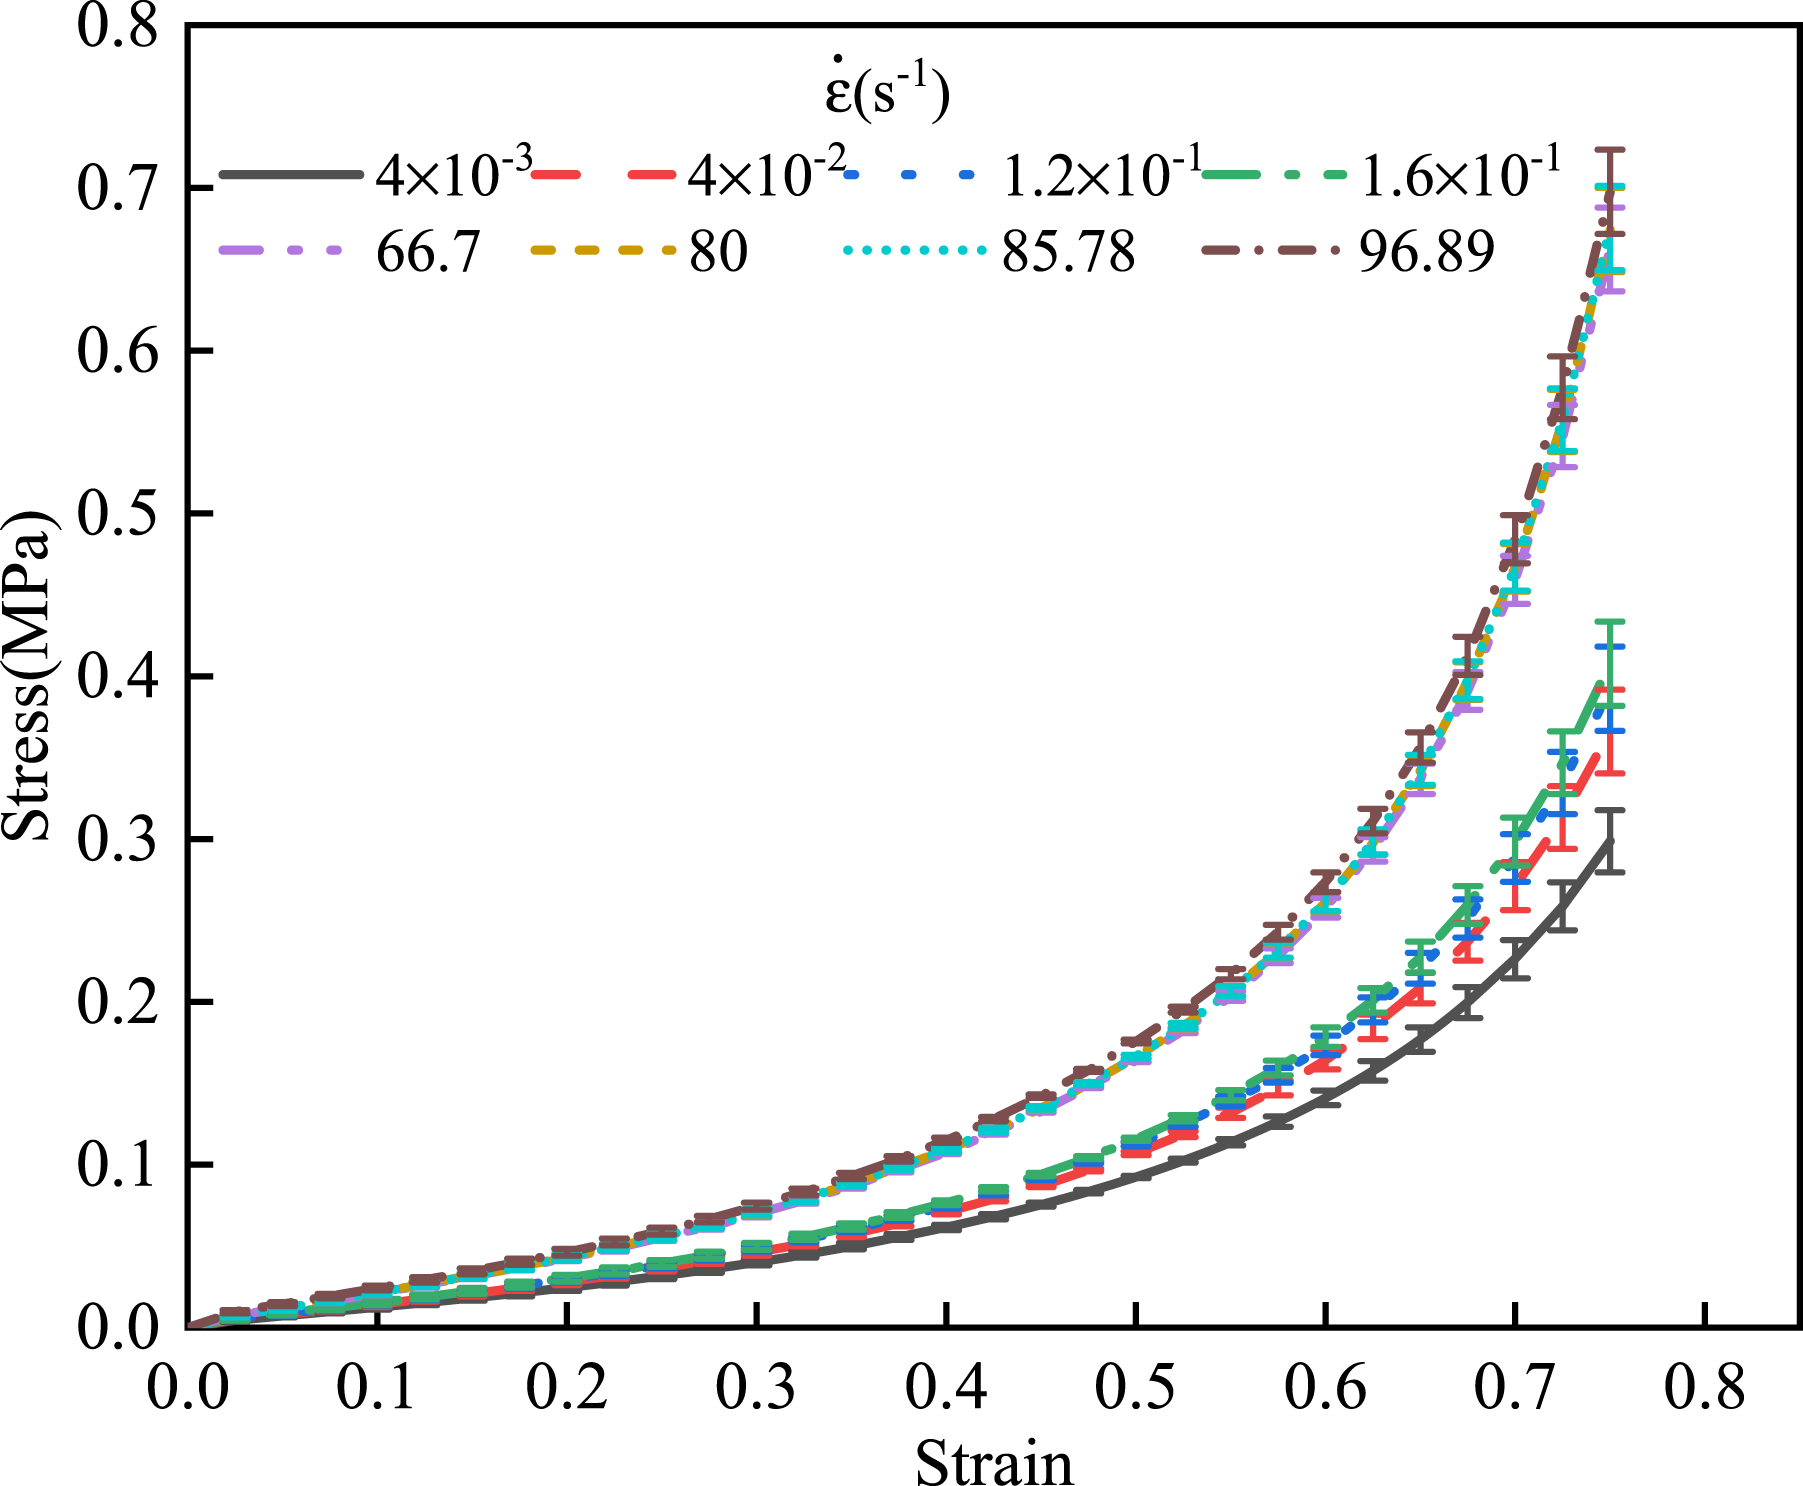
A typical stress–strain relationship for polyethylene foam at different strain rates was shown in Figure 6. There is an obvious difference between the stress of the material at the impact strain rate and the stress at the quasi-static strain rate. As for cellular materials, the strain rate sensitivity had been attributed to many different parameters, such as viscoelasticity and the heterogeneity of microstructure. 14 At slow strain rates, the stress was related to the heterogeneity of microstructure. However, at high strain rates, the stress was related to the viscoelasticity. 14 As for the cell structure of cellular materials, the plastic deformation or fracture under quasi-static stress appeared, however, elastic deformation occurred before and after the impact test. 18
The relationship between stress and logarithm of strain rate under the range of 0.2-0.7 strain was shown in Figure 7. The R-square of linear fitting of the relationship between stress and strain rate logarithm for polyethylene foams was above 0.98, indicating that the logarithm of strain rate and stress was linear in the range of 4 × 10⁻³–102s−1strain rate at the same strain. Relationship between stress and logarithm of strain rate under different strains.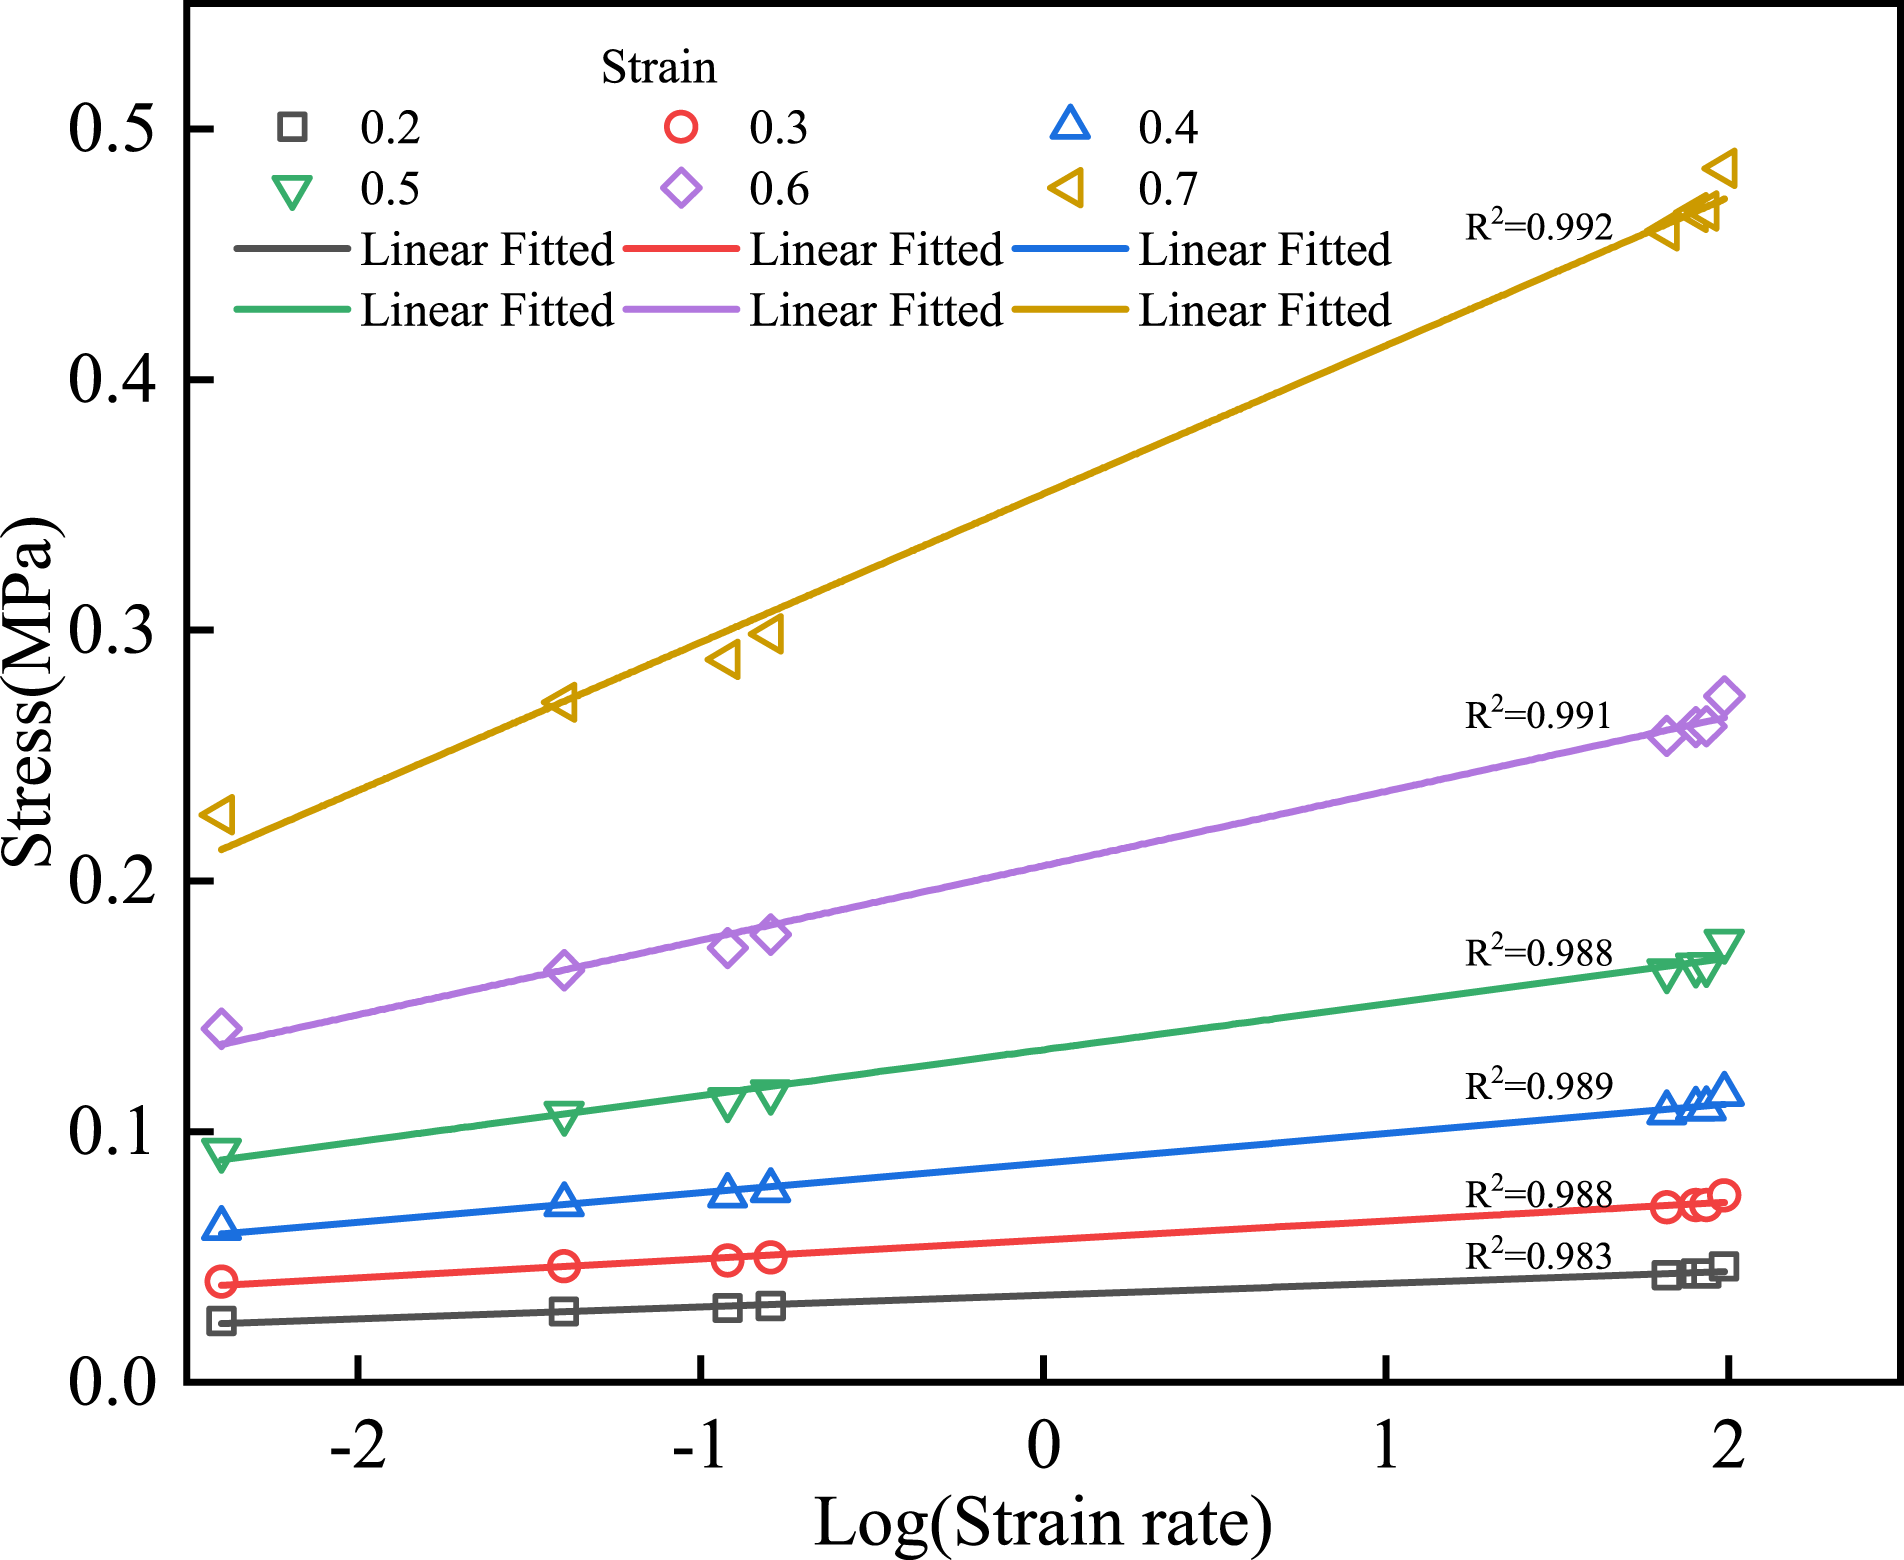
The influence of strain rate on energy absorption
The change in the energy absorption of polyethylene foam caused by strain rate effect was also calculated. The strain energy density was used to measure the energy absorption (Figure 8). The calculation for the energy density is as follow in equation (16). (a) Relationship between energy density and strain of polyethylene foam at different strain rates. (b) Relationship between energy density and logarithm of strain rate.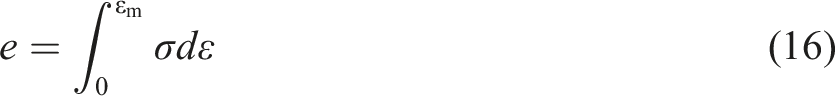
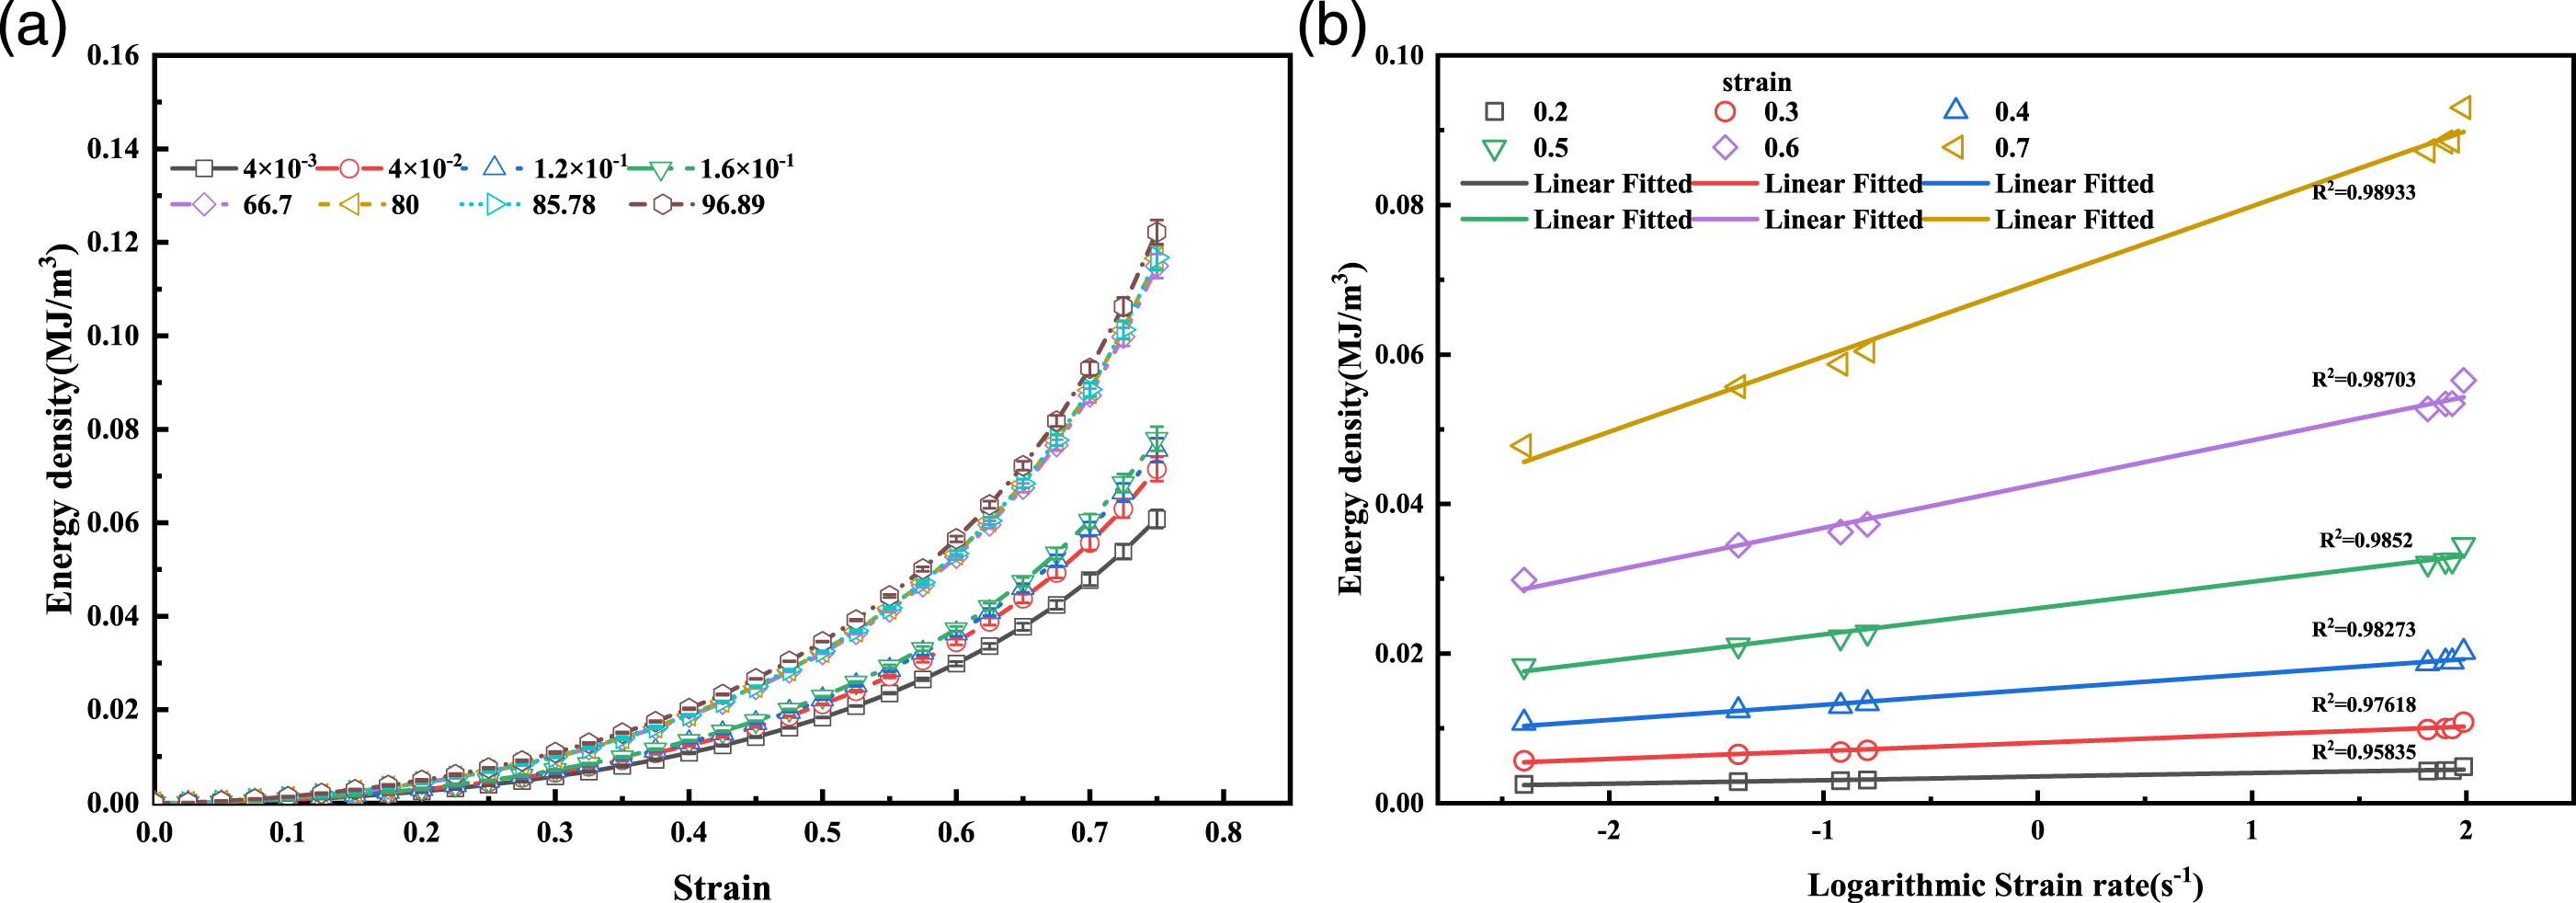
In Figure 8, the energy density of polyethylene foam under quasi-static and dynamic impact was significantly different. Compared with quasi-static compression, the cellular materials keep high energy dissipation until the lockup strain in dynamic compression.8,36,37 The R-square of linear fitting in the relationship between strain energy density and strain rate logarithm under different strain rates in various strains was above 0.95, indicating that the strain energy density and logarithmic strain rate under different strain rates were also linear in the range of 4 × 10⁻³–102 s−1strain rate at the same strain.
Construction the strain rate term
According to equation (11), the density and temperature terms were not studied in this paper, the constitutive model with the strain rate is represented by equation (17):
The strain rate term is the ratio of stress to reference stress (equation (18)):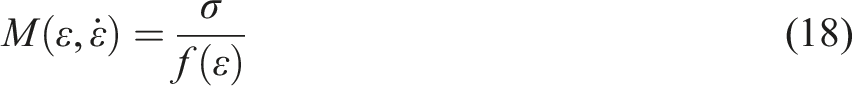
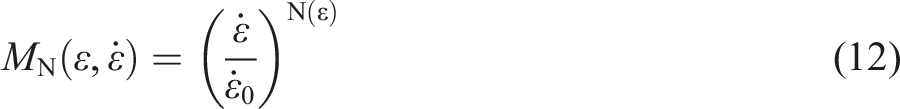
Based on Nagy and Figure 7, the influence of strain and strain rate on stress cannot be decoupled. The strain rate strengthening in Johnson-Cook model is modified as equation (19).
The relationship between the strain rate ratio and stress ratio under the 0.1, 0.5 and 0.7 strain is described by the Nagy and Johnson–Cook models as shown in Figure 9. Fitting of the relationship between stress ratio and strain rate ratio by Nagy and Johnson–Cook models.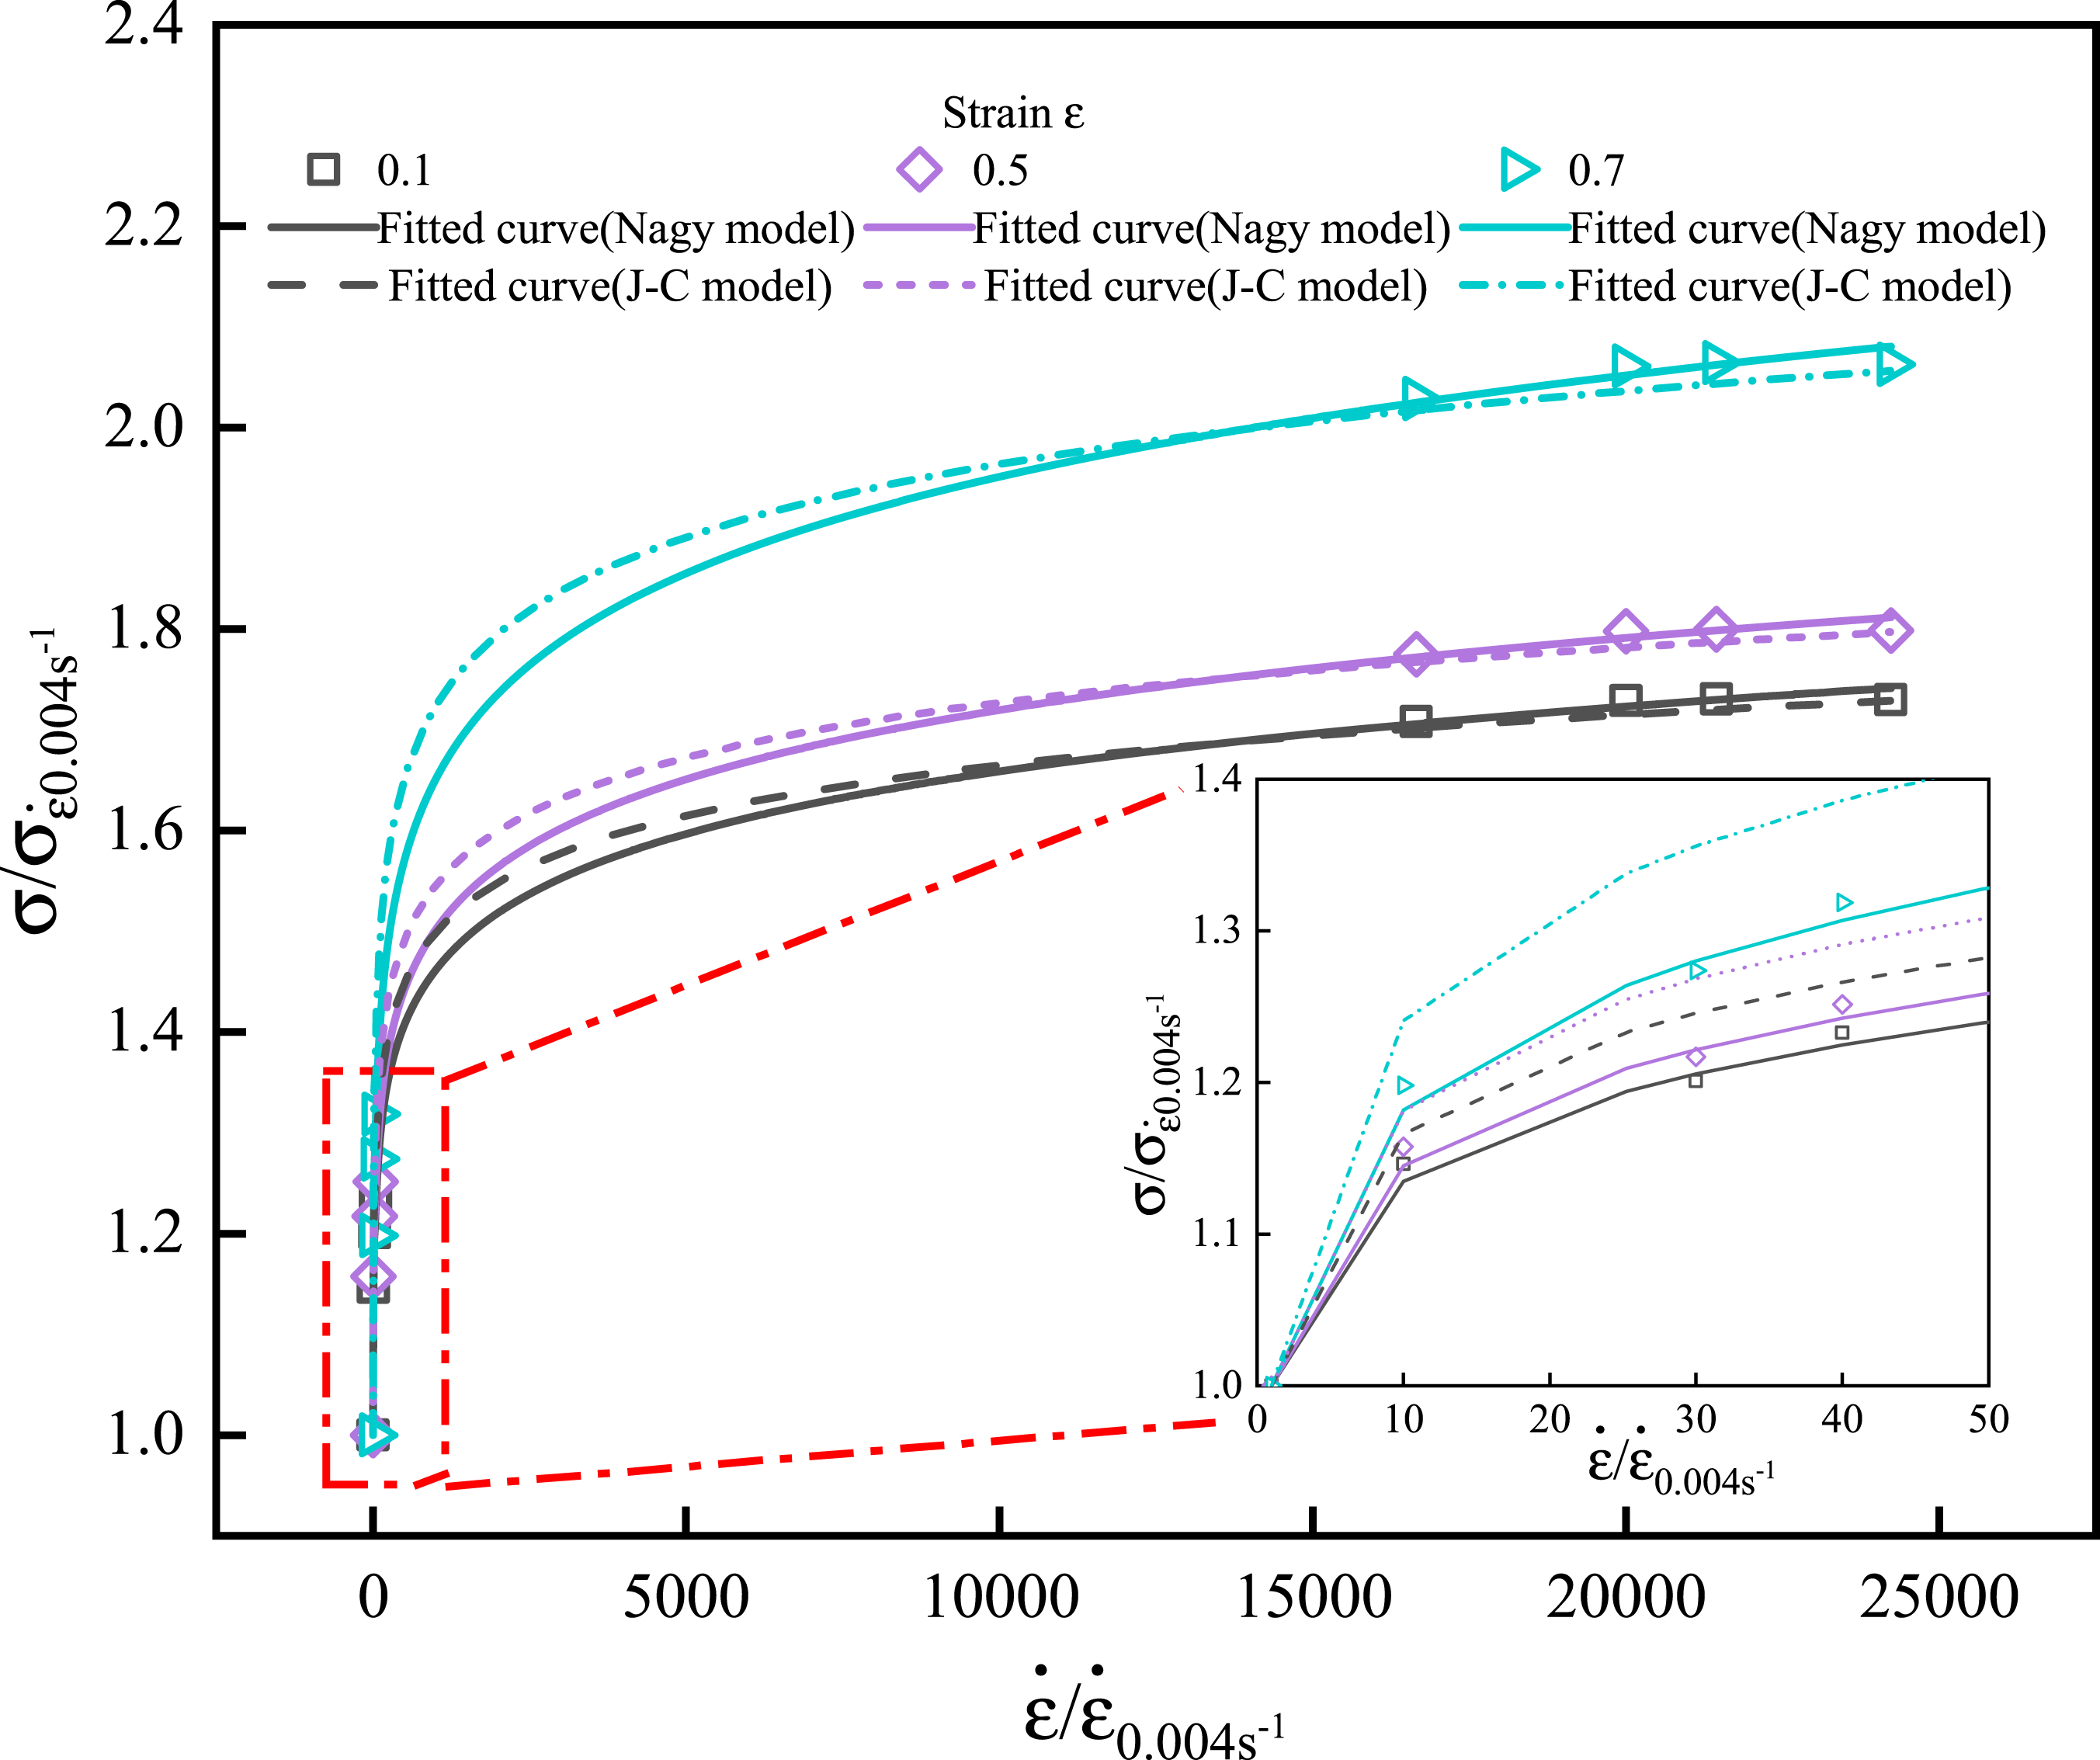
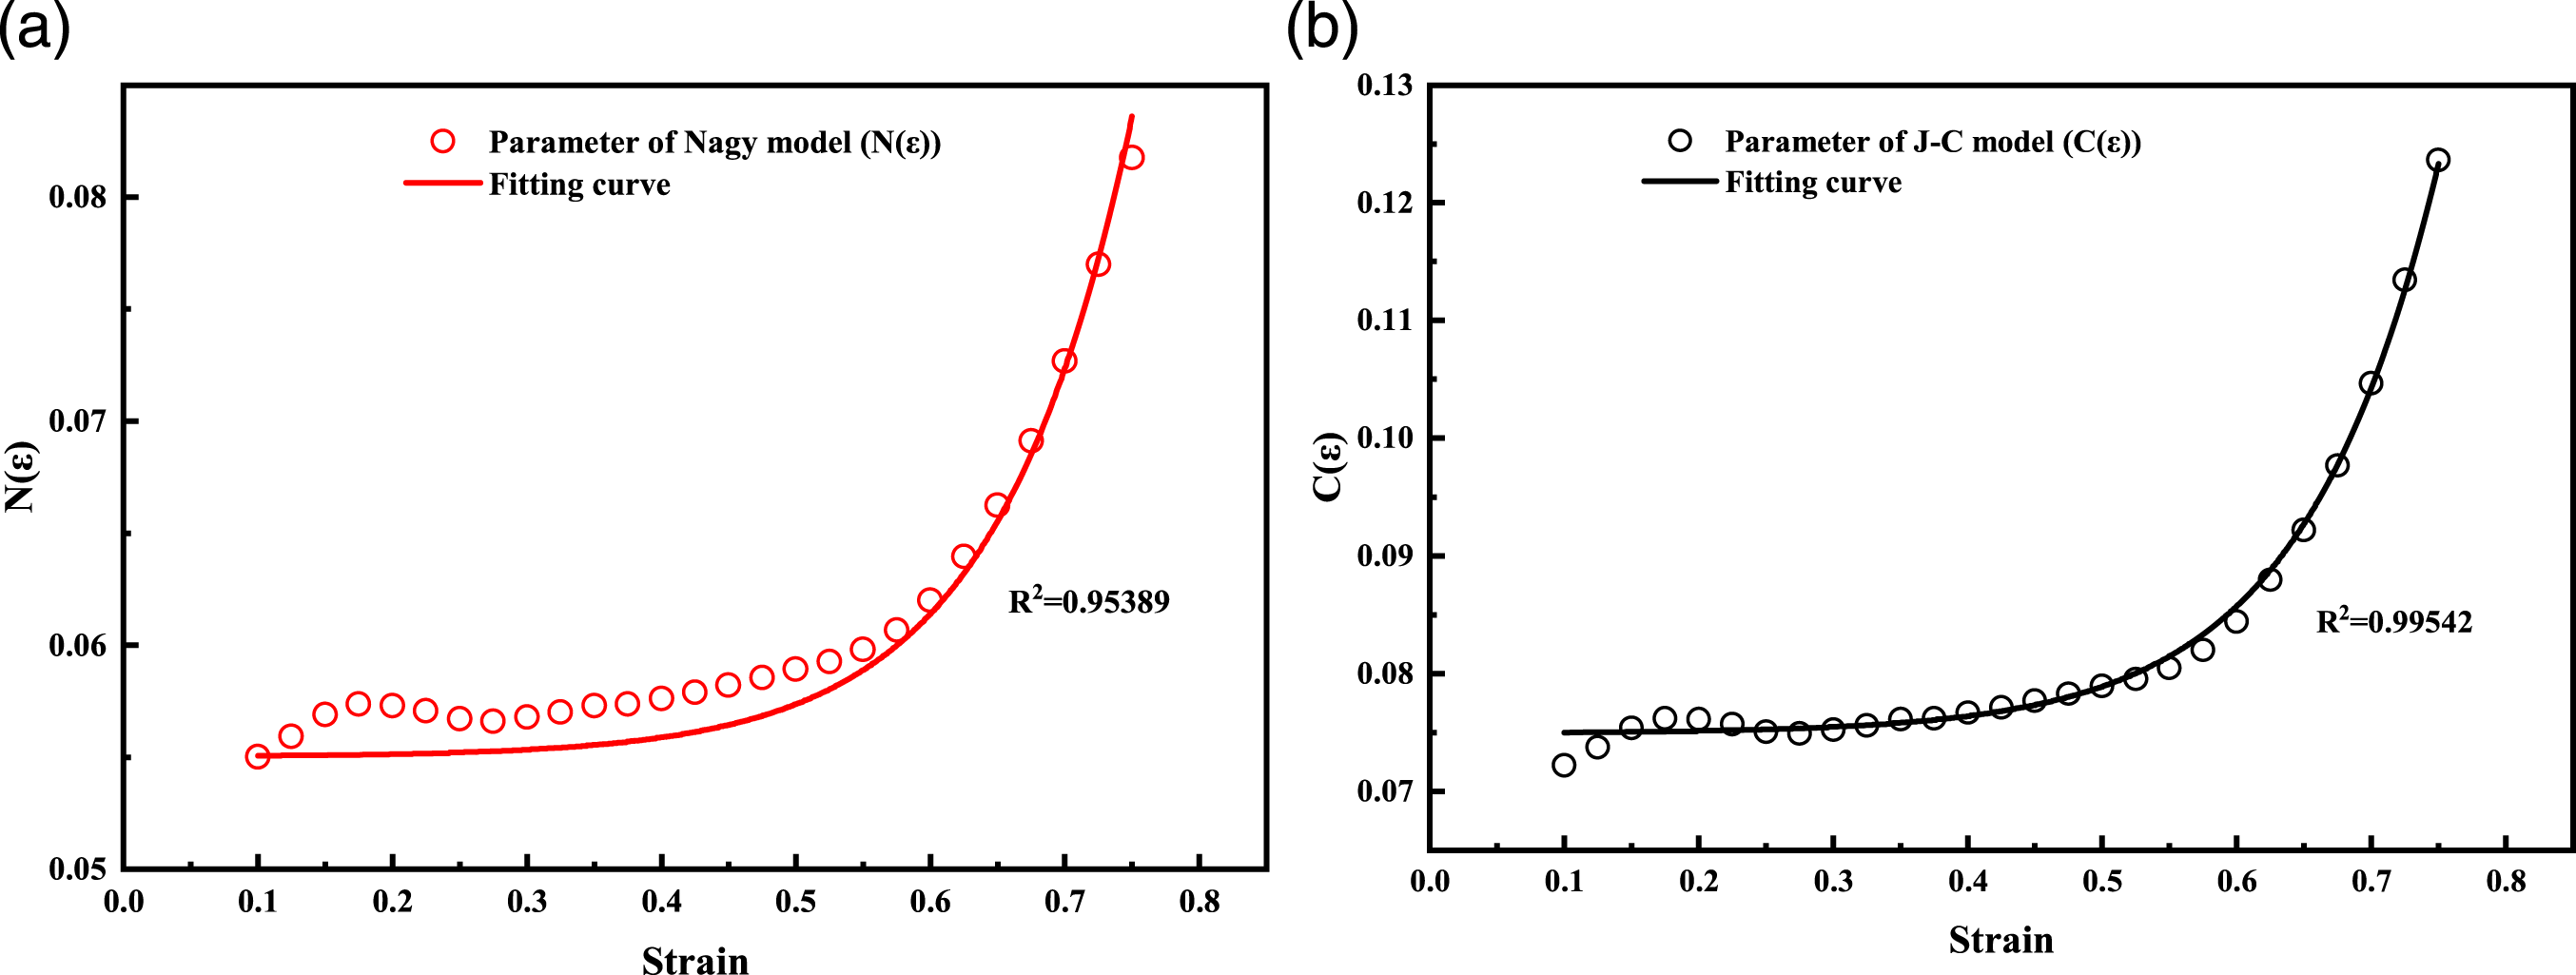
As shown in Figure 9, the parameter ( Relationship between parameters and strain in (a) Nagy and (b) Johnson–Cook models.
Submitting equations (12), (15), and (20) to equation (11), the Nagy model is revised as follows: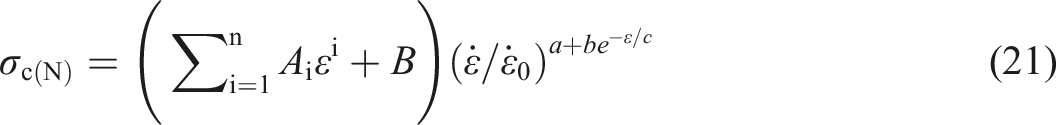
According to equations (14), (15), (19), and (21), J-C model is modified as follows: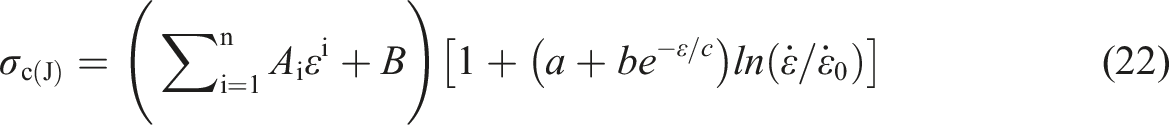
A method for the stress–strain relationship under an arbitrary strain rate is proposed by introducing the proportional factor. The constitutive model is constructed with shape function and strain rate term by the method. In the finite element simulation software (such as ABAQUS, LS-DYNA), the stress–strain characteristics of different the strain rates were used to describe the deformation progress of materials. Although this approximation is a rough explanation of physical behavior, satisfactory results are obtained in most engineering applications.10,23,27
Verification of constitutive model in finite element model
Establishment of finite element model
The commercial software ABAQUS (version 2019) was used to simulate the dynamic compression process of polyethylene foam in the drop-tower impact test. ABAQUS software provides a variety of material models for different types of foam. The Low-Density Foam model was used to simulate the mechanical properties of polyethylene foam. This model is suitable for high-compressible elastic foam with low density and evident rate-sensitive behavior. 38 The interpolation was performed in the solving based on the logarithmic relationship between stress and strain rate. 38 This was consistent with the relationship between the stress and strain rate of polyethylene foam in Figure 7.
According to equations (21) and (22), Nagy model and Johnson-Cook model can accurately describe the mechanical properties of polyethylene foam. In this work, the stress–strain response of polyethylene foam under different strain rates was obtained by the constitutive model in equation (21). This model was directly applied to the Low Density Foam model as shown in Figure 11. Stress–strain curves at different strain rates from the constitutive model.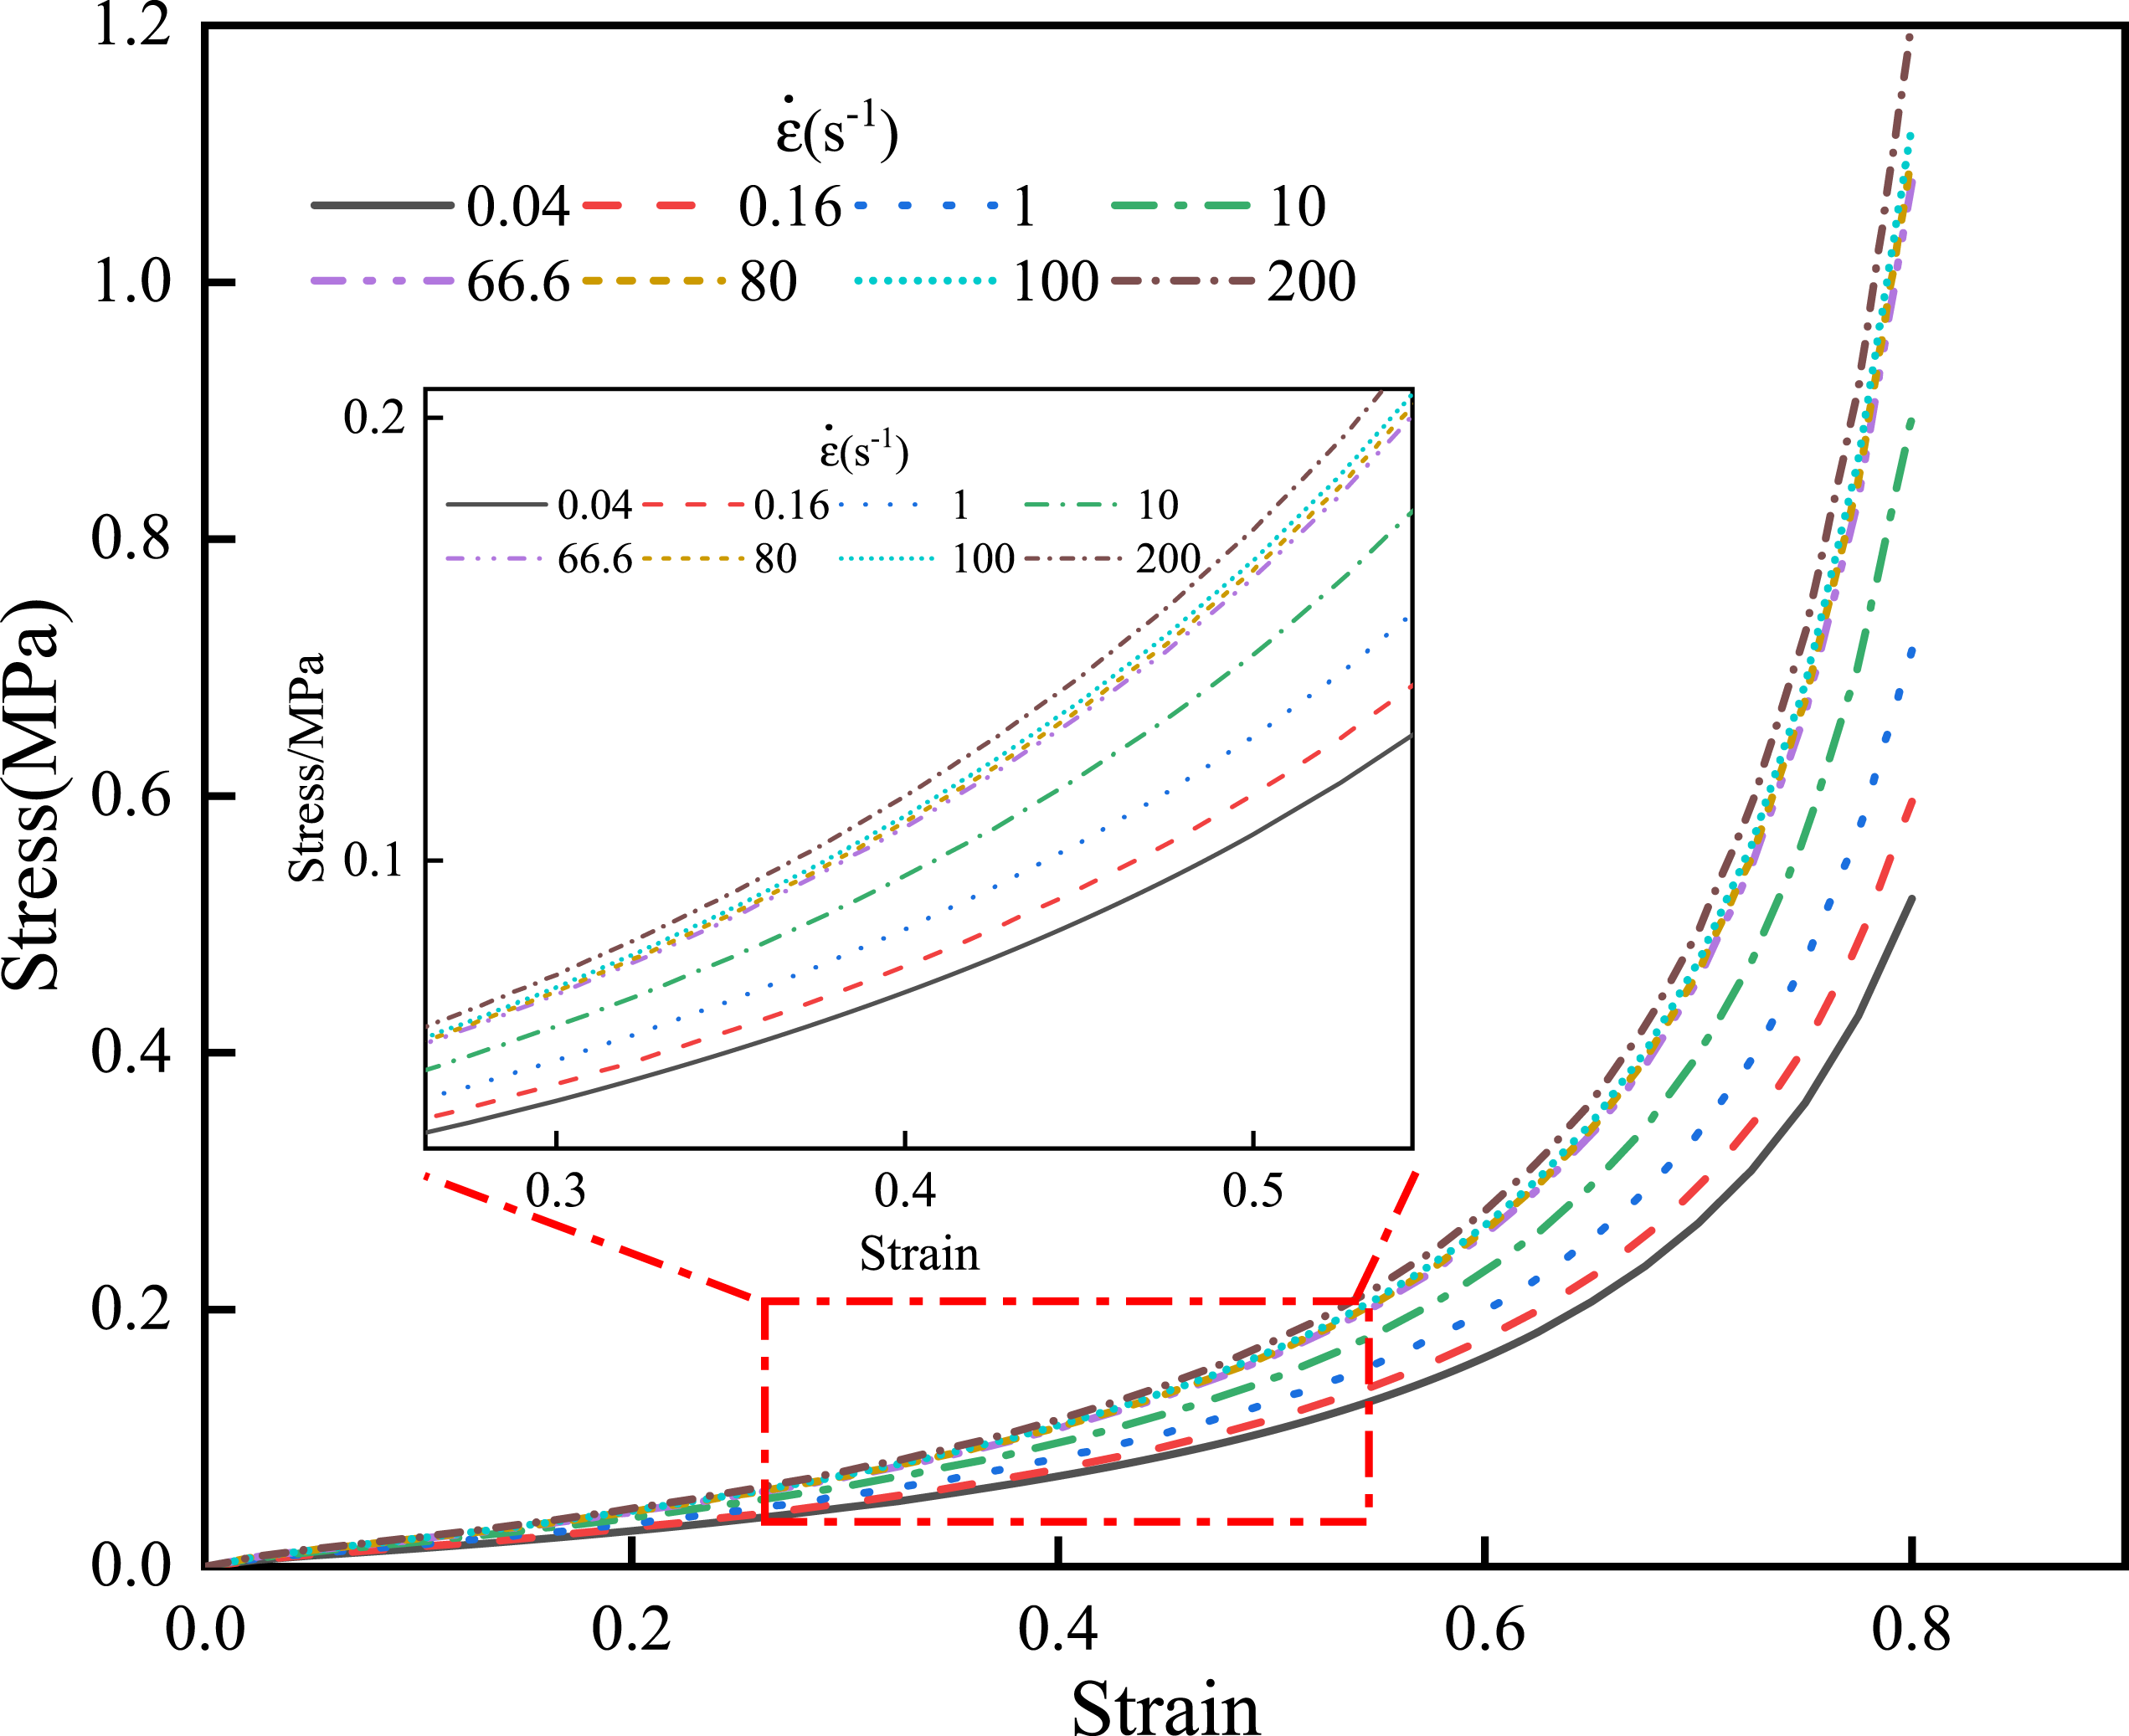
The impact heights were 460, 660, 760 and 970 mm, and the mass block was 7.93 kg. The simulation model was shown in Figure 12. The display dynamics was used to analyze. The convergence method was ‘Newton method’ and the residual error was set 5 × 10⁻³.
38
The size of block and ground were both 200 mm × 200 mm, and the thicknesses were 10 mm. The ground and block mass were set discrete grid.
31
The size of foam was 100 mm × 100 mm, and the thickness was 50 mm. The material of foam was set EPE. The element type of the model was C3D8R and hexahedron. The mesh size of ground and mass block mass did not deform and were both set 5 mm. The mesh size of foam was set 2 mm. The expansion coefficient of each part was set as 5 layers, and the height ratio was set as 1.2. The ground was fixed, the contact with EPE and block mass was surface-to-surface discretization, and the velocities of the mass block were 3000, 3600, 3860 and 4320 mm·s−1. Three-dimensional simulation model.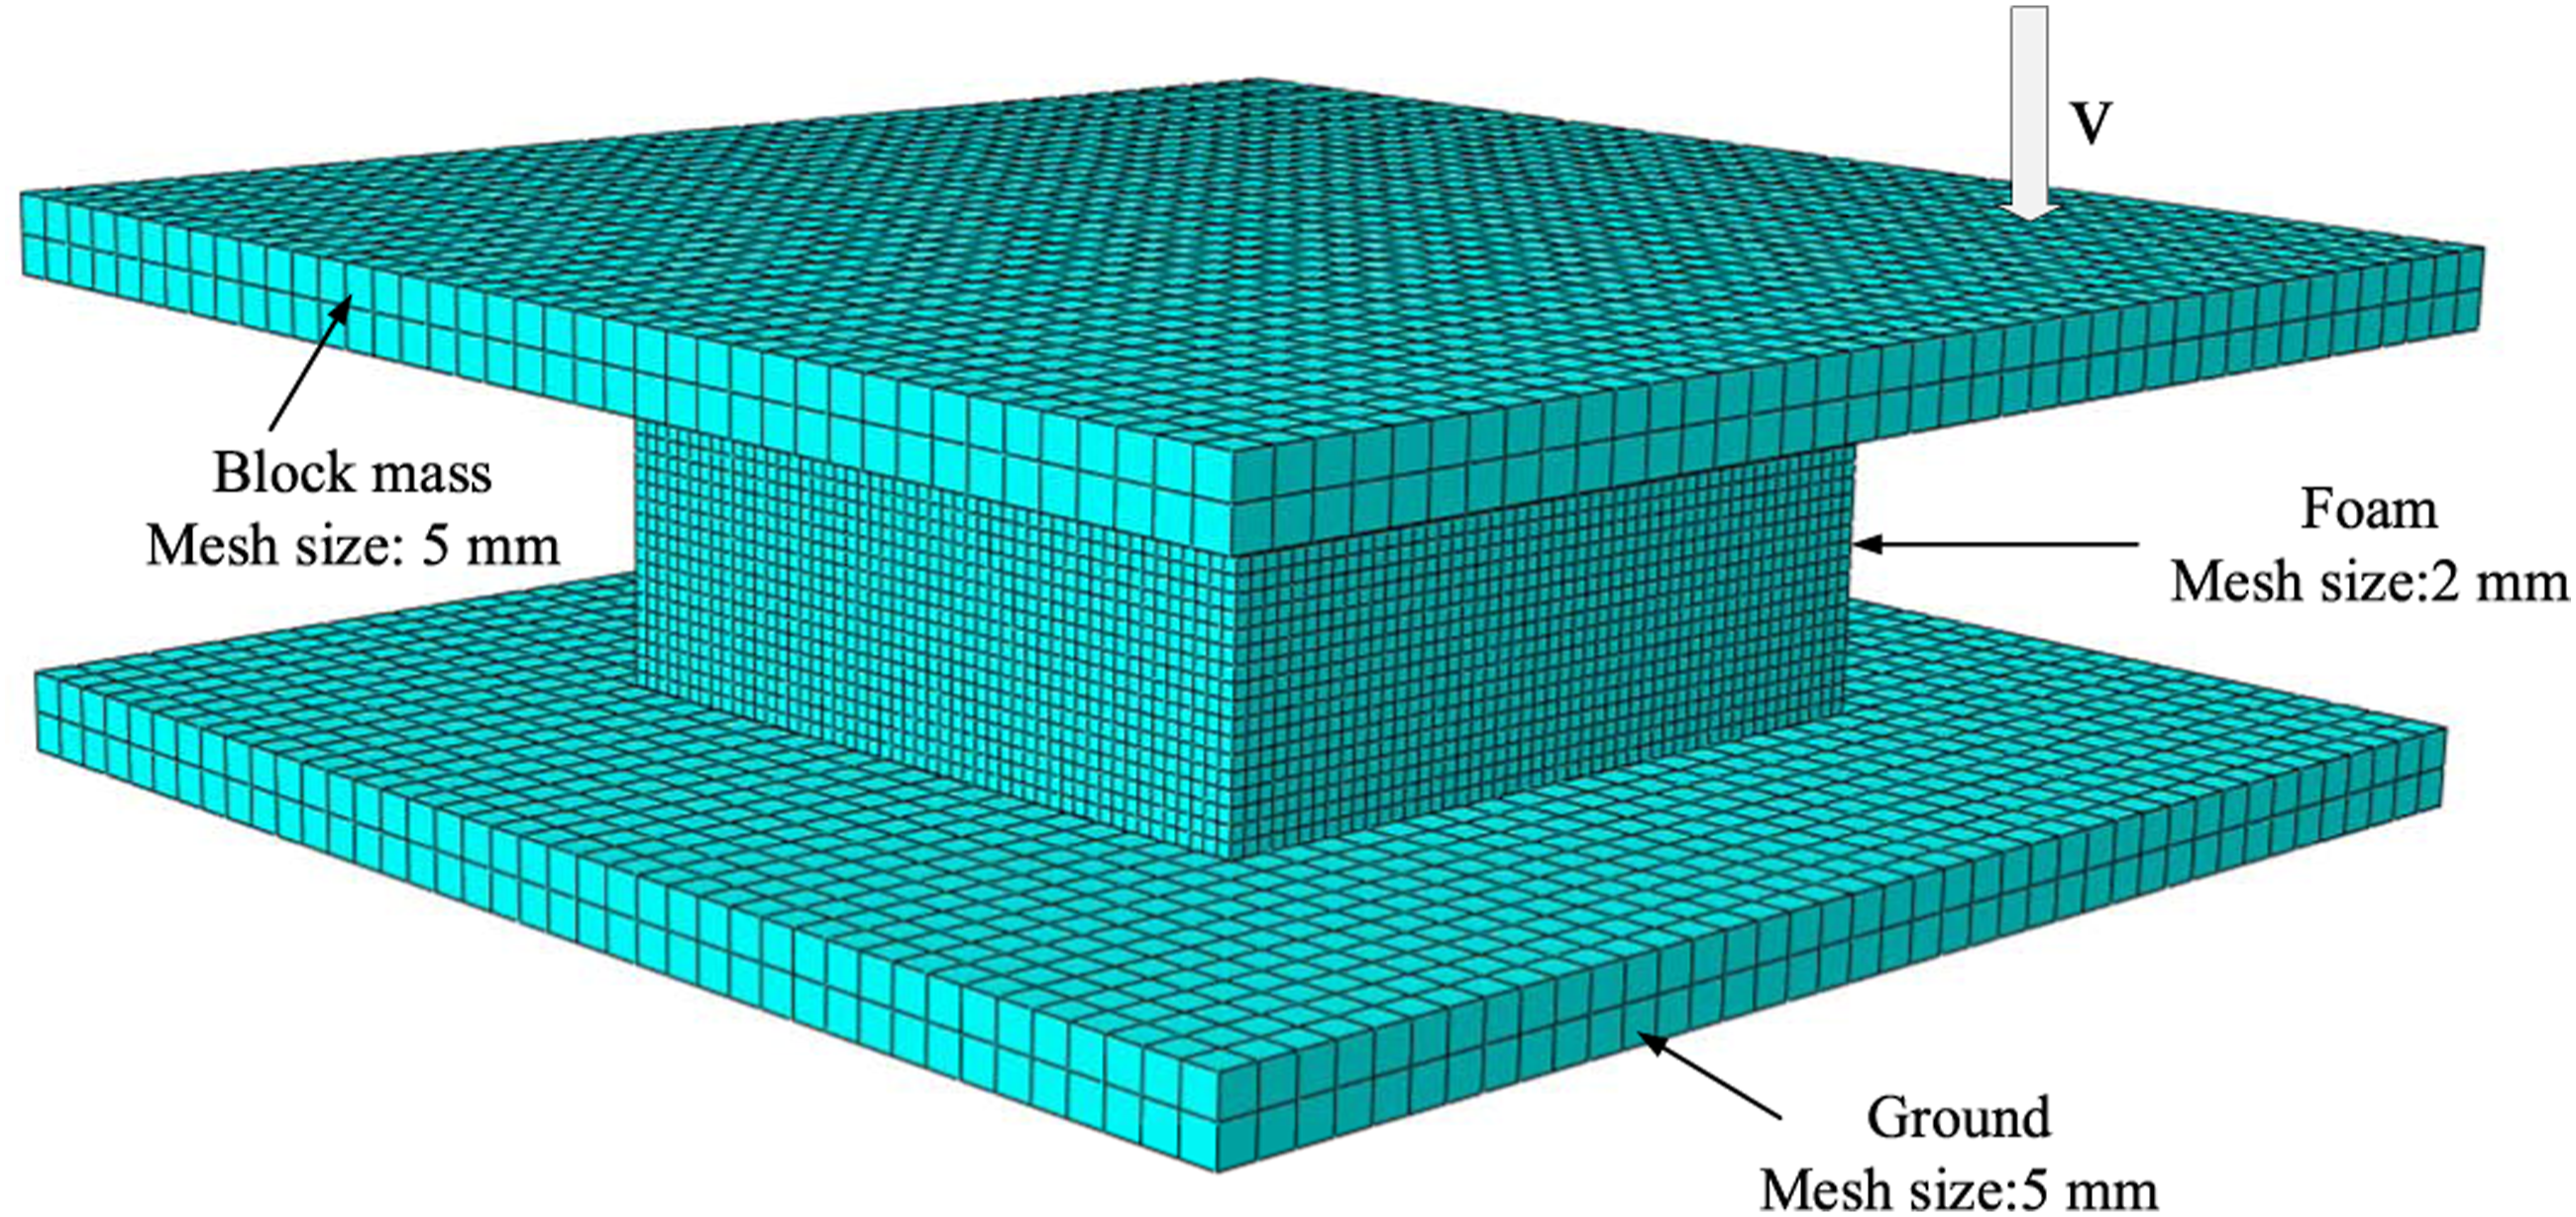
Comparison and analysis of simulation results and experiments
The simulation results were compared with the experimental under the same working condition, as shown in Figure 13. The error of peak acceleration between simulation and experiment was as equation (23). The results were shown in Table 3. Acceleration–time curves obtained by experiment and finite element simulation ((a) 460, (b) 660, (c) 760, and (d) 970 mm impact heights). Results of simulation and experiments.
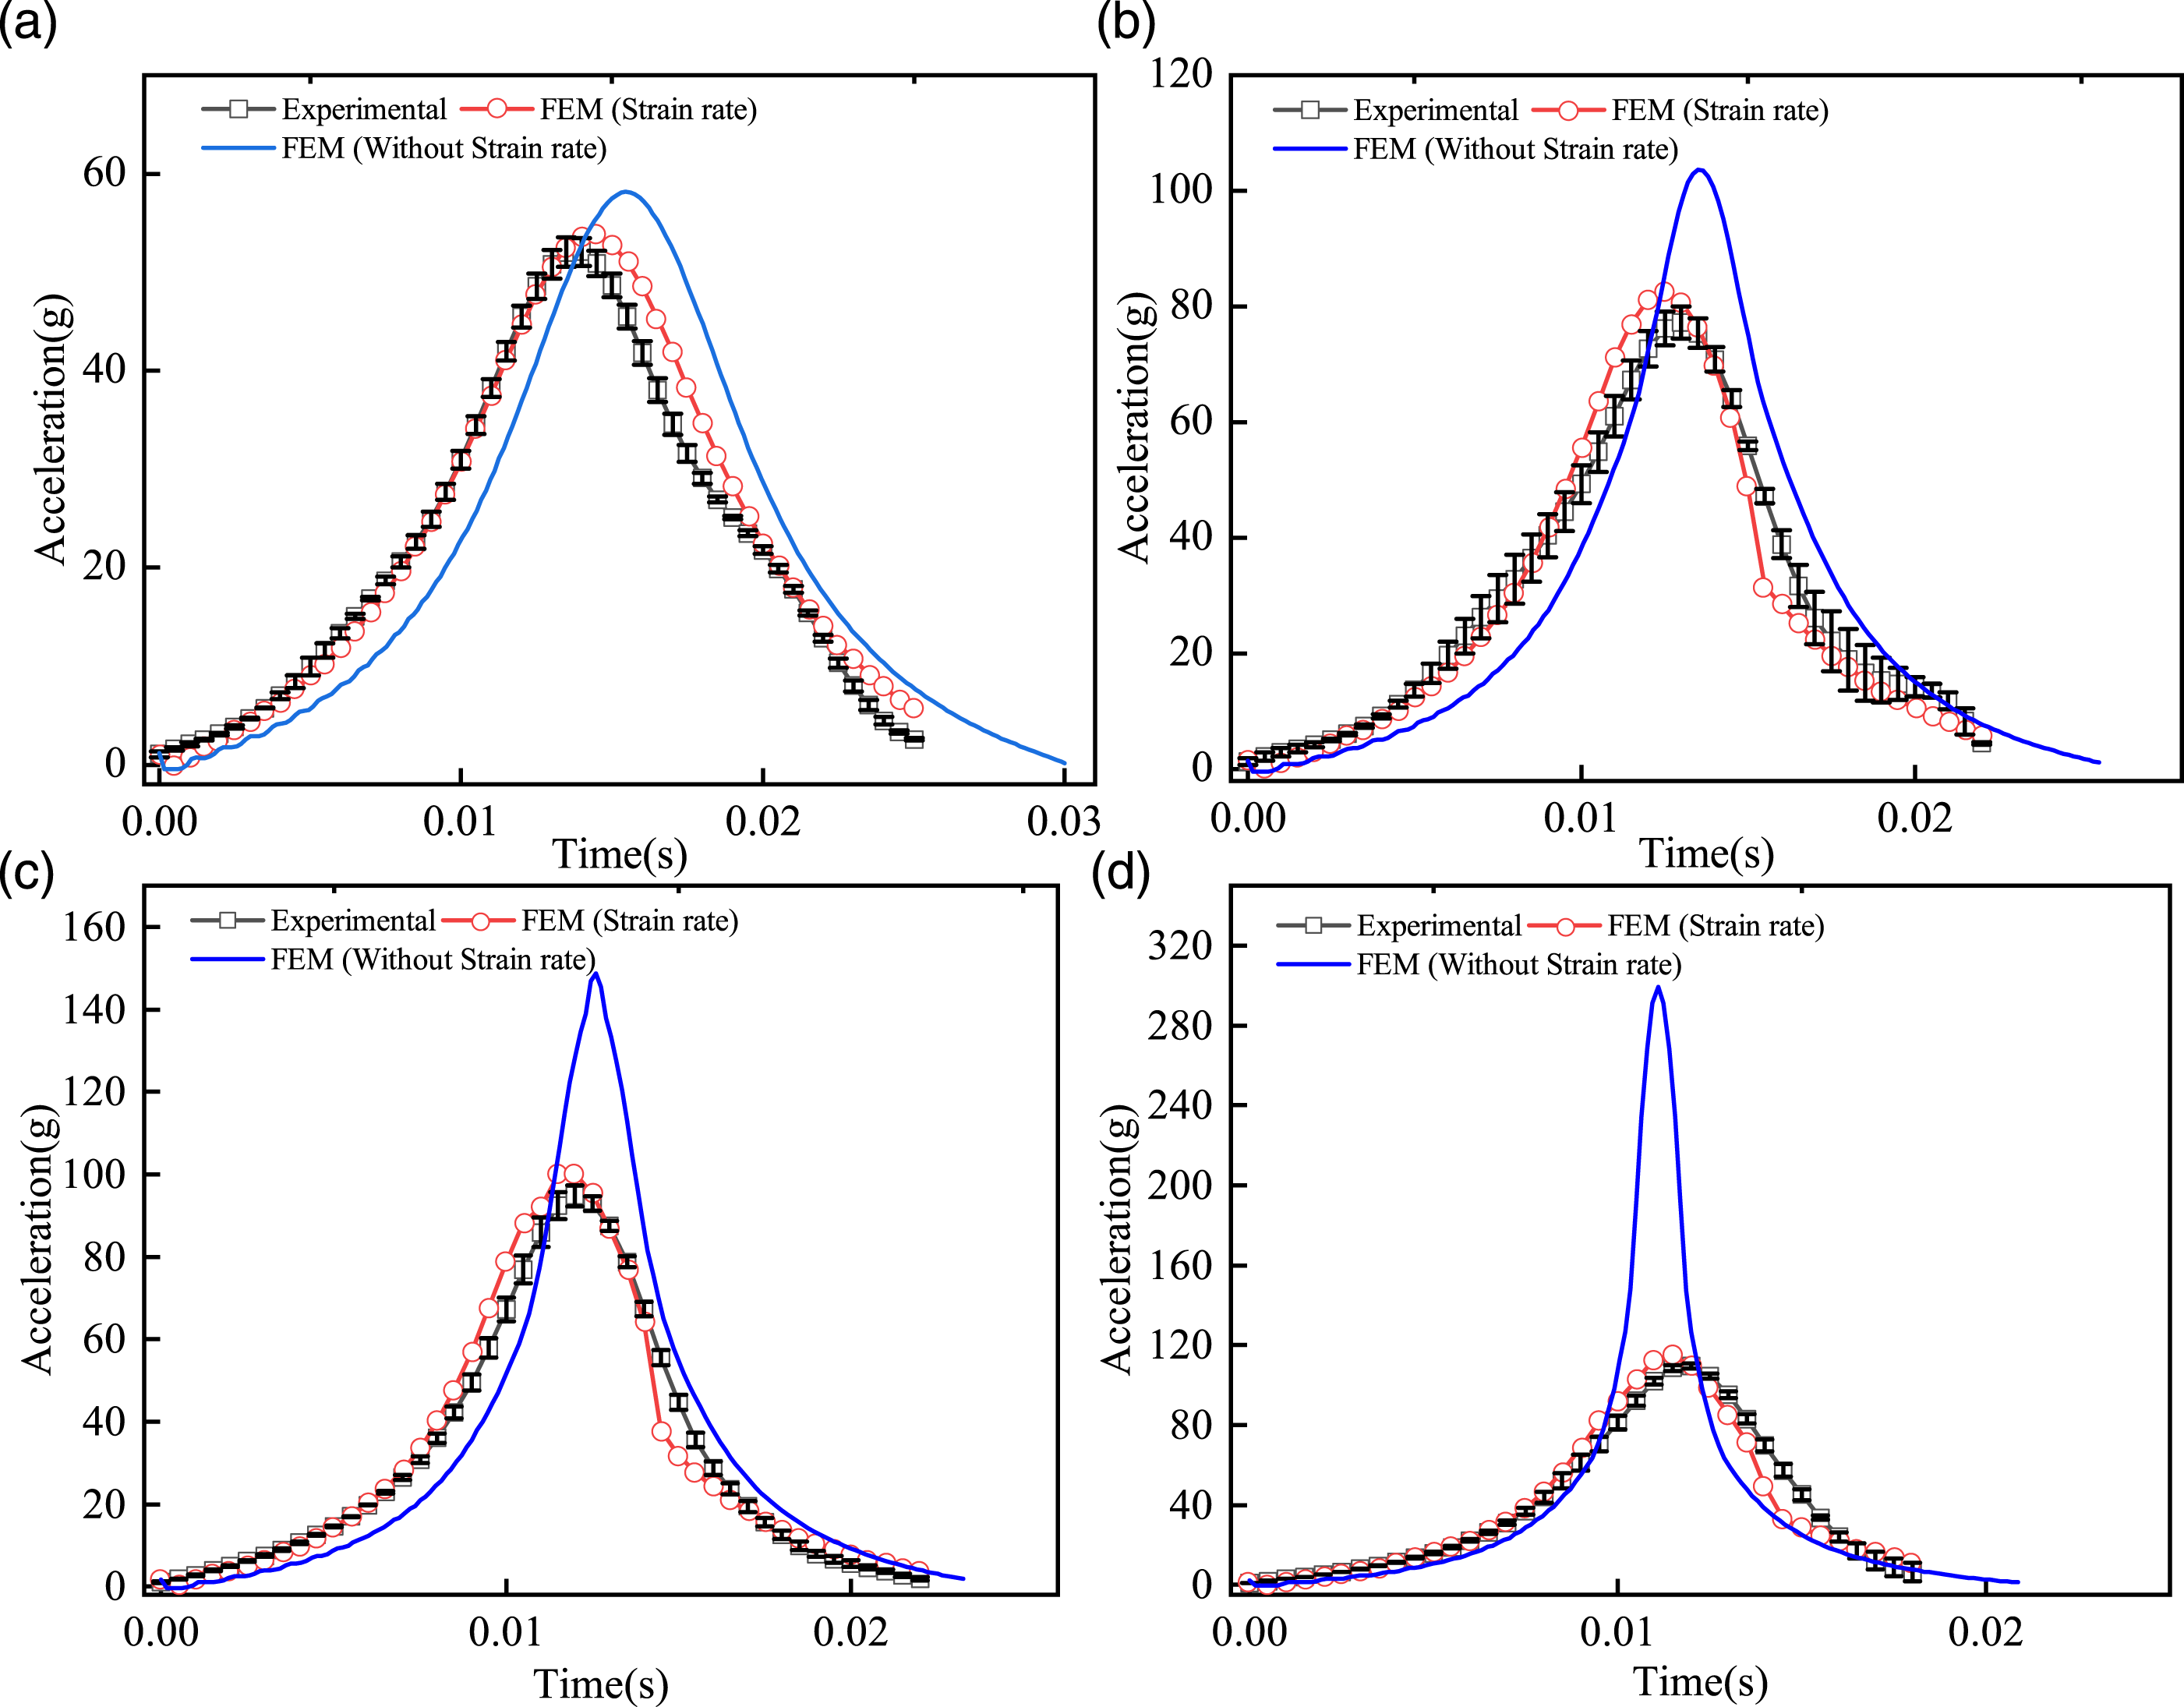
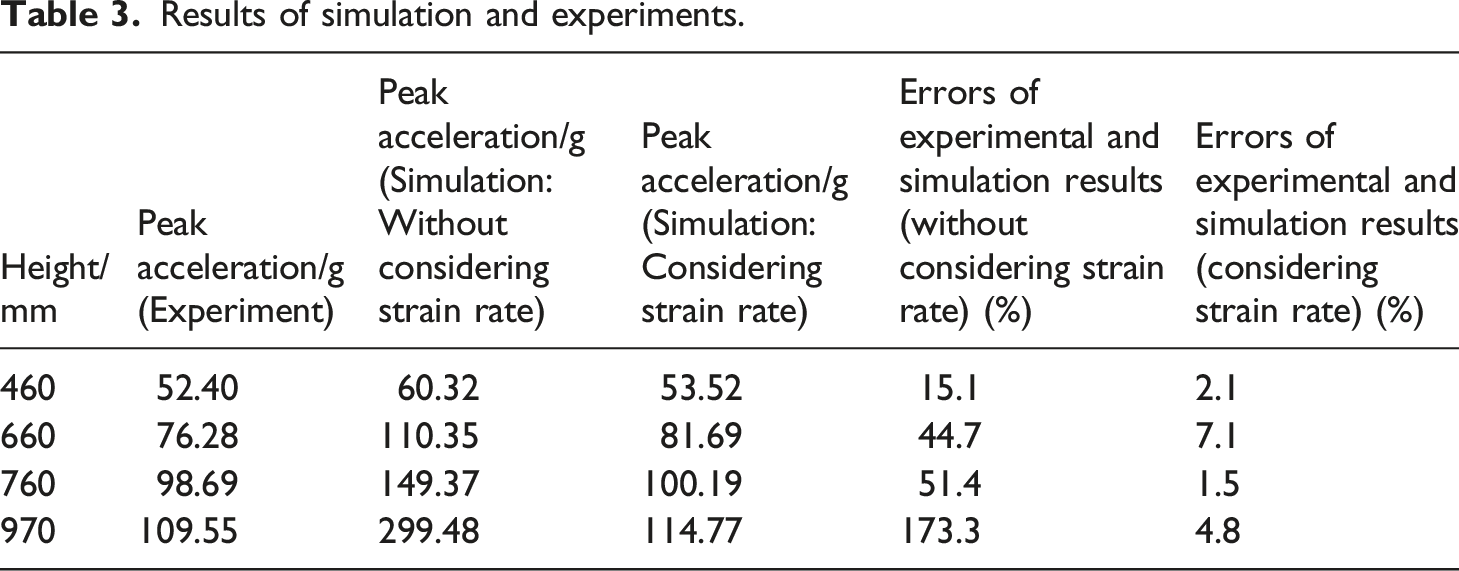
In Figure 13 and Table 3, when the impact heights were 460, 660, 760 and 970 mm, the errors between the simulation results without considering the strain rate and experimental results were 15.1%, 44.7%, 51.4% and 173.3%. The errors between simulation considering strain rate and experimental results were 2.1%, 7.1%, 1.5% and 4.8%, indicating that the strain rate was not ignored. With the impact heights increase, the influence of strain rate on peak acceleration increase.
The errors of the stress–strain curves between experiment and FEM were obtained at different impact heights as shown in Figure 14. When the impact heights were 460, 660, 760, and 970 mm, the maximum errors were 1.093%, 3.532%, 2.583%, and 3.176%. With the strain increase, the errors between experiment and FEM with strain rate results increase, indicating that this model can predict well drop-tower impact progress under small strain. Stress–strain results of polyethylene foam obtained by experiment and finite element simulation ((a) 460, (b) 660, (c) 760, and (d) 970 mm impact heights).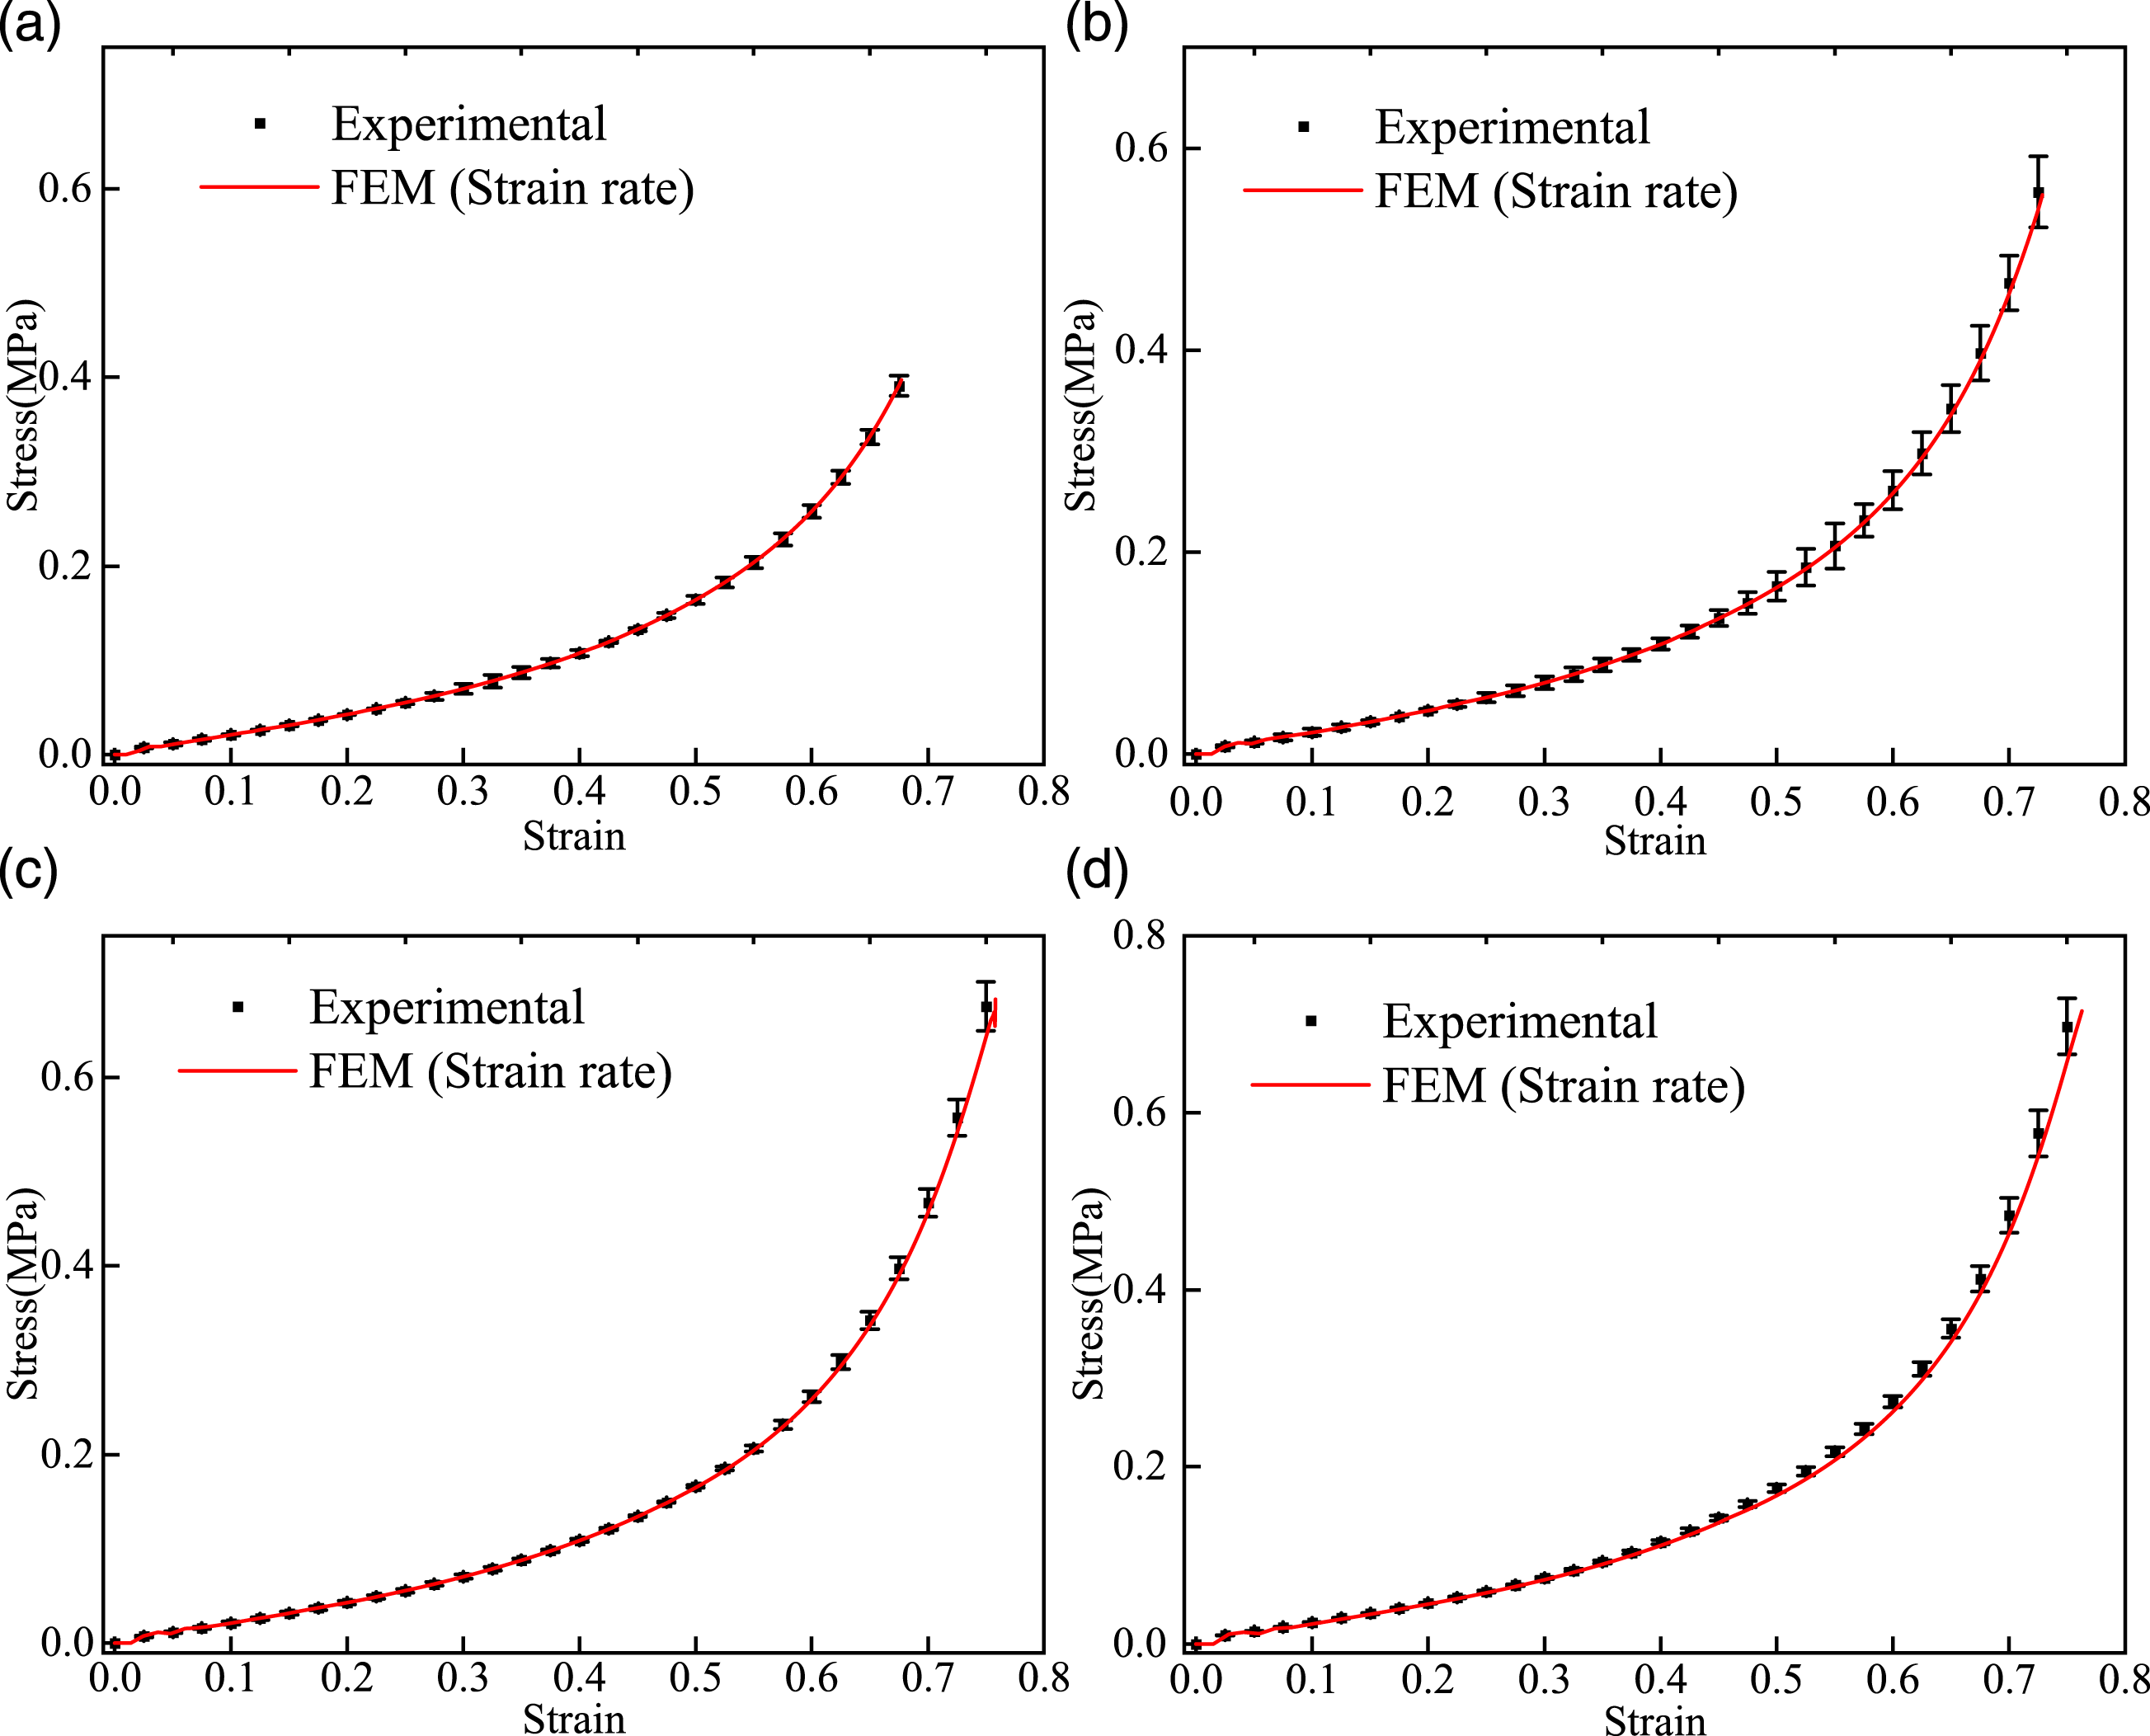
When the strain rate effect of polyethylene foam was not considered in the simulation, the peak acceleration obtained by impact simulation was different from the experimental data. The polyethylene foam has evident strain rate-strengthening effect under impact load. The simulation results of polyethylene foam model defined by constitutive model with the strain rate were consist with the experimental results, verifying the accuracy of strain-rate constitutive model and Low Density Foam model.
Conclusions
The stress–strain response and energy absorption capacity under quasi-static compression and drop-tower impact were investigated. The constitutive model considering the strain rate effect was constructed and applied to the finite element simulation of drop-tower impact. The following conclusions can be drawn from this study: a. Polyethylene foam shows a certain degree of strain rate sensitivity. The stress of polyethylene foam at intermediate and low strain rates (10−4–102 s−1) is linear with the logarithm of strain rate, and the strain energy density was also linear with the logarithm of strain rate. b. The relationship between parameters and strain coupling strain ratio in Nagy and Johnson–Cook models was improved. The improved constitutive models are accuracy for the stress–strain relationship of polyethylene foam in the strain rate range of 4 × 10⁻³–102 s−1. c. The errors of peak acceleration between the experiments and the finite element simulation with strain rate effect were less than 7.1%, verifying the accuracy of strain-rate constitutive model and simulation model.
Footnotes
Declaration of conflicting interests
The author(s) declared no potential conflicts of interest with respect to the research, authorship, and/or publication of this article.
Funding
The author(s) disclosed receipt of the following financial support for the research, authorship, and/or publication of this article: This work was supported by the Tianjin Municipal Education Commission (NO. 2019KJ209).