
Abstract
Background:
Insight into illness is often used in clinical and legal contexts, for example, as evidence of decision-making capacity. However, it is unclear whether this disadvantages certain groups protected under equality legislation. To our knowledge, this question has yet to be addressed systematically. Therefore, the present study reviews empirical studies that look at the relationship between insight and sociodemographic variables.
Methods:
A systematic search of six bibliographic databases (CENTRAL, CINAHL, Cochrane Library of Systematic Reviews, EMBASE, MEDLINE and PsycINFO) was conducted, which yielded 6,192 results. Study characteristics and outcomes (associations between insight and socio-demographic variables) were then extracted from 207 eligible studies. This included protected characteristics under the Equality Act (2010): age, sex, ethnicity, marital status and religion. Weighted confidence estimates were calculated and relevant moderators included in a random effects meta-analysis. A study protocol was registered prospectively on PROSPERO, ID: CRD42019120117.
Results:
Insight was not strongly associated with any sociodemographic variable. Better insight was weakly but significantly associated with white ethnicity, being employed, younger age and more years of education. The age associations were mostly explained by relevant moderating variables. For people with schizophrenia, the associations between sociodemographic variables and insight were comparable to associations with decision making capacity.
Conclusions:
Our results suggest that insight is not strongly associated with any sociodemographic variables. Further research is needed to clarify potential associations, particularly with non-white ethnicity and proxies for social support.
Keywords
Introduction
Although assessments of mental capacity (or competence) and assessments of compulsory treatment for mental disorder are a core part of a healthcare professional’s duty (Appelbaum & Grisso, 1988; Johnston & Liddle, 2007), they are inherently legal assessments (Allen, 2014). In contrast, the concept of insight is inherently clinical: it is based on a judgement made by a clinician about the patient as part of making a diagnosis and planning treatment (David, 2020).
Clinical insight may be defined as the degree of awareness a person has that they may be suffering from a biomedical condition and its effects, and the person’s willingness or ability to reflect on this (David, 1990, 2020). This concept is often influential in clinical assessment of mental capacity (Allen, 2014). For example, a recent review has found that one third of reported health and welfare cases pertaining to capacity decided by the Court of Protection in England and Wales referenced a person’s ‘lack of insight’ (Case, 2016). It is thought that insight is relevant to terms commonly used in the functional test of capacity, such as ‘appreciation’ and ‘using or weighing’ (Ruck Keene et al., 2019). There is particularly strong empirical evidence in psychosis for an association between insight and capacity to consent to treatment decisions (Owen et al., 2009; Spencer et al., 2017). ‘Lack of insight’ is also frequently used as partial justification for compulsory detention under the traditional mental health laws (Cairns et al., 2005) and is often associated with a greater likelihood of being admitted (Kelly et al., 2004; Walker et al., 2019). A better understanding of sociodemographic associations may therefore be relevant to concerns in Europe and the USA, about higher detention rates in people of African or Caribbean descent (Barnett et al., 2019; Snowden et al., 2009), and in men of all ethnic backgrounds (NHS Digital, 2020).
Owing to its multiply-determined and dynamic nature, there are several conceptual models of insight that have resulted in different measures and these must be taken into account. Five main procedures exist for operationalising or quantifying insight (Marková, 2005) (i) a clinician’s statement on a patient ‘having’ or ‘lacking’ insight in a clinical report; (ii) a clinician’s rating on a validated scale, based on a routine, structured or semi structured interview; (iii) a person’s rating on self-report instruments; (iv) the discrepancy between the individual’s own and caregiver ratings on a list of behaviours and abilities; and (v) the difference between subjective ratings and objective scores on a neuropsychological test.
Critics have suggested that insight may discriminate, because it may serve as a proxy for existing value judgements that are susceptible to biases against those with protected characteristics like age, gender, ethnicity and religion or belief (Department for Health and Social Care, 2018; Mishra et al., 2009). This is a concern, not least because judges in the courts must interpret clinical evidence from a lay perspective. Such discrimination is likely to be indirect – in other words – the application of a legally neutral concept in such a way as to produce an unjustified and adverse difference in treatment on the basis of a particular status. For example, a GP practice that requires proof of address may be found to indirectly discriminate against Gypsies and Travellers, if such rules render it more difficult for them to access their service. Likewise, if the application of the concept of insight in practice leads to indirect discrimination, then reliance upon it to justify either a finding of mental incapacity or detention under mental health legislation would be questionable.
Before we question whether insight is an indirectly discriminatory construct we must first identify where disparities exist. That is, are certain groups more likely to be judged as having poor insight? Previous attempts to address the relationship between insight and sociodemographic variables have been unsystematic and partial. A comprehensive but non-systematic narrative literature review of clinical studies 15 years ago found mixed results, with no conclusive evidence of major demographic influences on insight (Marková, 2005). Although many of the studies cited found no significant relationship between insight and sociodemographic factors, some significant relationships were reported, and the overall strength of each effect remains unquantified.
If sociodemographic factors predict insight, then this may raise concerns around discrimination. To properly address whether the application of insight is discriminatory, further contextual information would be needed. For example, increasing age is strongly associated with the incidence and severity of Alzheimer’s disease symptoms (Dukart et al., 2013; Wilson et al., 2000), but not schizophrenia symptoms (Díaz-Caneja et al., 2015). As such, illness severity may be a more plausible explanation for age disparities in insight for dementia, but not for schizophrenia. Most clinical studies do not explicitly test hypotheses based on sociodemographic factors and insight, so these contextual factors have been neglected. Indeed, it is common practice for such studies to partition out the effects of variables such as age, gender and socioeconomic status, rather than to consider them as predictors (Schandrin et al., 2019; Shaked et al., 2019). It is therefore relevant to consider not just the magnitude of any observed disparities, but also whether intermediary variables may help to explain why these exist.
Similarly, there remains a question as to whether using insight as legal evidence would lead to more discriminatory capacity assessments. One systematic review explored sociodemographic associations with capacity to consent to treatment (age, gender, ethnicity, socioeconomic status and education), which only found some evidence for more years of education predicting better capacity (Spencer et al., 2017). However, to our knowledge, no study has compared sociodemographic associations with insight and capacity within the same sample.
We sought to determine whether insight is associated with such sociodemographic variables by means of a systematic review and meta-analysis of the scientific literature. If insight is not applied in a discriminatory fashion, we would not expect to find large disparities between socio-demographic groups, or between physically disabled and non-disabled groups. Furthermore, any observed disparities would be capable of an explanation and/or justification based upon a factor relevant to that group. We hypothesised that:
(a) No sociodemographic factor will strongly predict insight across all clinical populations.
(b) If a sociodemographic factor predicts insight, a conceptually relevant variable to that factor will explain some of the variance in this relationship.
(c) No sociodemographic factor will predict insight to a significantly stronger extent than it predicts mental capacity.
Methods
Search strategy
For the present review, we developed a tailored search strategy based on relevant keywords, headings and subject headings, using six online bibliographic databases: CENTRAL, CINAHL, Cochrane Library of Systematic Reviews, EMBASE, MEDLINE, PsycINFO. Example search terms for insight included ‘clinical insight’, ‘anosognosia’, ‘awareness of deficit’ and several common insight measures. We conducted the initial search on 1st March 2019 and updated this on 2nd October 2020. Time restrictions were not set.
Selection criteria
One reviewer (K.A) led the study selection and another reviewer (G.O) conducted reliability checks for 10% of full text articles. This was done according to a prospectively published protocol (see Supplemental Appendix). We achieved a kappa statistic of 0.8, indicating very substantial inter-rater agreement (Landis & Koch, 1977).
In brief, peer-reviewed journal articles were selected if they reported (a) in English (b) using a cross-sectional or more robust design (c) a categorical or continuous measure of clinical insight (d) the results of a statistical test comparing insight and at least one socio-demographic or disability variable of interest (age, sex, ethnicity, religion, marital status, education, employment or socioeconomic status, physical health disability) and (e) the relevant analysis included at least 20 participants (or 10 per group). We retrospectively excluded samples with neurodevelopmental and rare genetic disorders, or with children samples, due to minimal results from these populations.
The initial database search produced 6,192 results, of which 1,028 potentially relevant studies were screened at full text level and 145 were deemed eligible for inclusion (see Figure 1). A forward citation and backward reference search of eligible studies was conducted using SCOPUS, which yielded a further 62 eligible studies. All 207 eligible studies were included for qualitative synthesis and 130 studies were also selected for meta-analysis, based on further eligibility criteria (see Supplemental Appendix).
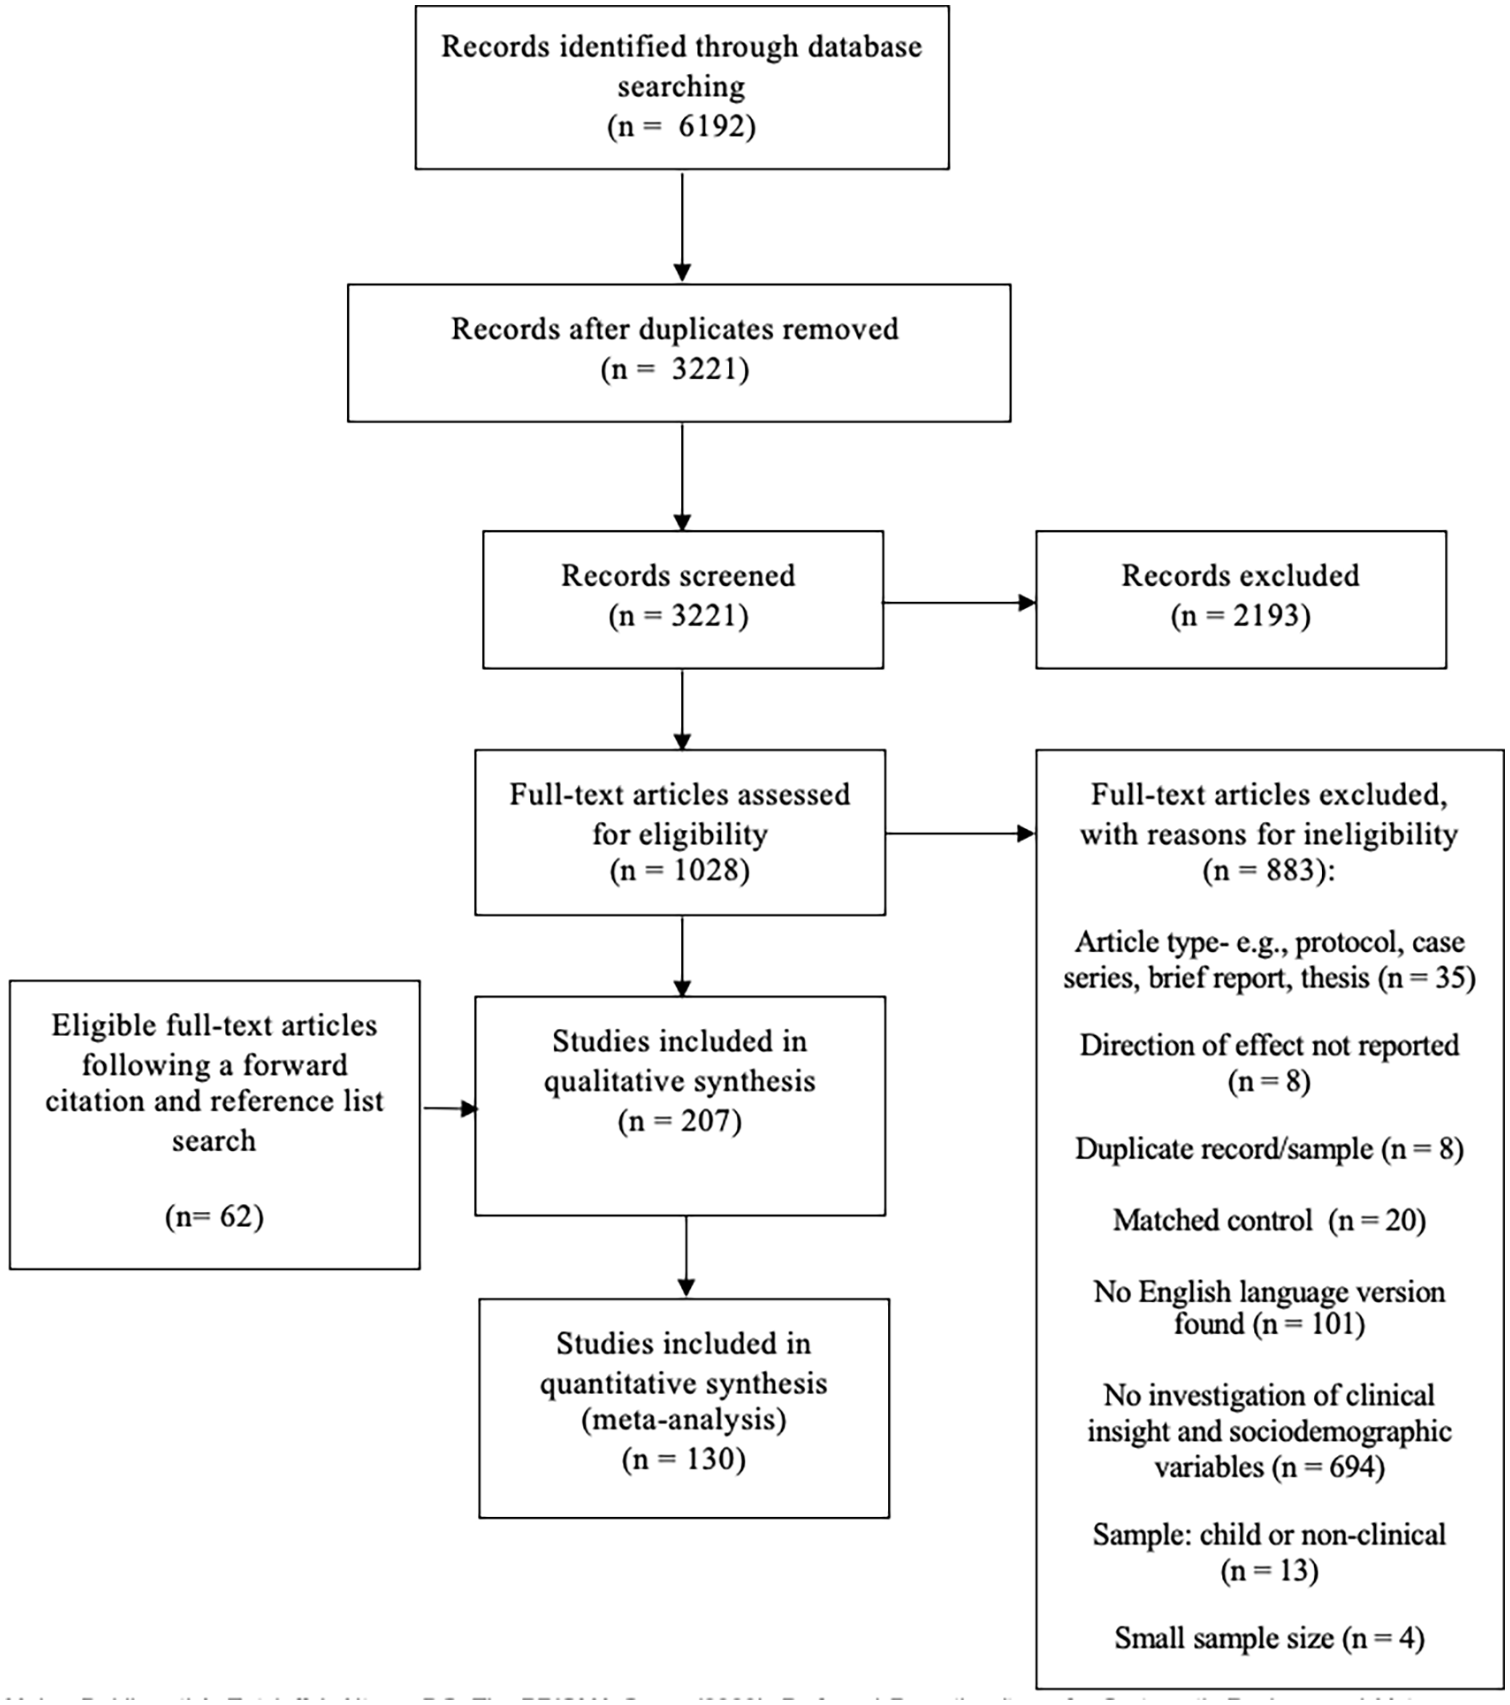
A PRISMA flow diagram outlining the study selection procedure.
We modified our protocol following its initial registration to remove social influence variables from our criteria, as scoping searches revealed this would yield few results. We also restricted our criteria to include only complete or well validated clinical insight scales, to improve specificity. Selection queries were taken to G.O in the first instance, with A.D the final arbiter if there was a disagreement.
Data extraction
One reviewer (K.A) extracted relevant data from all eligible studies, recording this on a spreadsheet. G.O independently extracted data from 10% of eligible studies, to evaluate consistency. The primary outcome of interest was the association of sociodemographic data (age, sex, ethnicity, marital status, religion, age at onset, education, employment status and socioeconomic status) with insight (measured either continuously or categorically). This was used to calculate the proportion of studies that found at least one significant association with the protected characteristic, the group rated as having significantly better insight (if any) and the method of insight assessment most often associated with these changes. In the event of duplicate datasets, in the first instance we prioritised the article that reported the most detailed statistical test. Alternatively, we excluded the most recently published article. For ethnicity, we considered either white versus non-white where possible, or alternatively white versus the most populous non-white group. We also extracted potentially relevant moderator variables (see below).
Data analysis
A random effects meta-analysis was conducted using R Statistics. We used the Restricted Maximum Likelihood (REML) method and effect sizes were weighted by inverse sampling variance. We calculated Cohen’s d when insight was measured as a continuous variable, using established conversion metrics (see Supplemental Appendix for overview).
We calculated Odds Ratios (ORs) where insight was measured as a binary judgement, although artificially dichotomised sociodemographic variables (age, education, etc.) were excluded. For samples in which two or more different insight measures were reported, we calculated a single mean effect size to adhere to the independence assumption. For eligible studies that did not report sufficient information, only adjusted effect sizes were included in the qualitative synthesis only. Each study required a minimum of 20 participants for inclusion into the meta-synthesis and at least ten participants from each group to provide a minimum degree of statistical power.
Then, as pre-specified in our protocol, we selected relevant variables for moderator and subgroup analyses. We considered, for example, whether associations may vary between people with psychiatric (schizophrenia, depression, bipolar disorder or obsessive-compulsive disorder) or neurological diagnoses (dementia, stroke, brain injury or mild cognitive impairment). We also contrasted different types of insight scales, including self-report scales, clinical judgement scales and dual-rater discrepancy scales.
Finally, we conducted sensitivity analyses to assess risk of bias, including heterogeneity (I2 statistic), influential cases, publication bias and analytic decisions. Our criteria for heterogeneity and influential cases were based on I2 statistic (50%–75% = moderate, >75% = substantial) (Higgins et al., 2003) and Cook’s distance (d < 4/k = outlier) (Cohen et al., 2014). We calculated leave-one-out diagnostics for each influential case and decided whether to retain or exclude these on a case-by-case basis. For funnel plots, we judged potentially for funnel plot asymmetry by observation and using Egger’s regression test (Sterne et al., 2011). Full details for analytic decisions are available in the Supplemental Appendix.
Results
Characteristics of included studies
A final 207 studies were eligible for inclusion. Seventy-five studies were included in the meta-analysis where insight was expressed as a continuous variable (see Table 1), and 56 studies were included in meta-analysis when insight was expressed as a categorical variable (see Table 2). Three hundred one effect sizes were derived from these studies (See Supplemental Appendix for an overview). An estimated 16,522 (M = 79.82) participants were included in the meta-analysis, with 1,432 participants in the largest independent sample. In addition, 77 studies were retained for qualitative synthesis only.
The association of sociodemographic factors with insight when measured as a continuous variable.
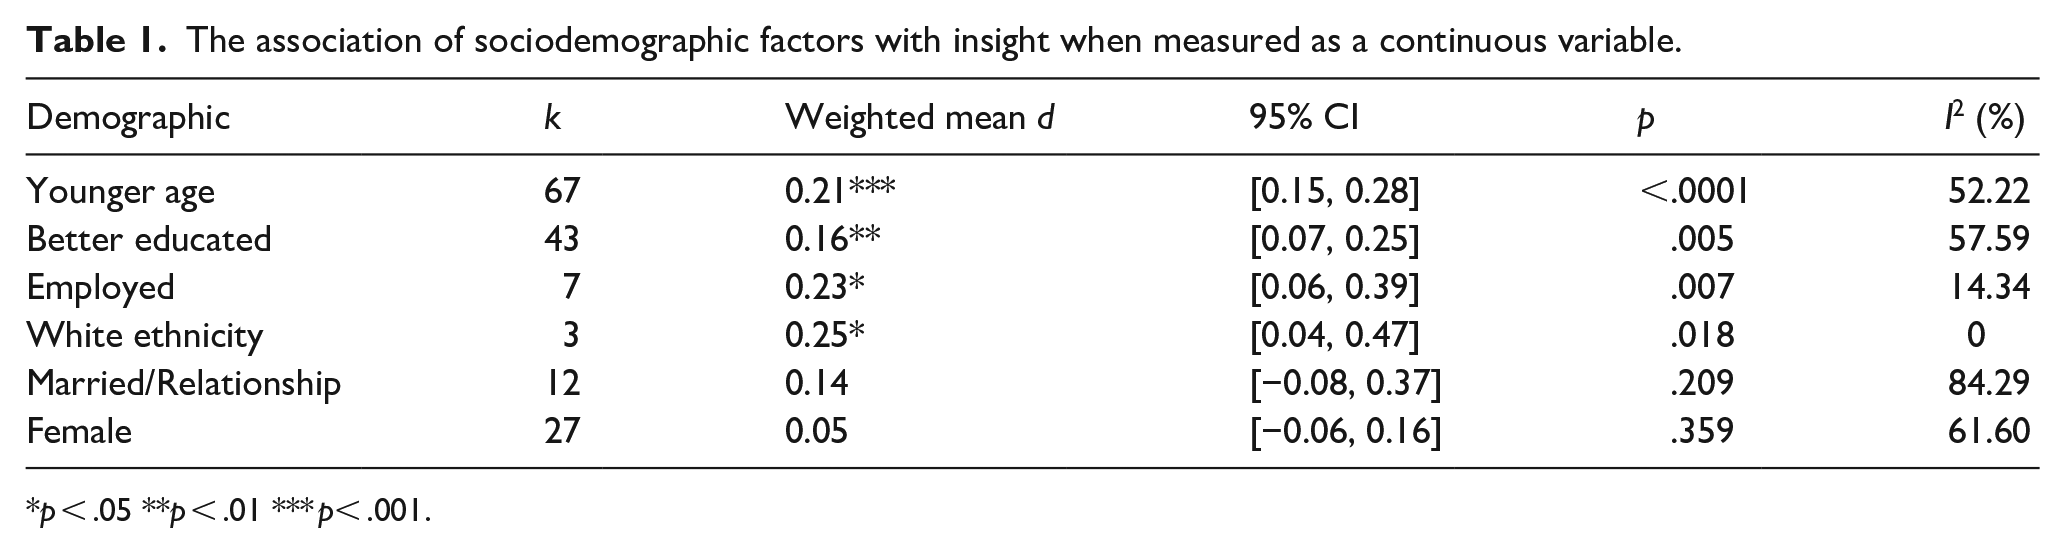
p < .05 **p < .01 *** p< .001.
The odds associated with better insight when measured as a dichotomous variable.
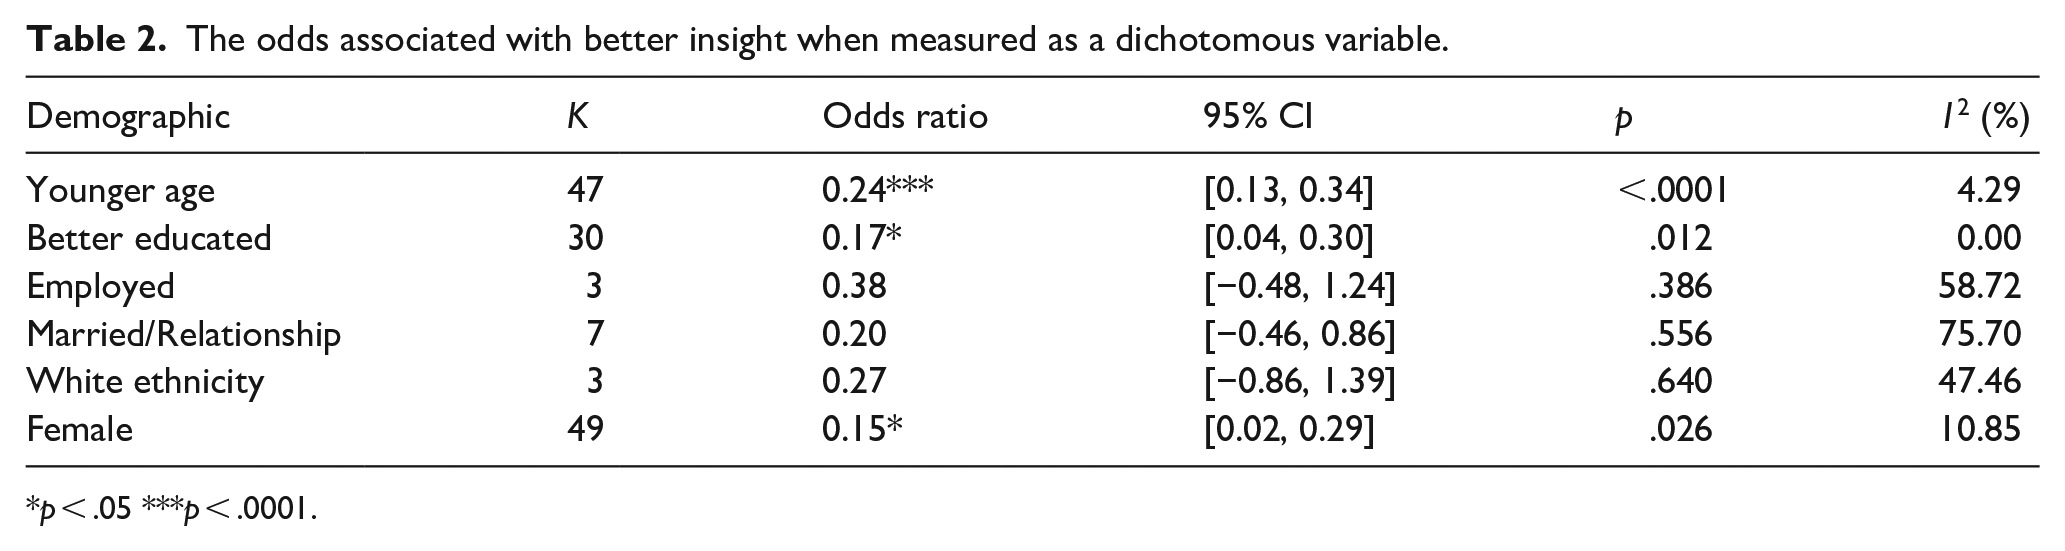
p < .05 ***p < .0001.
We adopted a modified version of Cohen’s criteria to interpret effect sizes (no effect = below 0.1, small effect = 0.1–0.3, moderate effect = 0.3–0.5, large effect = 0.5 or above), in line with similar research (Spencer et al., 2017). Just over half of the reported effect sizes suggested either small or zero association between sociodemographic characteristics and insight (See Supplemental Appendix). We were unable to find sufficient samples for many of the sociodemographic variable of interest (religion or belief, sexual orientation, pregnancy and maternity and gender reassignment).
For a full overview of included studies, analytical decisions and sensitivity analyses, see the Supplemental Appendix. Two effect sizes were excluded as outliers from each meta-analysis (Ampalam et al., 2012; De Carolis et al., 2015). Heterogeneity was low-to-moderate for each variable (other than for marital status, which was high) and there was little evidence of publication bias. One study contributed 49.22% of the sample for the marital status analysis (k = 12), but there was no evidence that this study was particularly influential (Mohamed et al., 2009).
Sociodemographic predictors of insight
When expressed as a continuous variable, white ethnicity (d = 0.25), being employed (d = 0.23), younger age (d = 0.21) and more years of education (d = 0.16) significantly predicted poorer insight to a weak degree. We found no evidence of marital status (d = 0.14) or sex (d = 0.05) predicting insight. According to our effect size criteria, these sociodemographic variables seem to contribute to a small proportion of the variance in insight across populations.
When expressed as a dichotomous variable, people were more likely to be judged as having good insight if they were younger (OR = 0.24, p < .0001) and had more years of education (OR = 0.17, p < .05). This is similar to the analysis for continuous variables (see Table 1). Females were also more likely to be judged as having good insight (OR = 0.15, p < .05), although this result may have been affected by influential cases (see below). The effects sizes were all small. No other odds ratio reached statistical significance, possibly due to the low sample sizes.
Moderation and subgroup analyses
We found some evidence that these effects may be context specific, when insight was measured as a continuous variable. The association of age with insight was significantly moderated by the type of diagnosis – that is, whether it was a psychiatric or neurological population (p < .001). Subgroup analyses revealed that older age was moderately associated with poor insight in neurological populations (d = 0.31, p < .0001) (see Figure 2). Conversely, the association between younger age and good insight was far weaker in psychiatric samples (d = 0.12, p < 0.05).
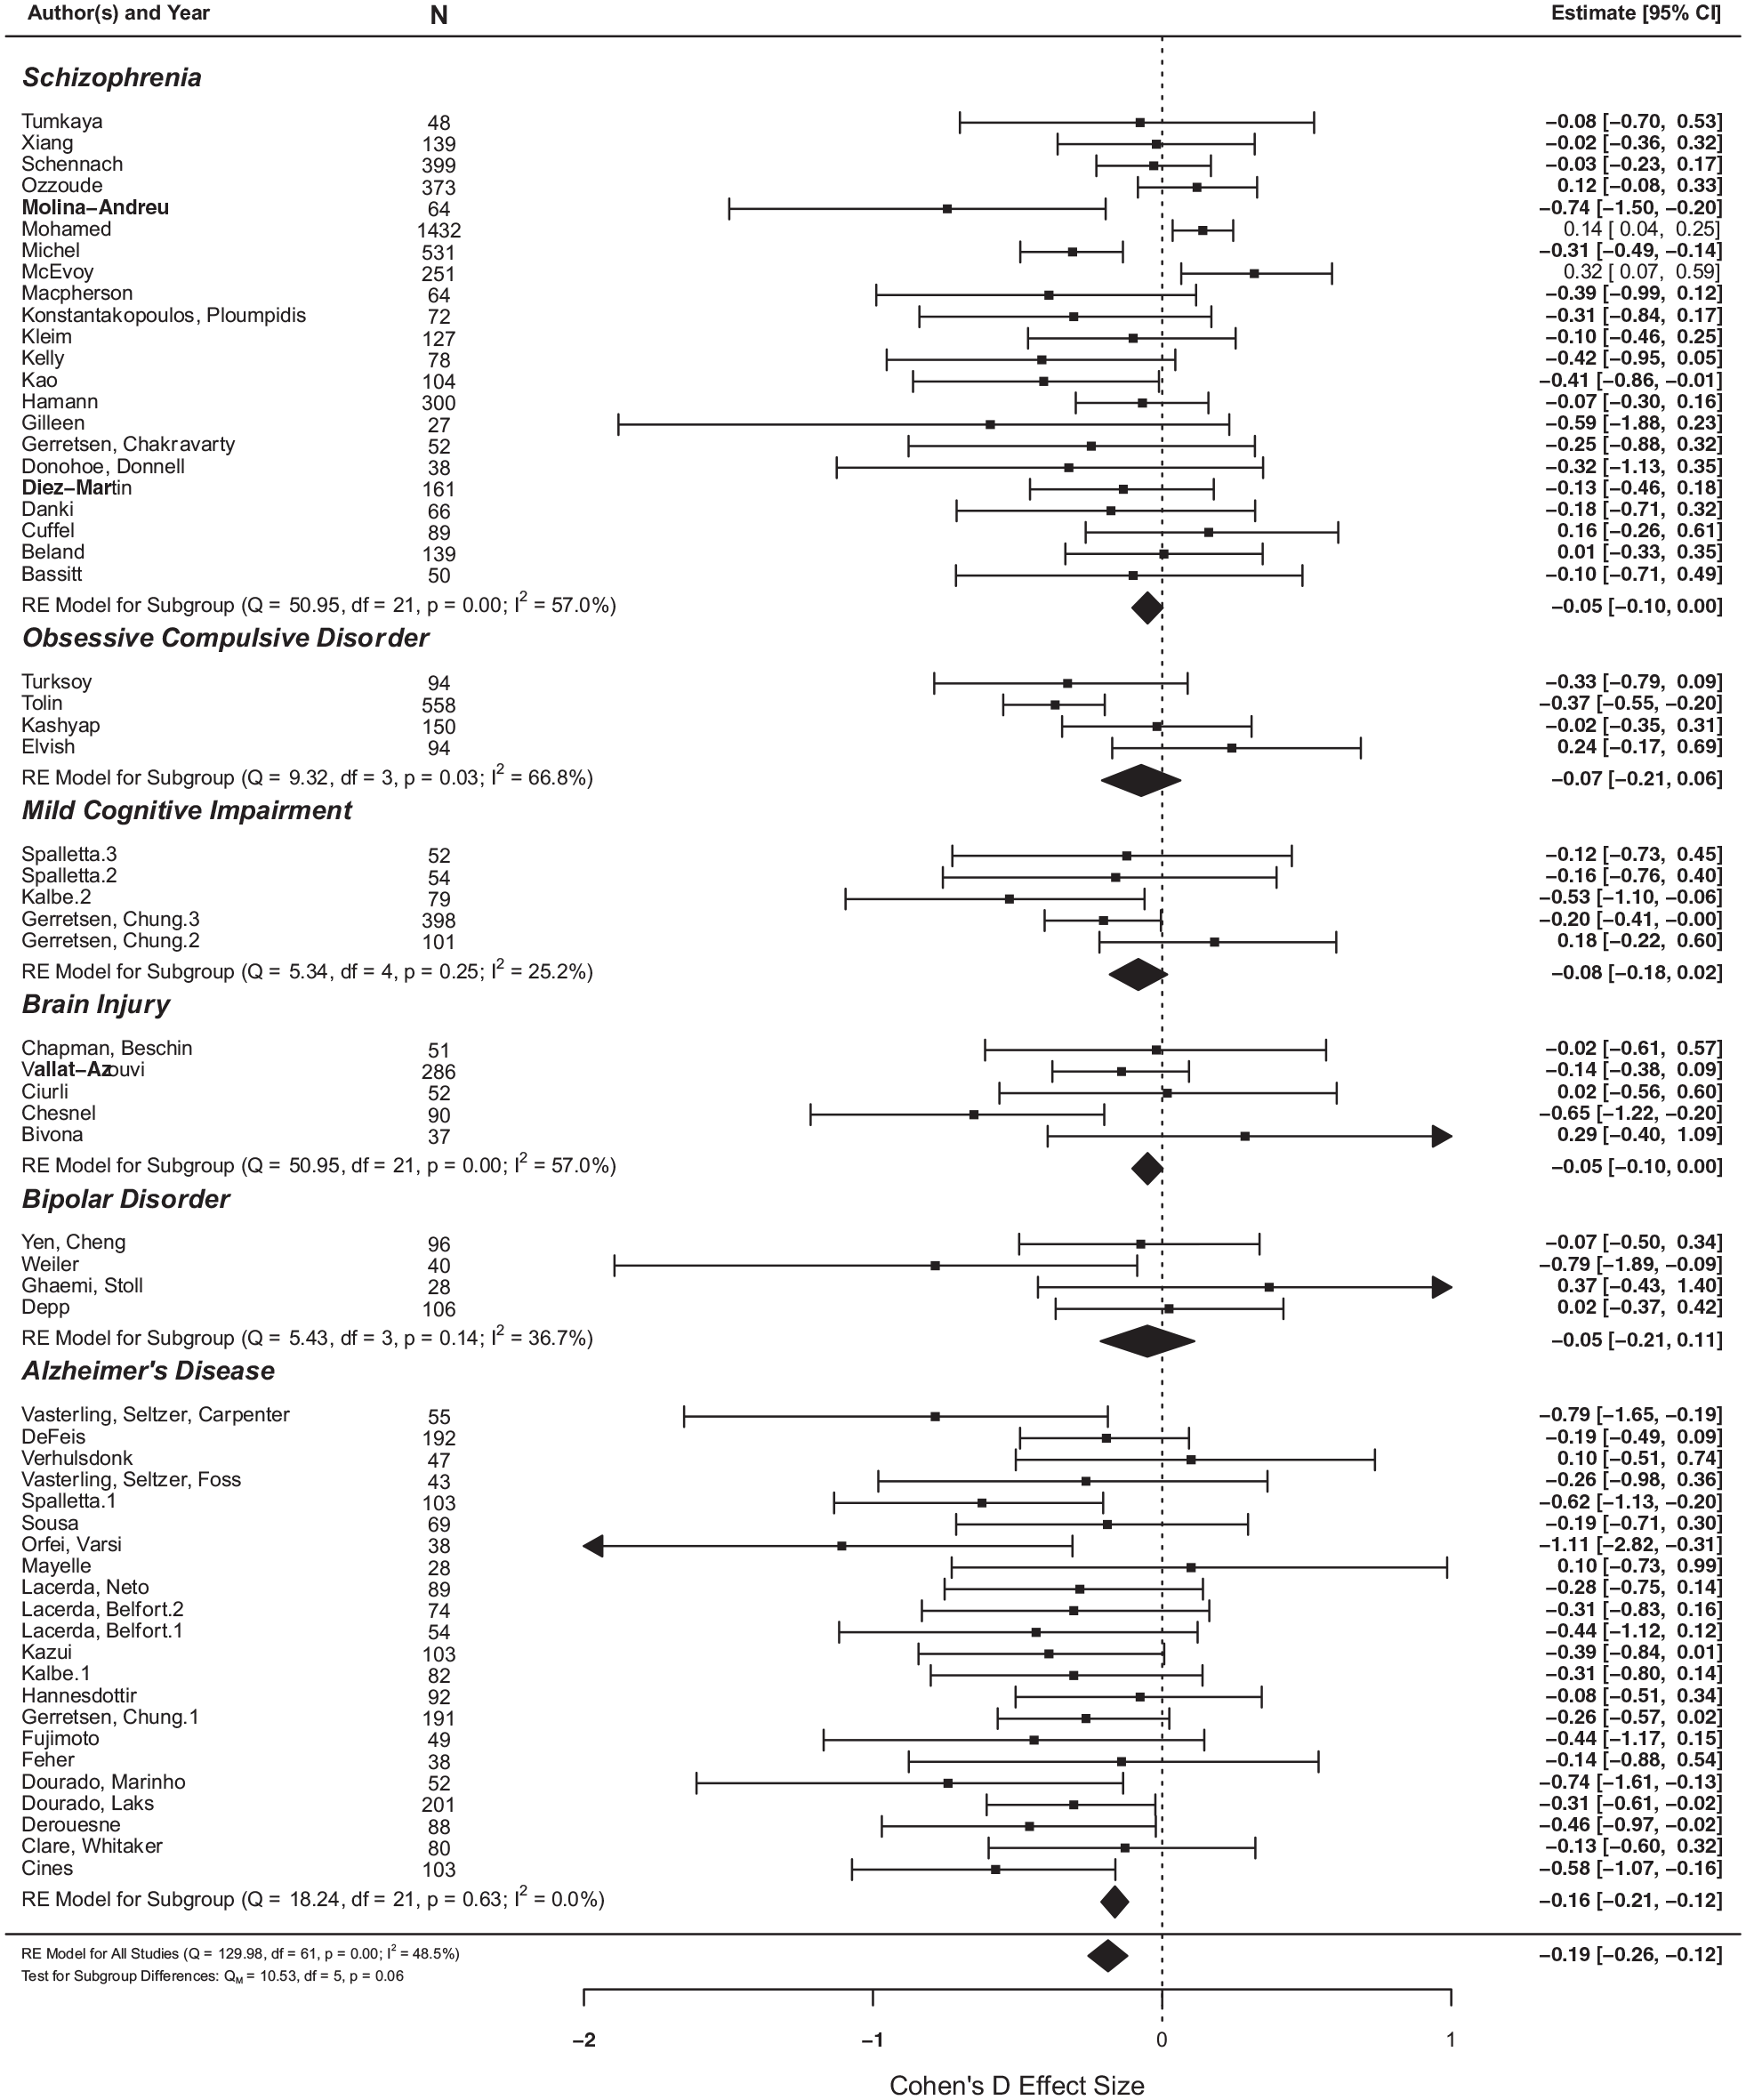
The effect of age on insight, between different diagnostic groups.
The association of age with insight was also (marginally) significantly moderated by the type of insight scale used (p = .057). Older age significantly associated with poor insight when discrepancy scales (d = 0.16, p < .05) and clinician-rated scales were used (d = 0.16, p < 0.05) but not for clinical self-report scales (see Figure 3).
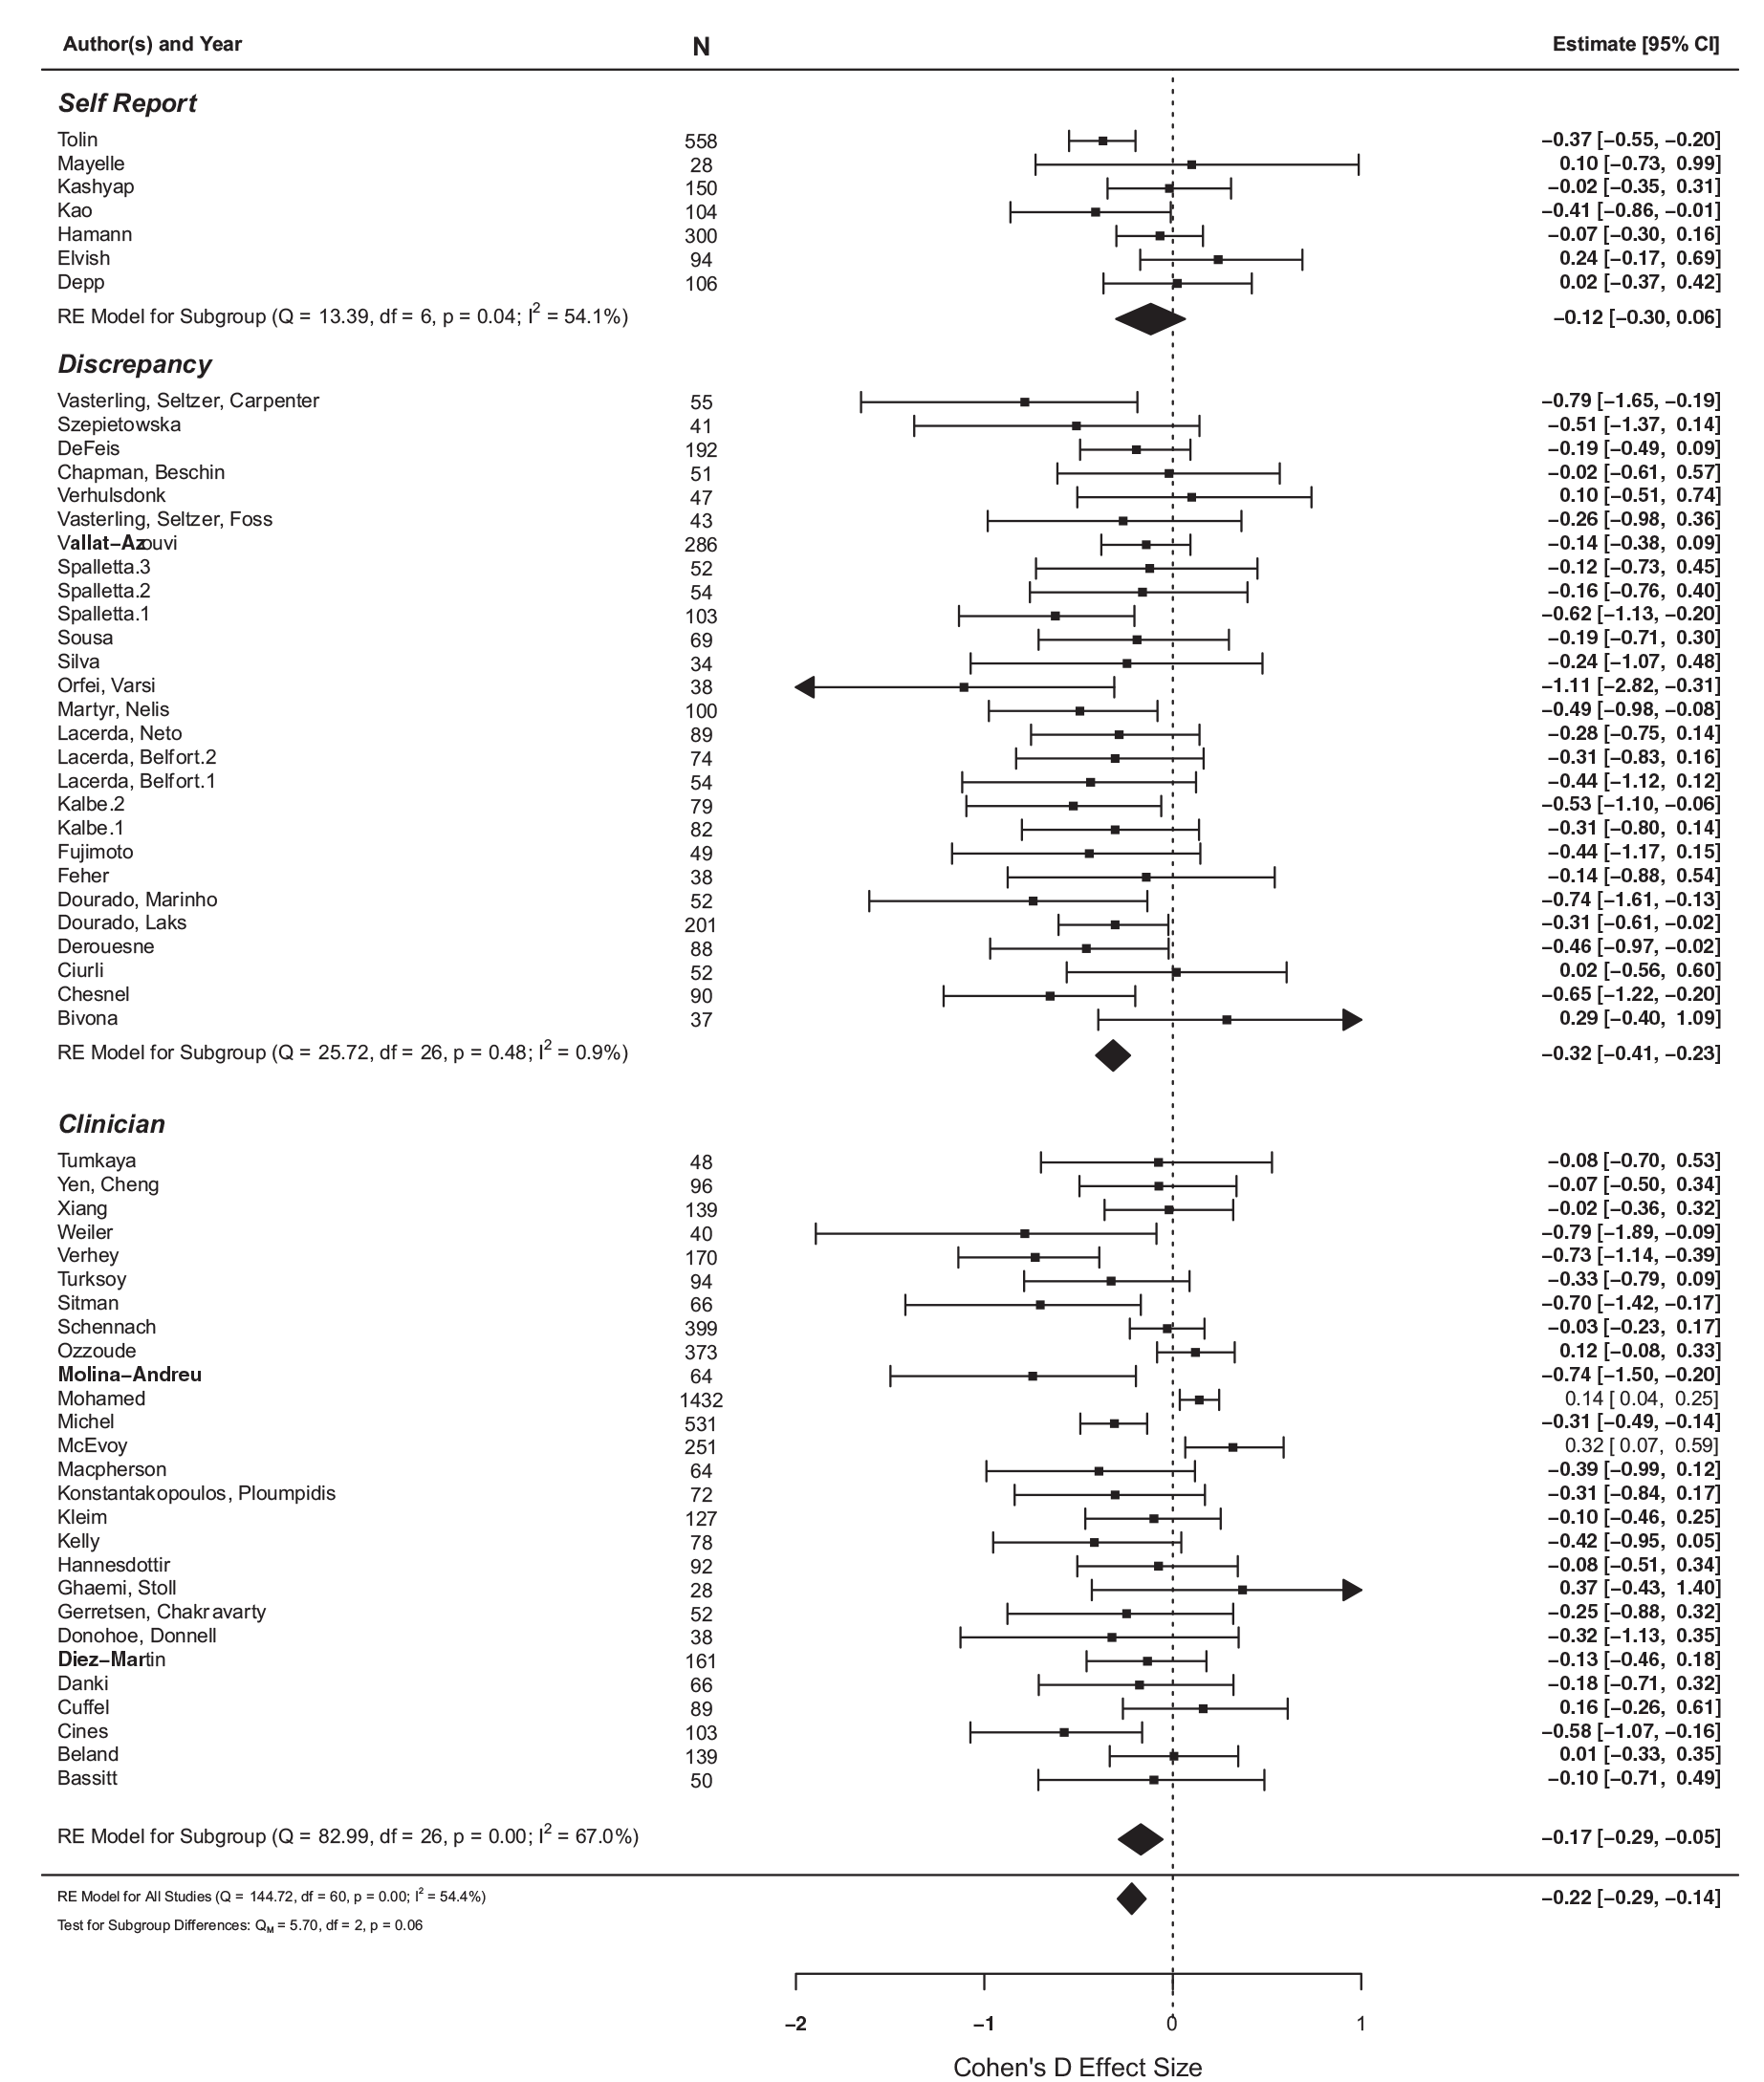
The effect of age on insight between different types of measurement scales.
These subgroup analyses are reported in more detail in the Supplemental Appendix.
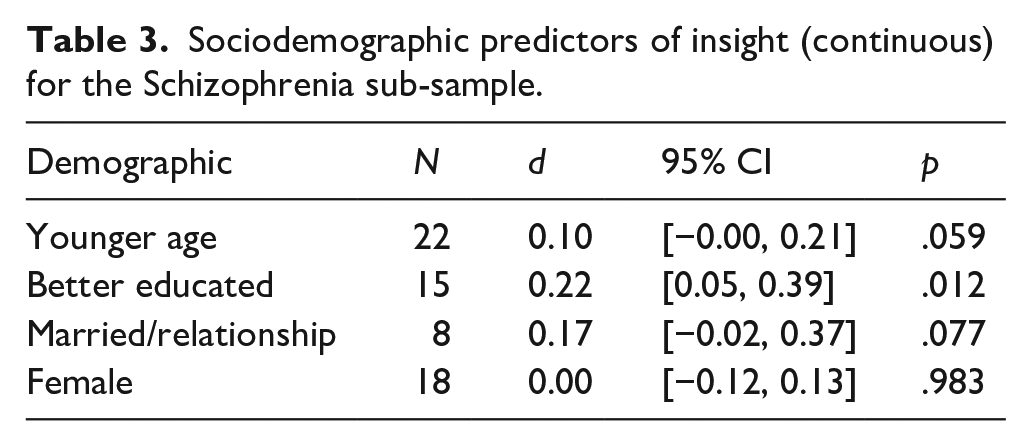
As shown in Table 3, we also conducted a subgroup analysis of schizophrenia samples, in order to test our third hypothesis comparing insight (as a continuous measure) with mental capacity. We observed a stronger effect of more years of education (k = 15, d = 0.22, CI [0.05, 0.39]) predicting better insight. However, this effect was not significantly greater than in the non-schizophrenia samples (k = 28, d = 0.12, CI [0.02, 0.23). We found no evidence for age, marital status or sex predicting insight in Schizophrenia samples (all p < .05.) and we did not have sufficient data to include employment or ethnicity in this analysis. These results are broadly similar to associations found with mental capacity.
Sociodemographic predictors of insight (continuous) for the Schizophrenia sub-sample.
Qualitative synthesis
We undertook a qualitative synthesis of studies included in the meta-analysis (n = 130), as well as studies that fit our eligibility criteria, which could not be meta-analysed (n = 77). We provide a full overview of these studies in the Supplemental Appendix.
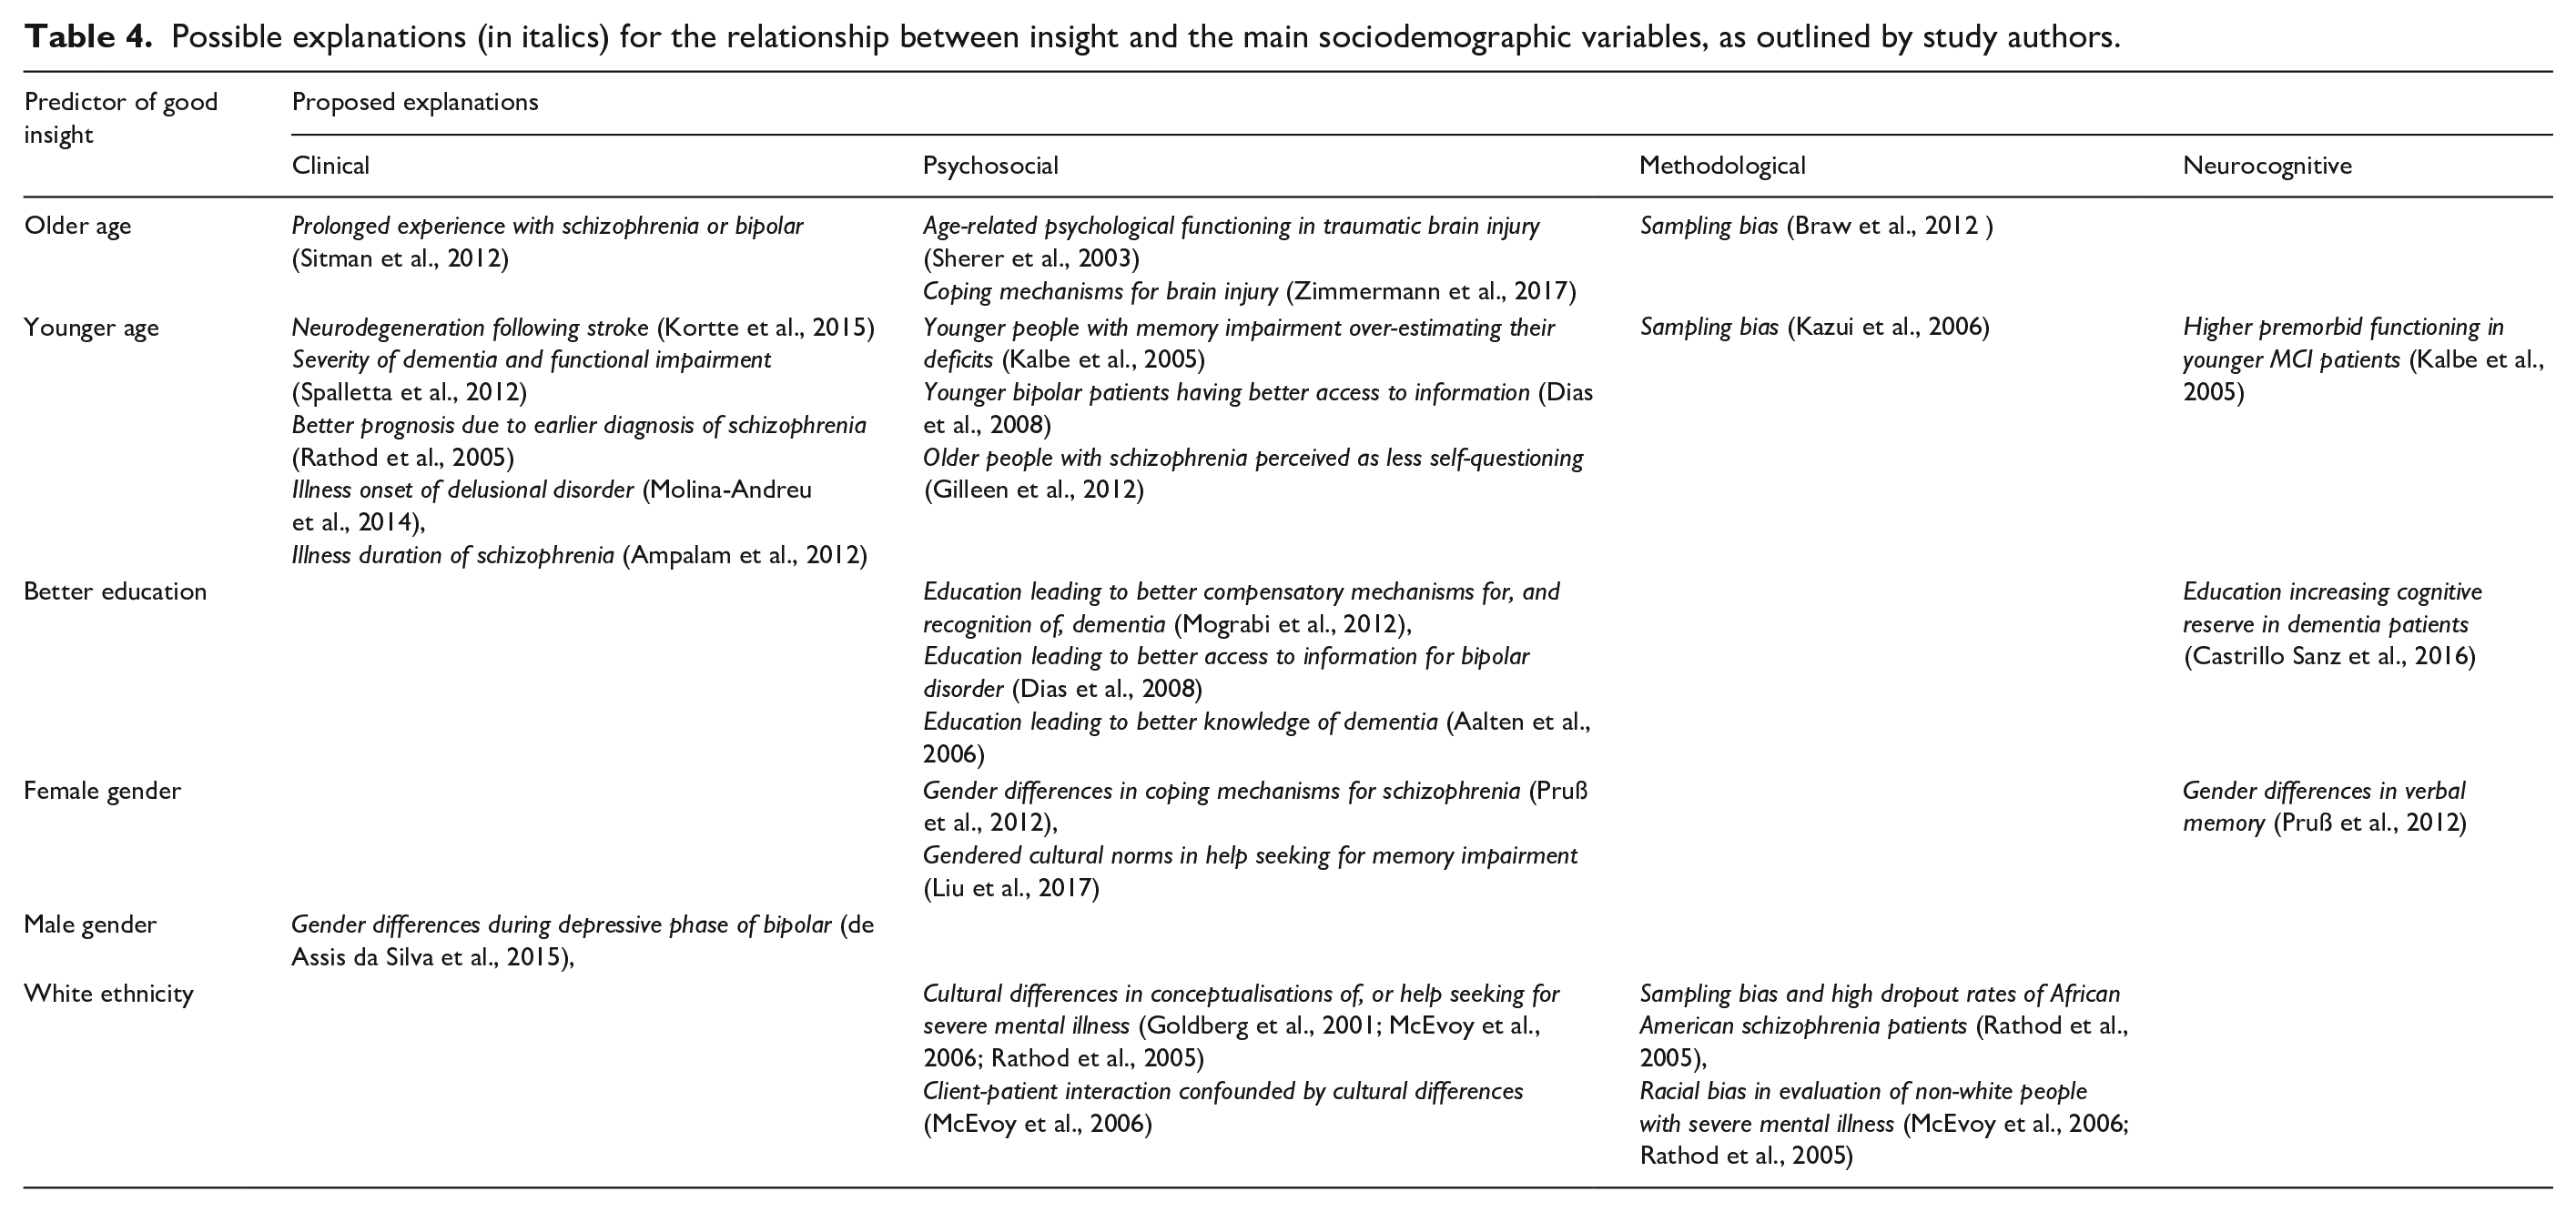
We also explored possible explanations for relationships between insight and the sociodemographic factors included in the meta-analysis. Only a minority of authors proposed an explanation in their manuscript for a significant result. Most of these explanations were psychosocial, for example, relating to access to information, coping mechanisms, behavioural norms and cultural constructions of illness. Some clinical, methodological and neurocognitive explanations were also proposed. See Table 4 for more information.
Possible explanations (in italics) for the relationship between insight and the main sociodemographic variables, as outlined by study authors.
In addition, some sociodemographic variables were only assessed in the qualitative synthesis studies. These included socioeconomic status (n = 8), urban status (n = 4), migration status (n = 3) and body mass index (BMI) (n = 2) and religion (n = 2).
Two Indian studies of psychosis patients found that people from urban areas had significantly better insight than people in rural areas (both p < .005) (Ampalam et al., 2012; Garg et al., 2018). The latter suggested that this was due to variations in cultural beliefs surrounding illness, although this was only supported with secondary evidence. However, a further two studies, of psychiatric inpatients in China (Fu et al., 2017) and OCD patients in India (Ravi Kishore et al., 2004), found no significant differences in insight between urban and rural populations.
Two studies also found that higher socioeconomic status predicted better insight in psychosis samples (Aalten et al., 2006; David et al., 1995). Each of these effects were relatively strong (p < .01.). However, the remaining six studies did not find a significant relationship between socioeconomic measures and insight. These included two dementia (Martyr et al., 2012; Mograbi et al., 2012) and four psychosis samples (Fennig et al., 1996; Garg et al., 2018; Heinrichs et al., 1985; Moore et al., 1999).
The remaining sociodemographic variables were less common. Three studies investigated migration status in psychosis samples, with only finding migrants to have better insight (Berg et al., 2018) and two finding no significant relationship (A. David et al., 1995; Klaas et al., 2017). One positive relationship was found between BMI and insight in a bipolar disorder sample (Welten et al., 2016) but not in an eating disorder sample (Arbel et al., 2013). Finally, two studies found no significant association between insight and religion, within in sample of patients with alcohol use disorder (Kim et al., 2007) and social anxiety disorder (Vigne et al., 2014).
Discussion
The present review and meta-analysis largely corroborate previous findings from non-systematic research (Marková, 2005). That is, more often than not, empirical studies find no association between insight and major socio-demographic variables. In order of strength, we found weak but significant effects for white ethnicity, being employed, younger age and better education predicting better insight scores (all effect sizes < 0.3). When we had sufficient statistical power, we found similar results when insight was measured as a binary clinical judgement as when measured as a dimension although the association with insight and ethnicity and insight and employment went away when binary judgement was used. These findings suggest that none of the protected characteristics relevant to equality legislation that we were able to analyse is strongly associated with insight.
The only moderate association was found within a subgroup of patients and this was explained by conceptually relevant variables. Older age only significantly predicted poorer insight in neurological samples, with a moderately strong effect size (d = 0.31) (Chesnel et al., 2018; Dourado et al., 2019; Lacerda et al., 2020; Mayelle et al., 2019; Ozzoude et al., 2019). To our knowledge, this is the first empirical analysis to investigate this. The relationship between age and insight is usually attributed to dementia severity and age-related cognitive decline (McDaniel et al., 1995; Ott & Fogel, 1992). This may explain why the age effect was mostly found in discrepancy scales, which are predominantly used for people with neurological conditions. Neurodegeneration would therefore seem a plausible explanation for these age-related disparities.
Some studies found positive associations of continuous measures of insight with white ethnicity and being employed, in samples of patients with severe mental illnesses. These could not be explained by conceptually relevant variables in the present study. This is partly because the number of samples was relatively low, therefore it was difficult to detect variations in a relatively small and homogenous effect. It is plausible that people with poor insight in the employment studies, who had schizophrenia, bipolar disorder or OCD, may have had greater functional impairment (Lysaker et al., 1998; Poon et al., 2010; Schennach et al., 2012). On average, these conditions have a relatively young onset age (Solmi et al., 2021), which could potentially affect longer-term education and career prospects, especially without measures to compensate for any disruptions.
In the studies that found greater insight in white patients, the only explanation that was supported by primary evidence was for sampling bias, as a result of higher dropout rates in African American schizophrenia patients (Rathod et al., 2005). As a result, we cannot conclude from the current literature whether the association between insight scales and ethnicity is explained. Other possible explanations, such as racial bias in assessment (Goldberg et al., 2001; Rathod et al., 2005) and cultural differences in illness conceptualisation (McEvoy et al., 2006), or help-seeking (Rathod et al., 2005), merit further investigation.
Both our moderator analysis and qualitative synthesis indicate the potential for contextual effects. In order to understand fully whether insight is discriminatory it will be necessary to investigate these associations further. This requires the acquisition of more data on protected characteristics and more qualitative studies to get inside contextual effects. Most of the studies reviewed contained no explanation for any observed disparity. In fact, the most common explanations were primarily psychosocial, relating to social norms (Liu et al., 2017; Pruß et al., 2012), socioeconomic privileges (Dias et al., 2008; Mograbi et al., 2012), cultural bias (Rathod et al., 2005) amongst other factors. These psychosocial explanations should be explored further, and may be considered especially relevant when informant reports are used to provide a discrepancy rating of insight.
Finally, we compared our findings to a systematic review of decision-making capacity (DMC) for people with schizophrenia (Spencer et al., 2017). Similar to the results presented here, that review found almost no evidence of age and sex predicting DMC, and some weak evidence of positive associations with white ethnicity and more years of education. This would suggest that insight is no more discriminatory than capacity on these variables. It should be noted that our study of insight and (Spencer et al., 2017) did not measure use of compulsory treatment for mental disorder where assessments involve the concept of risk rather than just insight or mental capacity.
Strengths
This is the first meta-analysis and meta-synthesis, to our knowledge, to address the question of whether insight assessments are potentially discriminatory. This directly addresses a recommendation made by the UK government’s recent Independent Review of the Mental Health Act (1983) (Department for Health and Social Care, 2018) but is by no means of UK relevance only. We believe the present review to be the most comprehensive of sociodemographic predictors of insight to date. Meta-analytic methods are frequently applied to neurocognitive associations of insight; however, the present paper is novel in that it extends this approach to social variables. Our mixed methods approach has also enabled us to investigate the issue from different perspectives and the results were mostly consistent. Our moderator analysis was able to shed light on these associations in greater detail, where they may otherwise have been overlooked, while our qualitative analysis also benefits from the additional studies that could not be included in the meta synthesis. Finally, we found no indication that our meta-analysis was biased towards significant effects.
Limitations
Although we sought to evaluate a range of associations, few studies reported on physical health disabilities, and most of the protected characteristics under the Equality Act (2010) were rarely measured (religion or belief, sexual orientation, pregnancy and maternity and gender reassignment). We also note that the General Comment 1 from the Committee on the Rights of Persons with Disabilities considers that the very concept of DMC is discriminatory (Committee on the Rights of Persons with Disabilities, 2018), which would mean that any reliance on a concept such as insight which would underpin a finding of a lack of DMC would, equally, and by definition, be discriminatory on the basis of disability. Even without taking this radical interpretative step, it is crucial to keep the possibility of discrimination in such an ethically important area under continuing review. Furthermore, this study is limited to measures of insight in research studies rather than use of insight in practice. A recent review in England’s Court of Protection, building on previous work (Case, 2016), found that insight measures have not been mentioned as evidence in any published legal case (Gurbai et al., 2020).
We were often limited to post-hoc examinations, because sociodemographic factors were rarely a focus of individual studies. For this reason, we were relatively inclusive in our sampling criteria. This potentially increased the risk of bias but also enabled us to test for moderators. Despite this, heterogeneity was mostly kept to moderate levels.
Conclusion
Our study demonstrates that none of the included sociodemographic variables relevant to equality legislation were strongly associated with insight across all populations. These results should give some reassurance that insight does not indirectly discriminate in important ethical and legal assessments like mental capacity, but only if used as intended. We raise some possible concern for people from black and minority ethnic backgrounds or who are either unemployed or have received less education. These subgroups were somewhat more likely to have ratings of poor insight, which could place them at increased risk of indirect discrimination. Future research should explore disparities in groups that have been poorly represented in empirical and qualitative research on insight.
Supplemental Material
sj-pdf-1-isp-10.1177_00207640211036174 – Supplemental material for Insight and equality: A systematic review and meta-analysis of socio-demographic associations
Supplemental material, sj-pdf-1-isp-10.1177_00207640211036174 for Insight and equality: A systematic review and meta-analysis of socio-demographic associations by Kevin Ariyo, Alex Ruck Keene, Anthony S David and Gareth S Owen in International Journal of Social Psychiatry
Supplemental Material
sj-pdf-2-isp-10.1177_00207640211036174 – Supplemental material for Insight and equality: A systematic review and meta-analysis of socio-demographic associations
Supplemental material, sj-pdf-2-isp-10.1177_00207640211036174 for Insight and equality: A systematic review and meta-analysis of socio-demographic associations by Kevin Ariyo, Alex Ruck Keene, Anthony S David and Gareth S Owen in International Journal of Social Psychiatry
Footnotes
Author contributions
K.A. led at each stage of the project, including drafting the document. G.O. was primary supervisor on the project and made substantial contributions in all aspects of the study. A.D and A.R.K also supervised the project throughout and made substantial contributions to the conception of the study, the interpretation of the results and critical revisions. All listed authors have approved for the work to be published and fully meet the ICMJE criteria for authorship. The authors agree to be accountable for the contents of the paper and are jointly responsible for ensuring that all queries related to the accuracy or integrity of the work are investigated and resolved.
Availability of data and materials
The datasets generated and analysed during the current study are included in this published article and its supplementary information files. Any data queries may also be directed to the corresponding author on reasonable request.
Conflict of interest
The author(s) declared no potential conflicts of interest with respect to the research, authorship, and/or publication of this article.
Funding
The author(s) disclosed receipt of the following financial support for the research, authorship, and/or publication of this article: This research was funded in whole by the Wellcome Trust [203376/2/16/Z]. For the purpose of open access, the author has applied a CC BY public copyright licence to any Author Accepted Manuscript version arising from this submission. The funding body had no role in the design of the study, the collection, analysis and interpretation of the data or in writing the manuscript.
Supplemental material
Supplemental material for this article is available online.
References
Supplementary Material
Please find the following supplemental material available below.
For Open Access articles published under a Creative Commons License, all supplemental material carries the same license as the article it is associated with.
For non-Open Access articles published, all supplemental material carries a non-exclusive license, and permission requests for re-use of supplemental material or any part of supplemental material shall be sent directly to the copyright owner as specified in the copyright notice associated with the article.