
Abstract
Abstract
Microwave engineering is a technology-based course. Students can easily score high assessments in this course, because more of the engineering students are interested in this kind of application-oriented course. Normally, the achievement of students in this course is evaluated based on their summative assessment. Hence, the score of evaluation which obtained by the students in this course oftentimes does not match with the actual quality of the students, especially regarding their practical skill. In this paper, several simple practical assignments were proposed for undergraduate students to complete their assessment in microwave engineering course.
Introduction
Microwave engineering (ME) is a course that combines the concepts of electromagnetic and circuit, which emphasizes the application of the latest microwave technology. The aim of this course is to train future professional engineers to gain the practical skills, such as radio frequency (RF) integrated circuits design and analysis, as well as microwave instrument operation.1–3 Recently, most of the high-speed circuits, sensory device, and high-frequency electronic components involve the operation frequency up to few Giga-Hertz. 4 Indirectly, this course has become popular and necessary nowadays, especially for undergraduate students in communication engineering. Now, the question is whether students are able to gain the abovementioned skills after the enrollment of ME course? Or perhaps students merely memorized the contents of textbook in order to face the exam? Thus, the formative assessment is strongly requisite to complete the evaluation of students’ achievement for this course. 5
Previously, most of the universities seldom practice formative assessment for students who enrolled in ME course. It is due to the cost of RF instrument and laboratory maintenance which appear to be relatively high. Nevertheless, the prices for particular new PC-based RF devices are quite affordable nowadays due to the increasing common use of RF technology. This advantage can reduce the burden of the university on purchasing the microwave lab equipment. Furthermore, for undergraduate level, the introduction of RF technology with operating frequency up to 3 GHz is adequate for students. In this paper, up to five practical assignments of ME course are proposed for formative assessment purpose. The assessments are capable of ensuring each student will be given an opportunity to access to the application and operation of the microwave technology. The purpose of this work is to propose the teaching and learning methodology for the ME subject comprehensively. For instance, undergraduate students can at least identify the shape and size of SubMiniature version A (SMA) and type Navy (N-type) connectors as well as understand the standard 50 Ω impedance for those connectors. Such knowledge is less taught in the previous teaching and learning process (Only focus on ME text book content). On the other hand, such skills and knowledge are important for graduate engineers who are working in RF and communication sector.
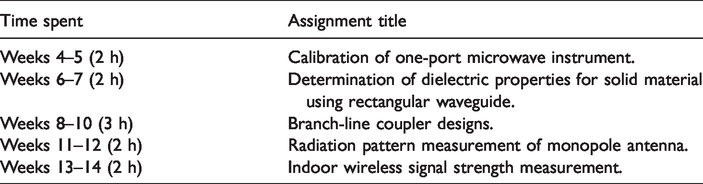
The titles of the assignment are listed in Table 1, which are also designed to cover the microwave instrument operational skills, applications, circuit designs and measurement techniques. The assignment is suggested to be done by students starting in the fourth week of tutorial class hour. Assignment sheets will be distributed to each group (3 – 5 students) at the beginning of the week. The assignment includes study objectives, related theory, and work procedure.
Proposed assignments.
Assignments for formative assessment
Calibration of one-port microwave instrument
This assignment allows the students to practice one-port calibration for vector microwave instrument (vector network analyzer) using three kinds of terminator as shown in Figure 1. The measured reflection coefficient, |Γ|, or input impedance properties for transmission line terminated by different loads can be observed and compared with ideal values. In addition, students will be able to experience the importance and usefulness of the S-parameter and scattering matrix. In this assignment, a monopole antenna is tested. Figure 2 shows one of the submitted reflection measurement results (in unit dB) of the monopole antenna for the case of before and after the port-1 is calibrated. Thus, students themselves can see that the measured |Γ| which have been through the calibration process is able to provide an accurate and stable measurement result over the frequency range of 2 GHz to 3 GHz.
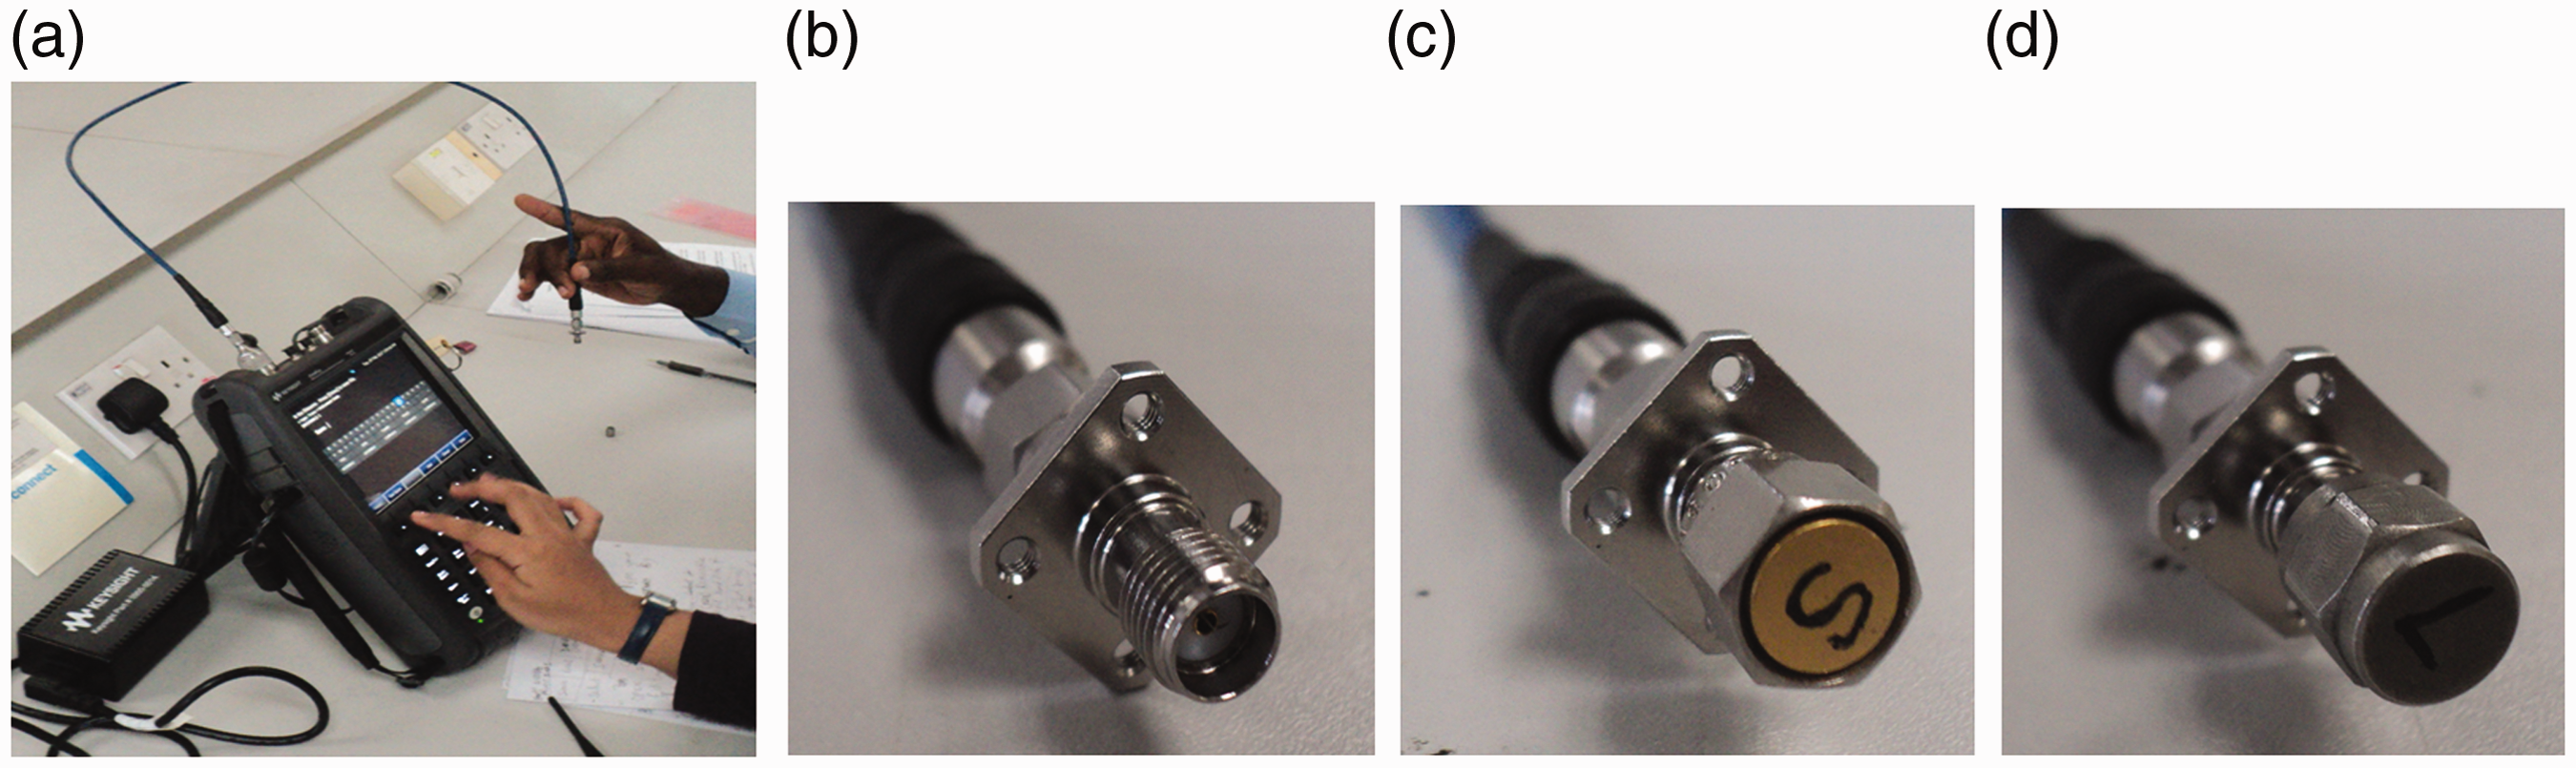
(a) Port-1 of network analyzer is terminated with (b) open circuit, (c) short circuit, and (d) 50 Ω match load, respectively.
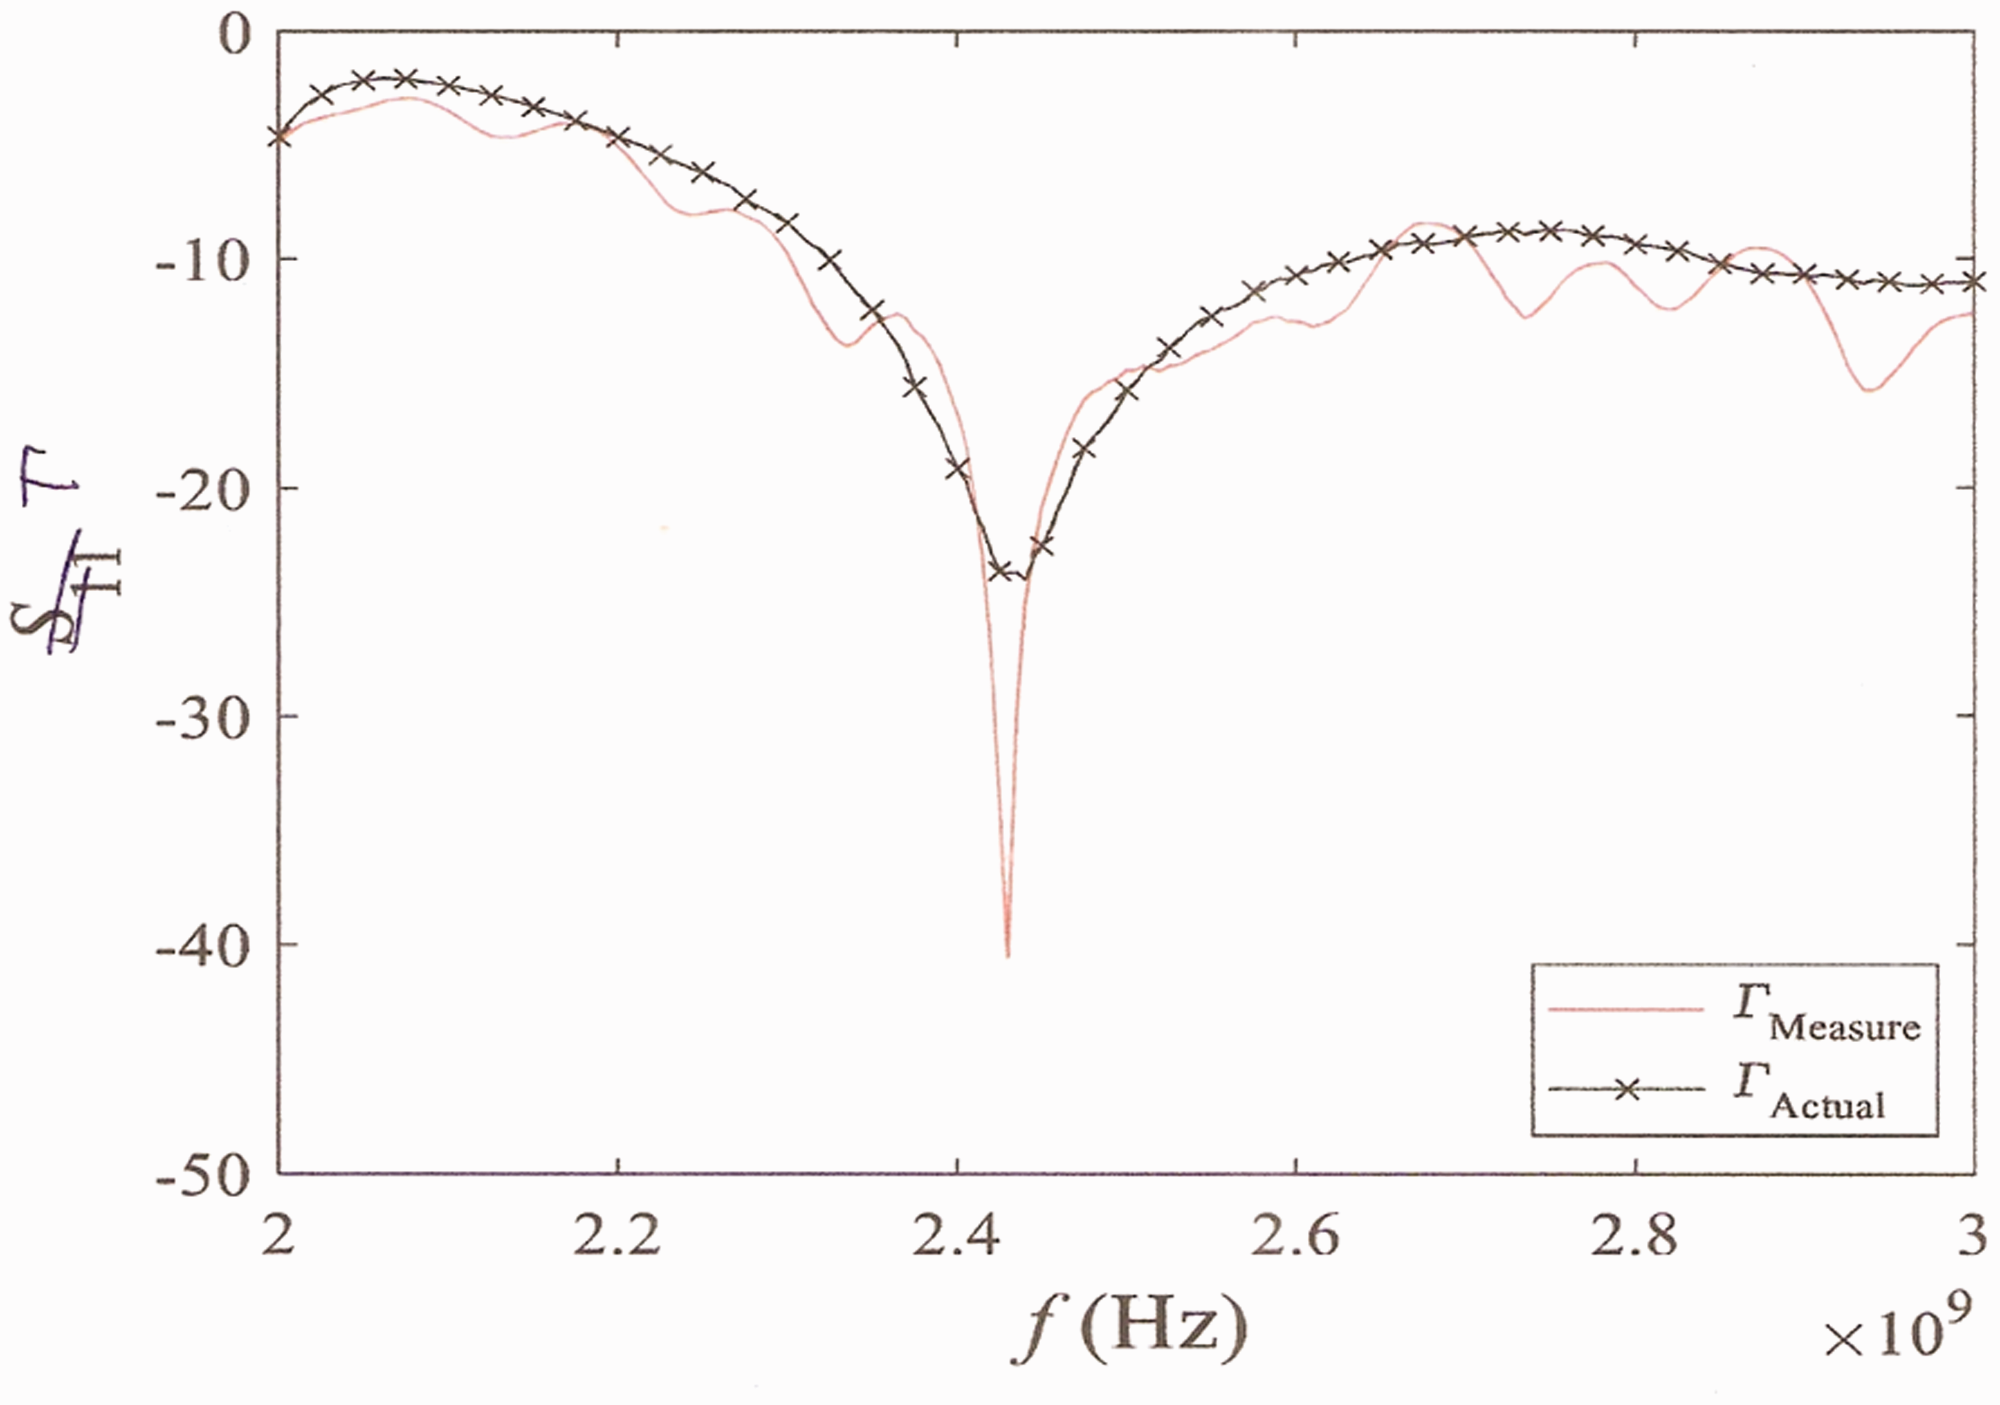
Comparison between un-calibrated and calibrated reflection coefficient measurements for 2.45 GHz monopole antenna (Un-calibrated: ΓMeasure; Calibrated: ΓActual).
In discussion and analysis part of the assignment, the students are required to discuss the following matters:
The factors that cause the errors inherent in a vector instrument. The implicit physical meaning of error coefficients of C2 and C3. The errors between |ΓActual| and |ΓMeasure|. The effective ways to improve the accuracy and precision of measurement. The differences between random errors and systematic errors in the RF instrument.
Determination of dielectric properties for solid material using rectangular waveguide
Rectangular waveguide is a typical microwave device. In this assignment, students will explore the application of the rectangular waveguide in dielectric material characterization. 6 Indirectly, students will better understand the importance of determining the cutoff frequency based on the waveguide dimensions and also the kind of propagation mode for the waveguide. For instance, students need to understand why WR137 rectangular waveguide can only be used in the frequency range of 5.85 GHz to 8.2 GHz. Furthermore, brief discussion on impedance matching theory can be conducted regarding the structure and fabrication of the coaxial-waveguide adapter. 7 In this assignment, several devices, such as WR-137 rectangular waveguide adaptors, waveguide spacer, coaxial cable, and network analyzer, were used. The photos taken during the measurements carried out by the students are shown in Figure 3(a). Two unknown samples A and B are supplied to the students, as shown in Figure 3(b), and the students should predict whether the sample is Nylon or Teflon after the measurements and calculations have been done. Figure 4 shows the predicted relative complex permittivity results submitted by one of the students.
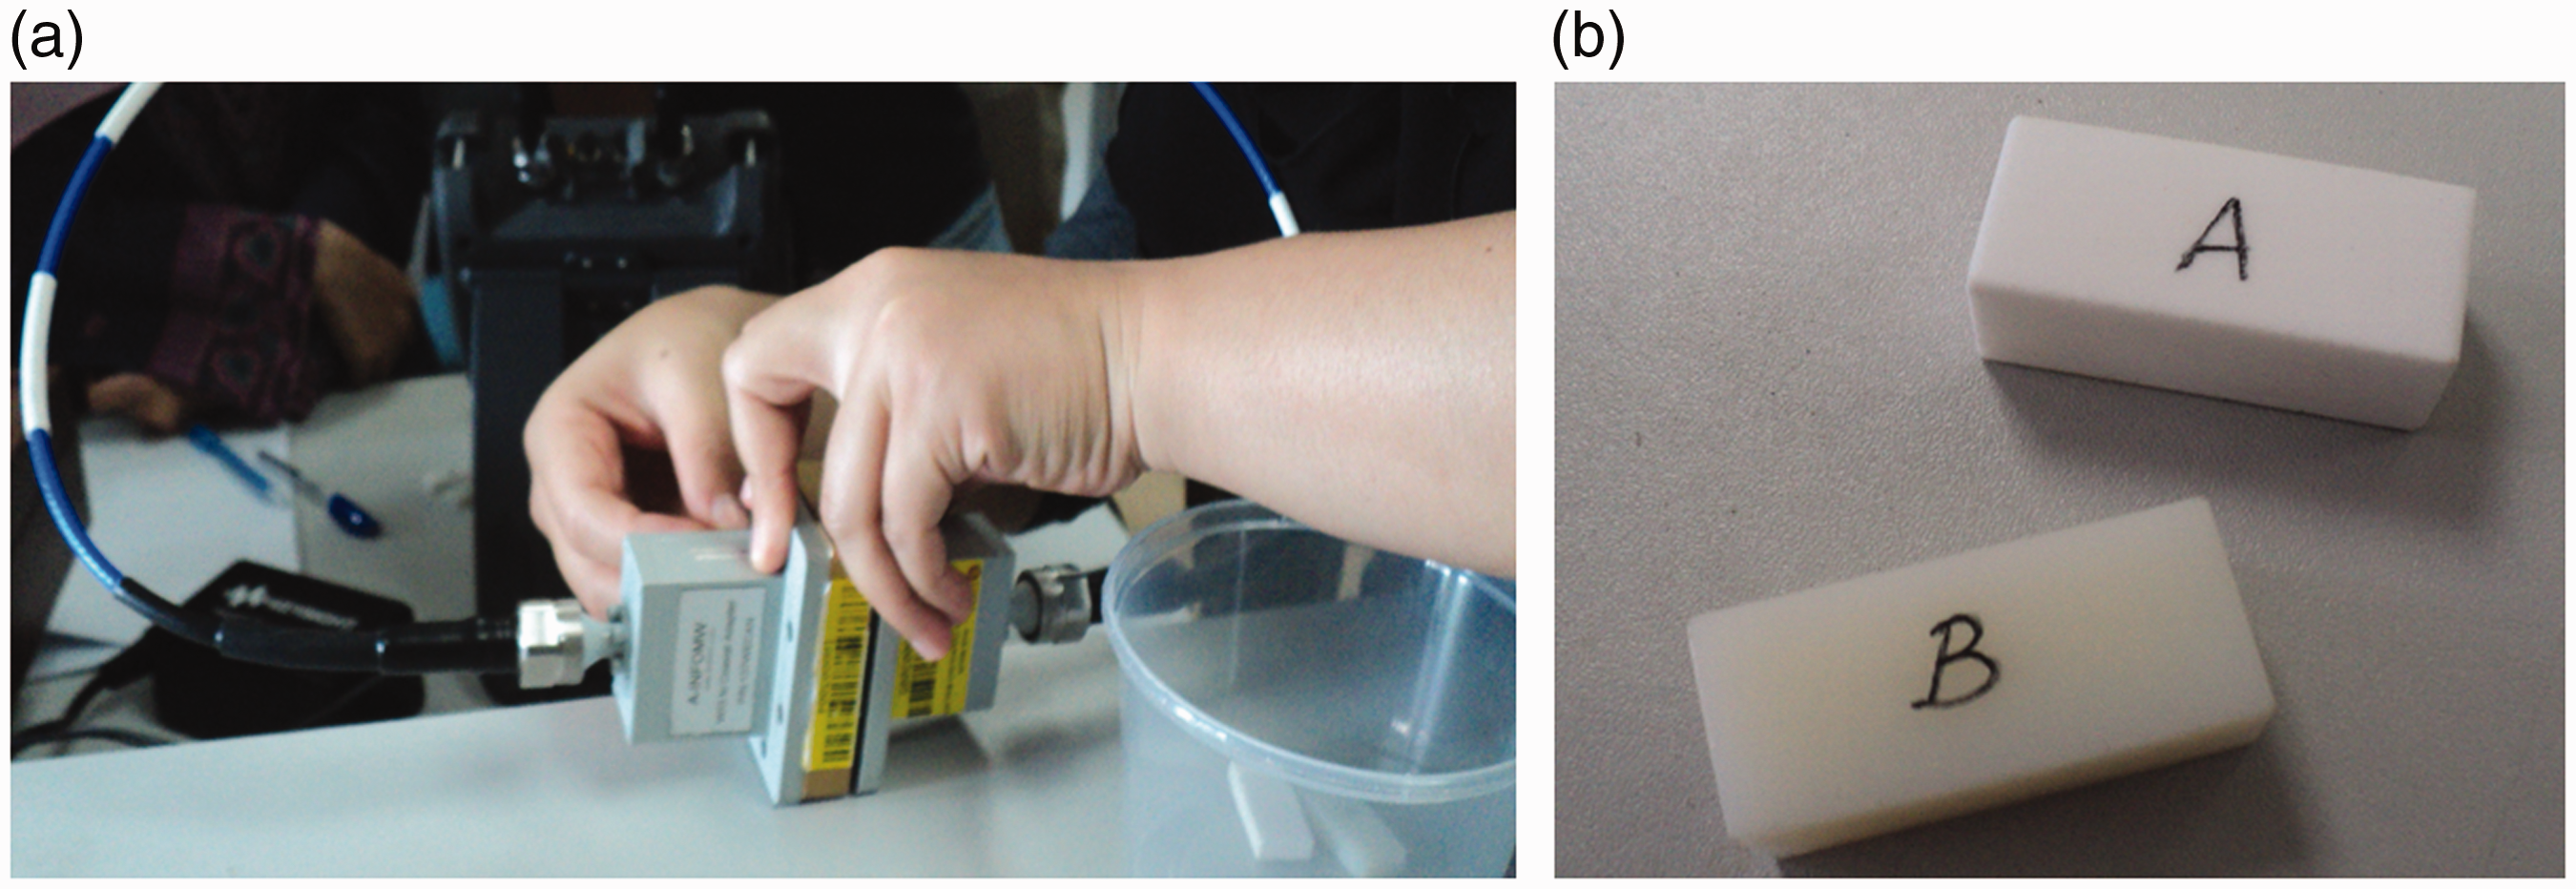
(a) Measurements are being conducted by students and (b) samples under test A and B.
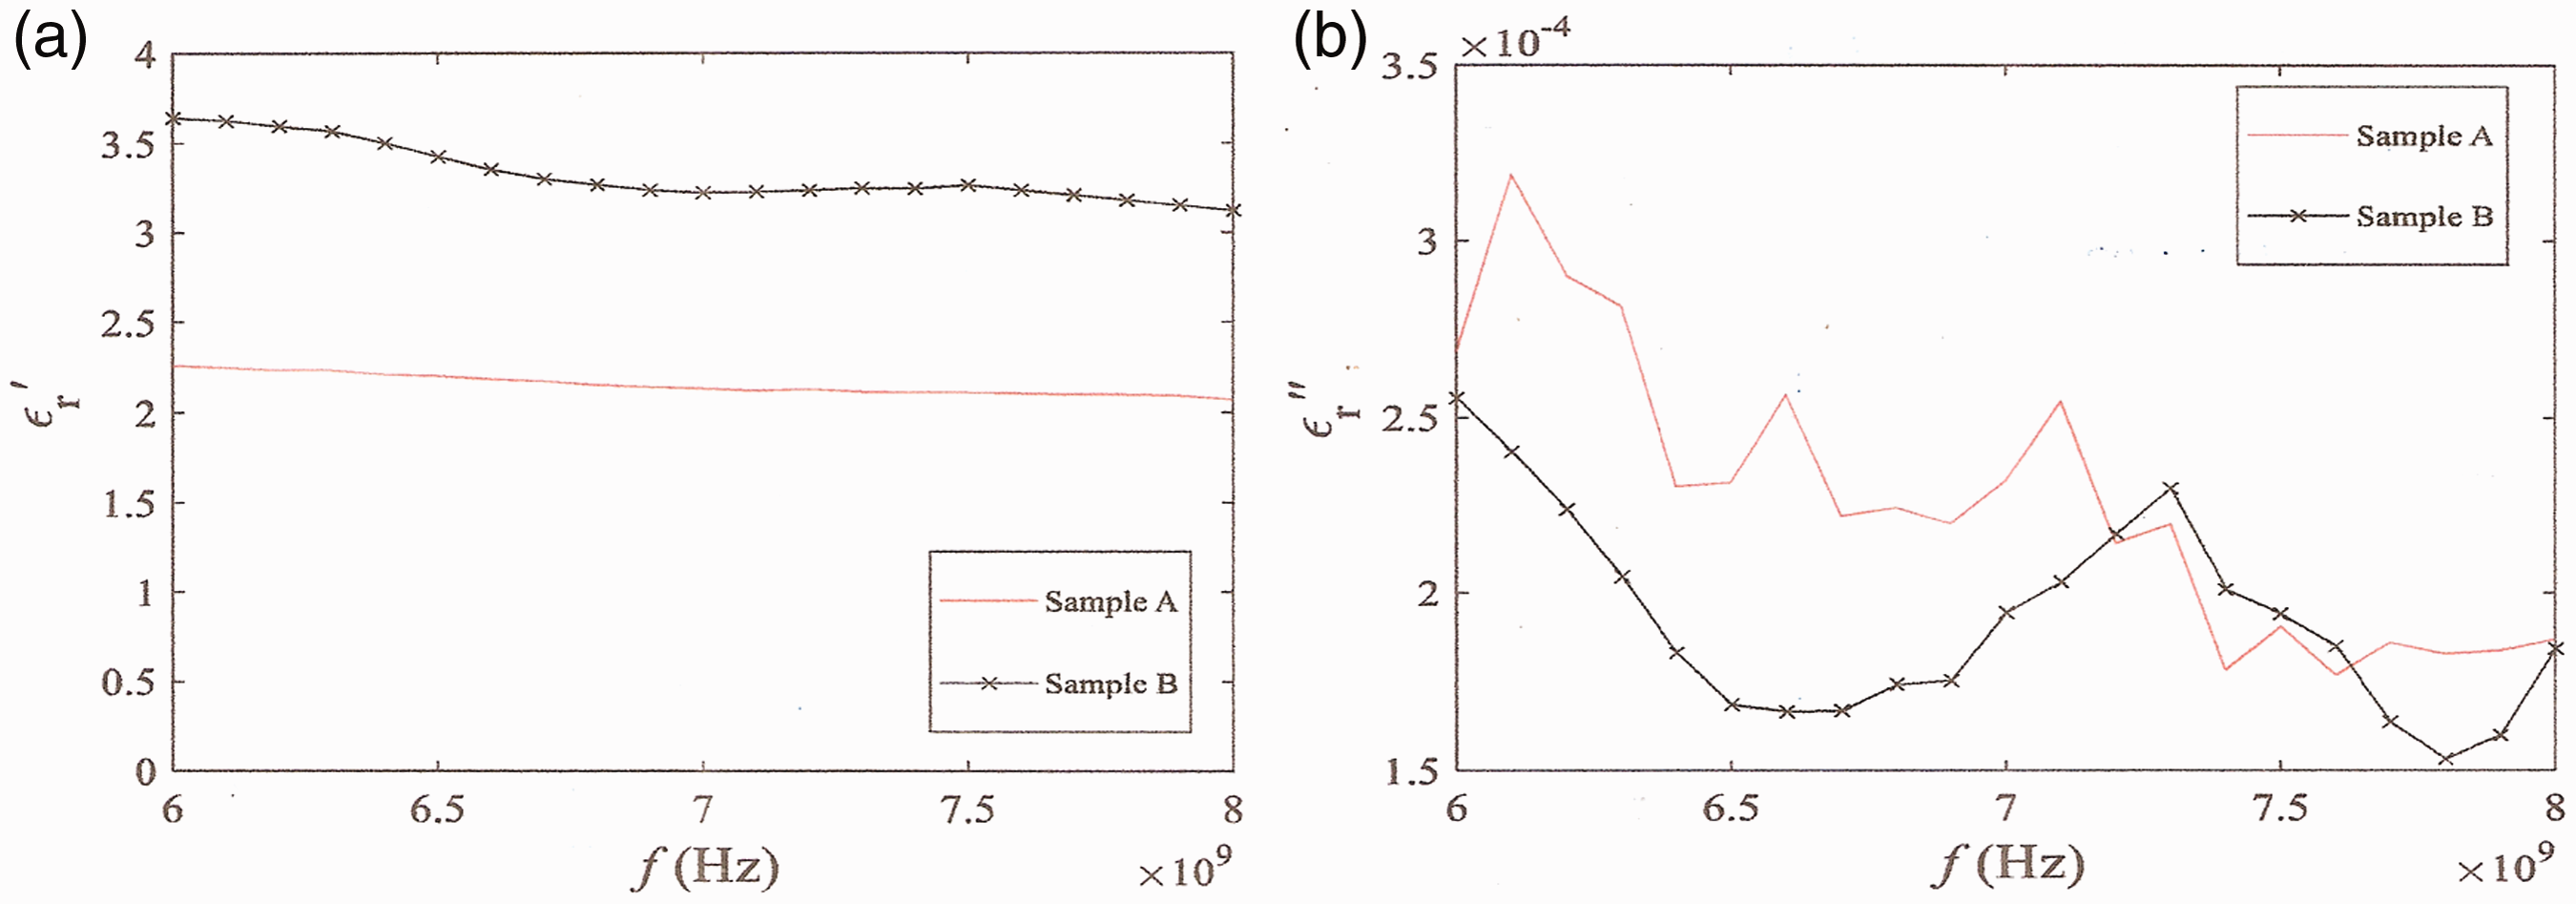
Predicted (a) dielectric constant, εr′ and (b) loss factor, εr″ of the samples A and B, respectively.
Besides, students are also required to complete their assignments by considering several matters:
The errors between calculated dielectric properties values and the manufacturer’s values. Inaccuracies in the phase shift measurement which results an uncertainty in the calculated dielectric constant and loss factor. The effective ways to improve the accuracy and precision of measurement.
Branch-line coupler designs
This assignment enables the students to tackle the initial design of microwave circuit using microstrip transmission line and impedance matching concepts. Moreover, students are instructed to analyze their designed circuit compared to calculation results using formulations in ME textbook. Here, students need to create two types of coupler, namely, two branch-line coupler and three branch-line coupler as shown in Figure 5.
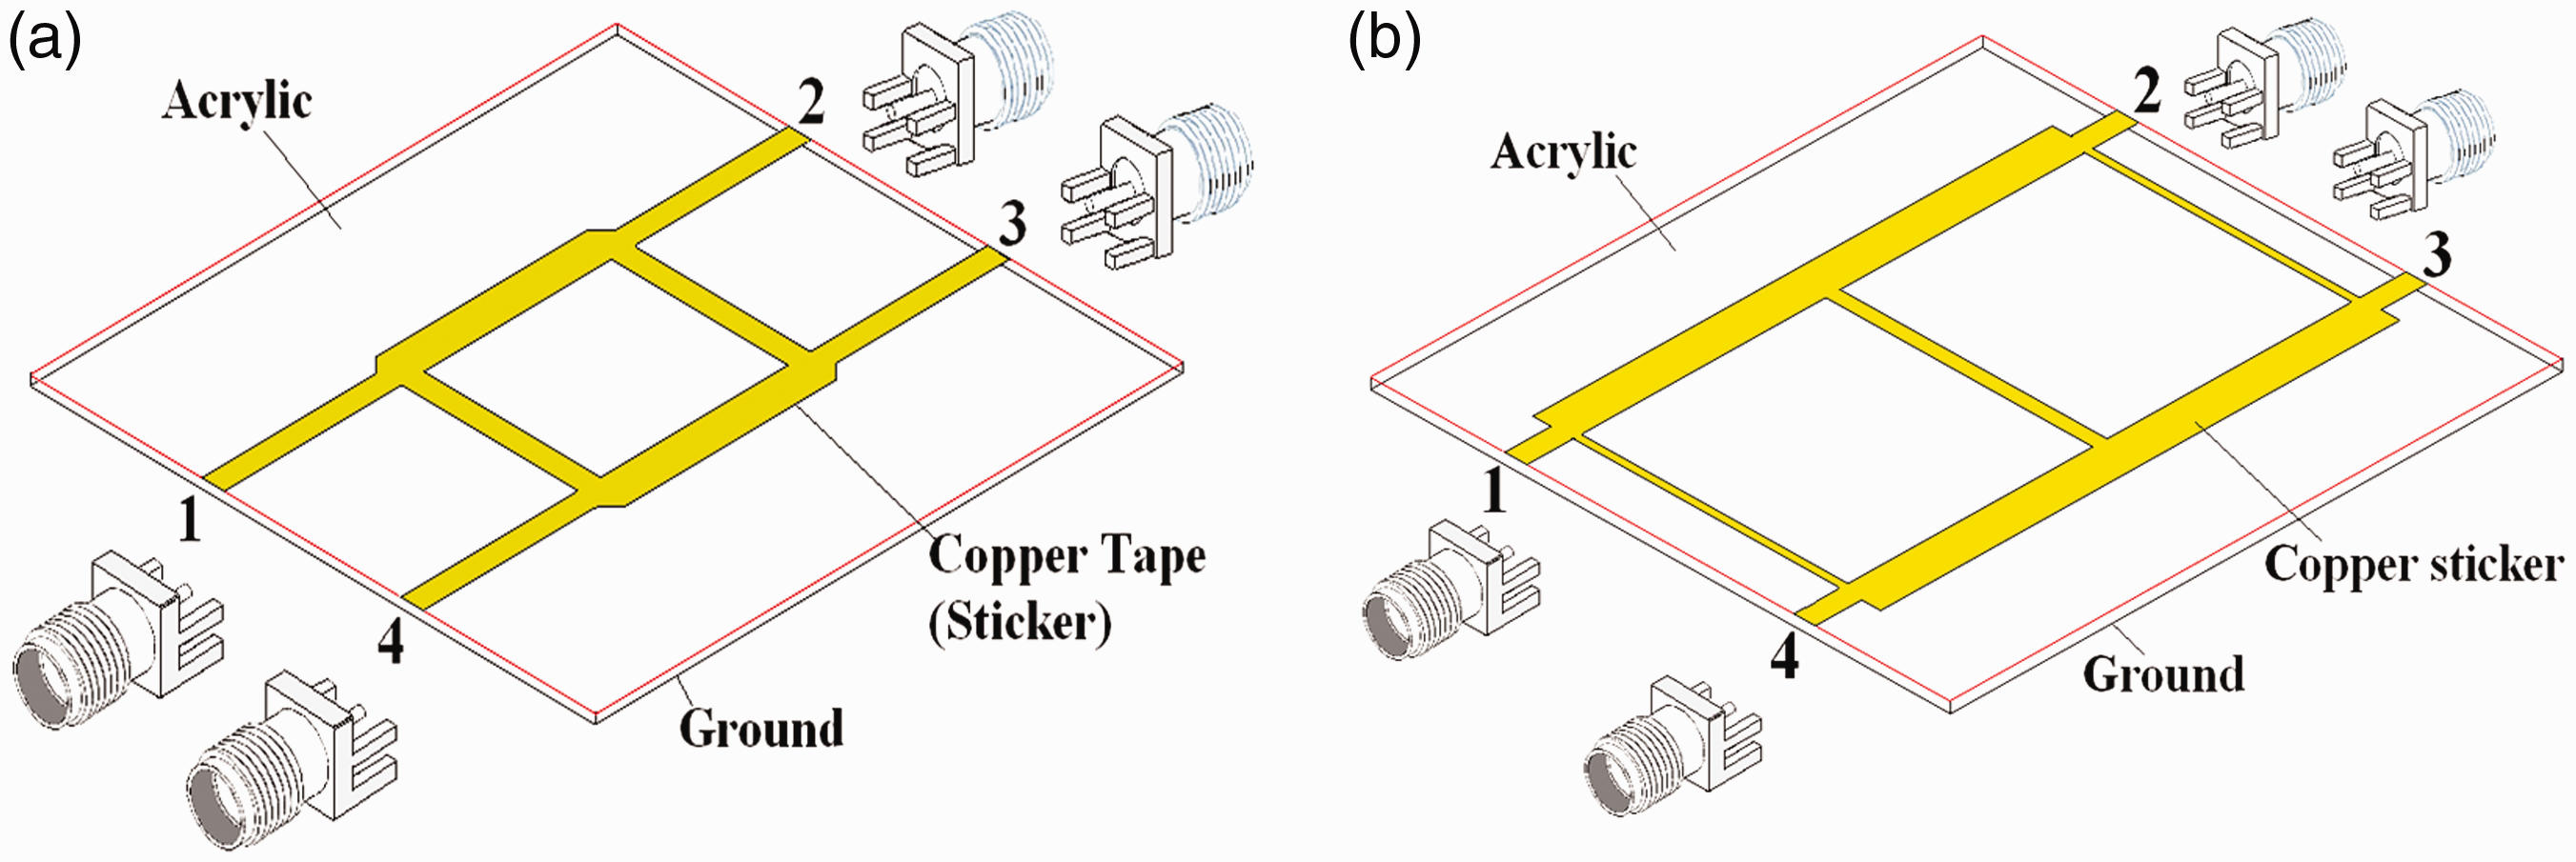
Branch-line coupler fabrications: (a) two branch-line coupler and (b) three branch-line coupler.
In this assignment, PCB etching works are eschewed in order to ensure the safety and health of students. The branch-line coupler is made by cutting the designed dimension of copper line from the copper tape and attached the line to the acrylic surface. Another surface of the acrylic will be used as a ground and fully affixed with copper tape. Finally, four SMA connectors will merge the four terminals of the coupler as shown in Figure 6. The performances of both designed couplers are tested by network analyzer as shown in Figure 7.
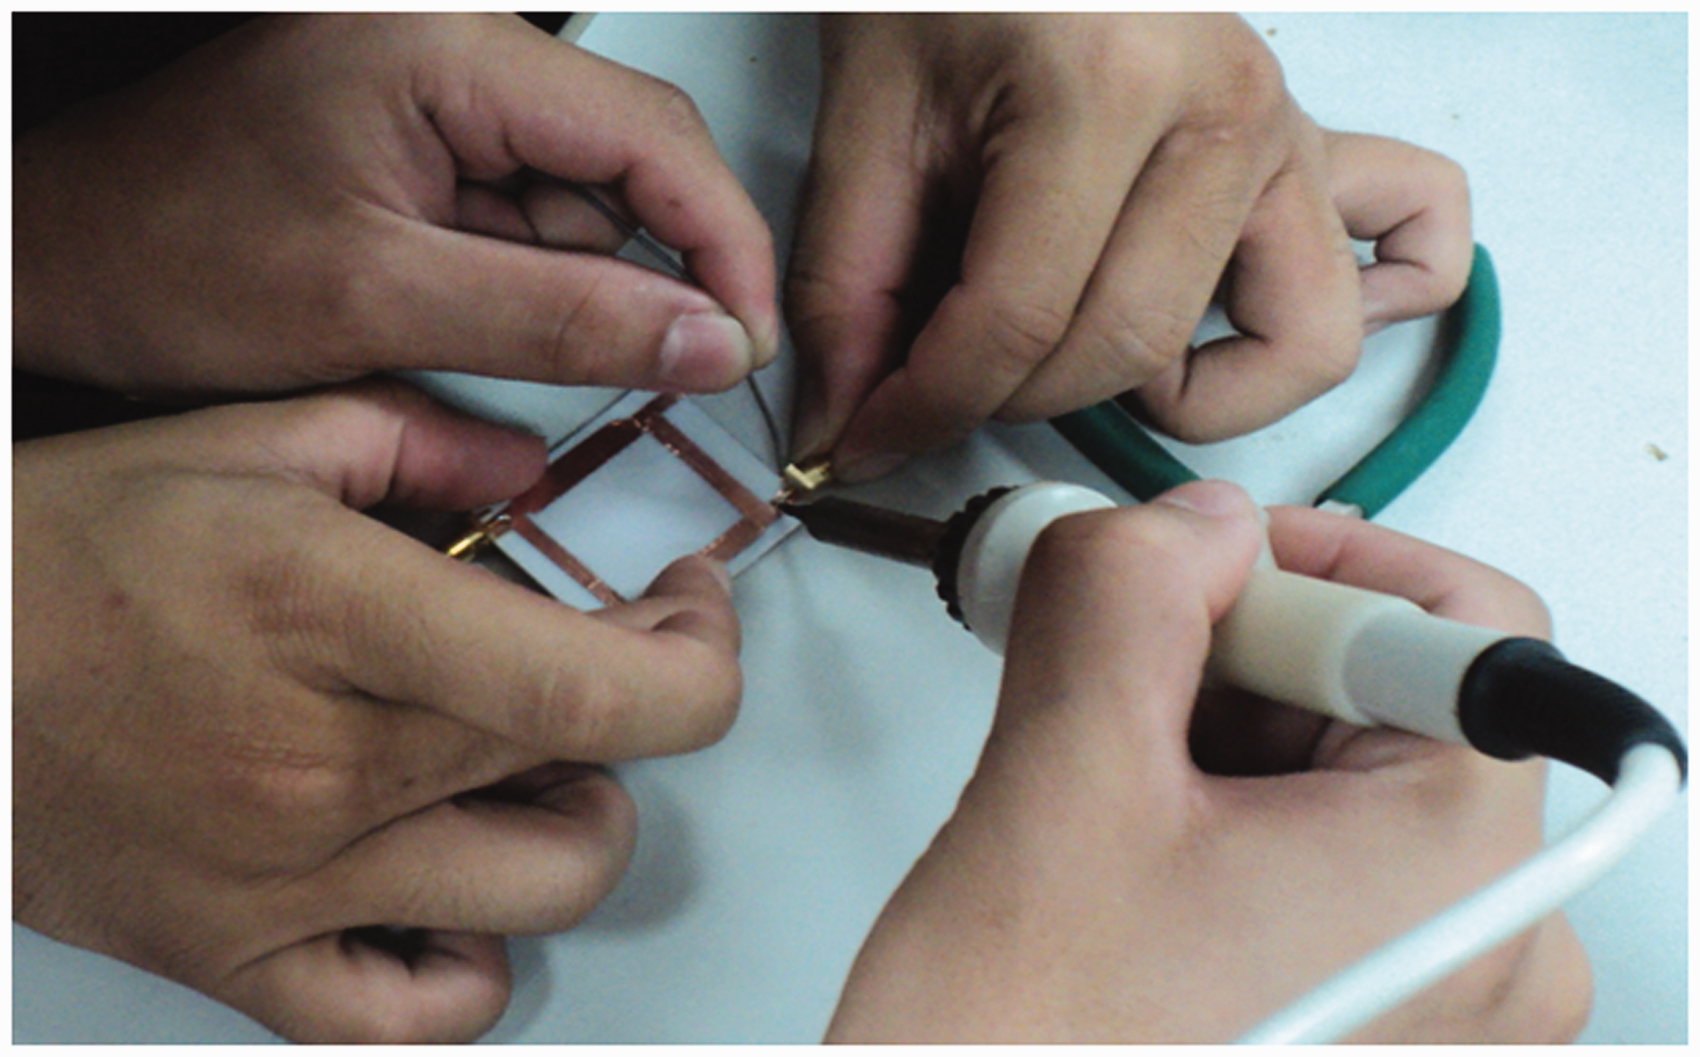
Branch-line coupler fabrication.
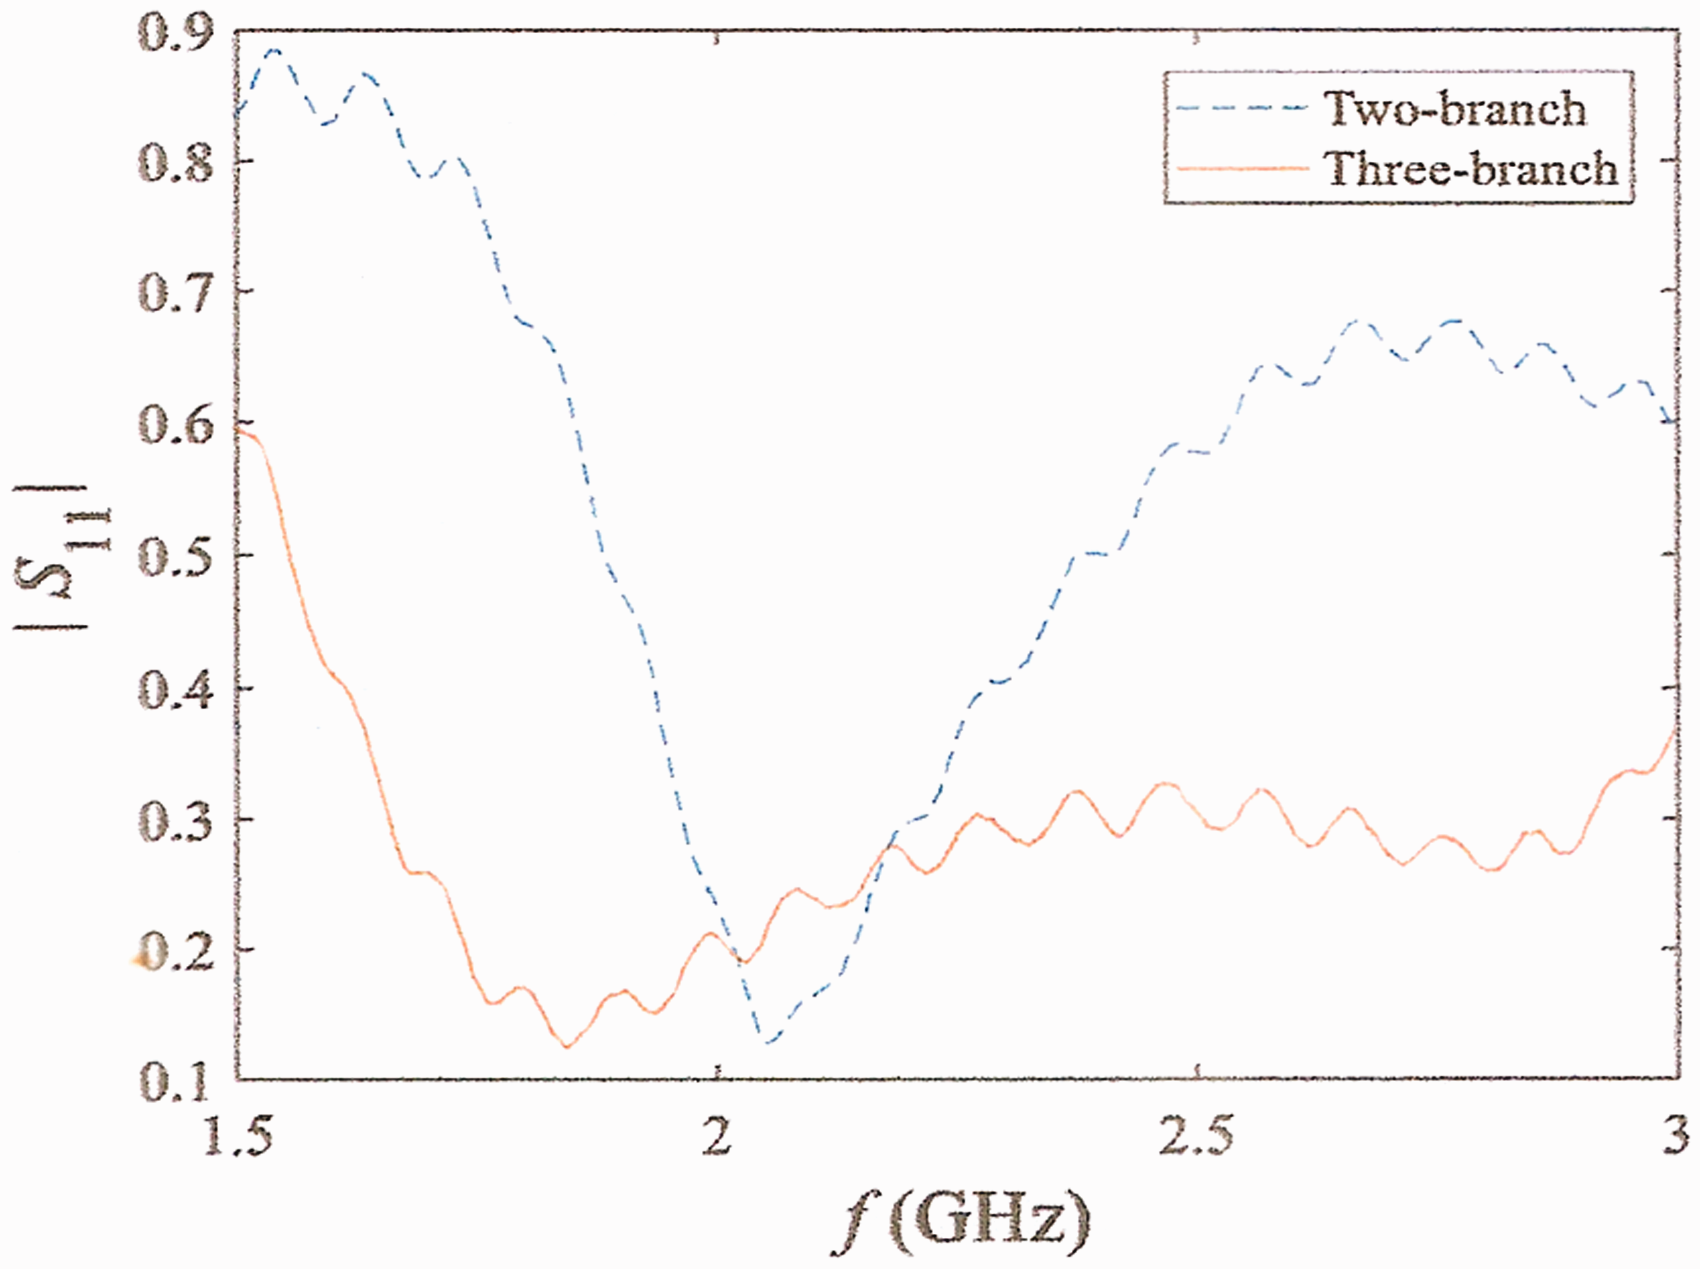
Measured |S11| versus frequency for two branch-line coupler and three branch-line coupler.
The measurement test will be compared to the manually calculated results (analytical formulations in ME textbook) by students in order to gain the experience in evaluating the design performance. Students are encouraged to discuss and analyze their designed couplers using the following guidelines
Compare the operating bandwidth between two branch-line coupler and three branch-line coupler. Discuss the usefulness of adding the branch line in coupler design. Compare the ideal theory calculation with the measurement results. Discuss the performance of both couplers based on the measured |S11|, |S21|, |S31|, |S41|, and |ϕ21–ϕ31|.
Gain and radiation pattern measurement of dipole antenna
From this assignment, students will gain the technique of how to direct measure the performances of the antenna, such as gain and radiation pattern. The students are trained to use different microwave instruments in order to gain antenna measurement as shown in Figure 8. Additionally, students can take the opportunity to identify various units used in communication measurement, such as the parameters with unit dB, dBm, and dBi.
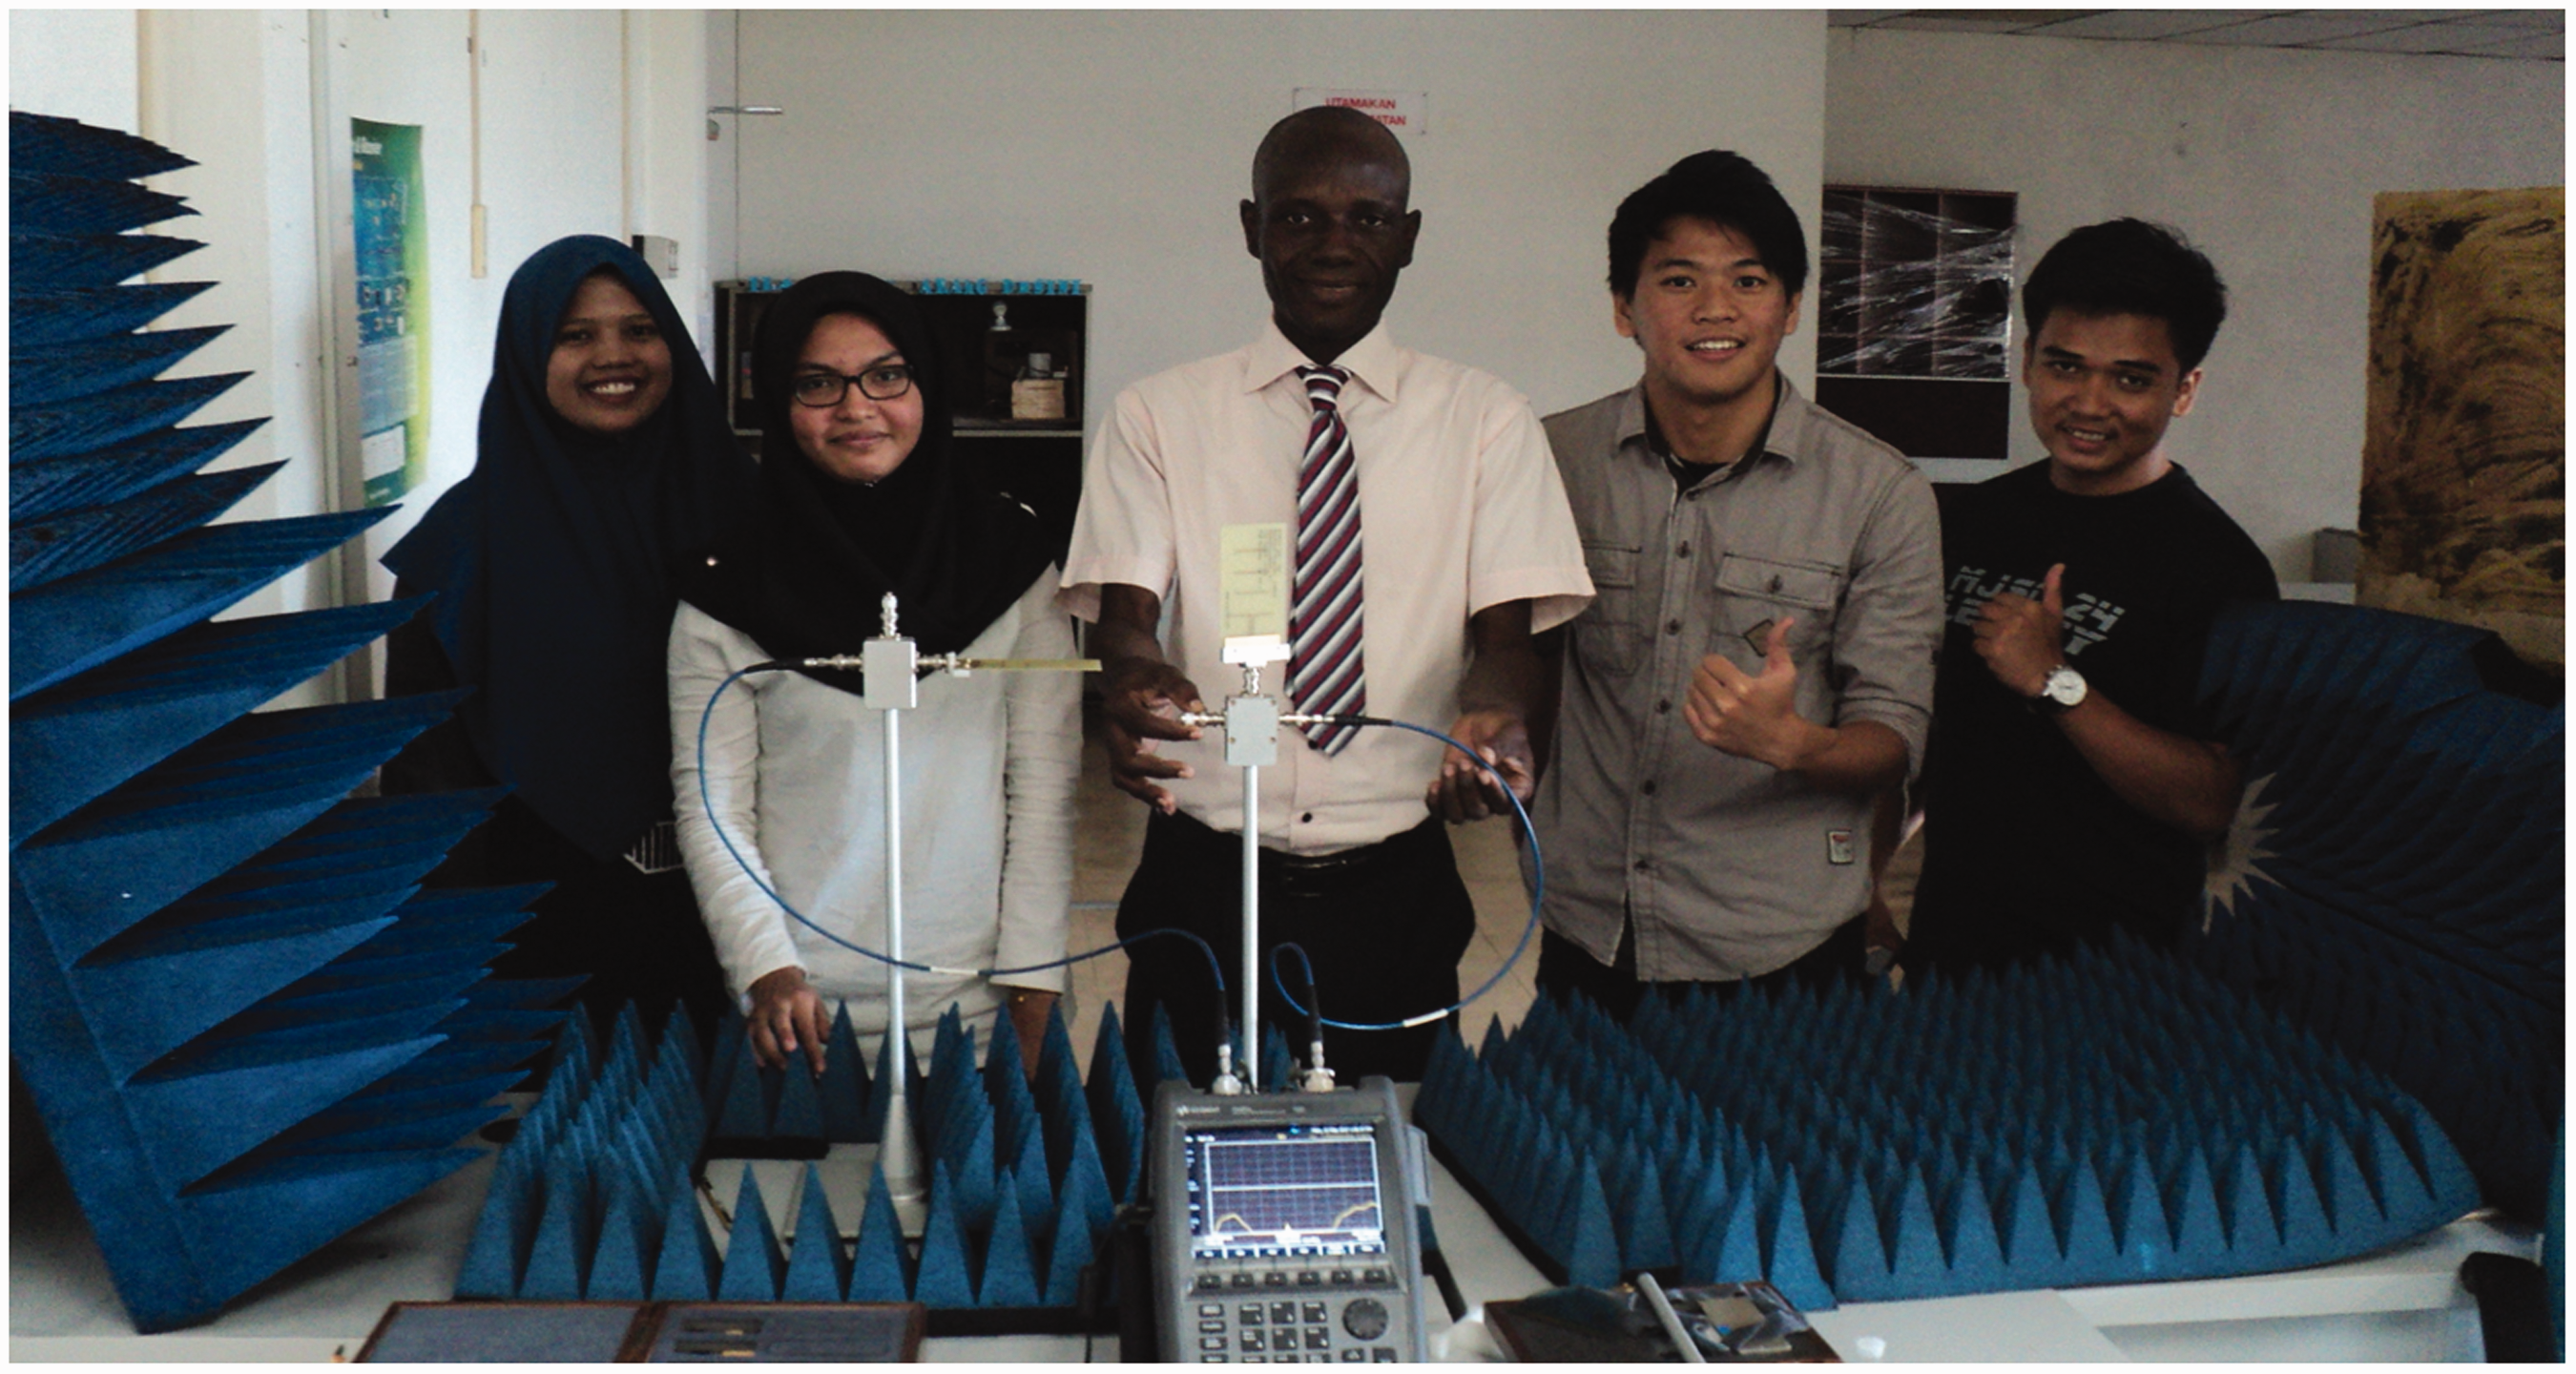
One of the groups of the students involved in the task of measuring antenna gain.
Normally, the gain specification of commercial antenna from manufacturer is given in unit dBi. Sometimes, the unit of gain particular for dipole antenna is used and denoted as dBd instead of dBi, since it is difficult to get an ideal isotropic antenna in the real world. Ideally, the dipole antenna has a gain of 2.15 dB higher than the isotropic antenna. Students are required to determine the gain, G of the dipole antenna by measuring the reflection coefficient, |S11| and transmission coefficient, and |S21| using the network analyzer. The formulation of gain, G (Friis equation) as a function of reflection and transmission coefficients, is available in the study by You. 8 Three measurement cases are required to be done:
Case I
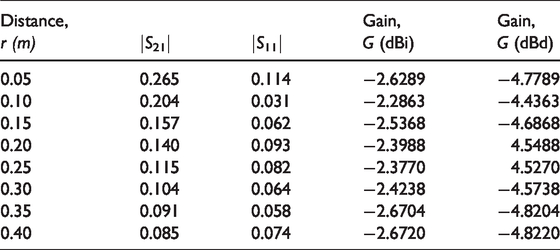
The distance, r between the two dipole antennas as shown in Figure 9(a), is increased with interval of 0.05 m and the corresponding receiving signal, |S21| and |S11| are measured and the output results are listed in Table 2.
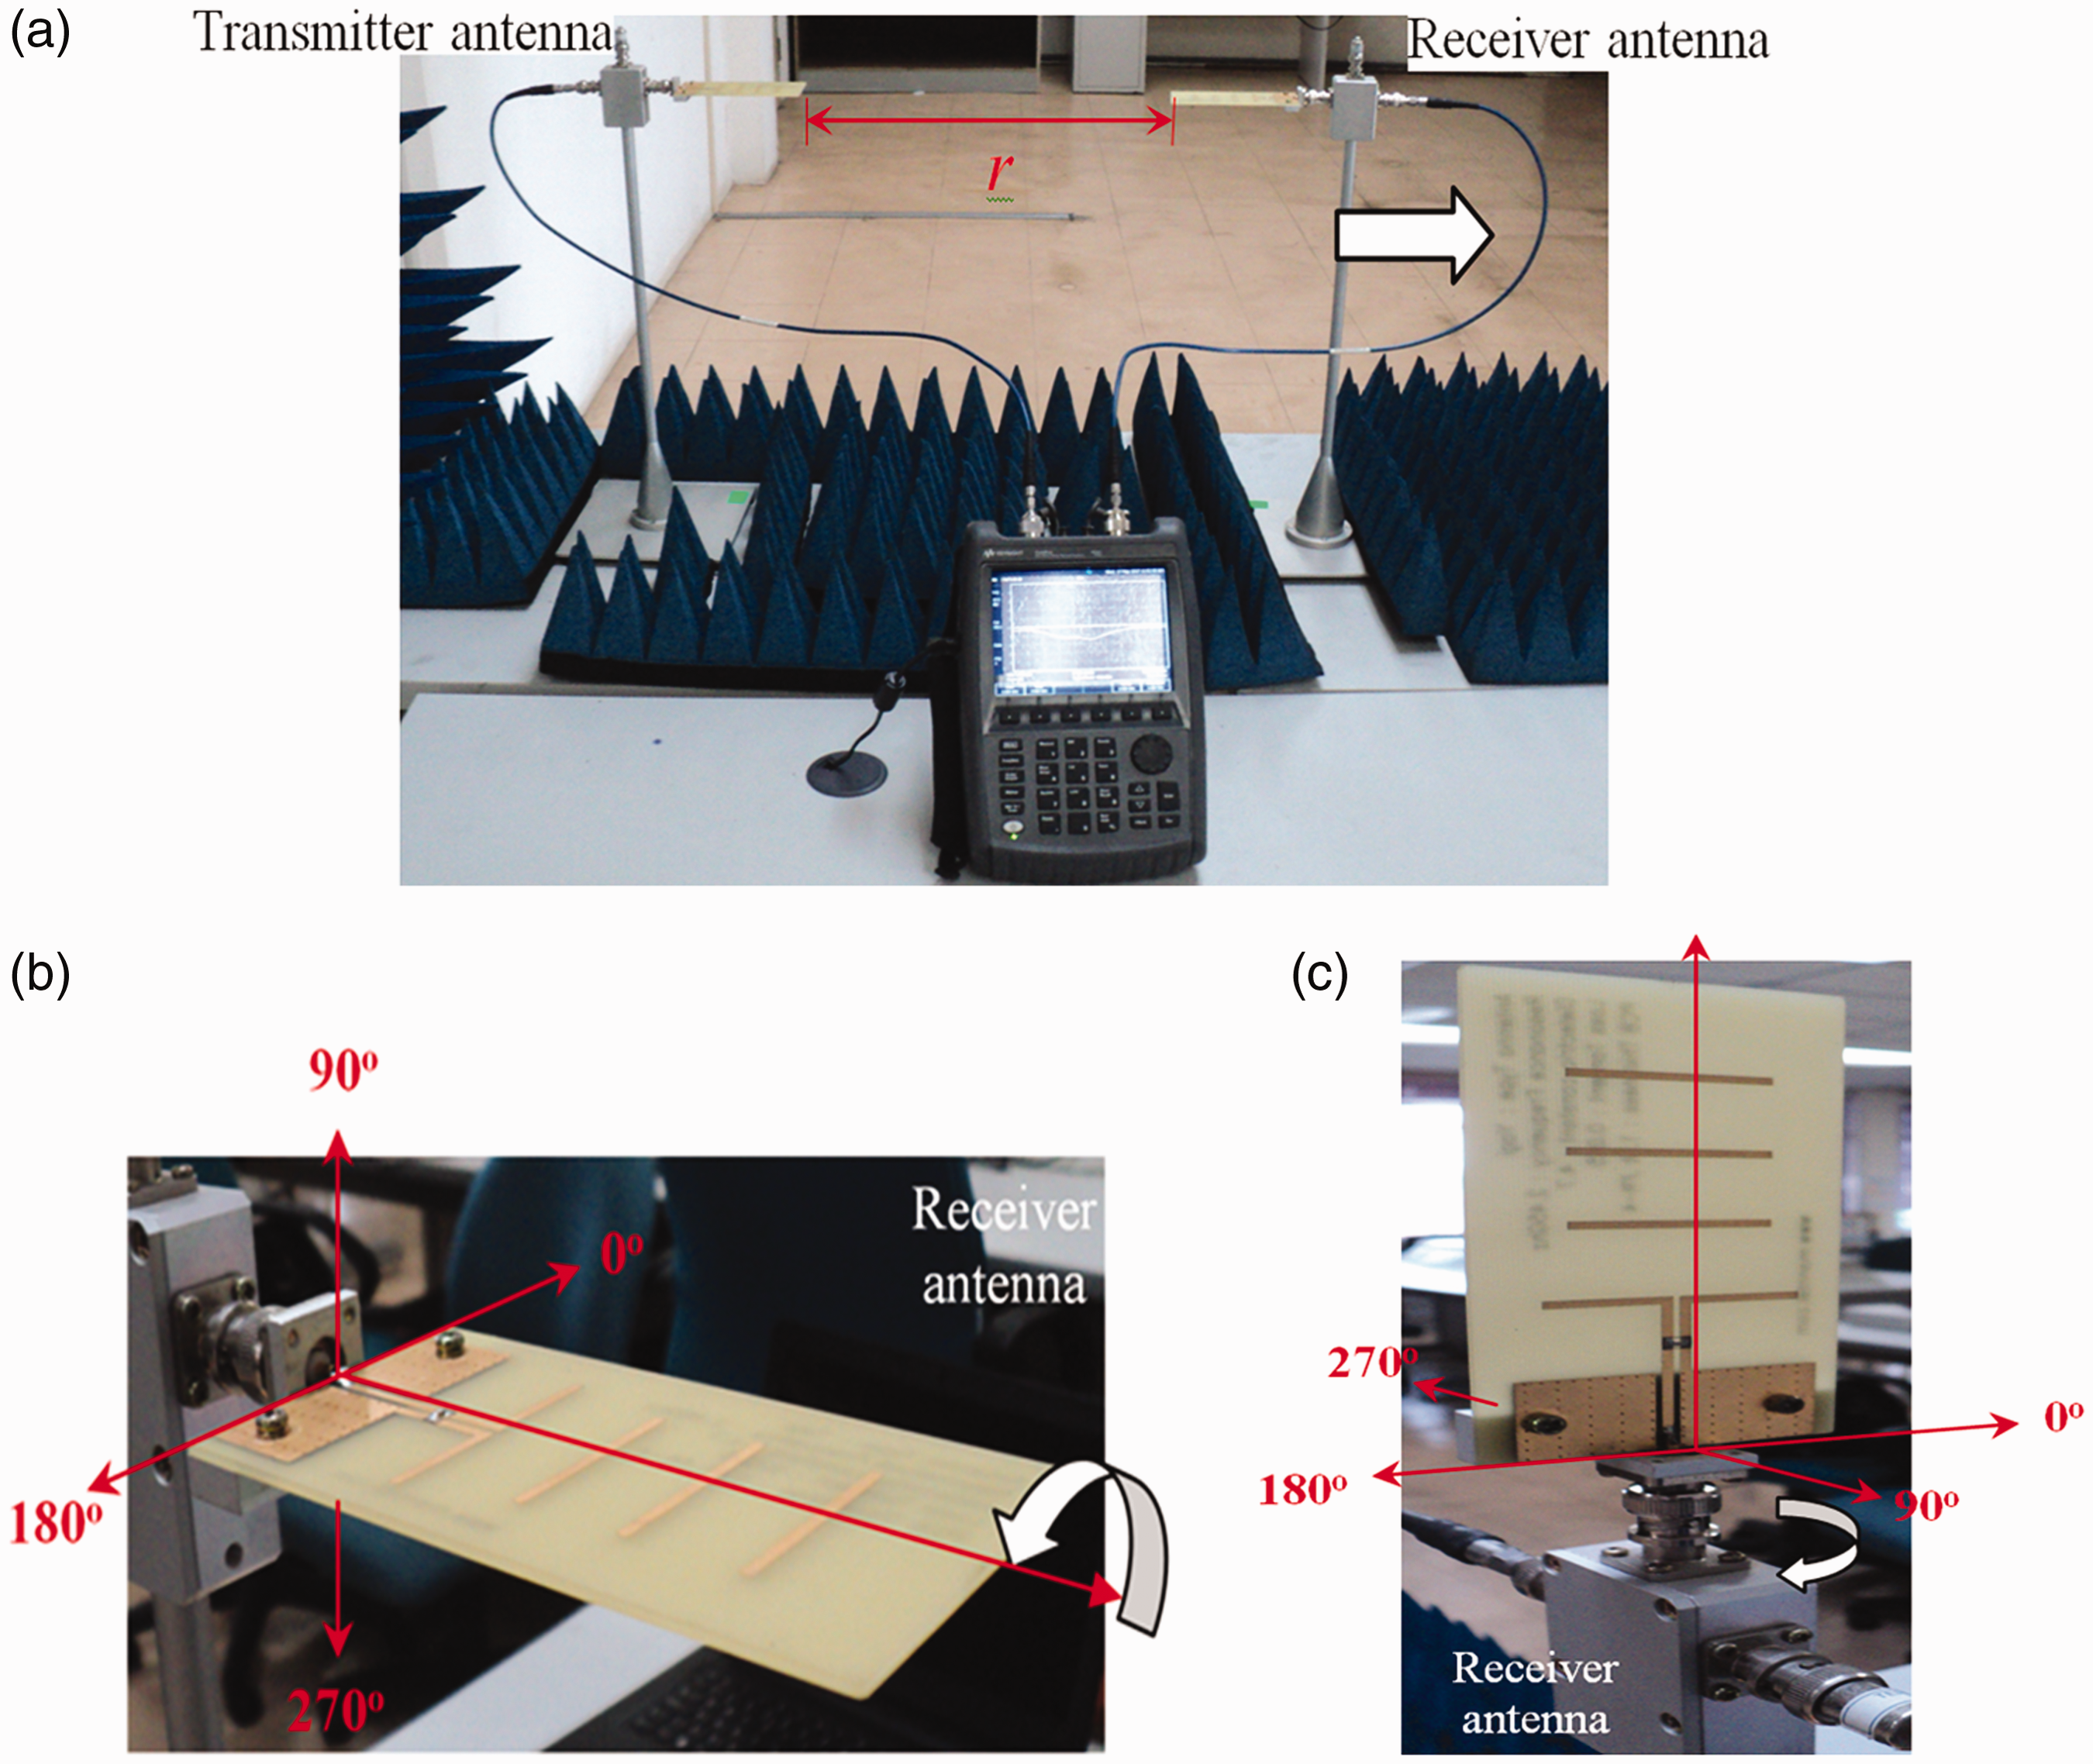
(a) Case I, (b) Case II, and (c) Case III measurements set-up.
Measured |S11|, |S21|, and calculated gain.
Case II
The constant distance, r between transmit and the receive dipole antennas, is set to be 0.15 m. The receiving dipole antenna is rotated and its rotation angle, θ is varied as shown in Figure 9(b). The corresponding measured reflection |S11|, receive |S21|, and the calculated G (in unit dBi and dBd) are recorded and plotted in Figure 10(a).
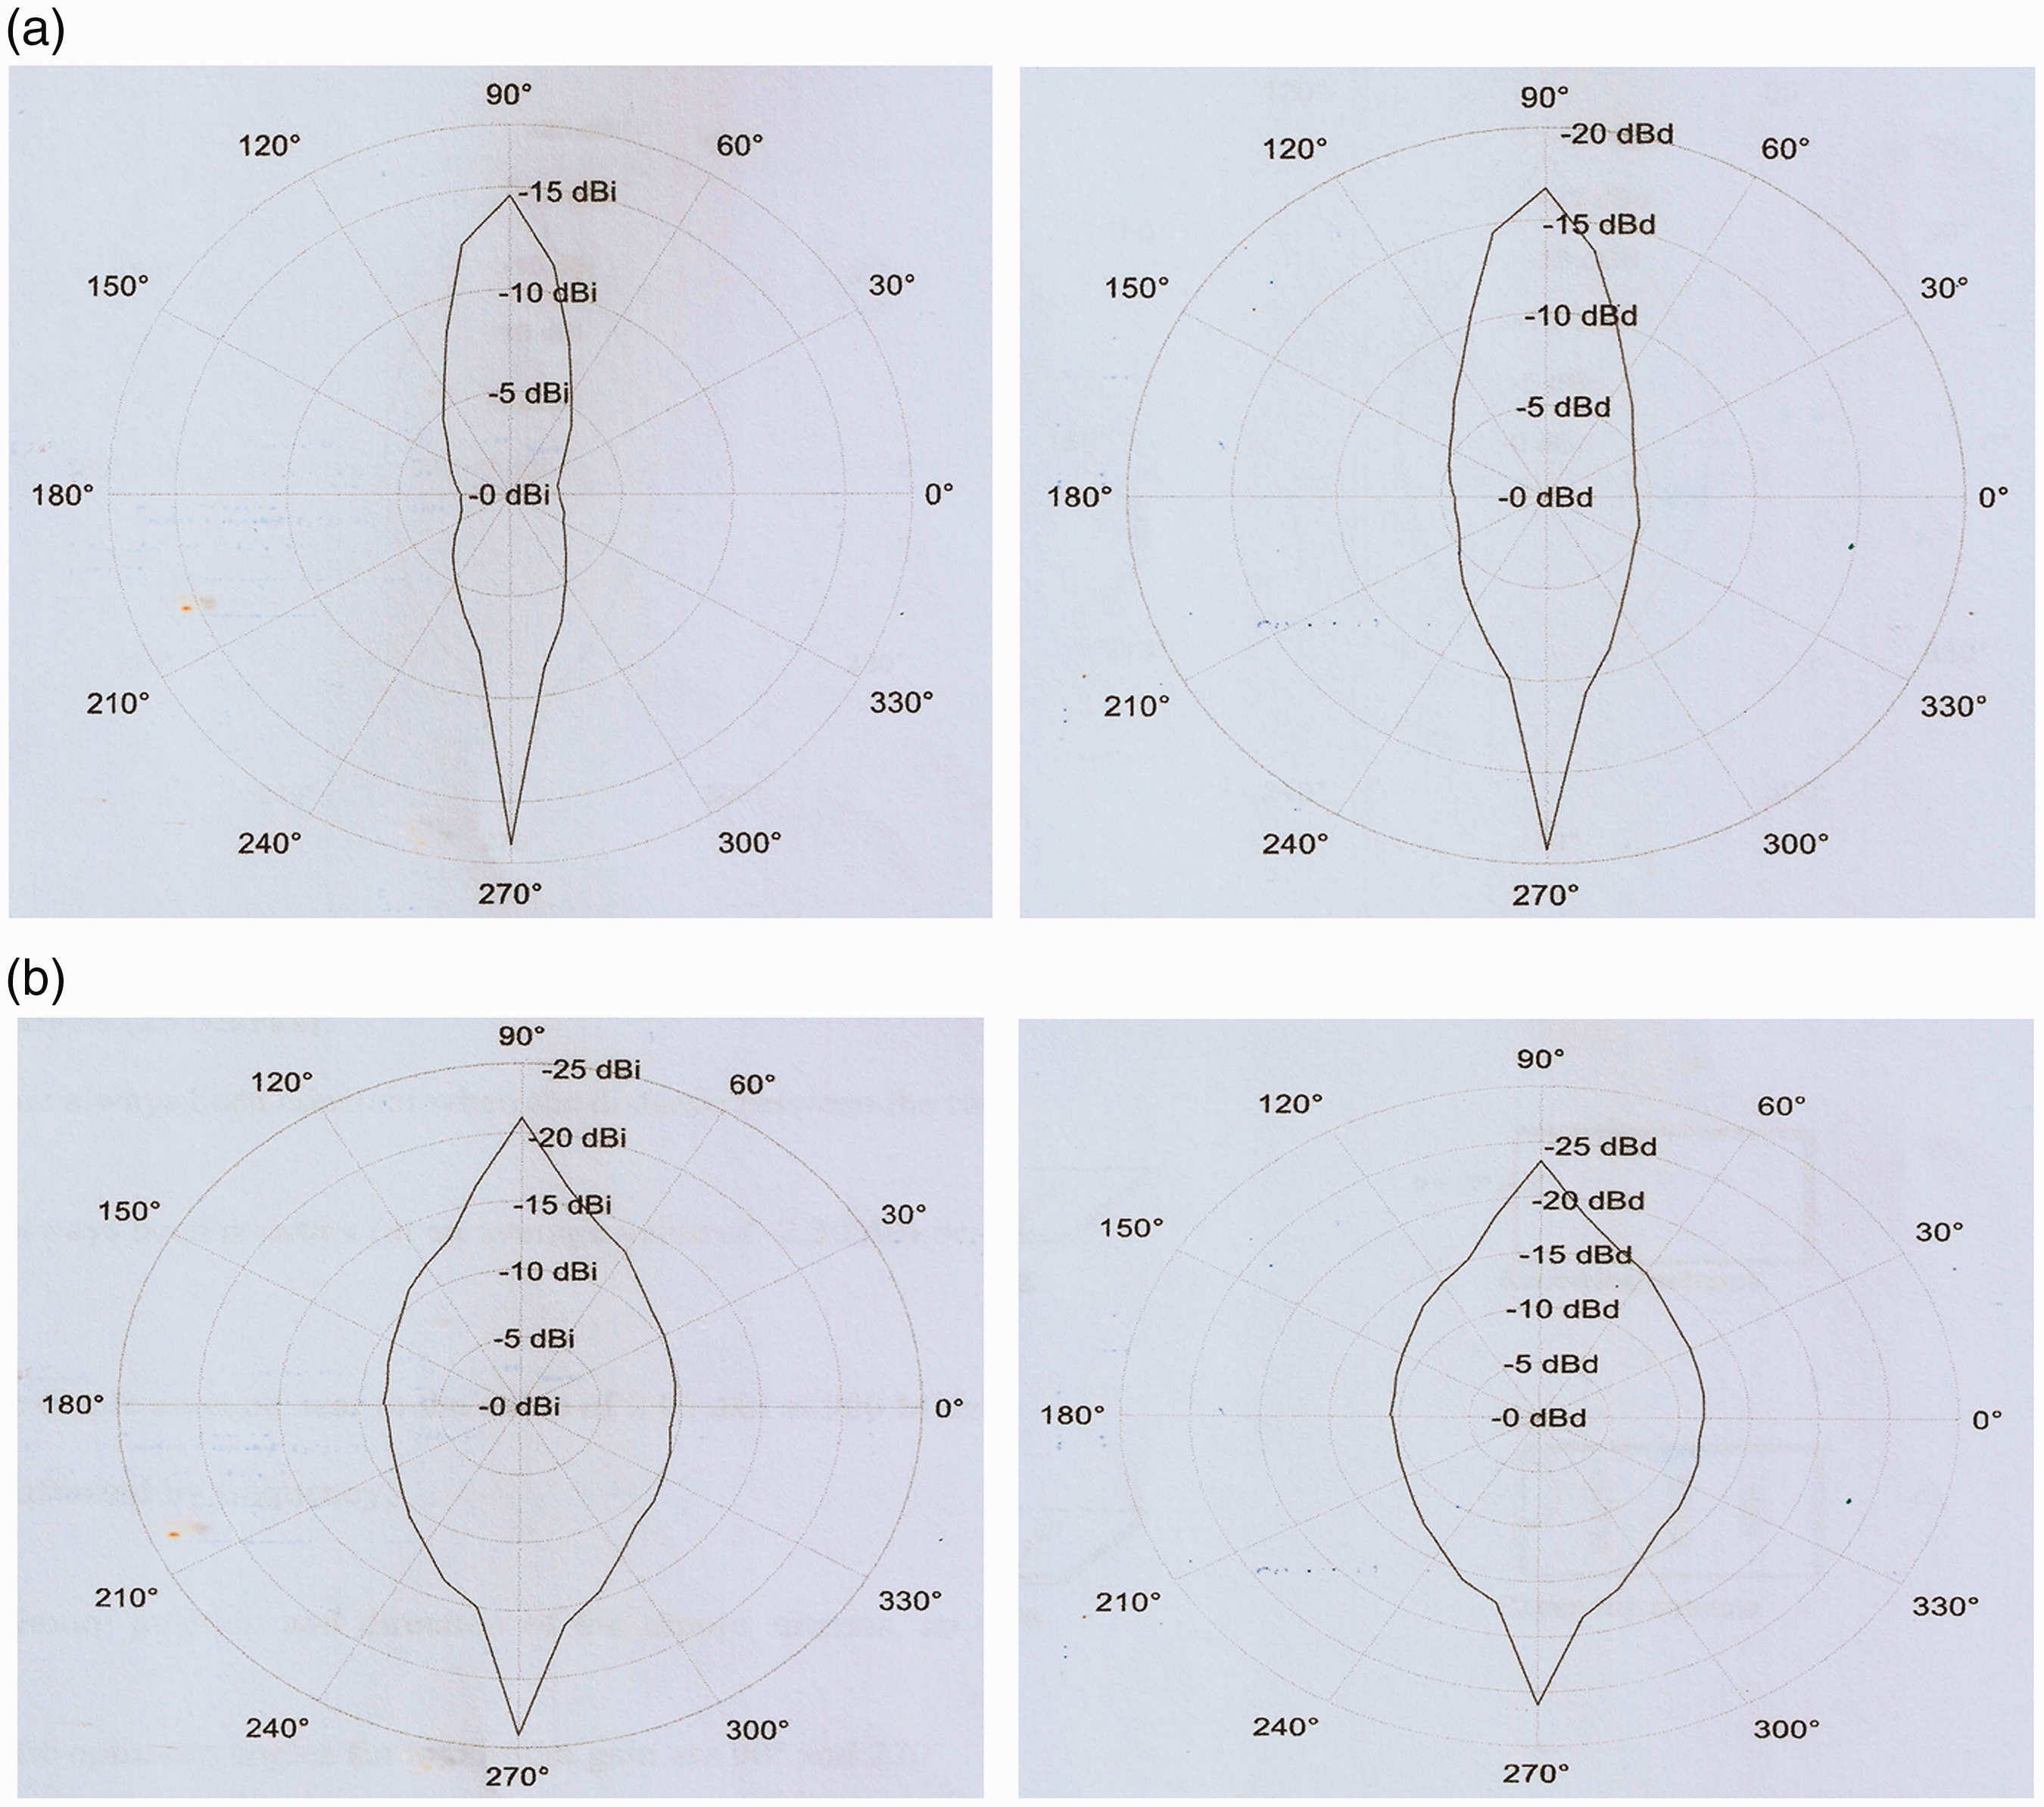
(a) Polar plot of gain, G (dBi and dBd) for case II and (b) polar plot of gain, G (dBi and dBd) for case III.
Case III
Similar with case II, only the portion of the receiving antenna is required to be changed as shown in Figure 9(c). The angle, θ direction of the receiving dipole antenna is varied. The corresponding measured reflection |S11|, measured receive |S21|, and the calculated G (in unit dBi and dBd) for case III are recorded and plotted in Figure 10(b).
After this work, students will have better appreciation of the reflection/transmission coefficients which can be analyzed and interpreted in various ways, such as gain. After measurement has been completed, students have to answer and discuss some questions as:
Has the gain value always been constant when the distance between the two dipole antennas is increased? Is the gain of the dipole antenna near to the value of 2.05 dBi at 2.45 GHz? Are the measurements using spectrum analyzer and network analyzer provided the same value of gain? What is the optimum position and direction of the dipole antenna, so that it can achieve the maximum gain?
Indoor wireless signal strength measurement
In the final assignment, students are required to conduct a WiFi signal strength measurement using log-periodic antenna and spectrum analyzer in a particular area of faculty’s laboratory. Figure 11 shows the selected measurement place and on-site condition.
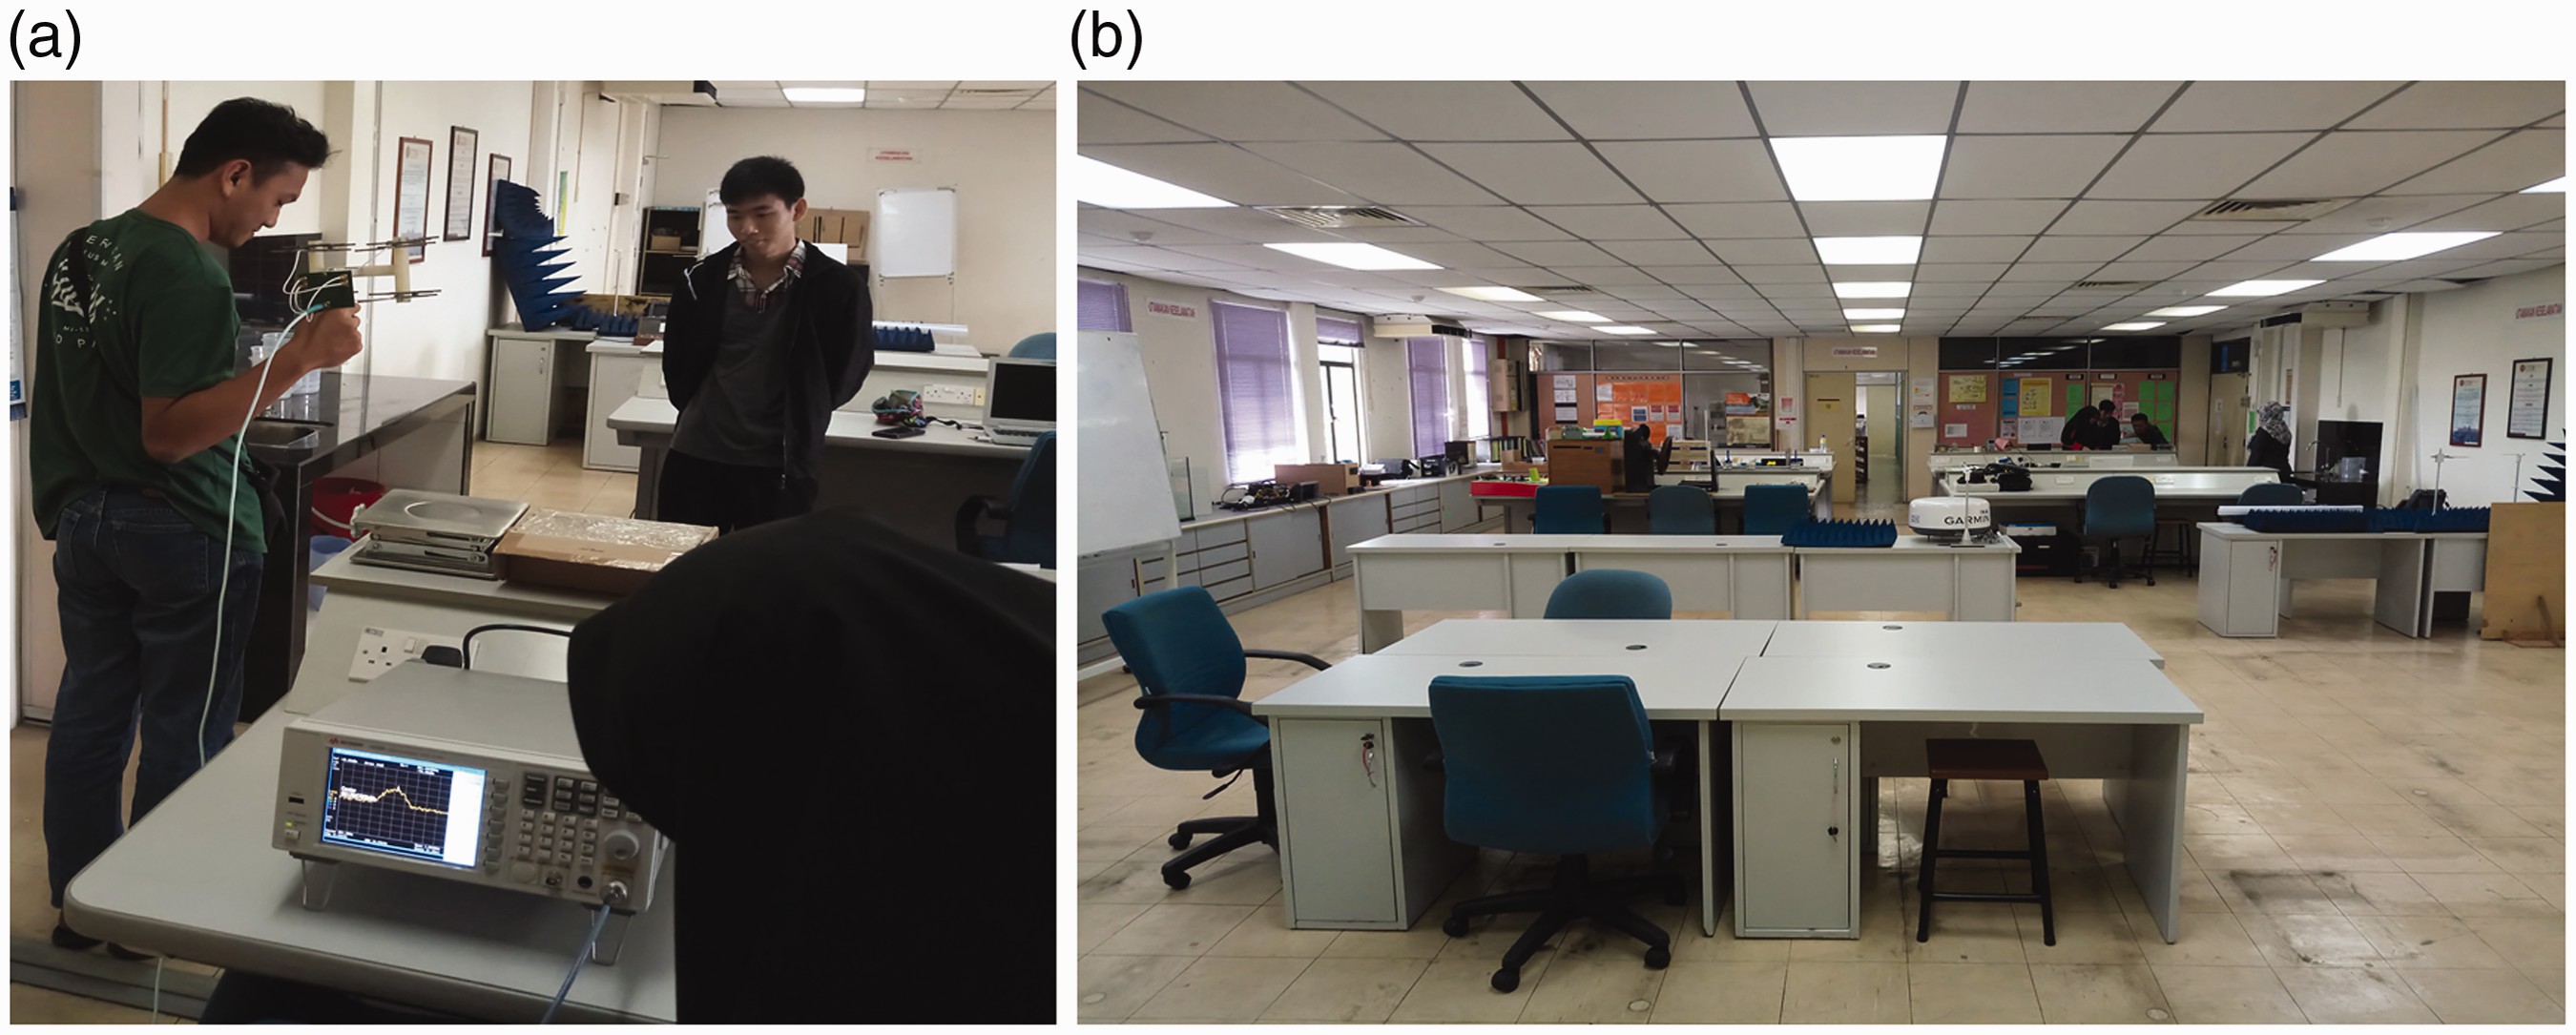
(a) WiFi signal strength measurement in (b) RADAR laboratory.
This assignment enables the learners to gain an experience in analyzing the signal channel distribution in an indoor area. Furthermore, students are also trained to estimate practically the number of transmitters (access points) and its installation location in order to optimize the signal coverage in the office environment. Based on the measurement results, students can develop a conclusion by referring to the following questions:
Is the power signal in dBm units more suitable for the usage in a contour plot compared with the signal power in watts? If yes, please state the full reason. Is the access point in the office enough? If not, please suggest the sufficient amount of access point. Does the existing access point in the office installed in the right position? If not, please suggest a better installation position. Does the furniture in the office blocks the signal transmission? If yes, estimate the attenuation signal caused by the furniture.
In this assignment, the lecturer has taken an opportunity to explain to the students that why engineers tend to use the logarithm scale (in unit dB) in their measurements. One of the reasons for the use of logarithm scale is to engage very small power measurement values, and the power values can vary by massive amounts. For instance, as known that most of the RF communication devices are able to operate at a very low power level (below 10−16 watts). Figures 12 and 13 are the signal strength contour plots, which are plotted by two different students (students 1 and 2) with MATLAB ‘contourf’ function based on their measurement data. Obviously, the WiFi signal strength distribution in logarithm scale (in dBm) can provide a better contrast visualization rather than using scale in unit Watt.
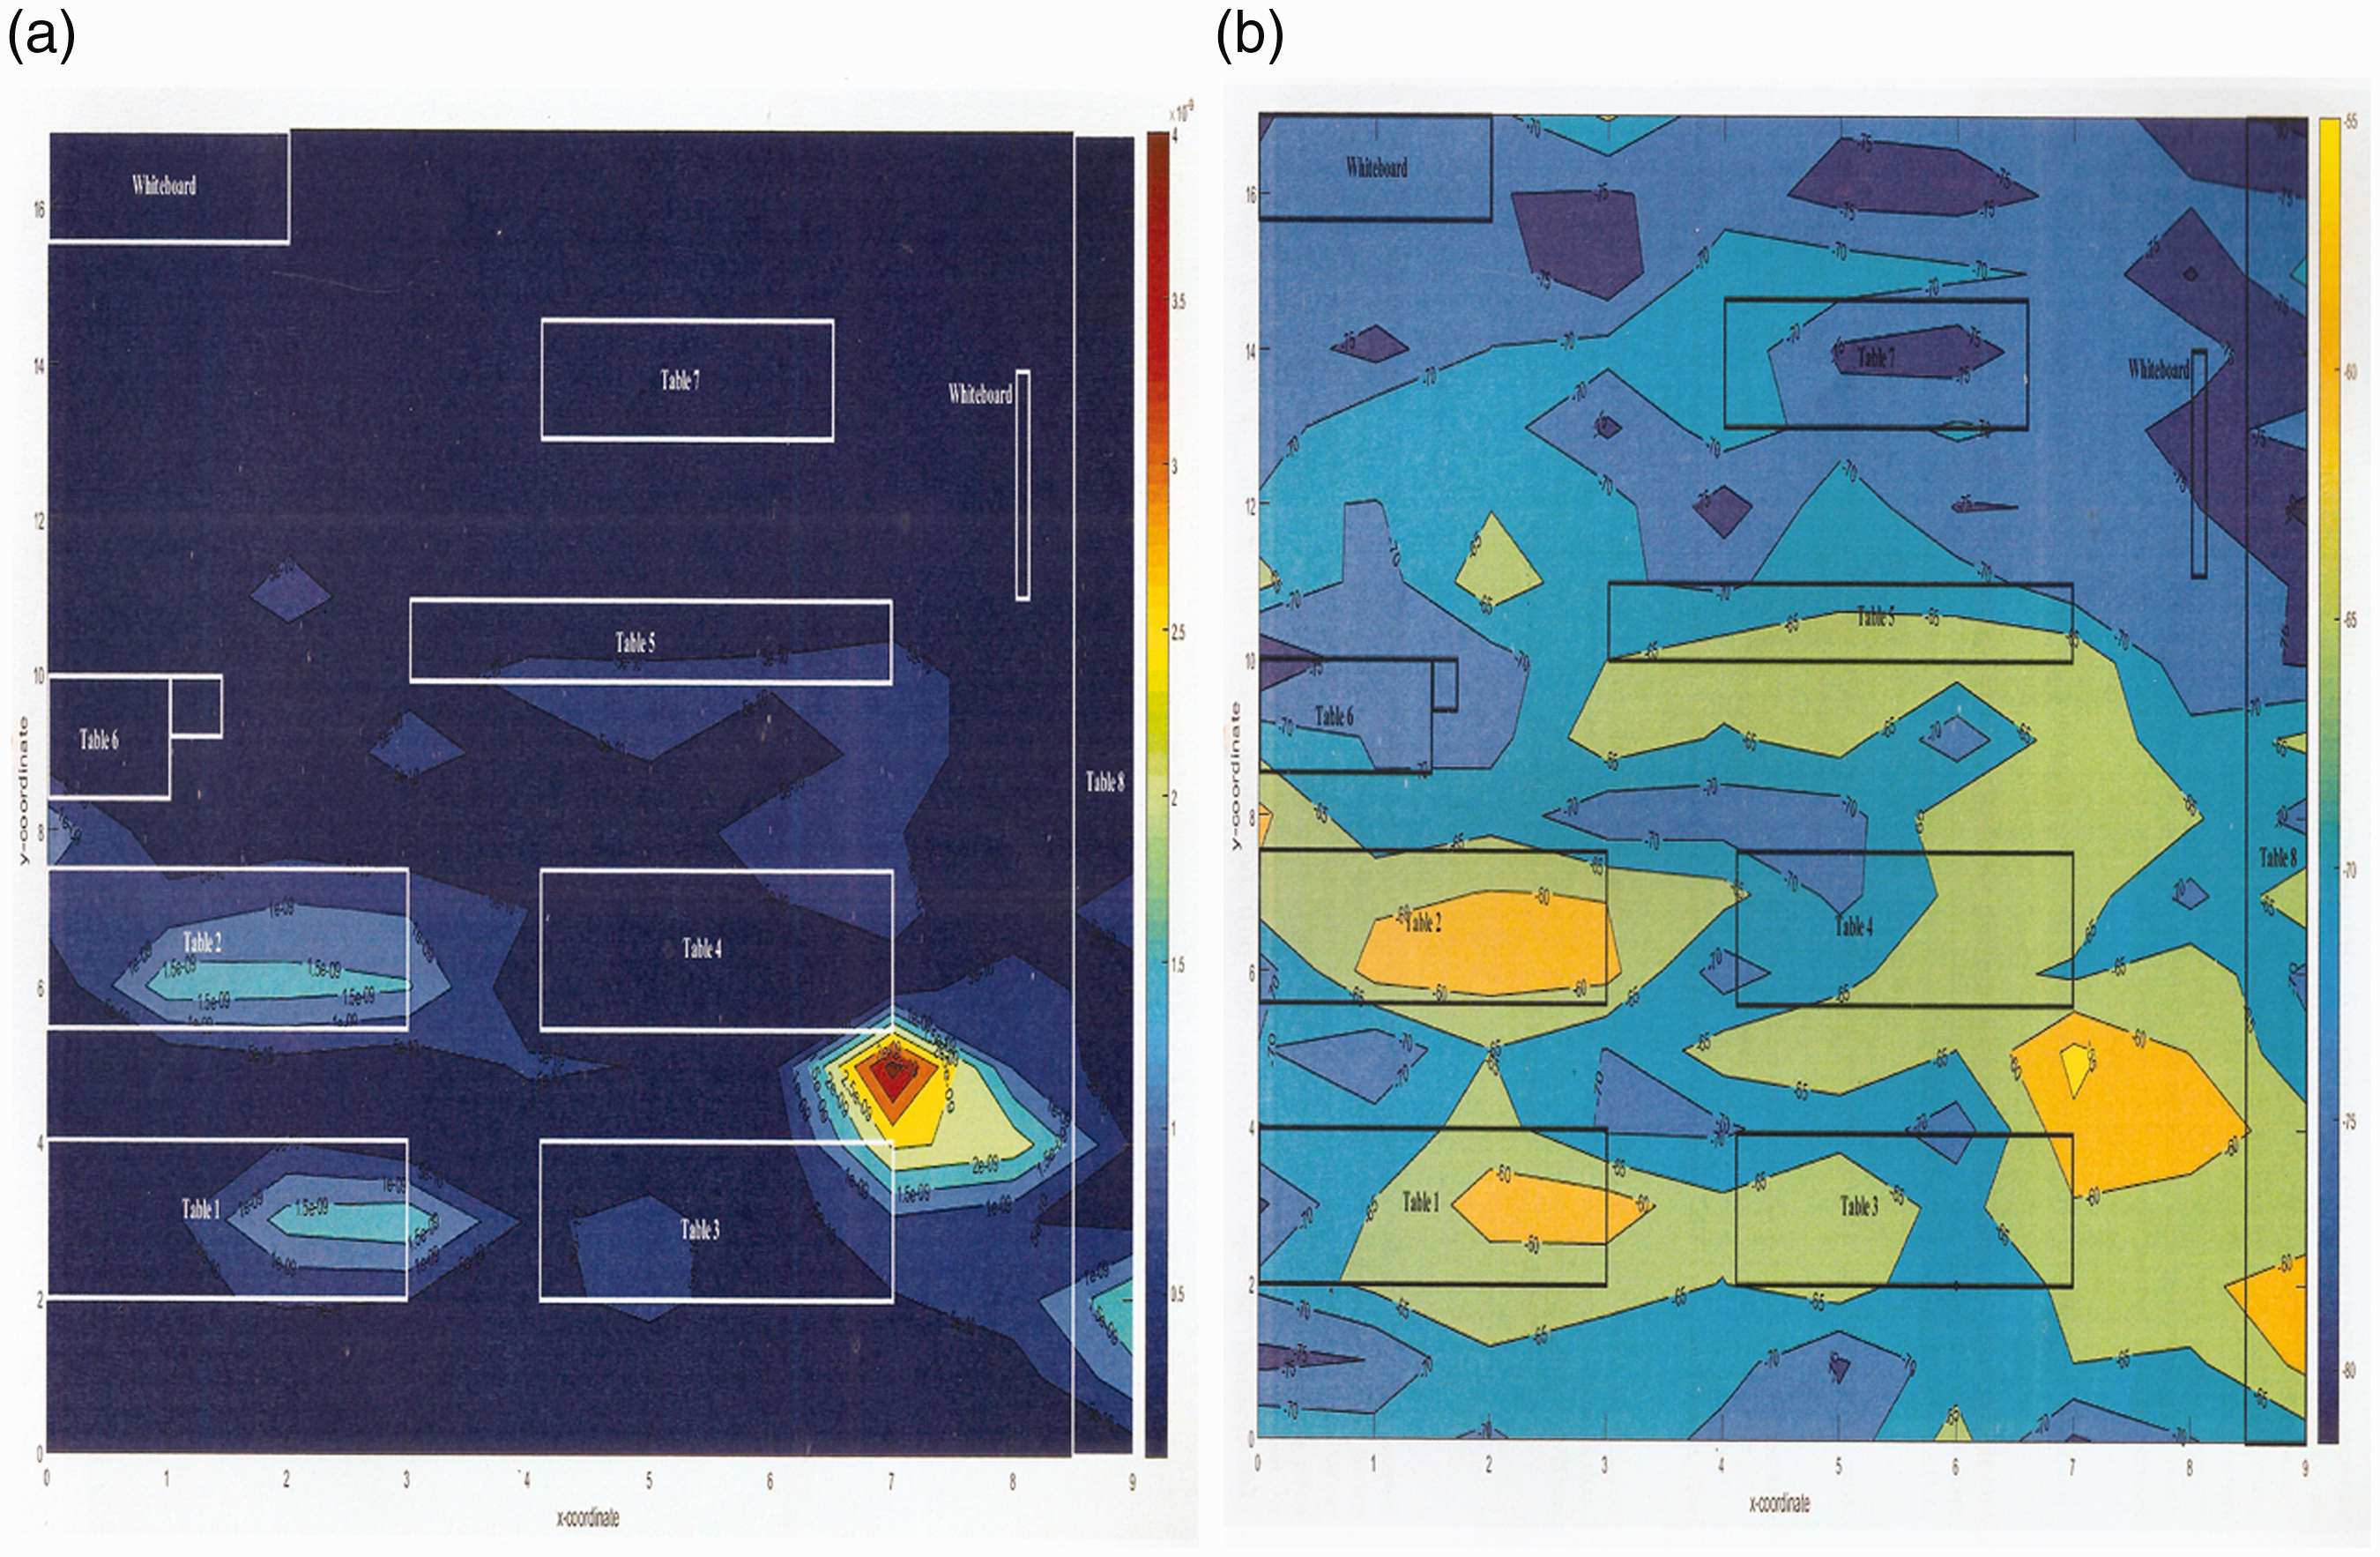
WiFi signal strength contour plots (a) in unit Watt and (b) in unit dBm (Student 1).
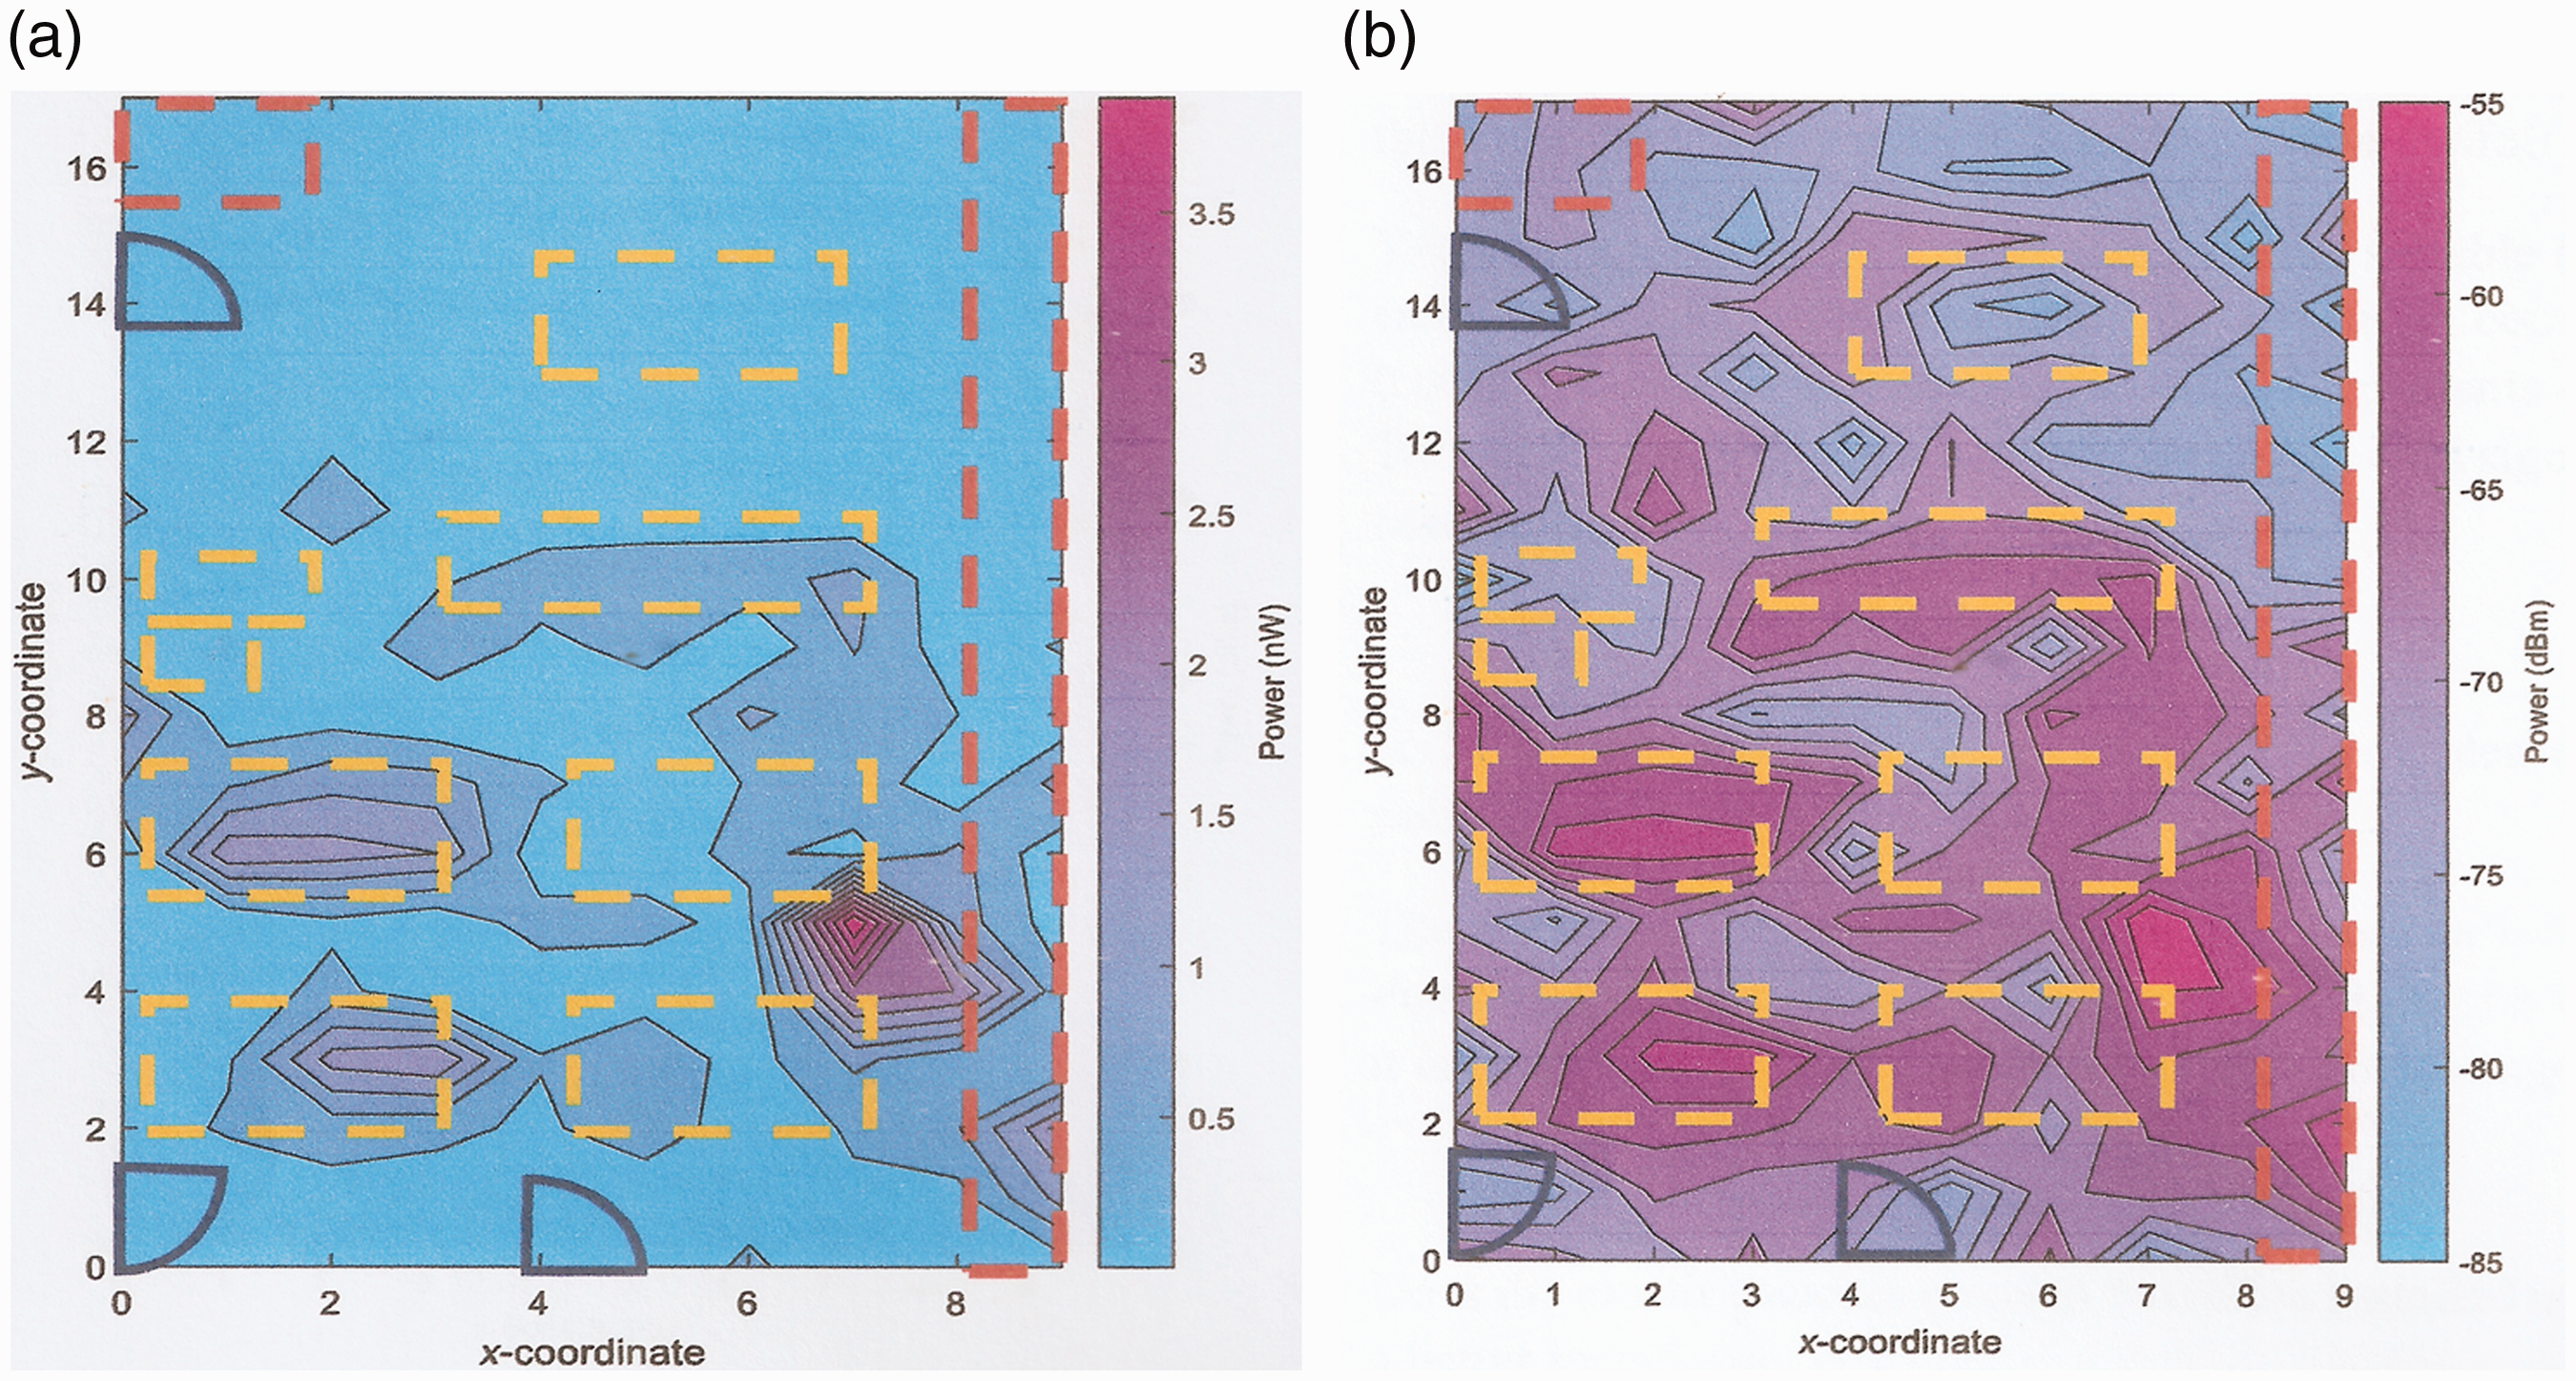
WiFi signal strength contour plots (a) in unit Watt and (b) in unit dBm (Student 2).
Conclusion
In this era, the development of microwave technology is growing rapidly, especially in the field of communication (future 5G technology and industry 4.0). Thus, the ME curriculum must include practical elements to equip undergraduate students for real working environment in the future. The practical assignments are designed to keep pace with basic skill requirements for recent microwave technology in the industry sector. In addition, the assignments are cost efficient and always refer to the fundamental content of the ME course. Indirectly, an assessment of the students’ achievement will be equitable, since there are some students who are proficient in solving a real practical problem, yet less efficient in answering the examination questions and vice versa.
The feedback of the undergraduate students is very good and positive after attending this subject. The students’ evaluation of revised teaching for ME course is tabulated in Table 3 in which the evaluation is separated into five main categories, namely (a) Teaching, (b) Delivery, (c) Assessment, (d) Relationship Between Lecturer and Students, and (e) Application of Generic Skills. Of course, the students cannot compare their learning competencies before and after the revised teaching method is implemented because they have never attended classes before the method was implemented. However, there are some postgraduates who attended this new class as a guest student telling that this class is very helpful in their research and strengthening ME’s basic knowledge.
Evaluation of teaching for ME course from third year undergraduate engineering students.
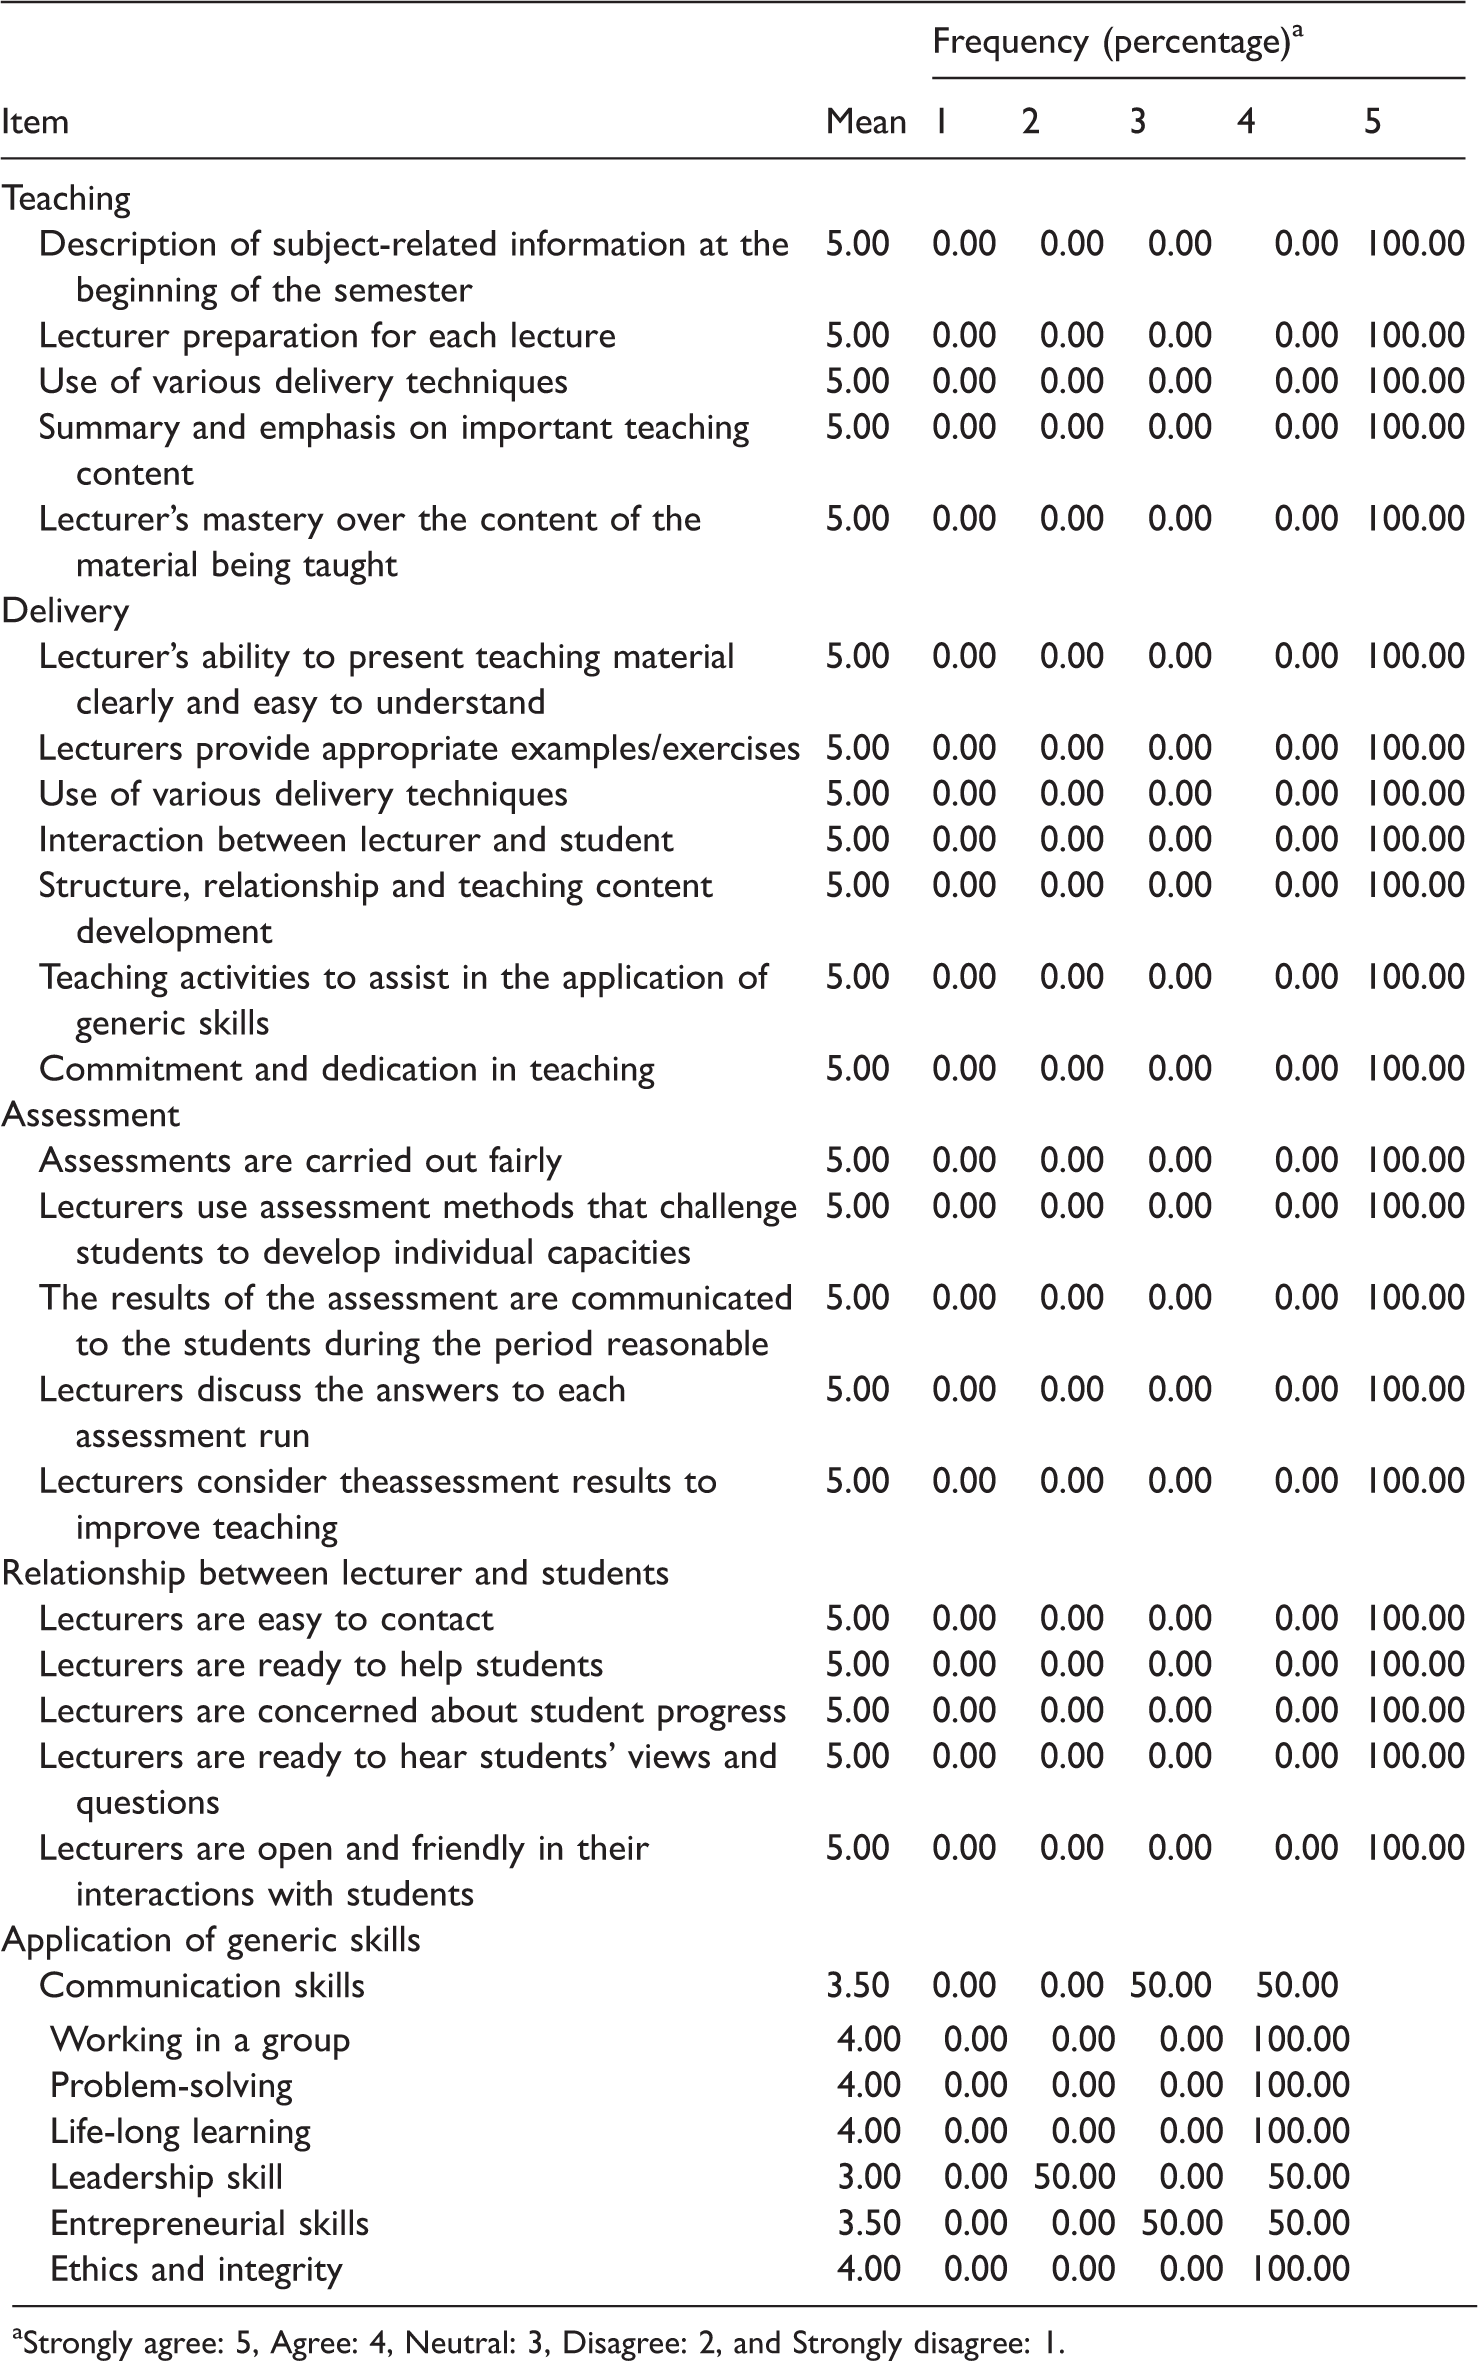
aStrongly agree: 5, Agree: 4, Neutral: 3, Disagree: 2, and Strongly disagree: 1.
Footnotes
Declaration of Conflicting Interests
The author(s) declared no potential conflicts of interest with respect to the research, authorship, and/or publication of this article.
Funding
The author(s) received no financial support for the research, authorship, and/or publication of this article.