
Abstract
Researchers have long theorized that characteristics of education systems impact both perceived and experienced corruption in public schools. However, due to insufficient cross-national survey data with measures on corruption in education and unassembled yet publicly available institutional data, there are few empirical tests of this theory. This article provides the rare direct test of the relationship between corruption in European public schools and three education system factors: government expenditure on education, education staff compensation, and teacher workload (pupil–teacher ratio). With a newly constructed harmonized data set for European countries, and controlling for national economic factors and individual characteristics, results of multilevel analyses suggest partial support for the theory that specific institutional characteristics of education systems impact public school corruption. The theorized institutional factors have different effects that depend on whether we examine bribe-giving experience or corruption perception. Results show that bribe-giving experience in public schools of Europe is weakly yet significantly related to education staff compensation. For corruption perception, low levels of government expenditure on education and a lopsided pupil–teacher ratio (too few teachers per student) increase the probability that people view corruption as prevalent.
Keywords
Introduction
Corruption in education is an umbrella term for different social relationships that imply violations of standards and expectations associated with entrusted power that benefit an individual, class, or group (Sabic-El-Rayess, 2013; Sabic-El-Rayess and Mansur, 2016; Waite and Allen, 2003). This possible benefit includes both potential material and nonmaterial gain, such as professional prestige (Heyneman, 2020; Sabic-El-Rayess and Heyneman, 2020). Examples of well-known forms of corruption in education are bribes, extortion of unofficial payments, nonmonetary favor reciprocations, inappropriate spending of government funds and parental contributions, extortion of private tutoring, 1 and non-merit selection of textbooks, as well as favoritism and nepotism in staff-related decisions (Bray, 2011; Heyneman, 2004; Kirya, 2019; Sabic-El-Rayess and Mansur, 2016; Transparency International, 2005, 2013). The forms and scale of corruption vary across types of public education institutions, such as primary, secondary, or high school; escalate on transition between school types during selection examinations; and differ depending on the position of the staff in educational governance (Chapman, 2002; Heyneman, 2004; Organisation for Economic Co-operation and Development (OECD), 2018). Differences in forms notwithstanding, corruption in education institutions—that people have often regular, repeated, and even compulsory contact with—has long-lasting harmful effects: it undermines institutional trust and confidence in education credentials, raises levels of social inequalities and social exclusion, and impacts people’s value orientations and life satisfaction (Ciziceno and Travaglino, 2019; Glendinning et al., 2019; Heath et al., 2016; Rothstein, 2011; Sabic-El-Rayess and Heyneman, 2020). Research on corruption in education comes mostly from the developing world; however, there is growing empirical evidence that various forms of corruption in schools occur in European countries as well (Bray, 2011; Hallak and Poisson, 2007; Heyneman, 2010; Nieuwbeerta et al., 2003; Rose and Peiffer, 2015; Sabic-El-Rayess and Heyneman, 2020; Transparency International, 2013).
The resources of public institutions that are determined by government expenditures along with the work conditions of public officials, including their wages, have long been theorized as important factors that impact education corruption (Hallak and Poisson, 2007; Heyneman, 2004; Sabic-El-Rayess and Heyneman, 2020). In addition, teacher workload is a factor that impacts job satisfaction, motivation, and involvement, which are related to the likelihood of professional misconduct (Averett and McLennan, 2004; Blatchford and Bassett, 2003). However, empirical assessments of these theoretical expectations, from a cross-national perspective especially, are rare. Current research on cross-national variation of corruption in public institutions generally examines differences in economic, political, and social contexts and often do not consider the institutional side and its relation to the perceived and experienced corruption in a specific sector (Heath et al., 2016). Yet comparative research provides a growing empirical evidence that institutional characteristics of education systems matter and they are related to different situation of individuals in these education settings, inter alia related to educational inequalities and educational returns (Hadjar and Gross, 2016).
This article contributes to advances in the field of corruption research in education via a newly constructed harmonized data set that integrates 31,578 respondent-level answers on both perception of corruption in the education sector and bribe-giving experience in public schools that were collected in 2010 in 30 European countries, with publicly available yet so far unassembled institutional characteristics. I use these multilevel data to address the question: To what extent do education system characteristics related to teachers’ working conditions explain cross-national variation in the education sector corruption in Europe, net of a country’s economic development, and individual-level determinants? 2 Specifically, the article develops hypotheses that take into account such education system characteristics as government expenditure on education, education staff compensation, and teacher workload as expressed by the pupil–teacher ratio, which are expected to matter for corruption outcomes above and beyond a country’s economic development and individual-level characteristics, such as respondents’ education and socio-demographics. I then test these hypotheses for two different conceptualizations of corruption in public schools: declared bribe-giving experience in schools and perceived corruption in the education sector, to see whether there are systematic differences in their determinants. Using both corruption experience and perception measures allows me to examine the extent to which contextual and individual-level determinants impact corruption perception once bribe-giving experience is controlled for while acknowledging that bribe-giving is only one of possible education corruption forms.
Corruption in public schools: theoretical considerations
Corruption in education is defined as an abuse of official position for monetary or nonmonetary gain of an individual, class, or group (Heyneman, 2020; Sabic-El-Rayess, 2013; Sabic-El-Rayess and Heyneman, 2020; Sabic-El-Rayess and Mansur, 2016).
In schools, corrupt acts are often collective, such as a bribe from the entire class to an examiner (Borcan et al., 2017; Sabic-El-Rayess and Mansur, 2016), may involve a complex net of interdependent actors (Ledeneva, 2006), and are interwoven with the gift-giving culture (Kubiak, 2003; Ledeneva, 2018). 3 When writing about the scale of the problem around the world, Stephens (2019) sums up that academic dishonesty is epidemic, common, contagious, and corrosive.
Corruption in education comes in many forms, such as bribery for access to education institutions, for getting better grades, or for turning a blind eye on academic dishonesty such as cheating or plagiarism; embezzlement of public goods; extortion of private tutoring or unofficial payments; and favoritism in hiring procedure of education staff or in recognition of academic achievements, among others (Hallak and Poisson, 2007).
Dominant forms of corruption vary across countries and social groups within a country, with elites preferring favor-based, nonpecuniary corruption acts and the poor tending to engage more in pecuniary corruption, such as bribe-giving (Sabic-El-Rayess and Mansur, 2016). Compared with other public institutions, like the police or health sector, many forms of corruption in education are nonmonetary and involve favor reciprocation (Heyneman, 2004, 2010; Sabic-El-Rayess and Heyneman, 2020; Sabic-El-Rayess and Mansur, 2016). In all its forms, corruption in public education is a threat to three main education pillars: access, quality, and equity (Hallak and Poisson, 2007; Osipian, 2008).
When studying the determinants of corruption experience and perceptions, social scientists show that this problem is not confined to dishonest individuals but also has structural causes (e.g. Heath et al., 2016). An individual’s likelihood of both becoming involved in corruption and perceiving an institution as corrupt depends on his or her position in the social structure, measured generally by education, occupation, and income, 4 as well as gender, age, and place of residence (Chatterjee and Ray, 2012; Lee and Guven, 2013; Mocan, 2008; Nieuwbeerta et al., 2003; Swamy et al., 2001; Tavits, 2010). In addition, the characteristics of the contexts (e.g. countries) within which people live matter. As Margaret Archer (2007) posits, individuals continuously and reflexively confront themselves with their social environments, and thus their actions are determined by social contexts, structural position, and individual motives.
In explaining the determinants of corruption cross-nationally, researchers often invoke the principal–agent model, which concentrates on the different forms of relationship between the principal (i.e. top level of public official and/or citizen) and agent (i.e. public official taking a bribe). In this framework, the decision to partake in corruption is seen as a cost–benefit analysis by individuals motivated by utility maximization (Becker and Stigler, 1974; Heath et al., 2016; Marquette and Peiffer, 2018; Rose-Ackerman, 1978). Recent critiques of the principal–agent theory underline that control and punishment mechanisms stemming from this model, which thus far have been the basis of many anti-corruption policies, are less helpful in the contexts of systemic corruption. Collective action theory may be a better fit in that context (Persson et al., 2019).
Collective action theorists emphasize the role of perceptions of the “rules of the game” in decisions on how individuals will act (Mungiu-Pippidi, 2015; Persson et al., 2019). The collective action dilemma is particularly important for understanding why actors that do not justify corruption may still act corruptly and also why perceptions matter (Čábelková and Hanousek, 2004; Zaloznaya et al., 2018). The relevance of collective action and principal–agent explanations seems to vary depending on the contexts, that is, whether corruption is endemic or rare. Although distinct in many ways, both approaches share the same logic of rational choice theory, yet differently approach the motives of individuals.
Another way to approach motives of individuals to partake in corrupt acts is through the lens of functionalist approach. Functionalists recognize that especially in contexts of weak institutions and lack of resources, corruption persists because it serves the function of solving problems (Marquette and Peiffer, 2018). Thus, decision to take part in a corrupt act may be forced by a lack of (perceived or actual) noncorrupt alternative of action. In the context of public schools, this approach sheds an important light to possible motives of large-scale informal payments for school maintenance in the context of underfinanced educational institutions.
The role of emotions and moral reasoning in the process of decision-making and its impact on professional ethics and perceptions is rarely discussed in current corruption research, although it was long theorized by behavioral economists and economic sociologists as relevant (Smith-Crowe and Warren, 2014; Wälde and Moors, 2017; Zelizer, 1994). Researchers in this field underline that work, particularly in some professions such as education sector workers, brings more than monetary benefit and costs more than can be measured by working hours (Lortie, 2000). As a result, satisfaction from one’s own work life along with feelings of hopelessness and worthlessness is important in understanding decisions and behavior at work, including professional ethics. Through the lens of this theory, corruption can be interpreted as the mode of emotional compensation for feelings of hopelessness and worthlessness that may be caused by low salaries, high workload, and poor work conditions, which, in turn, impact social relations in public schools.
Generally, cross-national research on corruption concentrates on the impact of the macro-level economic and political/legal factors (Collier, 2002; Heath et al., 2016; Judge et al., 2011). For example, comparative studies consistently show that countries with low levels of economic development tend to have high levels of perceived and experienced corruption (e.g. Heath et al., 2016). However, few studies explore the impact of sector-specific institutional characteristics on corruption.
At the same time, advancements in comparative education research suggest the link between the design of education systems (captured by institutional characteristics at the macro- and meso-levels) and educational inequalities and educational returns (at the individual, micro-level), which opens the debate about how and via which social processes this link occurs (Hadjar and Gross, 2016). Understanding the mechanism through which educational institutional setting impacts corrupt behavior or perceived corruption of individuals in these institutions contributes to this debate, as corruption and inequality have complex “reciprocal” causal relationship: inequality, on the one hand, is seen to create a context for corruption to breed, but, on the other hand, a highly corrupt context breeds social inequality (You, 2015).
The rationale for studying structural characteristics of institutions in explaining corruption can be traced back to the Weberian theory of ideal-type bureaucratic organizations, which suggests that bureaucratic factors such as meritocratic recruitment and competitive salaries, among others, may help combat corruption at work (Dahlström et al., 2012; Rauch and Evans, 2000). Similarly, Rose and Peiffer (2015) argue that other institutional characteristics, or “opportunity structures,” such as the frequency of contact with a public official within an institution also significantly relate to the probability of corruption. However, there is no unified view as to which set of sector-specific characteristics would impact corruption most or how these factors relate to individual-level determinants of corruption perception and experience.
In education research, there are theoretical expectations that the conditions in which actors—teachers, education staff—work, including their salaries and workload, and the resources of schools are of particular importance for the incidence of corruption (Hallak and Poisson, 2007; Heath et al., 2016; Rose and Peiffer, 2015). These characteristics, while partially determined by other structural characteristics, such as government expenditure on education, are likely to affect people’s perceptions of corruption in education and their bribe-giving behaviors in line with individual-level models of corruption. Following this type of reasoning, I include teacher workload as a relevant determinant of corruption in schools, along with government expenditure on education and staff compensations.
Government expenditure on education
Government expenditure on education and the use of these funds vary considerably across Europe. Cross-nationally, the education sector is one of the largest public sectors in the demand for human and financial resources (Reinikka and Smith, 2004). Schools need teachers and administration staff, but also buildings (which need regular care and renovations), facilities (from basic water and electricity to Internet and computers for classrooms), and textbooks and course materials, to name the few. Low-resource schools are visible to the community (Gupta et al., 2000; Jajkowicz and Drobiszová, 2015; Transparency International, 2005) 5 and create unsatisfactory working conditions (Collie et al., 2012). The resources of education institutions in a country are often determined by government expenditure on education.
In theory, insufficient government allocation to the education sector results in schools with fewer resources, which, in turn, impacts the quality of institutions and creates the context for petty corruption (Steiner-Khamsi et al., 2008). Lower resources for schools may promote more extortion of money from parents for basic school needs, such as textbooks or school supplies (Foltýnek and Dlabolová, 2020; Kirya, 2019), and may also create the emotional need for more compensation for the job as expressed in higher gift/bribe expectations from parents, because the value of the job is not expressed by the state (in line with the emotion-evoked collective corruption model; Smith-Crowe and Warren, 2014).
However, this relationship is distorted in highly corrupt environments that suffer from fund leakages (Chua, 1999; Delavallade, 2006; Mauro, 1998; Reinikka and Smith, 2004; Reinikka and Svensson, 2004; Shleifer and Vishny, 1993). This may account for the fact that, although case studies provide evidence that school resources impact school quality, in cross-national empirical analyses using allocation of government funds as a proxy measure for school resources, the impact on quality is less visible (Dolton and Marcenaro-Gutierrez, 2011; Ferraz et al., 2012; Gupta et al., 2000; Rajkumar and Swaroop, 2008). 6 In addition, Mauro (1998) provided early cross-national empirical evidence that grand corruption affects government expenditure composition, with highly corrupt countries spending relatively less on education, because this public sector offers limited opportunities for rent seeking and more possibilities for monitoring (see also Delavallade, 2006; Korneliussen, 2009).
There is relatively little research on how the relation between governmental funds for education and corruption plays out in Europe. The general expectation is that fund allocation is indicative of resources for the education sector and impacts the work conditions of education staff (European Commission/EACEA/Eurydice, 2014). Still, we should remember that European countries vary substantially in the type of funding system—for example, the different authorities (central, regional, and/or local), methods (funding formula vs budgetary approval/discretionary determination), and criteria (input-based and output performance-based) involved in resource allocation.
Education staff compensation
The amount of government funds allocated to education staff salaries is indicative of the financial situation of teachers, who are one of the key figures in high-quality education (Patrinos and Kagia, 2007). Underpaid teachers are a threat to education quality as, among other consequences, lower salaries make a teacher’s profession less attractive, decrease job selectivity, and thus lower the overall quality of teaching (Dolton and Marcenaro-Gutierrez, 2011; Lortie, 2000). Across nations, there is an association between a teacher’s pay and a teacher’s qualifications, as well as professional development (Ballou and Podgursky, 1997). Moreover, salary and benefit structures influence motivation and involvement in the job (Patico, 2002).
In line with rational choice and utility maximization theories, lower salaries may push teachers to seek additional sources of income, which, in turn, often negatively influences the quality of education institutions (Foltýnek and Dlabolová, 2020; Patrinos and Kagia, 2007; Van Rijckeghem and Weder, 2001). Such sources of alternative income include extra working hours and an additional part-time job but also different forms of corrupt behavior, such as enforced tutoring or bribe-giving (Morris and Polese, 2016; Patico, 2002; Patrinos and Kagia, 2007). 7
Low salaries for education staff are likely to create institutional conditions for petty corruption to flourish, especially in the forms of bribes, extortion of unofficial payments, and gifts as a supplement for insufficient income (Education Support Program (ESP)/National Education Policy Center (NEPC), 2010; Morris and Polese, 2016; Transparency International, 2013) or as emotional compensation for feelings of hopelessness and worthiness (linked to emotion-evoked models). However, there is also competing evidence that there is no significant relation between salaries of public officials and petty corruption (Miller et al., 2001; Tavits, 2010). Especially in highly corrupt societies, in which more than a quarter of citizens report paying bribes to public officials, high salaries of officials do not significantly relate to low petty corruption (Nieuwbeerta et al., 2003; Zaloznaya, 2017).
This mechanism can be understood through the length of the collective action theory, where motives to involve in a corrupt act are mainly related to the perceived “rules of the game” but not individual resources. Moreover, the perception itself that teachers are underpaid and schools are underfunded serves as (often socially accepted) justifications to involve in petty corruption. Thus, in the context of widespread petty corruption, increasing teacher salaries may decrease the perceived legitimacy of informal payments. Hockel et al. (2017) bring this argument in their important empirical study of parental migration effect on petty corruption in education in Moldova. Researchers find that although migration experience of parents increases their individual income (and possibility to bribe), it decreases the likelihood that migrant parent involves in bribe-giving (possibly due to the individual change in tolerance to corruption and perceived value of grades vs skills) (Hockel et al., 2017).
Teacher workload: pupil–teacher ratio
Education systems in Europe differ significantly in terms of pupil–teacher ratio, which constitutes an indicator of the workload of teachers and overall education system efficiency. The pupil–teacher ratio is calculated by dividing the number of pupils in a school by the number of all teachers in that school (including, for example, substitute teachers and teachers for children with special needs). It differs from class size, which equals the number of pupils per teacher in the class, not accounting for additional teaching personnel in the school (OECD, 2014).
The pupil–teacher ratio is related to the amount of education spending per pupil by the state (Blatchford and Bassett, 2003) as well as to teacher working conditions and outcome, such as allowing for greater innovation or increasing job satisfaction (Averett and McLennan, 2004; OECD, 2014). A higher pupil–teacher ratio is expected to lower motivation, involvement, and job satisfaction and thus increase the probability of professional misconduct (Averett and McLennan, 2004; Blatchford and Bassett, 2003). A lopsided pupil–teacher ratio—fewer teaching personnel in relation to students—can favor both actual and perceived corruption. Parents may be more likely to seek alternative ways of gaining extra attention from teachers, for example, via bribes, when teaching personnel is scarce. Also, in countries where schools are generally understaffed, people may be more likely to think that corruption occurs to “get things done.”
Theoretical model and hypotheses
Drawing on the theoretical considerations discussed above, Figure 1 outlines the expected relations among the individual-level, contextual, and institutional characteristics that should impact corruption outcomes. 8 The model also includes harmonization control variables (survey participation control), which capture methodological differences between surveys. The letter t denotes time. As depicted in Figure 1, macro-level variables are exogenous predictor variables measured at time t − 1, and micro-level variables are endogenous response variables measured in subsequent periods, at time t.
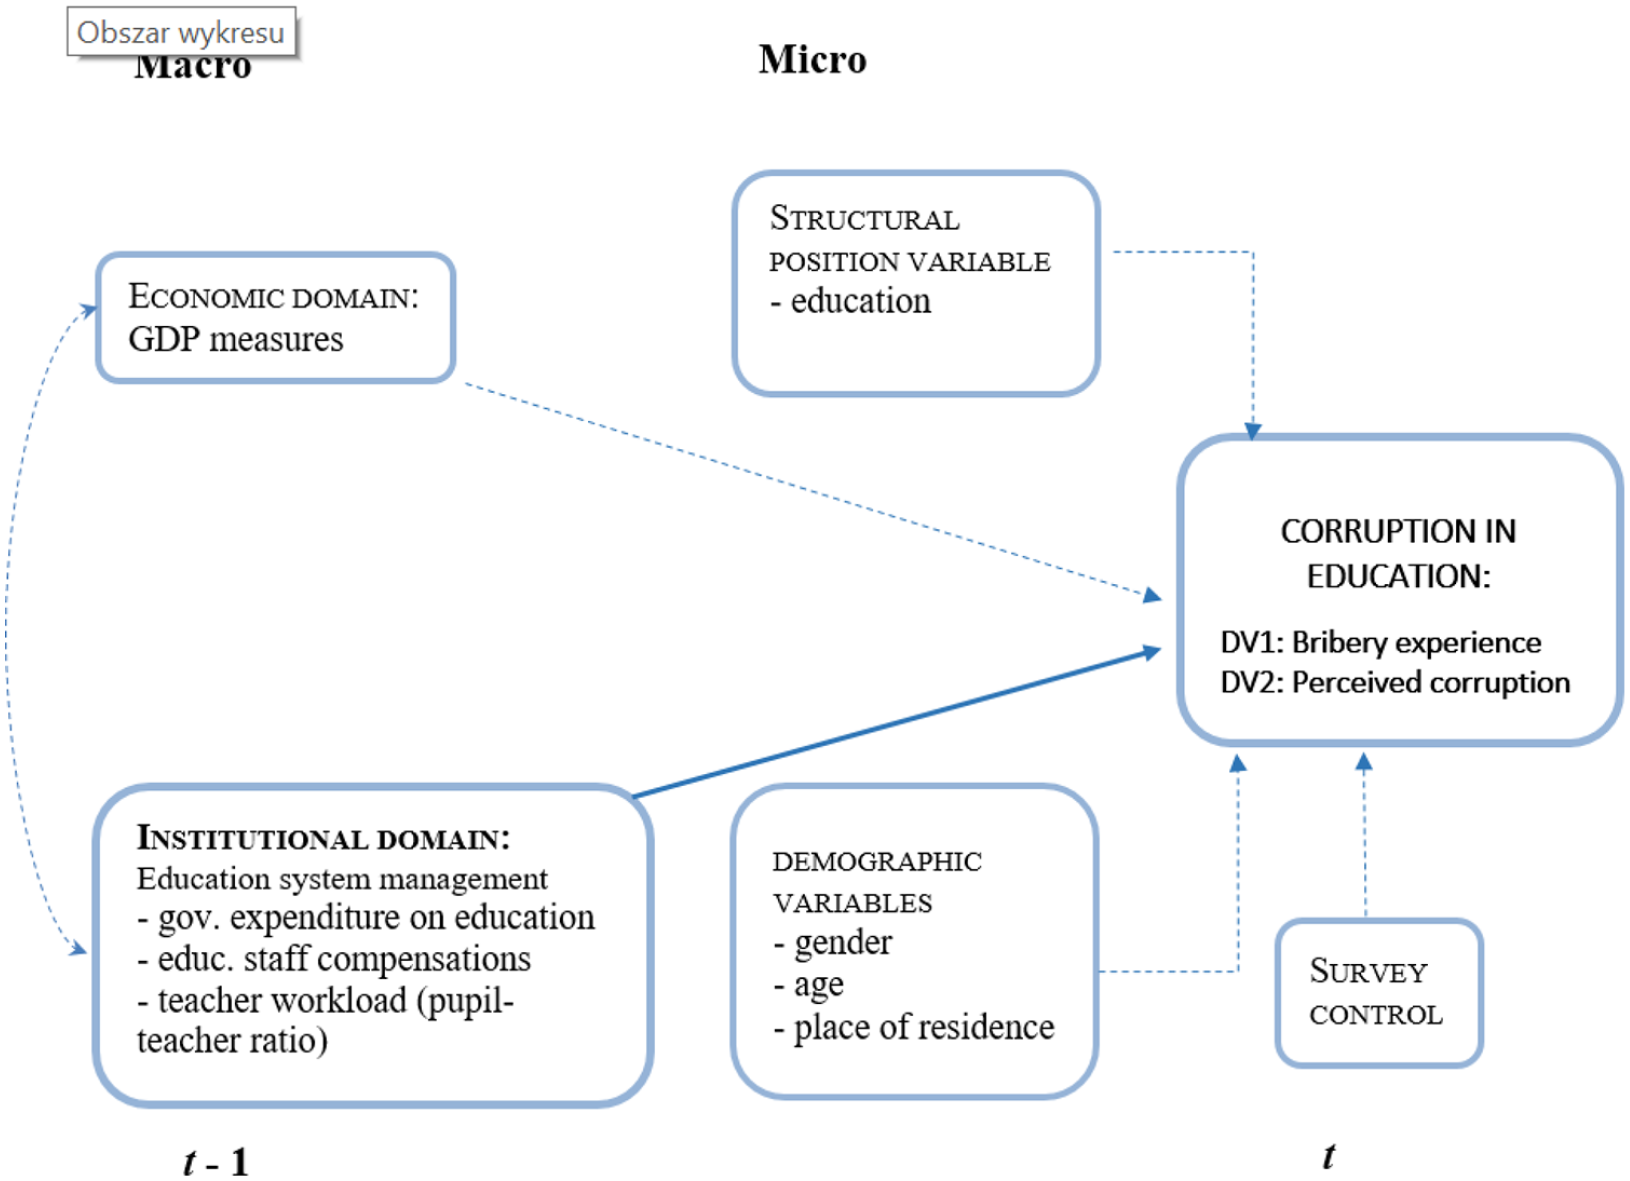
Simplified main relationships between variables tested in the research.
Next, Figure 2 presents the theoretical models for the two operationalizations of corruption outcomes in public schools that are tested in this article: first, corruption is measured by declared bribe-giving experience in schools, and second, by perceived occurrence of corruption in education. Both types of measures come from public opinion surveys.
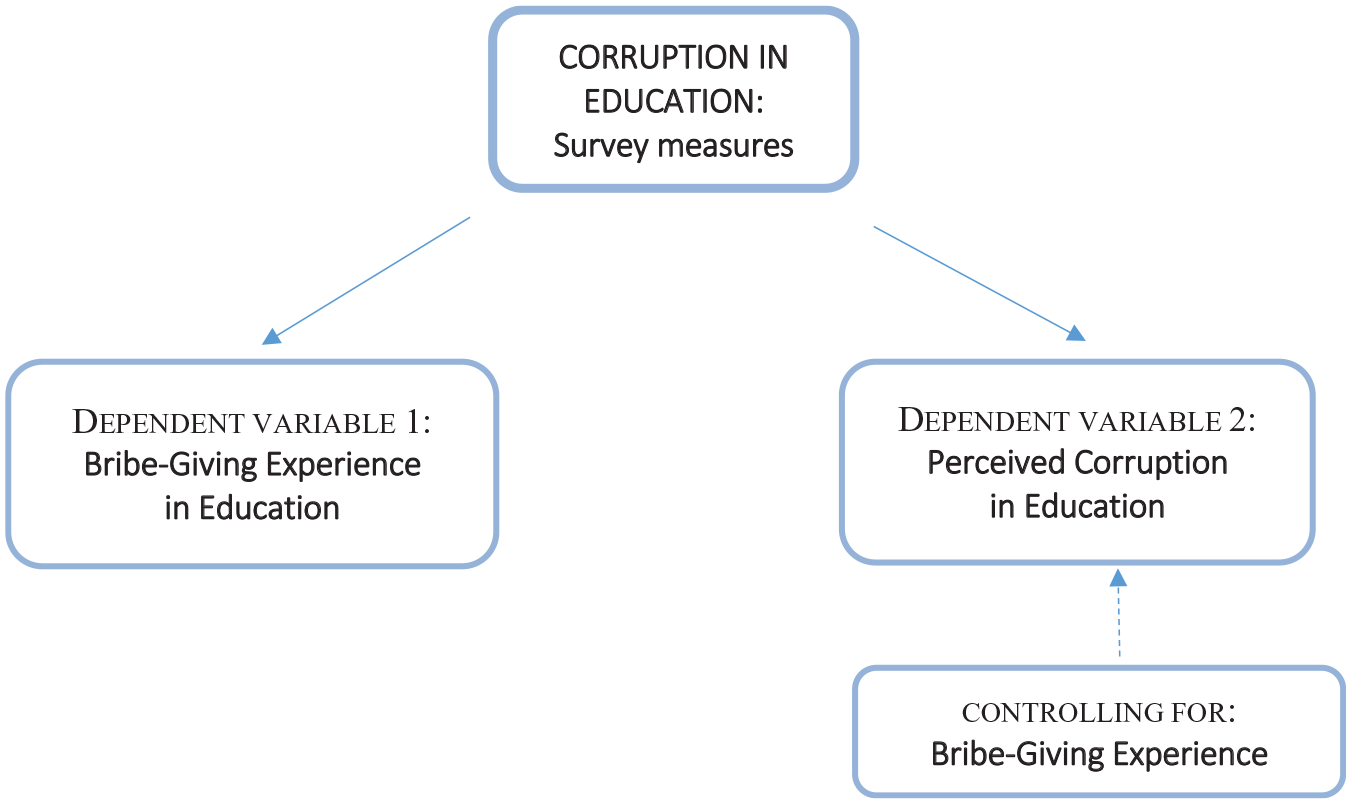
Measuring corruption: testing separate models for bribe-giving experience and perceived corruption in public schools.
Corruption perception versus bribe-giving experience indicators
The majority of studies rely on indicators of corruption perception. However, corruption experience measures (also called victimization measures) are becoming increasingly popular (Heath et al., 2016). It is largely assumed that corruption perception is informed by corruption experience, and thus these two indicators should be highly correlated. Under this view, corruption perception and experience would “share” some determinants, while others could be outcome specific. However, some scholars argue that perception indicators are not informed by experience alone and that they are “biased” by certain individual and country characteristics (Charron, 2016; Mocan, 2008; Wysmułek, 2017). If so, the relation between them should be weaker. The perception and experience of corruption measures also differ in their scope: While the corruption experience items ask about a specific form of corruption, such as bribe-giving, corruption perception items do not specify corruption forms, likely capturing both petty and grand corruption, and also monetary and nonmonetary corruption. The understanding that perceived corruption most probably captures also nonmonetary forms of corruption is particularly important in education institutions setting, where favor-reciprocation is frequent, and the dominant experienced form of corruption is strongly related to social status (Sabic-El-Rayess and Heyneman, 2020; Sabic-El-Rayess and Mansur, 2016).
The relation between corruption perception and bribe-giving can take three forms: (1) bribe-giving behavior influences the perception of corruption (Gutmann et al., 2015; Seligson, 2006), (2) corruption perception influences the bribe-giving behavior (i.e. contagion effect; Lee and Guven, 2013; Zaloznaya et al., 2018), and (3) the two are not related (or weakly related) since they measure different corruption forms (the weak relation observed by Mocan, 2008). These scenarios are not mutually exclusive and may occur together (Wysmułek, 2017).
This article takes the position that corruption perception is informed by experience but may also be related to certain external factors. The specific research hypotheses this article posits are the following:
Hypothesis 1. Controlling for national economic characteristics and an individual’s structural position, the lower the government expenditure on education, the greater the probability of bribe-giving experience and perceived corruption in public schools.
Hypothesis 2. Controlling for national economic characteristics and an individual’s structural position, the lower the educational staff compensation, the greater the probability of bribe-giving experience and perceived corruption in public schools.
Hypothesis 3. Controlling for national economic characteristics and an individual’s structural position, the larger the teacher’s pupil–teacher ratio, the greater the probability of bribe-giving experience and perceived corruption in public schools.
I follow the methodology of Seligson (2006) and Gutmann et al. (2015) to also test whether contextual and micro-level determinants impact corruption perception in schools once bribe-giving experience is controlled for (model type 2 in Figure 2).
Data and methods
The data this article relies on come from survey and non-survey sources. To analyze jointly responders’ characteristics and those of educational systems across Europe, I harmonized survey data ex post and appended them with institutional data from non-survey sources (hereafter, harmonized data set EDUCORR).
Individual-level corruption measures and sociodemographic indicators come from three well-known cross-national survey projects: the Life in Transition Survey (LITS), Global Corruption Barometer (GCB), and Quality of Government Survey (QoG). Macro-level measures of economic and educational system characteristics come from the World Economic Outlook Data of Econstats, the World Bank Education Statistics, and UNESCO Institute of Statistics Education Indicators (for details on sources, see Appendix 1). 9
Ex post survey data harmonization presupposes a series of measures applied to survey files not designed a priori as comparable to render select information suitable for comparative research (see Granda et al., 2010). While time-consuming and challenging, this procedure enables scholars to broaden country and topic coverage in individual survey projects and to lessen the bias of uneven country representation (Slomczynski and Tomescu-Dubrow, 2018; Tomescu-Dubrow and Slomczynski, 2016; Wysmułek, 2018). Ex post harmonization can also serve to overcome methodological limitations linked to rare case analysis, which is a problem often encountered in studying corruption experience and perception.
For building the harmonized data set EDUCORR, I pooled information from a total of 96 national surveys selected from LITS, GCB, and QoG. All were conducted in 2010, in 30 European countries. The year 2010 is the only period for which surveys on representative samples of a country’s adult populations and information on both perceived and experienced corruption in schools are available from a sufficiently large number of European countries to warrant multilevel regression analysis (Wysmułek, 2019).
While in general “education system” covers all formal education providers that are accredited to grant degrees or diplomas as well as the entities that set the conditions of their operation and monitor their performance (OECD, 2018), I focus in this article on the important element of national education systems: compulsory public schools and classroom teachers’ conditions in them. To do so, I included in my analysis only those respondents who declared recent contact with a local public school system (including primary and secondary schools, or vocational as specified in LITS 2010). The pooled data cover together 31,578 respondents. The individuals in my analyses are people who declared a recent contact with a local public school. The filtering question—for example, in QoG 2010, “Have you or any of your immediate family been enrolled or employed in the public school system in your area in the past 12 months? 1 = yes, 2 = no”—preceded the questions on corruption.
To harmonize individual-level variables, I followed the analytic framework of Survey Data Recycling (SDR), which provides a blueprint for ex post survey data harmonization and for integrating survey and other data sources to be used in substantive analysis (Slomczynski and Tomescu-Dubrow, 2018; Tomescu-Dubrow and Slomczynski, 2016). An important postulate in SDR is that new, harmonized, variables are a function of original (i.e. source) variables and harmonization control variables that capture important properties of the source items; the latter capture methodological variability and should be accounted for in regression analyses (Slomczynski and Tomescu-Dubrow, 2018). In this article, I use harmonization control variables that capture which survey project the source questions stem from to account for methodological differences between surveys and facilitate reliability assessments.
The resulting harmonized data set EDUCORR has individual-level measures of (1) self-reported acts of corruption in schools, (2) perceived occurrence of corruption in education, (3) respondent’s education level, (4) gender, (5) age, and (6) place of residence. This information is available for 30 European countries as follows: Bulgaria, Czech Republic, France, Germany, Hungary, Italy, Poland, Romania, and the United Kingdom appear in all three international survey projects included in this study. Austria, Denmark, Greece, the Netherlands, Portugal, and Spain appear in the GCB and QoG surveys. Armenia, Azerbaijan, Belarus, Bosnia, Croatia, Georgia, Kosovo, Latvia, Lithuania, Macedonia, Russia, Serbia, Slovenia, and Ukraine appear in the QoG and LITS surveys. Slovakia and Sweden appear in the GCB and LITS surveys. For all countries, I added economic and educational system characteristics measured in 2008–2009 (time-lagged Level 2 data relatively to Level 1 survey data) from the World Economic Outlook Data of Econstats, the World Bank Education Statistics, and UNESCO Institute of Statistics Education Indicators.
The first part of this article discusses survey data and covers 30 European countries and 31,578 respondents (see Figures 1 and 2). Yet in the second part of the article, the number of cases is reduced to 29 194 respondents from 27 countries (see Tables 1 to 4), due to the missing data for education system characteristics for some countries and to enable comparison between models. 10
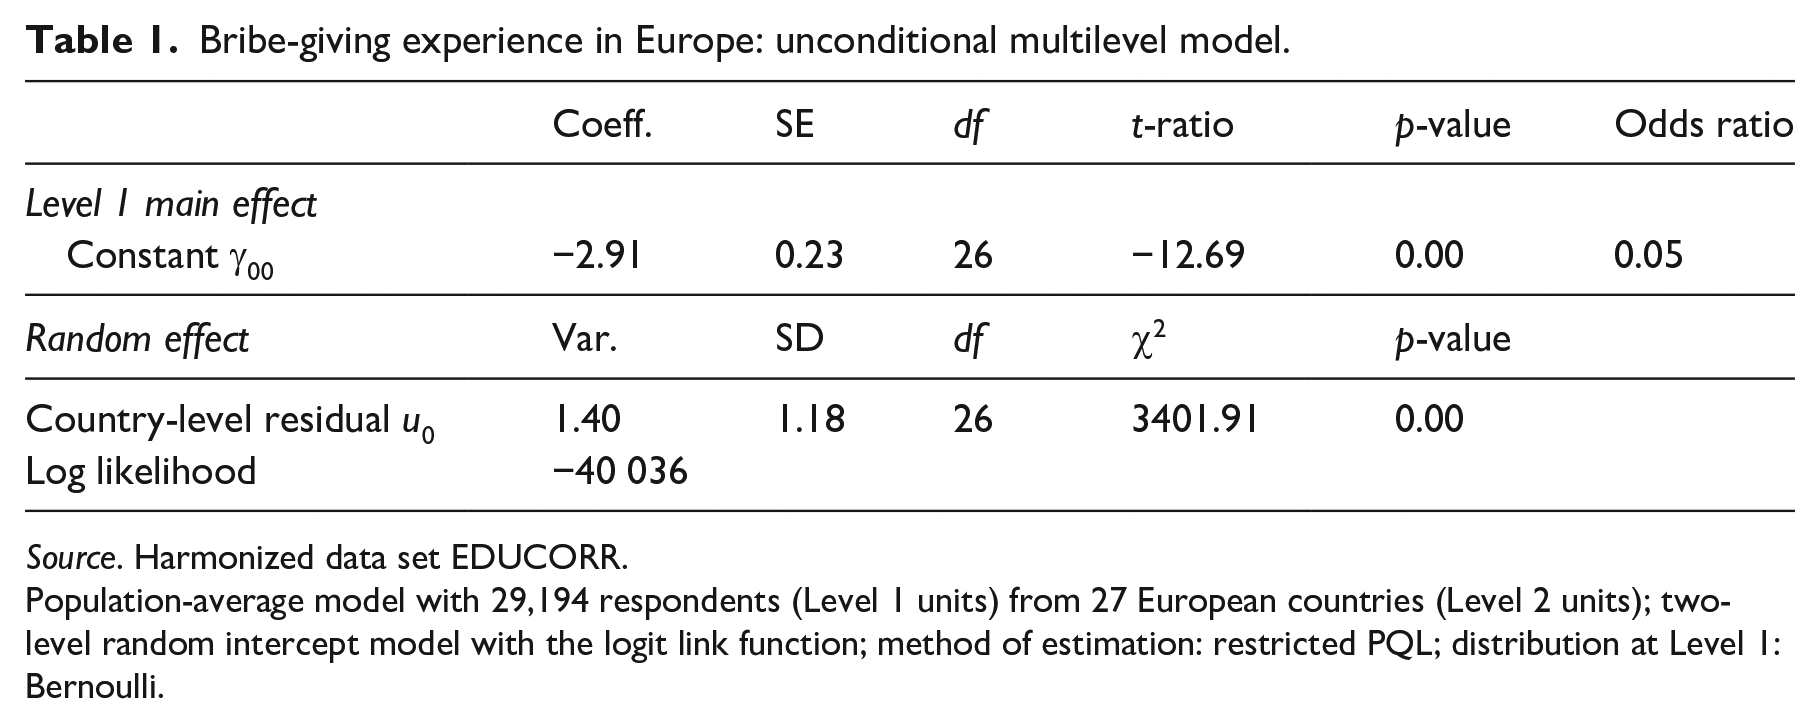
Bribe-giving experience in Europe: unconditional multilevel model.
Source. Harmonized data set EDUCORR.
Population-average model with 29,194 respondents (Level 1 units) from 27 European countries (Level 2 units); two-level random intercept model with the logit link function; method of estimation: restricted PQL; distribution at Level 1: Bernoulli.
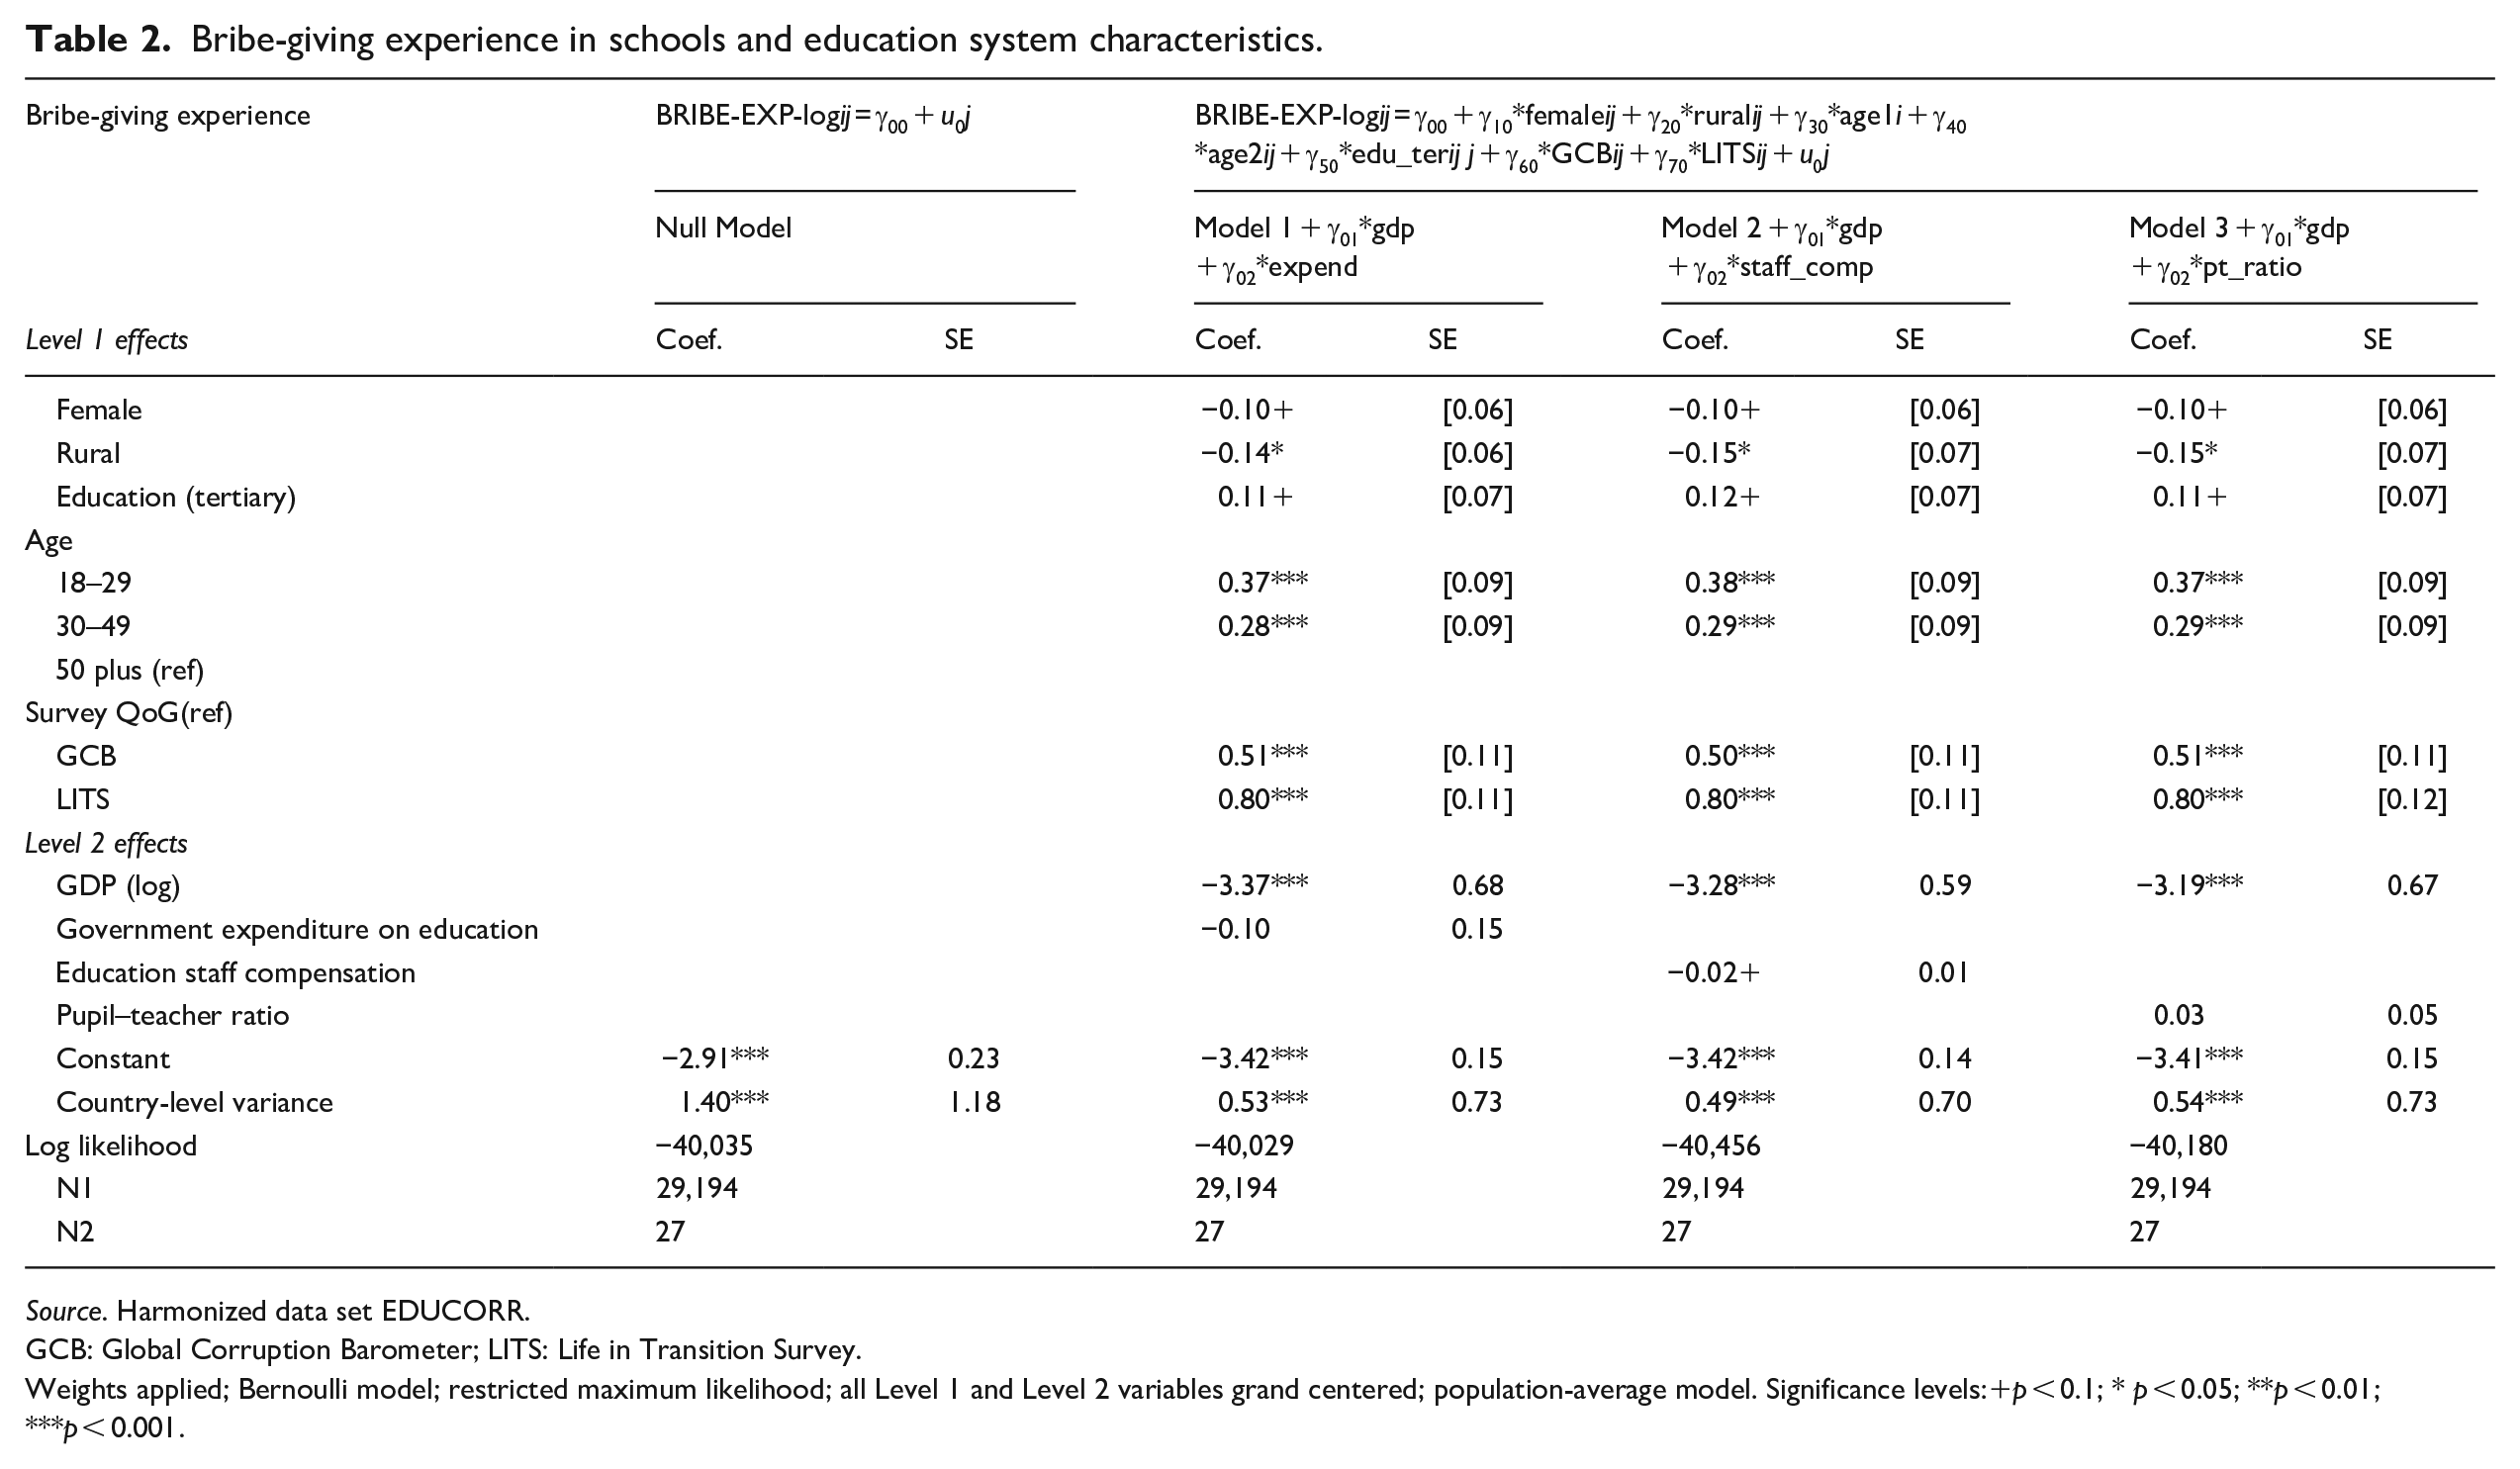
Bribe-giving experience in schools and education system characteristics.
Source. Harmonized data set EDUCORR.
GCB: Global Corruption Barometer; LITS: Life in Transition Survey.
Weights applied; Bernoulli model; restricted maximum likelihood; all Level 1 and Level 2 variables grand centered; population-average model. Significance levels:+p < 0.1; * p < 0.05; **p < 0.01; ***p < 0.001.
Perceived corruption in the education sector: unconditional multilevel model.
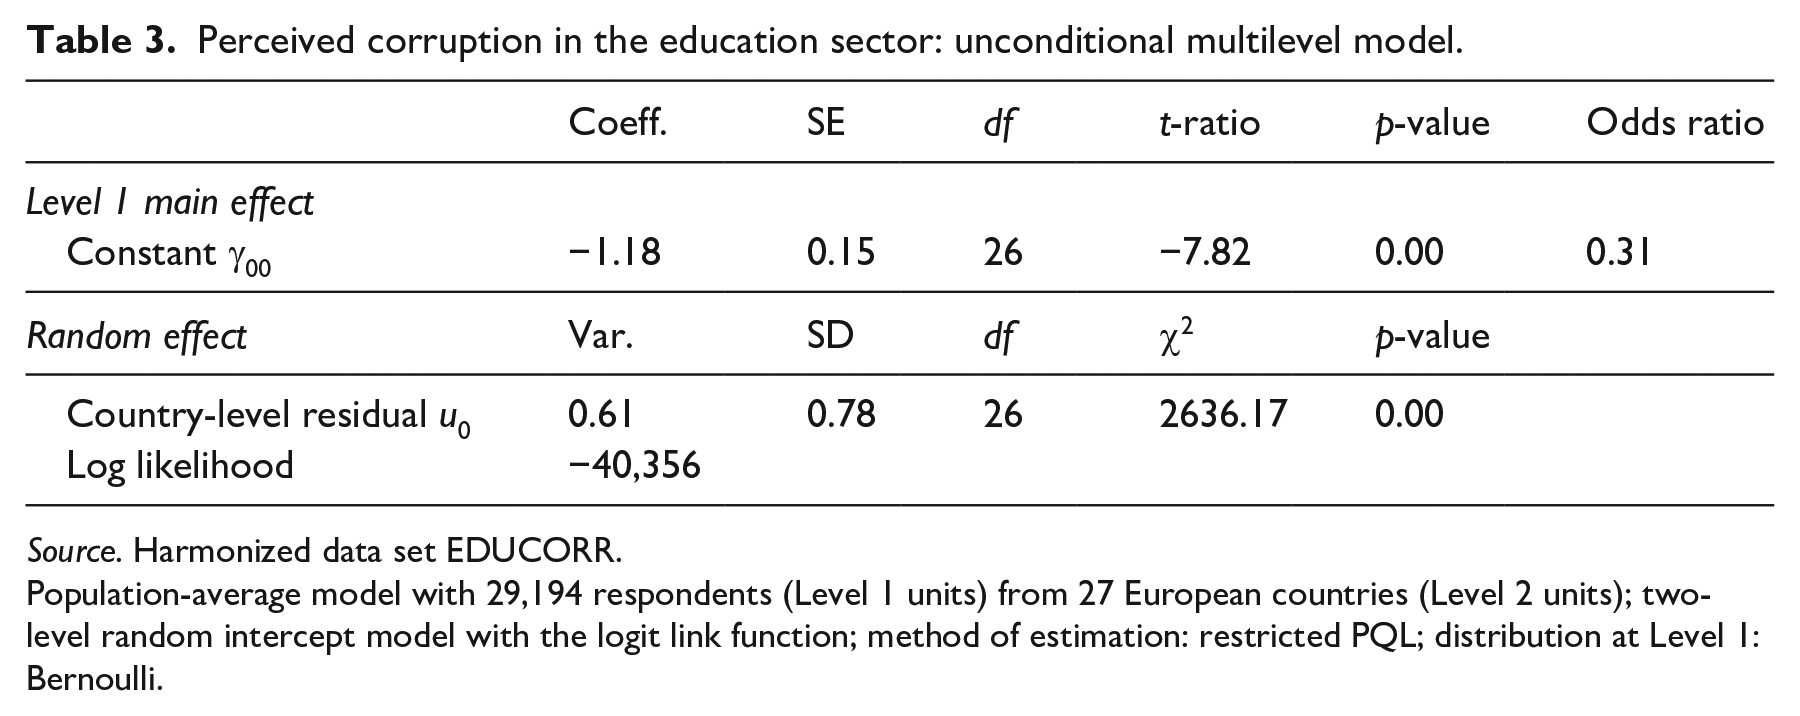
Source. Harmonized data set EDUCORR.
Population-average model with 29,194 respondents (Level 1 units) from 27 European countries (Level 2 units); two-level random intercept model with the logit link function; method of estimation: restricted PQL; distribution at Level 1: Bernoulli.
Perceived corruption in schools and education system characteristics.
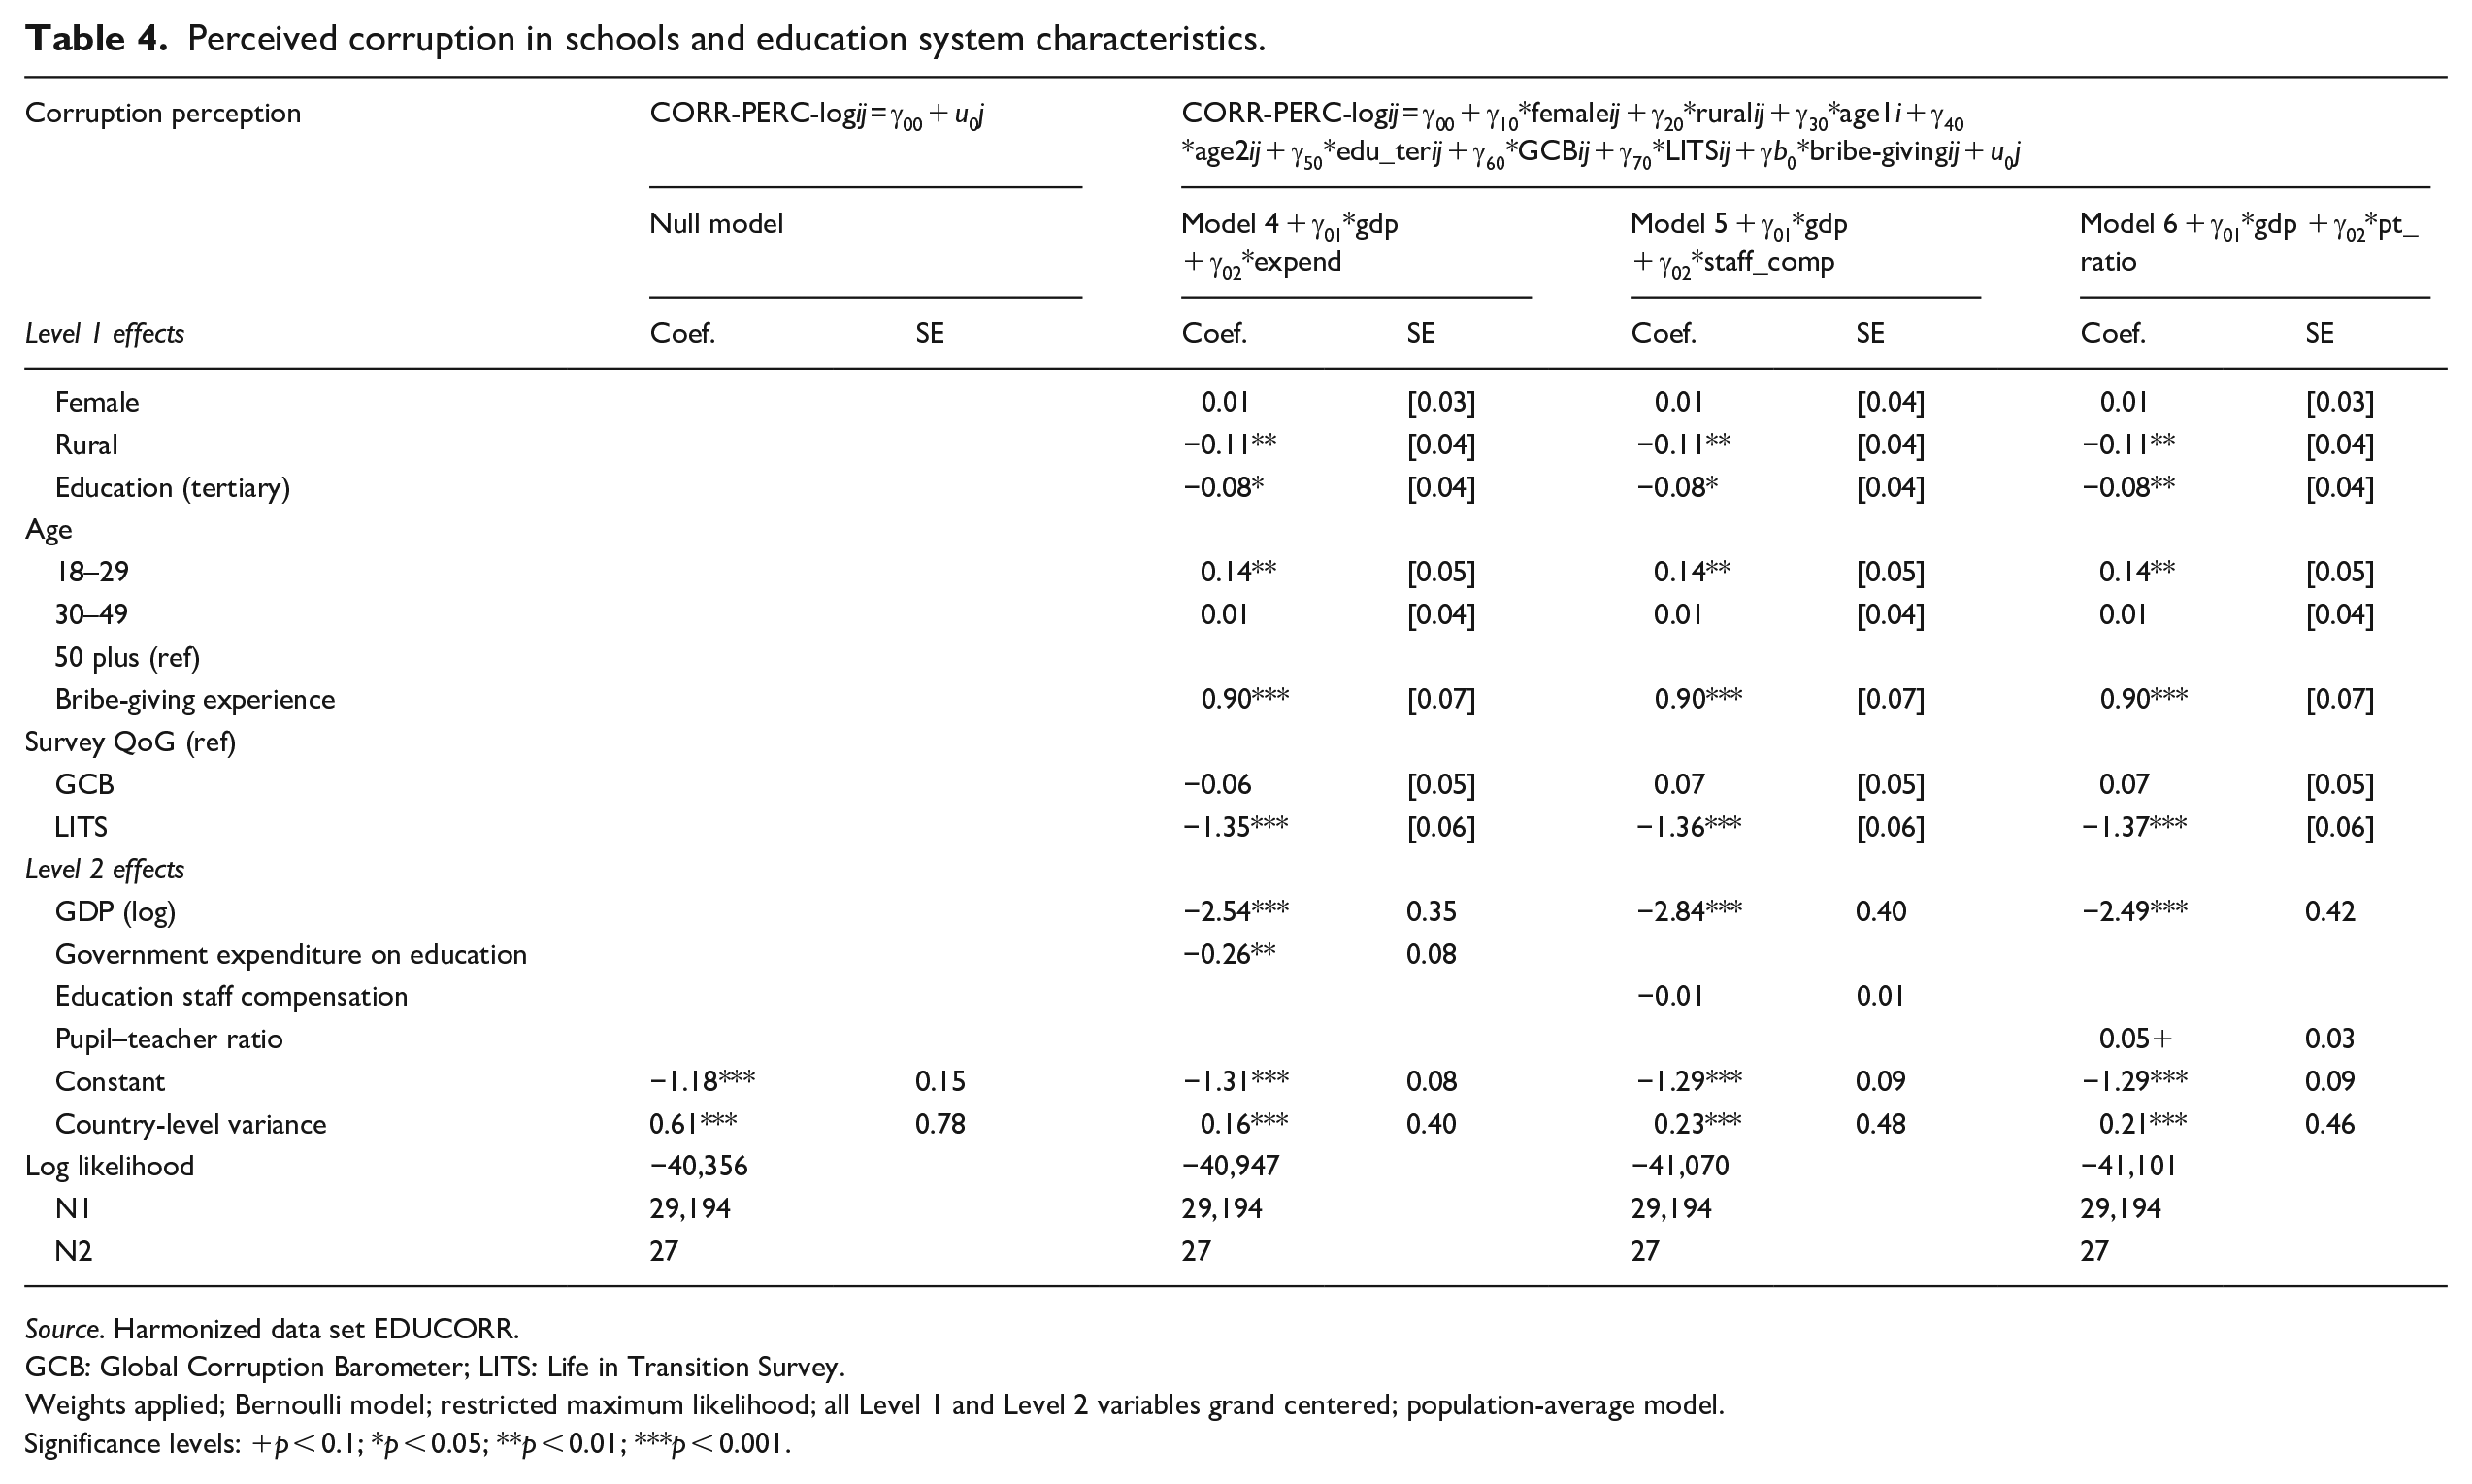
Source. Harmonized data set EDUCORR.
GCB: Global Corruption Barometer; LITS: Life in Transition Survey.
Weights applied; Bernoulli model; restricted maximum likelihood; all Level 1 and Level 2 variables grand centered; population-average model.
Significance levels: +p < 0.1; *p < 0.05; **p < 0.01; ***p < 0.001.
Descriptive statistics of harmonized variables and country-level indicators used throughout this article are presented in Appendix 2.
Dependent variables: bribe-giving experience and corruption perception measures
There are two main dependent variables in this study, both measured at the individual level: bribe-giving experience and corruption perception in the education sector.
Bribe-giving experience takes into account respondents’ answers to the questions of whether they gave bribes or made unofficial payments and/or gifts in a public educational institution setting within last 12 months (see Appendix 3 for source question formulations and details on mapping of source values to target); it is harmonized into a dichotomous variable. 11 The value 1 means “yes,” respondent or her household members experienced paying a bribe or giving an unofficial payment or expensive gift in the last year; the value 0 means no such experience, don’t know, or refused to answer. 12
Corruption perception takes into account respondents’ answers to the question of the perceived corruption as prevalent in the education sector (see Appendix 4 for source question formulations and details on mapping of source values to target). Originally, perceptions of corruption occurrence are measured via rating scales. These rating scales vary across source surveys: GCB asks about the extent of perceived corruption on the 5-point ascending unipolar scale from 1 “not at all” corrupt to 5 “extremely” corrupt; LITS asks about perceived frequency of corruption on the 5-point ascending scale from 1 “never” to 5 “always”; and QoG asks about the extent to which respondent agrees or disagrees with the statement that corruption in prevalent in local public schools, using 11-point scale from 0 “strongly agree” to 10 “strongly disagree.” Although the types of questions and scales are different in these three survey projects, they all intent to operationalize the same theoretical construct which is perceived corruption in local public schools. It allows us to speak about the group that perceives education sector as corrupt versus others, but limits reasonable comparison of the extent of that perception. For analyses in this article, I decided to construct the harmonized variable “corruption perception” as a dummy. I assigned the value 1 when respondents indicated that corruption is prevalent in the education sector and 0 otherwise. 13 I made the choice to dichotomize the harmonized corruption perception scale over, for example, linear stretching or distribution-based transformations of the scale (as described in, for example, Slomczynski and Skora, 2020), to gain comparability, simplicity and reliability (DeCoster et al., 2009; Marks et al., 2012).
In principle, both types of questions ask about all education staff, which includes classroom teachers, school directors, administration, and other personnel. Yet out of the most common types of actors in education corruption, (1) education officers (including teachers) responsible for procurement, (2) educational administration, and (3) classroom teachers (Tanaka, 2001), corruption among classroom teachers is the area most visible to the public, which has contact with schools. Although it is theoretically possible that, at the time of the interview, there had been a corruption procurement scandal in the local public school, such cases most likely do not dominate the data.
In the analysis section, I start with the models where the dependent variable is “bribe-giving experience” (see Tables 1 and 2). I then move to the models, where the dependent variable is “corruption perception,” controlling for bribe-giving experience (see Tables 3 and 4), to compare results on bribe-giving experience and general perception of corruption.
Independent variables: characteristics of education systems
There are three main independent variables, measured at the country level: (1) government expenditure on education (percentage of GDP), (2) total education staff compensation (percentage of total public expenditure on education), and (3) the measure of teacher workload (pupil–teacher ratio in primary education). Expenditure on education indicates public expenditure at all levels of education measured as the percentage of country’s GDP. Education staff compensation is a percentage of the total expenditure on public institutions (primary and secondary public schools) that goes to all education staff compensations. Pupil–teacher ratio is an education system efficiency indicator, equal to the number of pupils divided by the number of teachers in primary education institutions. The details on the sources of these measures are presented in Appendix 1, and their descriptive statistics are presented in Appendix 2.
Control variables: country level
GDP per capita in purchasing power parity (GDP pc PPP; Appendix 5) is taken from the World Economic Outlook Data, International Monetary Fund, compiled by Econstats (see Appendices 1 and 2). It is calculated by dividing the total value of goods and services produced in a country-year by a country’s midyear population and corrected for the differences in purchasing power across countries. I use logged GDP pc PPP in the models.
Previous research shows that countries with lower economic development are more likely to have a higher corruption level and this pattern holds for both perception and experiential measures of corruption (Heath et al., 2016). GDP per capita often highly correlates with other macro-level indicators, such as political regime and social inequality. 14
Control variables: individual level
Following the earlier discussion on theoretical considerations, in these analyses I examine whether the impact of institutional characteristics is net of respondent-level education and socio-demographics, specifically, gender, age, and place of residence. Education attainment is coded as a dummy variable, referring to tertiary education versus anything else. Gender is coded as a dummy variable, with 1 referring to female and 0 to male. Age is captured in three categories: 18–29 years old, 30–49 years old, and 50 years and older (which is a reference group in the models). Place of residence takes the value 1 for people who responded that they live in rural area and 0 otherwise (i.e. nonrural).
In addition to the control variables discussed above, analyses in this article also include a set of three harmonization control variables that measure what survey project a person responded to. Each harmonization control is a dummy variable, with the value 1 indicating that response comes from a given survey project: the variable GCB has the value 1 if the response came from a GCB 2010 survey and otherwise 0; the variable LITS has a value 1 for responses coming from LITS 2010 and otherwise 0; and the variable QoG has a value 1 for responses coming from QoG 2010 and otherwise 0. In the models, QoG is a reference group.
Analytical approach
To account for a complex structure of the data and include both macro and micro indicators in the models and to test models for dichotomous dependent variables, the multilevel generalized linear models are estimated using HLM7.25 software (Raudenbush et al., 2011).
In all tested models, individuals (Level 1) are nested in countries (Level 2) and the survey project effect (C) is controlled for. The general equation is
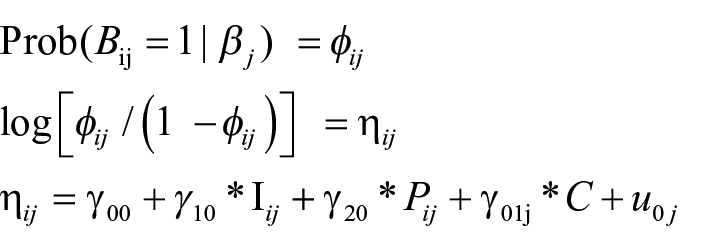
where i = an individual within a group and j = a group (a country),
This is a mixed-effects model, containing both fixed (
In the hierarchical generalized linear models with a binary dependent variable, the outcome is the log of the odds of success, in our case, a bribe-giving experience or perceiving corruption prevalence. The linkage between the log-odds and the probability is straightforward: The probability of outcome is restricted to the interval (0, 1), with log-odds equal 0 if the probability is in the middle (equals 0.5). If the probability is higher than 0.5, then the log-odds is positive and greater than unity. If the probability is lower than 0.5, then the log-odds is negative and the odds are less than 1. Thus, the log-odds can take on any real value. Predicted log-odds can be converted to predicted probability, which takes values between zero and unity (Raudenbush and Bryk, 2002).
To test the main article’s hypotheses, I use population-average models, which show the difference between log-odds of outcome of respondents having the same individual-level characteristics but living in countries differing in macro-level characteristics. The population-average model also shows how a change in country-level factors affects the overall mean. In my analyses, parameter estimations are obtained by the penalized quasi-likelihood (PQL) technique, which is most suitable for a small number of Level 2 units (countries).
Given the sampling procedure peculiarities of the source surveys and main analytical techniques for testing the hypotheses, it was necessary to construct the composite weight for an integrated microdata master file. 15 This weight consists of internal (QoG design) weight and external (sample size equalizing) weight. In all presented models in this article, the composite weight was applied.
Results
Descriptive overview
Data reveal large differences among European countries in the scale of perceived corruption in the education sector and declared bribe-giving experience. Opinions that corruption is prevalent in the education sector share more than half of respondents in Armenia, Azerbaijan, and Ukraine (58%, 57%, and 52% of respondents) and less than 10 percent of respondents in Denmark and Sweden (see Figure 3). There are also noticeable differences between declared levels of bribe-giving experience in countries of Europe. In 2010, Azerbaijan stood out with exceptionally high level of bribe-giving in the education sector. At the same time, less than 1 percent of respondents declared paying bribes in schools of Denmark, Sweden, Portugal, France, and Georgia. Figure 3 offers further details on the level of bribe-giving experience (percentage of respondents who declared giving a bribe) and perception of corruption (percentage who declared that corruption is prevalent in the education sector) in all analyzed European countries from three harmonized public opinion surveys.
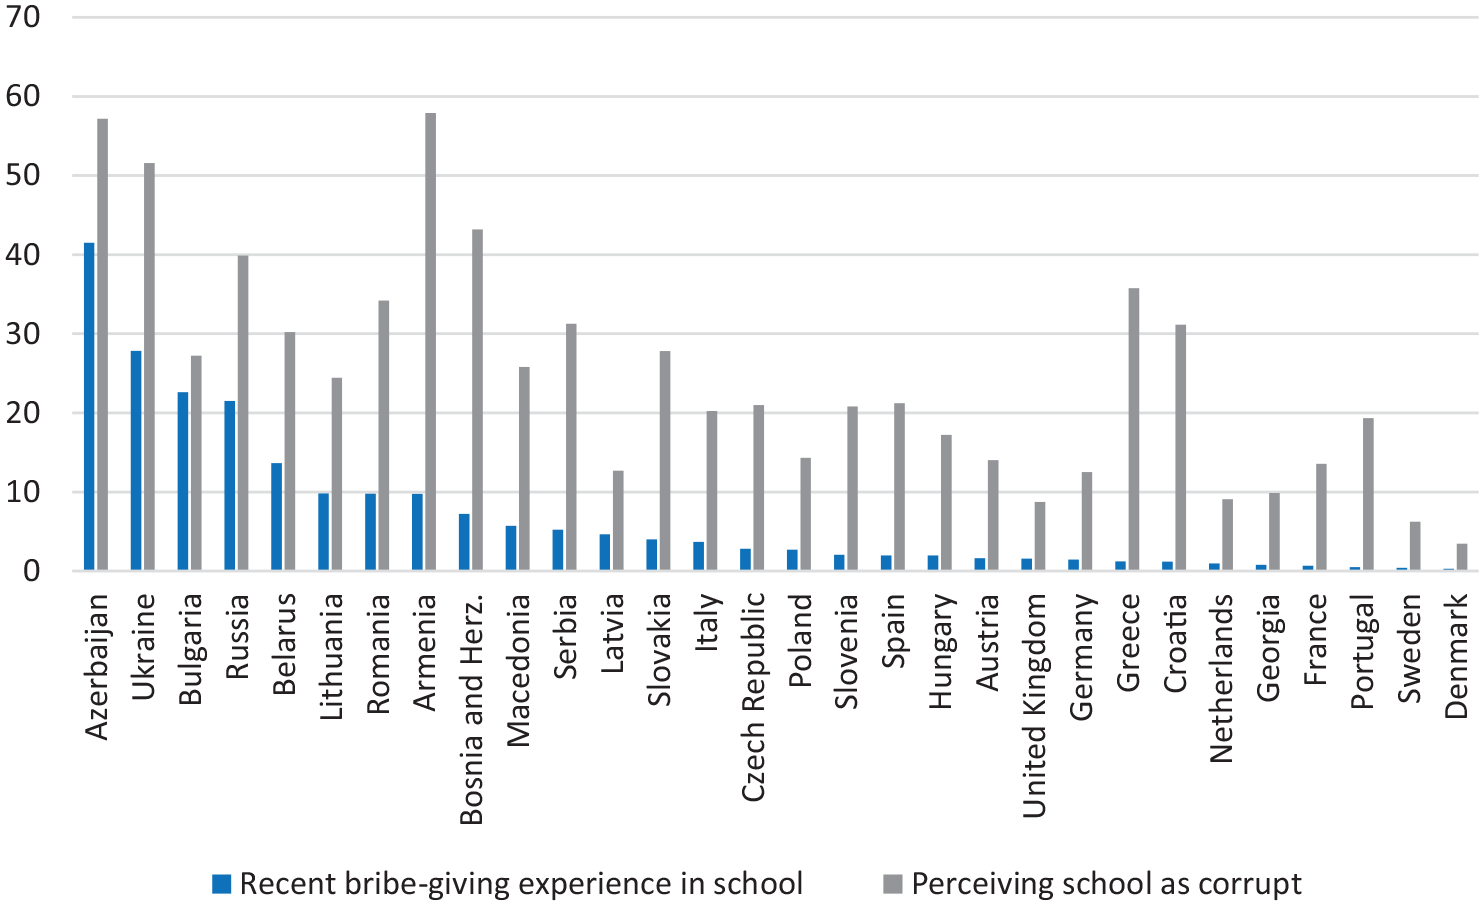
Countries: Percentage of respondents having bribe-giving experience in schools and perceiving schools as corrupt in Europe.
Overall, harmonized survey data show that across European countries, the opinion that corruption is prevalent in the education sector is widespread and relatively high, although the levels of reported bribe-giving in schools are relatively low: on average, 23 percent of respondents across Europe in 2010 perceived corruption in the education sector as prevalent, but only about 6 percent declared recent bribe-giving experience in schools.
In general, the correlation coefficient for harmonized indicators of corruption perception in schools and personal bribe-giving experience is positive and high (r = 0.75). At the same time, there are countries with relatively small bribe-giving experience but with highly pessimistic views on corruption prevalence in the education sector. The gap between declared bribe-giving experience and perception of corruption prevalence seems the greatest in postsocialist and southern countries (see Figure 3). For example, in Greece and Croatia, only 1 percent of respondents declared bribe-giving experiences in schools, but more than 30 percent view corruption in education sector as prevalent. A possible explanation of these large discrepancies may be that this is not bribe-giving but other forms of corruption, which are widespread in education sector of those countries.
Variation of bribe-giving experience in European countries
To test the impact of institutional factors on individual bribe-giving experience, we combined country-level and individual-level (harmonized) data from public opinion surveys, which was possible to do for 27 out of 30 countries due to country-level data limitations. First, Table 1 presents the results of the unconstrained hierarchical model which tests the null hypothesis that individual bribe-giving experiences significantly vary by country in Europe. The results show that the variability in individual bribe-giving experience by country is significantly different from 0 (the p-value of country-level residual is <0.001). 16 The unconstrained model also shows that generally in European countries included in the analysis, the proportion of people who said yes is 0.05 times the proportion of people who said no or don’t know.
Bribe-giving experience and education system characteristics
The analysis presented in Table 2, models 1–3, encompasses a variety of indicators that relate to the education sector, such as government expenditure on education (percentage of GDP), all education staff compensation (percentage of total public expenditure on education), and measure of working conditions (pupil–teacher ratio in primary education).
Model 1 shows that, controlling for GDP and individual characteristics, there is a weak negative association of government expenditure on education and bribe-giving experience in education, which means that the higher expenditure is associated with the lower levels of bribe-giving. However, the effect did not achieve statistical significance.
Model 2 shows that the percentage of government expenditure on education staff compensation is associated with bribe-giving experience. The higher the percentage of budget that goes to staff compensation in the education sector, the lower the likelihood that the respondent has bribe-giving experience in schools. This result is in line with previous research indicating that staff compensation is a regular inevitable cost that is more difficult to manipulate during the transfer of public funds (Hallak and Poisson, 2007). Thus, education staff compensation may be a better proxy for actual allocation of public resources to education than government expenditure itself.
Model 3 demonstrates a generally positive relationship between teacher workload expressed in the pupil–teacher ratio and bribe-giving experience in the education sector, although it does not achieve statistical significance after controlling for country-level GDP.
Variation of perceived corruption in the education sector in Europe
Similar to the bribe-giving experience, perceived corruption in the education sector significantly varies by country in Europe (see Table 3). The unconstrained model for perceived corruption shows that generally in the European countries included in the analysis, the proportion of people who perceive corruption as prevalent in the education sector is 0.31 times the proportion of people who think otherwise.
Perceived corruption and education system characteristics
The question arises if the determinants of bribe-giving experience significantly deviate from determinants of perceptions of corruption in the education sector? To examine these relations, Table 4 presents the results of models for corruption perception controlling for, among other things, personal bribe-giving experience.
On the level of individual predictors of corruption, models 4–6 show us that having personal bribe-giving experience is strongly related to the perception that corruption is prevalent in the education sector. Interestingly, the effects of government expenditure (model 4) and pupil–teacher ratio (model 6) become statistically significant for corruption perception. The results show that the lower the government expenditure, the greater the probability of perceived prevalence of corruption in the education sector. The likelihood of perceiving education as corrupt also increases with the higher pupil–teacher ratio (too few teachers per student). The direction of these effects is the same for bribe-giving experience, although they are less pronounced.
Conclusion
This article examined the cross-national variation of corruption perception and bribe-giving experience in schools in Europe and explored its sources. The main question posed in the article was how the characteristics of education systems explain cross-national variation of corruption in education in Europe. I also tested whether these effects are different for corruption perception and bribe-giving experience, net of a country’s economic development and individual-level social position. To do so, I constructed a harmonized data set of three public opinion surveys for European countries and combined it with characteristics of education systems in those countries.
Results confirm that both the perceived prevalence of overall corruption in public schools and experienced bribe-giving significantly vary across Europe. As of public opinion data for European countries from 2010, on average about 20 percent of respondents across Europe had an opinion that corruption in schools was widespread and 6 percent reported that they gave a bribe. As expected, the levels of perceived overall corruption in education sector were higher than the levels of declared bribe-giving in schools. It signals that the measure of perceived corruption in schools likely captures not only bribe-giving, but also other forms of corruption: monetary and nonmonetary, petty and grand corruption. In addition, the measures on bribe-giving in schools refer to the recent experience (12 months prior to the survey), but the perceived corruption measures from the harmonized surveys do not specify a time frame and refer to respondent’s opinion in general. Moreover, especially in some contexts, respondents may feel safer to speak about perceptions rather than report a corrupt act. Differences between measures notwithstanding, results show that the correlation between perceived corruption and experienced bribe-giving in schools is strong and significant.
In the article, I have tested the theory that education system factors have impact on corruption in schools for both perception-based and experience-based (bribe-giving) measures of corruption. Based on the results, the theory that such education system factors as the government expenditure on education, education staff compensation, and teacher workload (pupil–teacher ratio) are associated with corruption in schools has an empirical support, although the strength and significance of their associations are related to corruption measures. This main finding of the article is in line with the previous research that explores the link between the macro-level characteristics of education systems and (micro-level) inequalities and returns to education (Hadjar and Gross, 2016). By concentrating on corruption, this article contributes to this discussion by highlighting yet another mechanism through which educational institutional setting impacts perceived quality of schools and experienced social inequalities and malpractices in education.
The results of analysis have shown that education staff compensation in European countries is related to bribe-giving in schools. The higher the percentage of budget assigned to salaries of teachers and other education staff, the lower the likelihood of experiencing bribe-giving in schools, controlling for country’s economic development and an individual’s social position. Based on the available survey data from 2010, this relation of percentage of the budget allocated to salaries and bribe-giving is significant although not very strong.
Based on previous research, there are a few possible explanations of this result. Lower salaries may (1) push teachers and other education staff to seek for additional sources of income (in line with problem-solving approach to corruption); (2) make professions in education sector less attractive, decrease job selectivity, and make retaining experienced teachers more difficult; (3) create the need for emotional compensation of the job’s value expressed in higher gift/bribe expectations from parents; or (4) lower motivation and involvement in the job and thus increase the probability of misconduct (in line with the emotion-evoked collective corruption model) and (5) increase perceived need of parents to supplement teacher’s wages.
Does it mean that increasing salary of teachers and other education staff would decrease bribe-giving in schools? Unfortunately this mechanism is more complex and such recommendation cannot be straightforward. Collective action theory suggests that although justifications to partake in petty corruption may relate to perception that teachers are underpaid and schools are underfunded, yet these are not the varying salaries in education sector but rather perceived action of other actors that impact decisions to behave corruptly. Thus, the change in salaries and school resources (i.e. governmental increase in funding) may have a context-specific effect on corruption, depending among others on existing social norms and perceptions. In other words, in the context of a widespread corruption the (high or low) salaries of public officials themselves are not expected to relate to corruption (which is more related to the perceived “rules of the game” but not individual resources). Yet at the same time, the very act of an increase of the salary may decrease the perceived legitimacy of bribes and other forms of corruption as supplements for lacking wages. This relation between staff compensation and bribe-giving calls for more detailed exploration in future research, which could unpack different types of government expenditures and add longitudinal perspective.
More attention is needed for the quality of work life of teachers, job satisfaction, and possible feelings of worthiness and hopelessness, which above and beyond monetary compensation for work may impact corruption and professional misconduct in the education sector. For example, budget cuts may not only impact salaries and hours but also the amount of teacher assistance and other educational staff, including child psychologists and school janitors. We should understand the occupational worlds of teachers to recognize that their feeling of exploitation in monetary and nonmonetary realms may lead to a violation of professional standards. The theory that school resources and teacher working conditions, including wages and workload, impact the likelihood of perceived and experienced corruption through the mechanism of emotion-evoked compensation may be useful for contexts outside of Europe as well. Further research on corruption as a mode for emotional compensation is needed, to test this theory with both qualitative and quantitative data.
Another important result of the empirical analysis of this article is that different individual- and contextual-level predictors have an independent and significant effect on corruption perception, even after controlling for bribe-giving experience. Lower government expenditures and a lopsided (higher) pupil–teacher ratio are associated with an individual’s greater likelihood to perceive public schools as corrupt. It means that underfunded and overcrowded schools are visible to the community and impact the overall perception of the quality of education institutions, irrespectively of having or not a “direct” recent experience of giving a bribe. Also, we may expect that in the context of underfunded schools there are other corrupt mechanisms (than bribe-giving) that compensate for the lacking resources for school maintenance and that are captured by the measure of perceived corruption, such as, for example, extortion of informal payments or nonmonetary favor reciprocation. This effect of education system characteristics on corruption perception after controlling for bribe-giving experience (in other words, independently if someone gave a bribe) calls for more disaggregated sector-specific survey measures to study different forms of corruption in education to develop tangible anti-corruption policies.
Within Europe, the available cross-national data on corruption in the education sector are still rare, and measures of corruption are often broad-brush, which limits the possibility for a disaggregated sector-specific approach. Precision and comparability of available measures of corruption are the main limitations of this study. To remedy these limitations, future survey questions on corruption should be more specific. We need to be able to distinguish among sectors, private and public schools, education levels, and forms of corruption. Moreover, corruption research would benefit from data that distinguish between individual and collective corruption. Collective bribe-giving is a popular form of corruption in schools, but it is under-researched due to the data limitations. Another form of corruption that calls for special attention in cross-national research is private tutoring—which is rarely explicitly questioned.
Another challenge is data on education system characteristics. Longitudinal and more detailed measures of education systems, quality of work life, and job satisfaction in the education sector are desirable for further development of this empirical research. For example, longitudinal data may allow us to test the hypothesis on the relationship of corruption with centralization of examination system, which is an important direction for future research.
Footnotes
Appendix
Spearman’s rank correlations of country-level variables (N = 27 European countries).
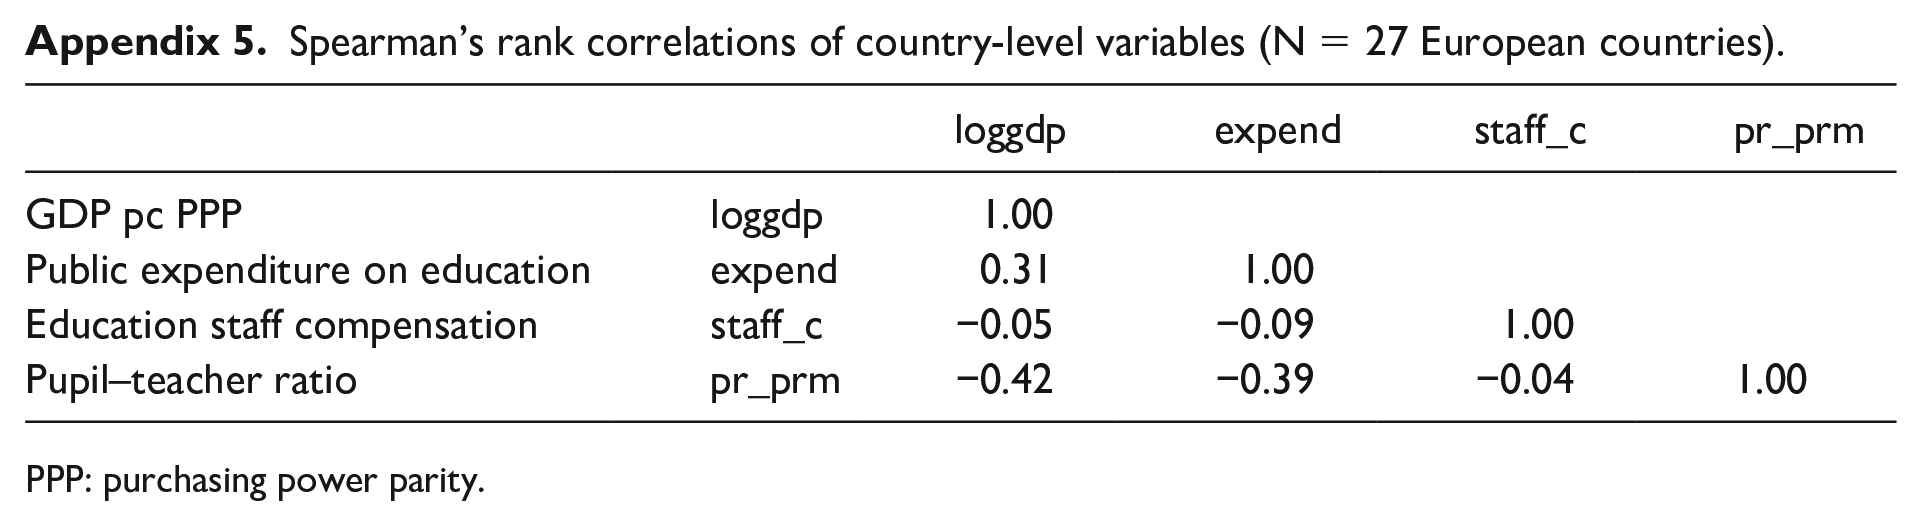
| loggdp | expend | staff_c | pr_prm | ||
|---|---|---|---|---|---|
| GDP pc PPP | loggdp | 1.00 | |||
| Public expenditure on education | expend | 0.31 | 1.00 | ||
| Education staff compensation | staff_c | −0.05 | −0.09 | 1.00 | |
| Pupil–teacher ratio | pr_prm | −0.42 | −0.39 | −0.04 | 1.00 |
PPP: purchasing power parity.
Acknowledgements
I want to thank Kazimierz M. Slomczynski, Joshua K. Dubrow, Irina Tomescu-Dubrow, Jakub Wysmułek and Barbara Rosenwein for their support and valuable comments to this work. I am also thankful to the Interdisciplinary Corruption Research Network team and the ICRN Forum Kyiv 2019 participants for their constructive feedback to the early draft of this paper. I also thank the IJCS editors David Smith and Phillip A. Hough, as well as IJCS Reviewers, who helped to sharpen key arguments of this paper.
Funding
The author(s) disclosed receipt of the following financial support for the research, authorship, and/or publication of this article: This work is supported by the US National Science Foundation Grant No PTE 1738502.