
Abstract
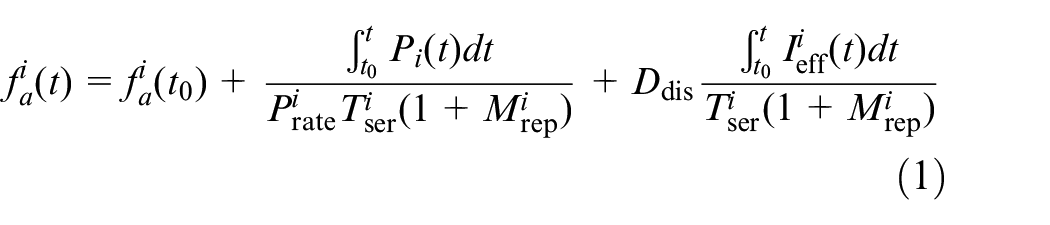
In response to the limited power operation mode of wind farms, an active power optimization scheduling method for wind farms is proposed based on the state evaluation of wind turbines. This method achieves optimal operational control of wind farms. The computational complexity is relatively low. Firstly, the indicators in the comprehensive scoring system for wind turbines are defined. Additionally, the fuzzy entropy method is employed to calculate and rank the overall deterioration of power up-regulation/down-regulation. Then, wind turbines are classified according to their operational state, and the power regulation capacity of each class of wind turbines is determined. Subsequently, the active power optimization scheduling of wind farms is implemented based on the classification and ranking of wind turbines. Finally, a simulation test is conducted using historical data from a wind farm. The results demonstrate that the proposed method can achieve higher power command tracking accuracy under different power limitation levels of wind farms. Moreover, power scheduling based on the comprehensive deterioration ranking of the turbines can effectively reduce power fluctuation differences, load fatigue differences, and overall power fluctuations between the turbines. The standard deviation of the power fluctuation coefficient has been reduced to 0.0705, marking a 9.85% decrease compared to the previous scheme.
Keywords
Introduction
The optimization of wind farm scheduling has become a crucial focus area within the renewable energy sector, driven by the need to address the challenges posed by the variable nature of wind power. In a limited power operation mode, the overall power command is allocated to individual turbines of wind farms through a specific active power scheduling method. Therefore, an active power scheduling method is essential to ensure the accuracy of tracking the wind farm's power commands. Conventional active power scheduling methods for wind farms include the average allocation method and the proportional allocation method. 1 However, these methods may induce frequent changes in power commands to the turbines due to random fluctuations in the wind speed, thus leading to increased operational frequency and load fatigue on the turbines. 2
The need for system flexibility has led to the classification of individual generators within wind farms as the smallest units, with different types of units treated as distinct virtual power sources. This classification allows for more flexible participation in system dispatch, resulting in new methods enabling for wind power to actively engage in grid operations to optimize production schedules and minimize losses. 3 In microgrids with multiple wind farms, the accurate representation of uncertainties is crucial. To overcome the limitations of data availability in newly commissioned wind farms, a novel transfer learning-based scenario generation method has been proposed, which uses historical information from other data-rich farms to generate wind speed scenarios, thereby improving decision-making reliability. 4
Predictive coordination control frameworks have been proposed to improve wind power control performance. In order to maximise self-reserve and minimise control errors, these frameworks integrate wind power forecasting modules, online optimisation and feedback loops. 5 Data-driven approaches for assessing wind turbine health have also emerged, using operational condition recognition and machine learning models to predict fatigue loads and ensure the integrity of wind farms. 6 As wind generation increases its share in the power mix, the operation and maintenance of wind farms have become more critical. Decision-dependent stochastic strategies are being studied to optimize maintenance schedules, taking into account the influence of wake effects and uncertainties in wind speed and electricity prices. 7 Online health assessment of wind turbines is also receiving increased attention, with data-driven methods being proposed for recognizing operational conditions. 8
As the grid requirements for power command tracking accuracy of wind farms increase and wind farms place more emphasis on their power generation efficiency, such factors as turbine wind power prediction results, turbine operating state, and wind farm operating costs should be incorporated into active power scheduling. 9 This contributes to higher power tracking accuracy and lower operation and maintenance costs for the wind farm. Currently, intelligent optimization algorithms and turbine state evaluation-based methods are adopted in most existing studies on power optimization scheduling for wind farms under limited power.
Extensive research has been conducted on intelligent optimization algorithms to date. Li 10 proposed a new chaotic quantum Harris hawk optimization named CQMHHO to address the issues of premature convergence; Zhang 11 proposed a new DRO-based model for generating robust schedules of maintenance tasks, which can resist the uncertainty of maintenance demand with limited historical data. The proposed model minimizes the utilization of maintenance resources, while ensure that the uncertain maintenance demand has been fully met; Bai 12 proposed a novel variant based on evolutionary PSO (EPSO). EPSO combines the idea of evolutionary computing and exploring capability of particles such that system parameters can self-evolve intelligently to adapt different problems; Barış 13 developed a sophisticated wind speed forecasting model. This model utilizes Robust Empirical Mode Decomposition (REMD) to decompose wind speed data into Intrinsic Mode Functions (IMFs), which are then integrated into a Long Short-Term Memory (LSTM) network. The LSTM architecture is optimized through the parameters estimated by the African Vulture Optimizer (AVO) algorithm, which is based on the Tents Chaos Map; Altan 14 presents the development of an advanced hybrid wind speed forecasting model that synergistically combines Long Short-Term Memory (LSTM) networks with decomposition techniques. The Grey Wolf Optimizer (GWO) is utilized to optimize the estimation of Intrinsic Mode Functions (IMFs), derived from the decomposition process. This approach has led to a marked improvement in the precision of wind speed predictions, which is vital for the effective harnessing of wind energy resources.
Due to the large number of turbines within a wind farm, there is a risk of the curse of dimensionality. The reason is that intelligent optimization algorithms tend to fall into local optimal solutions, which significantly reduces the optimization effectiveness. Therefore, intelligent optimization algorithms are rarely applied to the active power optimization scheduling of wind farms in a real scenario. The optimization of power scheduling is typically based on a comprehensive evaluation of the power regulation capabilities of wind turbines, taking into account their various operational states and characteristics. This is followed by a classification and ranking of these turbines based on the aforementioned evaluation. The comprehensive evaluation of turbine operating states based on various parameters has been highlighted in many studies. Some investigators calculated the weight of comprehensive indicators by using a combination of fuzzy weight analysis and entropy weight methods based on the data collected from the wind turbine Supervisory Control and Data Acquisition (SCADA) system. 15
Active power scheduling methods based on turbine state evaluations are explored. These methods classify turbines according to their output characteristics and operating states, allowing for the allocation of active power scheduling commands to the turbine layer based on these classifications. Compared to intelligent optimization algorithms, turbine state evaluation methods exhibit significantly lower computational complexity, making them more applicable for real-time power scheduling in wind farms. However, existing approaches primarily emphasize tracking accuracy of power commands, often neglecting other operational optimization aspects such as reducing turbine loads, lowering operational costs, and balancing turbine load fatigue.16,17 To address these issues, researchers have proposed a novel Hierarchical Model Predictive Control (HMPC) strategy aimed at enhancing wind power scheduling and accommodation. 18 This strategy can be employed to classify turbines based on their output characteristics and operating states, with the objective of allocating active power scheduling commands to the turbine layer based on the classes. Compared with the methods based on intelligent optimization algorithms, the active power scheduling methods based on turbine state evaluations exhibit significantly lower computational complexity, which endows them with higher applicability to real-time power scheduling of wind farms. Nevertheless, the primary objective of existing active power scheduling methodologies based on turbine state assessments is to enhance the precision of power commands. However, there is a paucity of research exploring the potential of these techniques to reduce turbine loads, minimize wind farm operational costs, balance turbine load fatigue and optimize other aspects of operational efficiency.
Therefore, in response to the limited power operation mode of wind farms, an active power optimization scheduling method is proposed based on turbine state evaluations. This method aims to accurately track the wind farm's power commands with low computational complexity while attenuating turbine power fluctuations and reducing fatigue damage differences among turbines. Furthermore, this method may reduce operation and maintenance costs and achieve optimized operational control of wind farms.
This study introduces a power scheduling algorithm that operates on a per-cycle basis, utilizing a ranking system based on the aggregated degradation metrics for power modulation—both increases and decreases. The primary objective is to optimize power distribution. This is complemented by a state-based classification of turbines, which guides the determination of power commands to ensure the wind farm's accurate adherence to the total power directive. Our approach circumvents the conventional reliance on iterative optimization techniques like particle swarm optimization and genetic algorithms, opting for a strategic dispatch based on the degradation index rankings. This not only facilitates an optimized power scheduling across turbines but also ensures precision in tracking the overall power directive by considering the individual power modulation capabilities of each turbine.
The methodology for implementation encompasses three principal strategies:
The development of an integrated turbine scoring system that includes metrics such as the comprehensive fatigue coefficient, power fluctuation coefficient, curtailment rate, and power regulation margin of the turbines. The fuzzy entropy approach is employed to calculate the comprehensive degradation indices for power upregulation and downregulation, enabling a prioritized ranking for optimization.
A detailed classification of turbines based on their operational status to evaluate their respective power modulation capabilities.
Within each power dispatch cycle, the power output of turbines is modulated in accordance with the ranking derived from the comprehensive degradation indices. This strategy is designed to prioritize the optimal allocation of power, minimizing adjustments to turbines with higher degradation indices to achieve a more balanced distribution of fatigue and other metrics. Additionally, leveraging the classified status of each turbine, the power command is tailored to the modulation capacity of each unit, ensuring precise adherence to the wind farm's overall power directive.
Indicator definitions
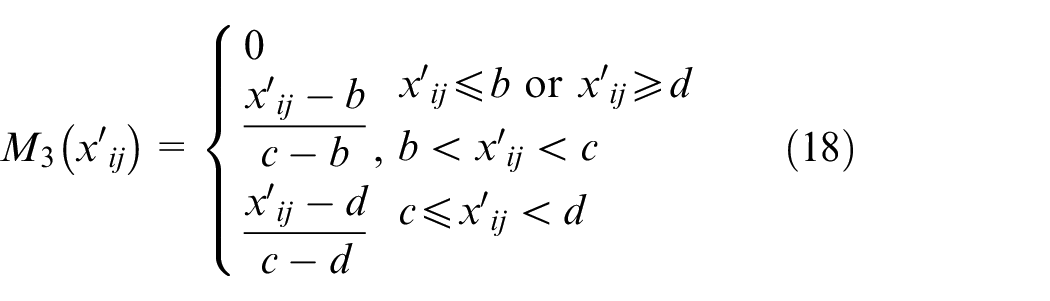
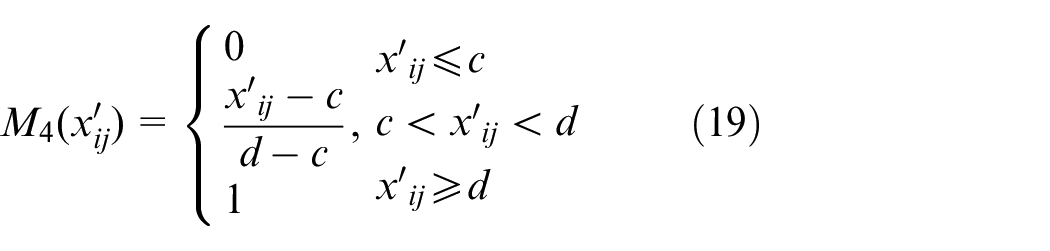
To optimize wind farm operation by accurately tracking power commands while reducing fatigue differences and power fluctuation levels among turbines, the following four evaluation indicators are selected in this study.
Comprehensive turbine fatigue coefficient
To optimize the fatigue balance in wind farm operation, considering that the comprehensive fatigue of turbine components is influenced by the active power output and turbulence factors, a comprehensive turbine fatigue coefficient
where,
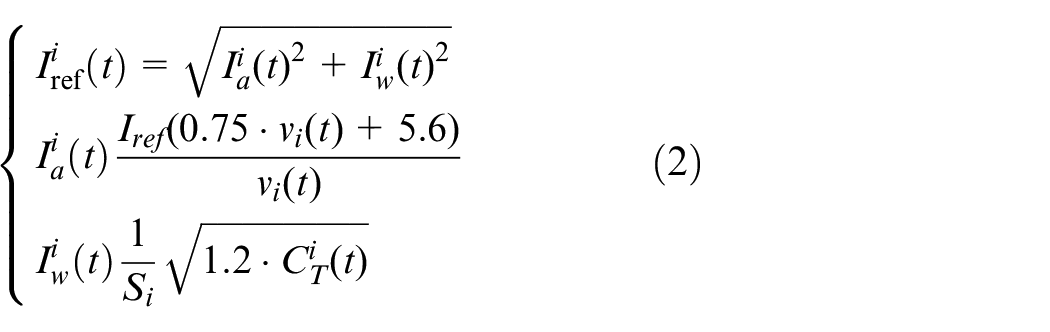
where,
Turbine power fluctuation coefficient
To reduce periodic power fluctuations of wind turbines, thereby improving operational stability and reducing operational fatigue, the turbine power fluctuation coefficient is defined as an evaluation indicator. The power fluctuation coefficient
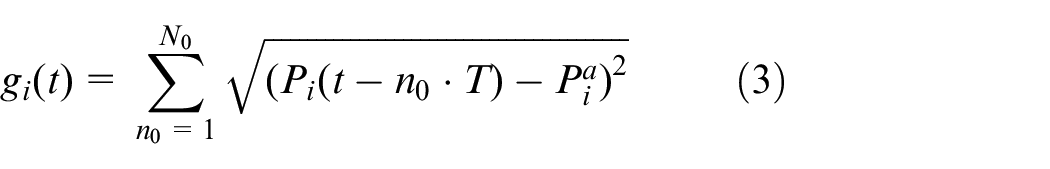
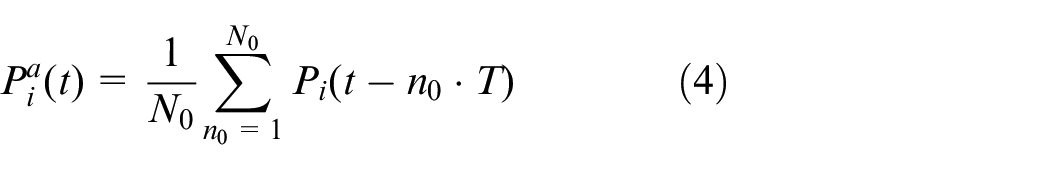
where, gi(t) and
Turbine curtailment rate
The turbine curtailment rate can serve as an indicator reflecting the power regulation capability of a turbine. When the curtailment rate is lower, the turbine has a stronger capability to down-regulate its power but a weaker capability to up-regulate its power. Conversely, when the curtailment rate is higher, the turbine has a weaker capability to down-regulate its power but a stronger capability to up-regulate its power. The turbine curtailment rate is defined as the difference between 1 and the proportion of the turbine’s current actual power output to its current theoretical maximum power output. It can be calculated as follows,
where,
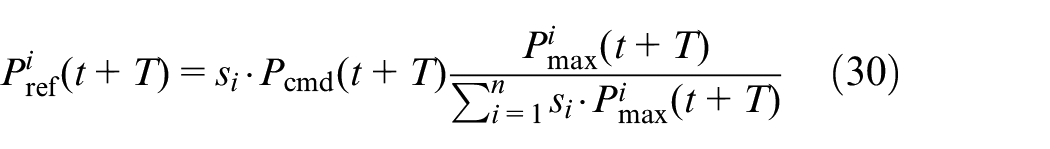
Turbine power regulation margin
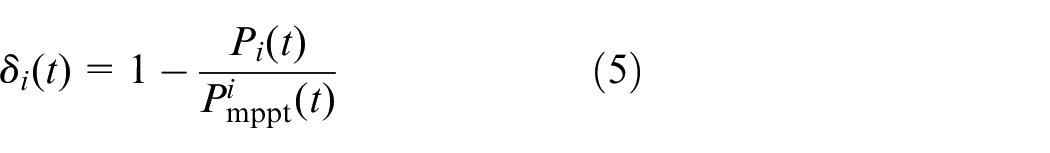
The turbine power regulation margin is the most direct indicator reflecting the turbine’s power regulation capability. It can be divided into the power up-regulation margin and the power down-regulation margin. Specifically, the power up-regulation margin is the difference between the turbine’s predicted power value for the next cycle and its current power value, which can be calculated as equation (6). The power down-regulation margin is the difference between the turbine’s current power value and its lower limit for power curtailment, which can be calculated as equation (7).
Power up-regulation margin:

Power down-regulation margin

where,
Comprehensive evaluations of turbine control capabilities based on the fuzzy entropy method
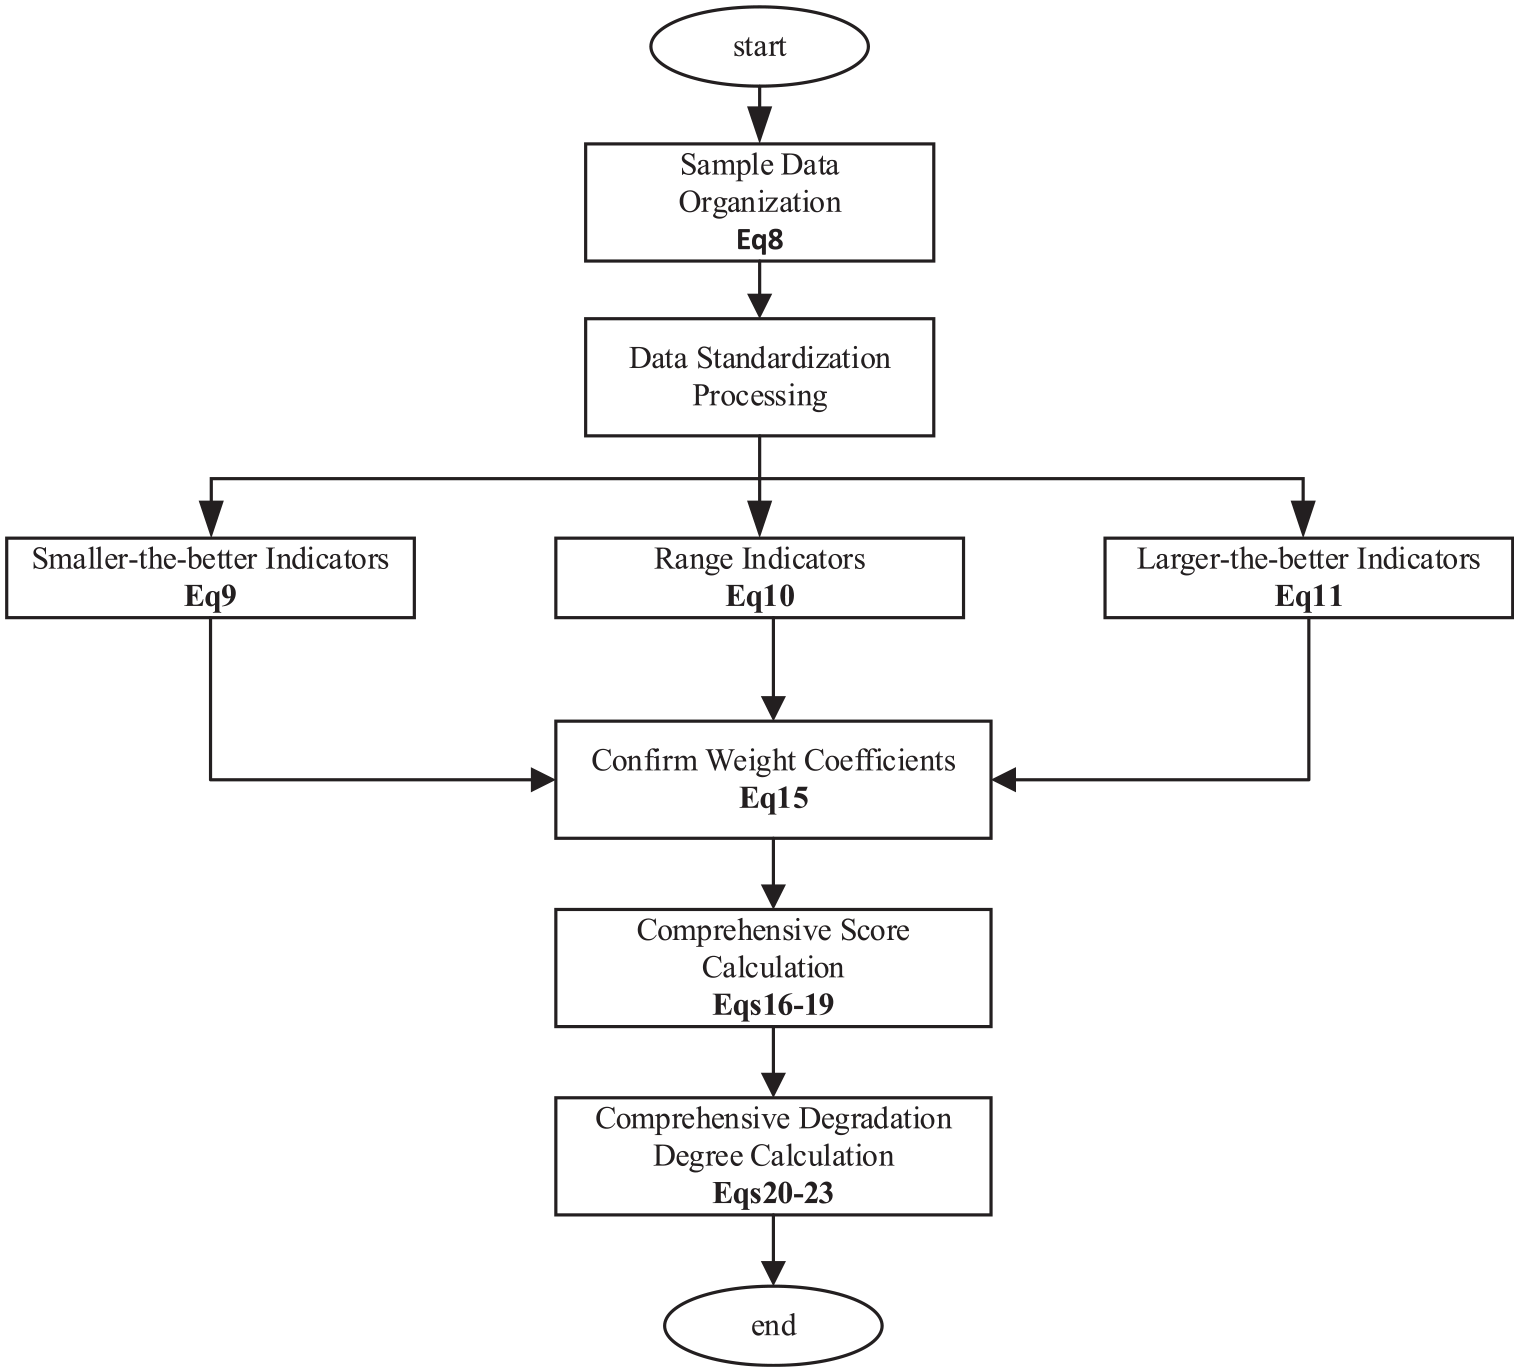
The significance of each evaluation indicator varies within a comprehensive evaluation system. Indicator weights can reflect the significance of corresponding indicators within an evaluation system. The larger the weight, the greater the impact of the corresponding indicator on the overall evaluation system. In terms of the entropy method, the concept of entropy from information theory is utilized to measure the degree of dispersion of indicators. The greater the dispersion of an indicator, the smaller its entropy value, indicating a greater impact on the comprehensive evaluation results and hence a larger weight for the corresponding indicator. 22 Firstly, the weight of each indicator is determined using the entropy method. Then, the fuzzy membership function method is employed to calculate the comprehensive score of each turbine. In this study, the comprehensive deterioration degree of wind turbines is used as the comprehensive evaluation score for turbines.
Since the state parameters of wind turbines change in each control cycle, the calculated values of indicator parameters also change accordingly. Therefore, before the power is allocated to turbines in each cycle, it is necessary to re-determine the weight of each indicator for turbines and the comprehensive scores of turbines, followed by the re-ranking based on these scores, Supplementary description: The flowchart of Fuzzy entropy calculation is shown in Figure 1.
Fuzzy entropy calculation flowchart.
Determination of indicator weights
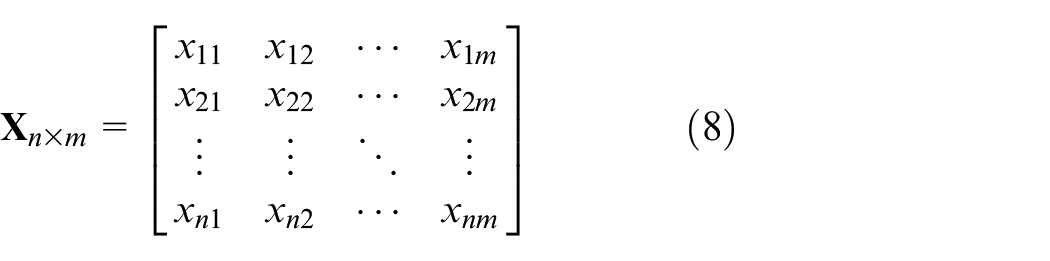
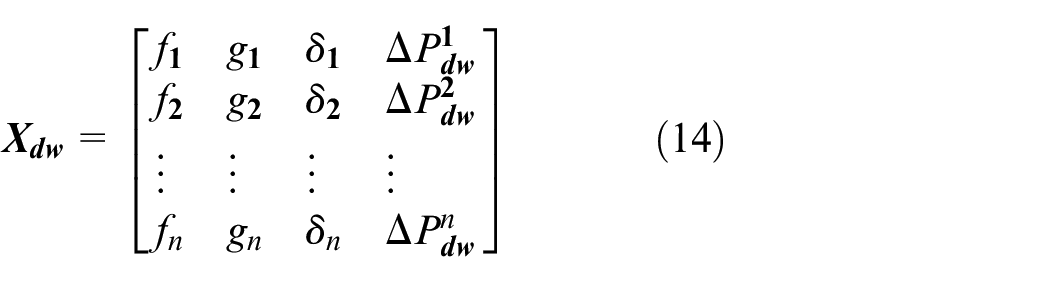
Assume that the number of wind turbines in the wind farm is n, and m evaluation indicators are selected for each turbine. The sample data for each cycle are organized into a sample data matrix
where,
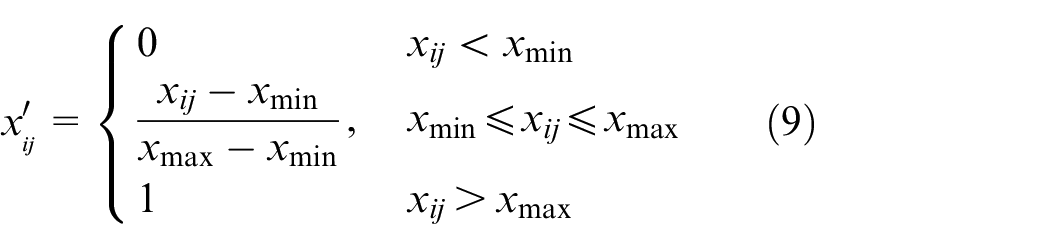
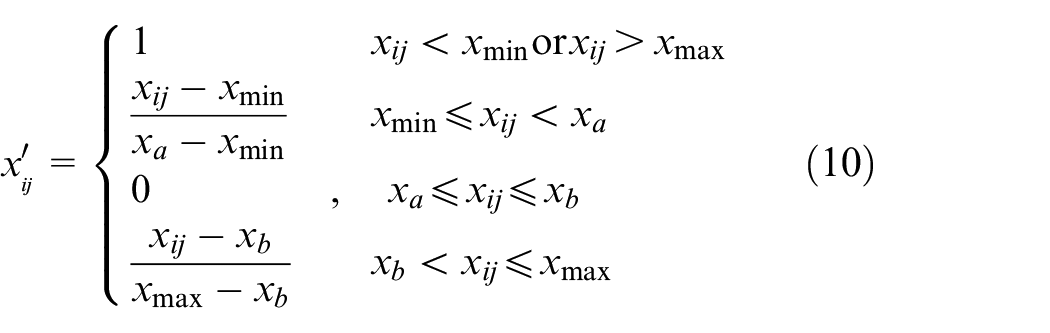
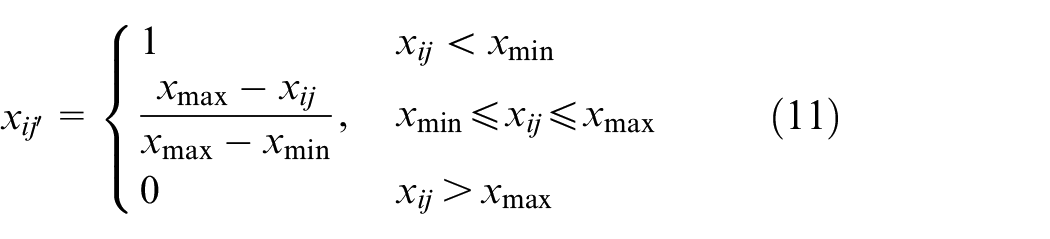
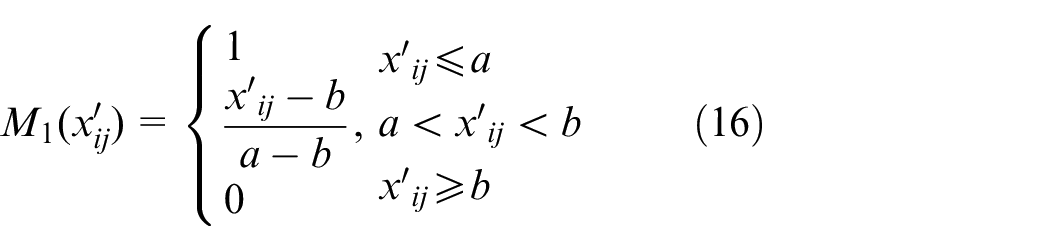
Next, the sample data are normalized using the deterioration degree function. Depending on the indicator type, the deterioration degree function includes the following three forms. 6
Smaller-the-better indicators
For smaller-the-better indicators, the lower the value, the better the corresponding performance of the turbine, and thus the smaller the deterioration degree.
where,
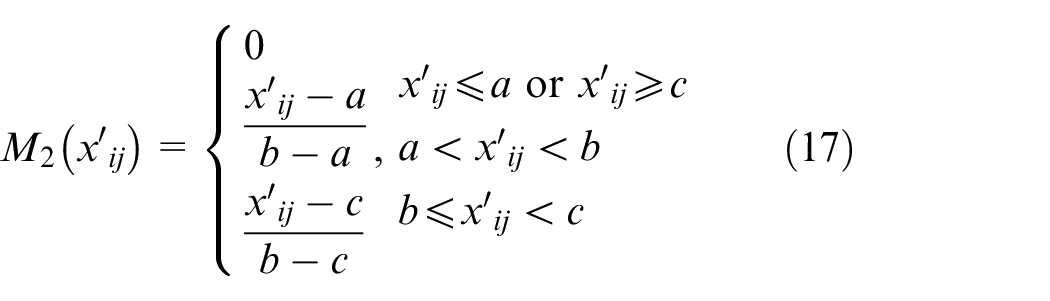
Range indicators
For indicators with an optimal value range, the deterioration degree is smallest when the indicator value is within this optimal range. The deterioration degree function for moderate indicators can be defined as follows,
where,
Larger-the-better indicators
For larger-the-better indicators, the higher the value, the better the corresponding performance of the turbine, and thus the smaller the deterioration degree.
After the deterioration degree is calculated, the resulting sample data matrix is denoted as
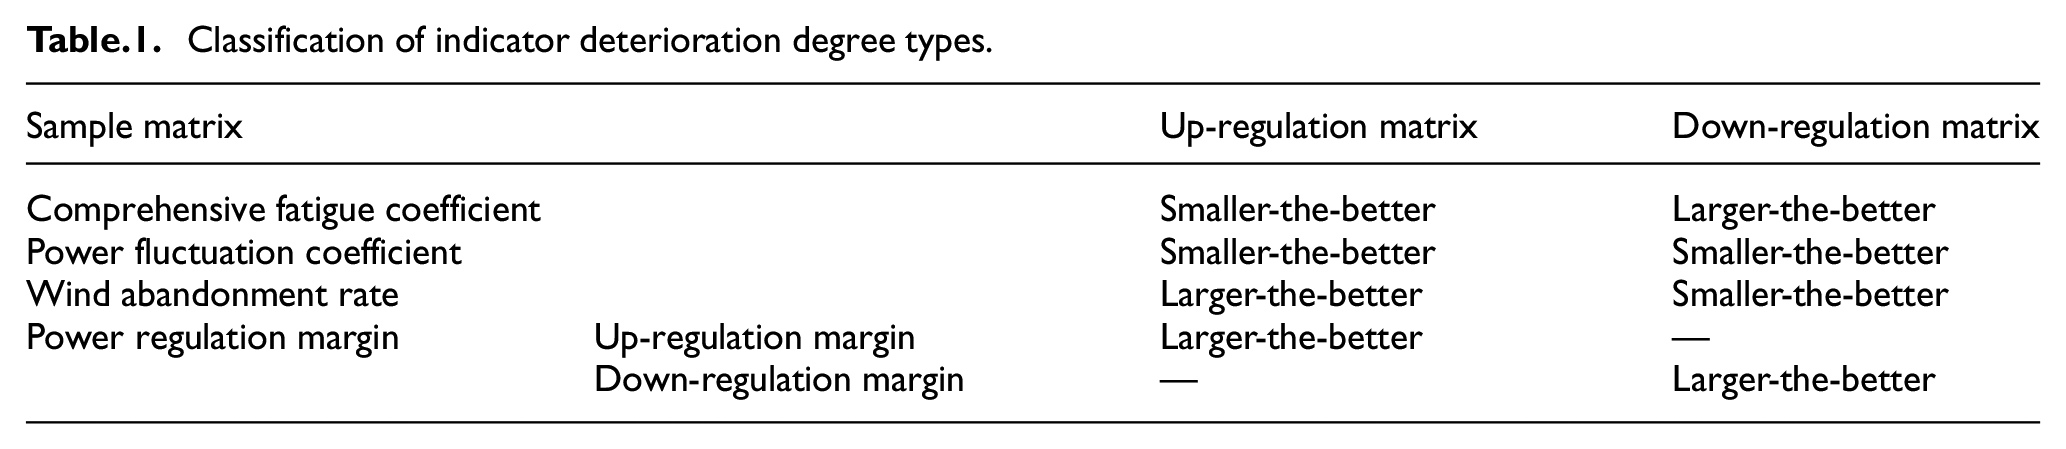
As reported in previous studies, the sample data are typically organized into a single sample data matrix for turbine indicators. However, considering the evaluation differences of turbine indicators during up-regulation and down-regulation of power in wind farms, sample data matrices are separately organized for up-regulation
The types of deterioration degree for the indicators defined above are classified in the up-regulation sample data matrix and the down-regulation sample data matrix, as shown in Table 1. Based on the classification in Table 1, the deterioration degrees for each indicator in
Classification of indicator deterioration degree types.
After obtaining the sample data matrices with calculated deterioration degrees, the entropy method is used to calculate the weight coefficient for each indicator. These weight coefficients form the weight coefficient matrix

Based on the method for calculating the indicator weight coefficients, the weight coefficient matrices for
Comprehensive score calculation
After the weight coefficient for each indicator is determined, the comprehensive deterioration degree of each wind turbine is calculated based on fuzzy theory. Using the sample data matrix
where,
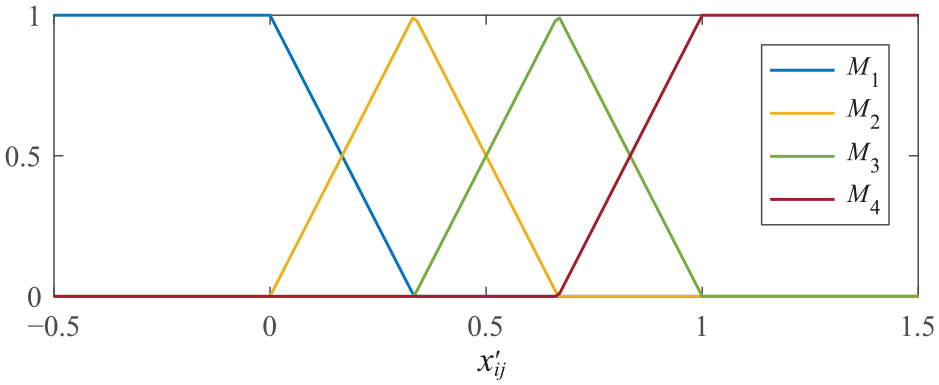
Illustration of membership functions for each level.
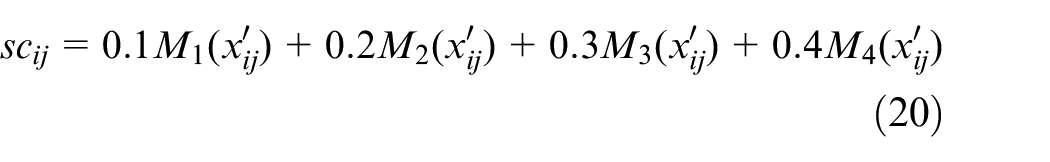
To ensure that turbines with higher degradation levels receive higher degradation scores, scoring weights for the “Low,”“Medium-Low,”“Medium-High,” and “High” levels are set to 0.1, 0.2, 0.3, and 0.4, respectively. Therefore, the degradation score scij for turbine i under indicator j is calculated as follows,
Based on that, the degradation score set Sci for turbine i with respect to each indicator can be expressed as follows,

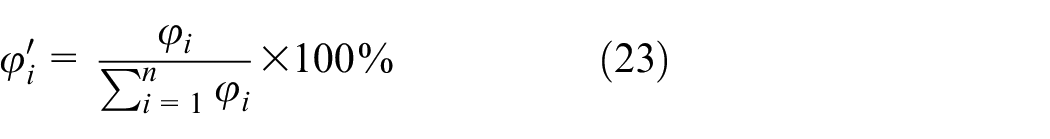
Using the calculated weight matrix and the score set, the comprehensive degradation φi for turbine i is determined as follows,

Finally, φi is transformed into the final comprehensive degradation
After Wup is combined with Wdw, the comprehensive degradation for both power up-regulation and down-regulation can be obtained using the above indicator comprehensive scoring method. When power up-regulation is required in the wind farm, turbines are ranked based on their comprehensive degradation for power up-regulation. Since turbines with lower degradation scores for power up-regulation have stronger power up-regulation capabilities, they are prioritized for scheduling. Similarly, when power down-regulation is required in the wind farm, turbines are ranked based on their comprehensive degradation for power down-regulation. Turbines with lower degradation scores for power down-regulation have stronger power down-regulation capabilities and are thus prioritized for scheduling.
Active power optimization scheduling of wind farms
Constraints
Wind farm power fluctuation constraint
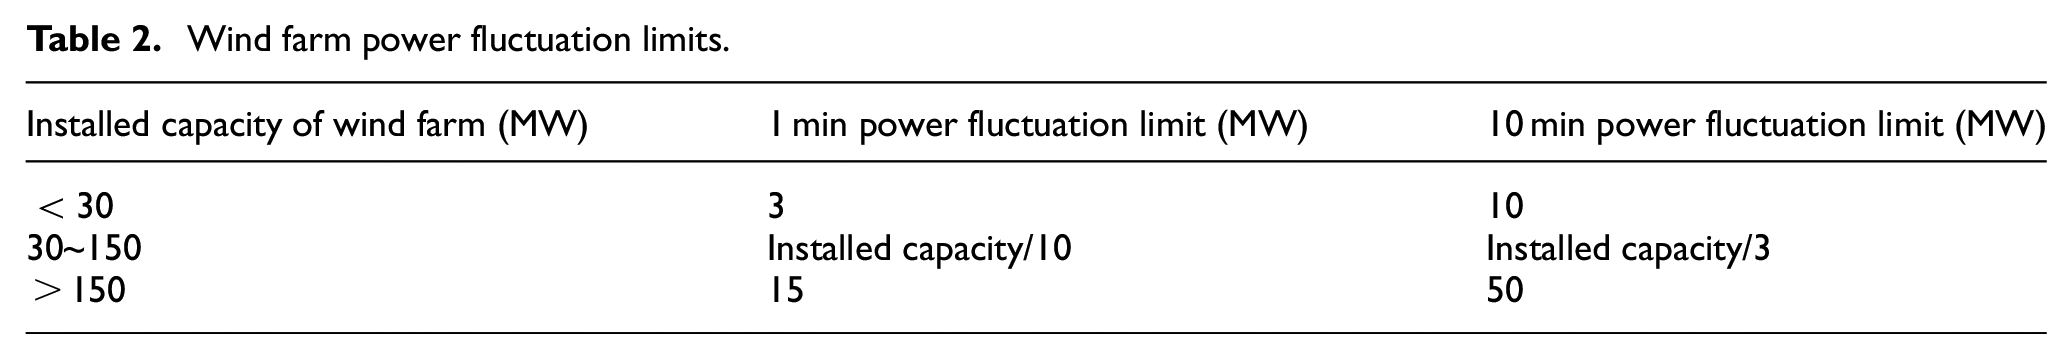
According to the State Grid's maximum wind farm power variation standards, the power fluctuation limits within 1 min and 10 min for wind farms with different installed capacities are listed in Table 2.
Wind farm power fluctuation limits.
Wind turbine power limitation constraint
The frequent start-stop operation of wind turbines can reduce their operational safety and stability. Therefore, a minimum power limit is usually set to prevent turbines from being shut down due to an excessive power reduction. To prevent a high wind abandonment rate while ensuring sufficient downward power adjustment margin, the minimum power limit

where,
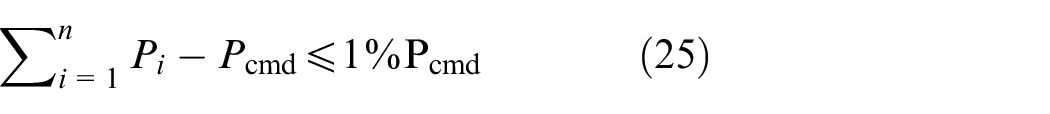
Power command tracking accuracy constraint
To ensure high precision in tracking the power command for the wind farm, the actual power output of the wind farm should deviate by no more than 1% from the power command
Classification of wind turbine states
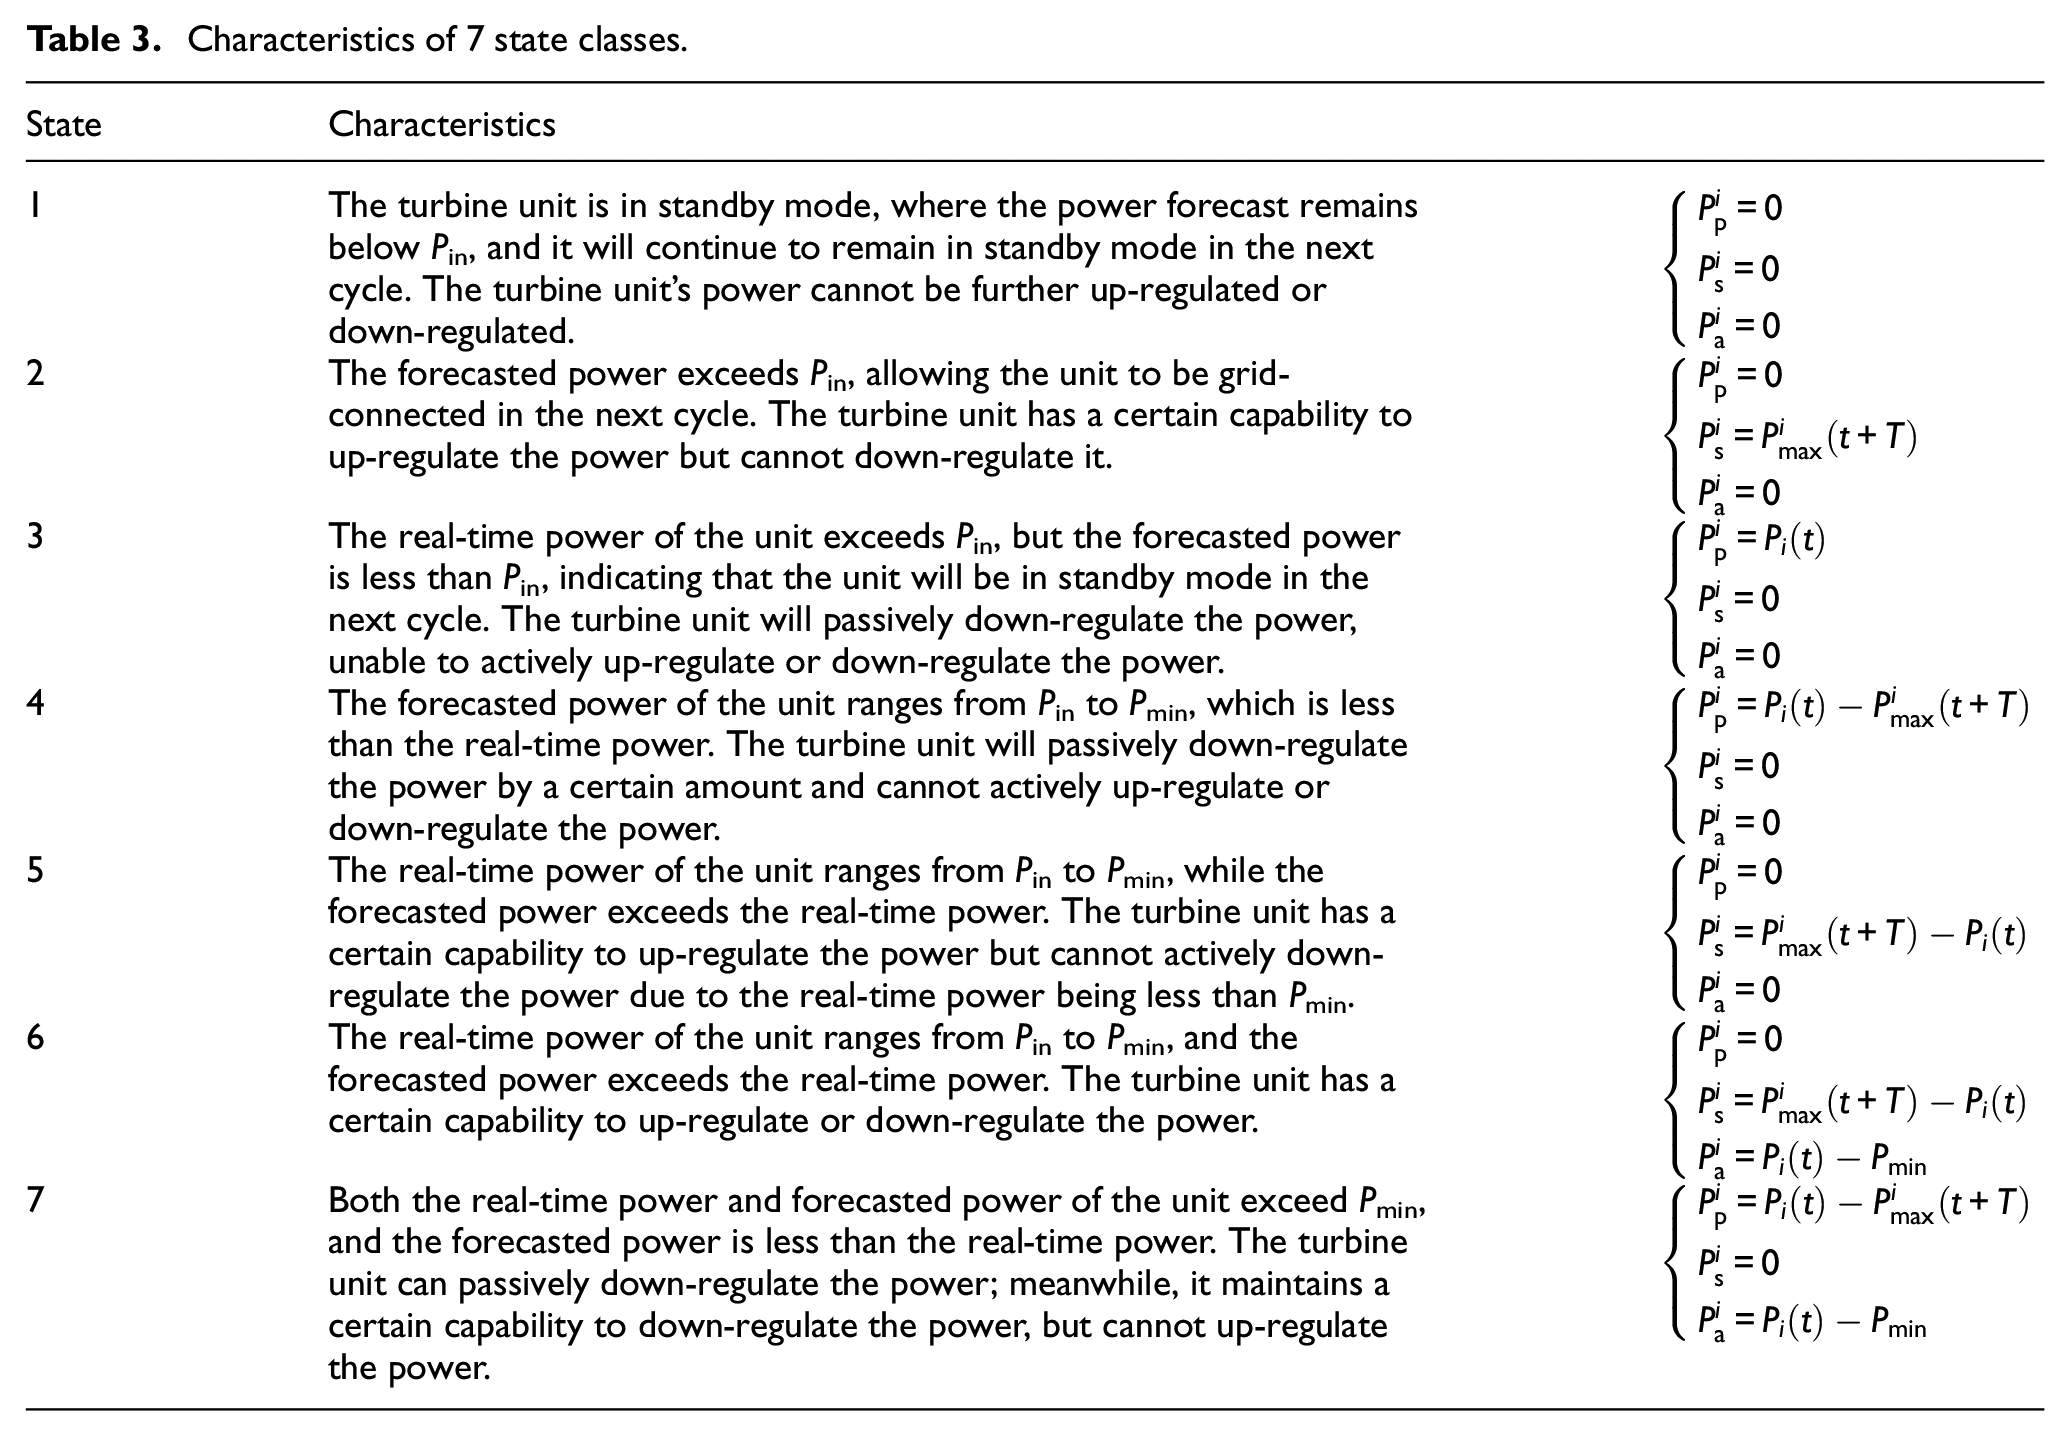
The power regulation capability of wind turbines varies depending on their operational states. The factors for the classification of turbine states include the start-stop state
Firstly, turbines are classified into stopped turbines and operating turbines based on their real-time start-stop state recorded by the SCADA system. If the turbine's start-stop state is
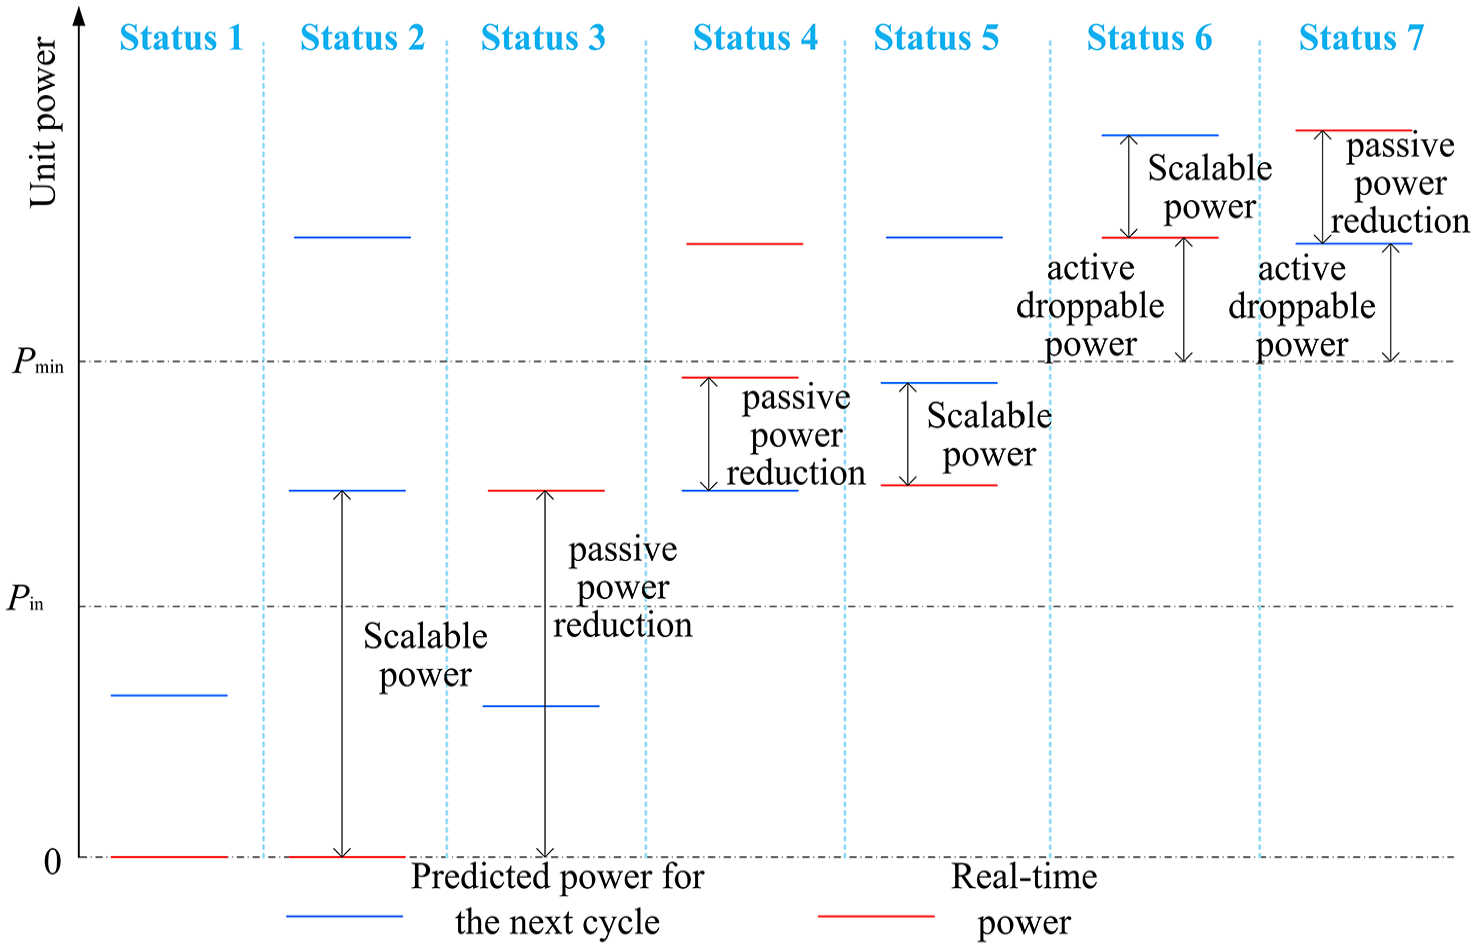
Schematic diagram for the classification of wind turbine operating states.
Figure 3 illustrates seven different operational states of wind turbines. For the turbine ii, its power regulation capabilities in different states include passive power down-regulation
Characteristics of 7 state classes.
Active power scheduling algorithm
Determination of unit ranking and classification
Based on the comprehensive degradation evaluation method of unit indicators, the comprehensive degradation of unit power up-regulation and down-regulation is determined for the current cycle. Since lower degradation indicates a stronger power regulation capability, the power up-regulation and down-regulation comprehensive degradation of units are ranked separately in ascending order. This determines the ascending power control sequence Lup and descending power control sequence Ldw of wind turbine units.
Based on the classification of unit power generation states, the passive power down-regulation, potential power up-regulation, and actively down-regulated power of each unit are determined.
Calculation of the overall power adjustment ΔP
Firstly, the power difference dP between the overall real-time power of the wind farm and the power command Pcmd(t+T) is calculated for the next control cycle, which can be expressed as follows,
Then, the total amount of passive power down-regulation from the units in the wind farm is considered to determine the overall power adjustment
Finally, the adjustment of
Determining the Wind Farm's Need for Power up-regulation or Down-regulation
When
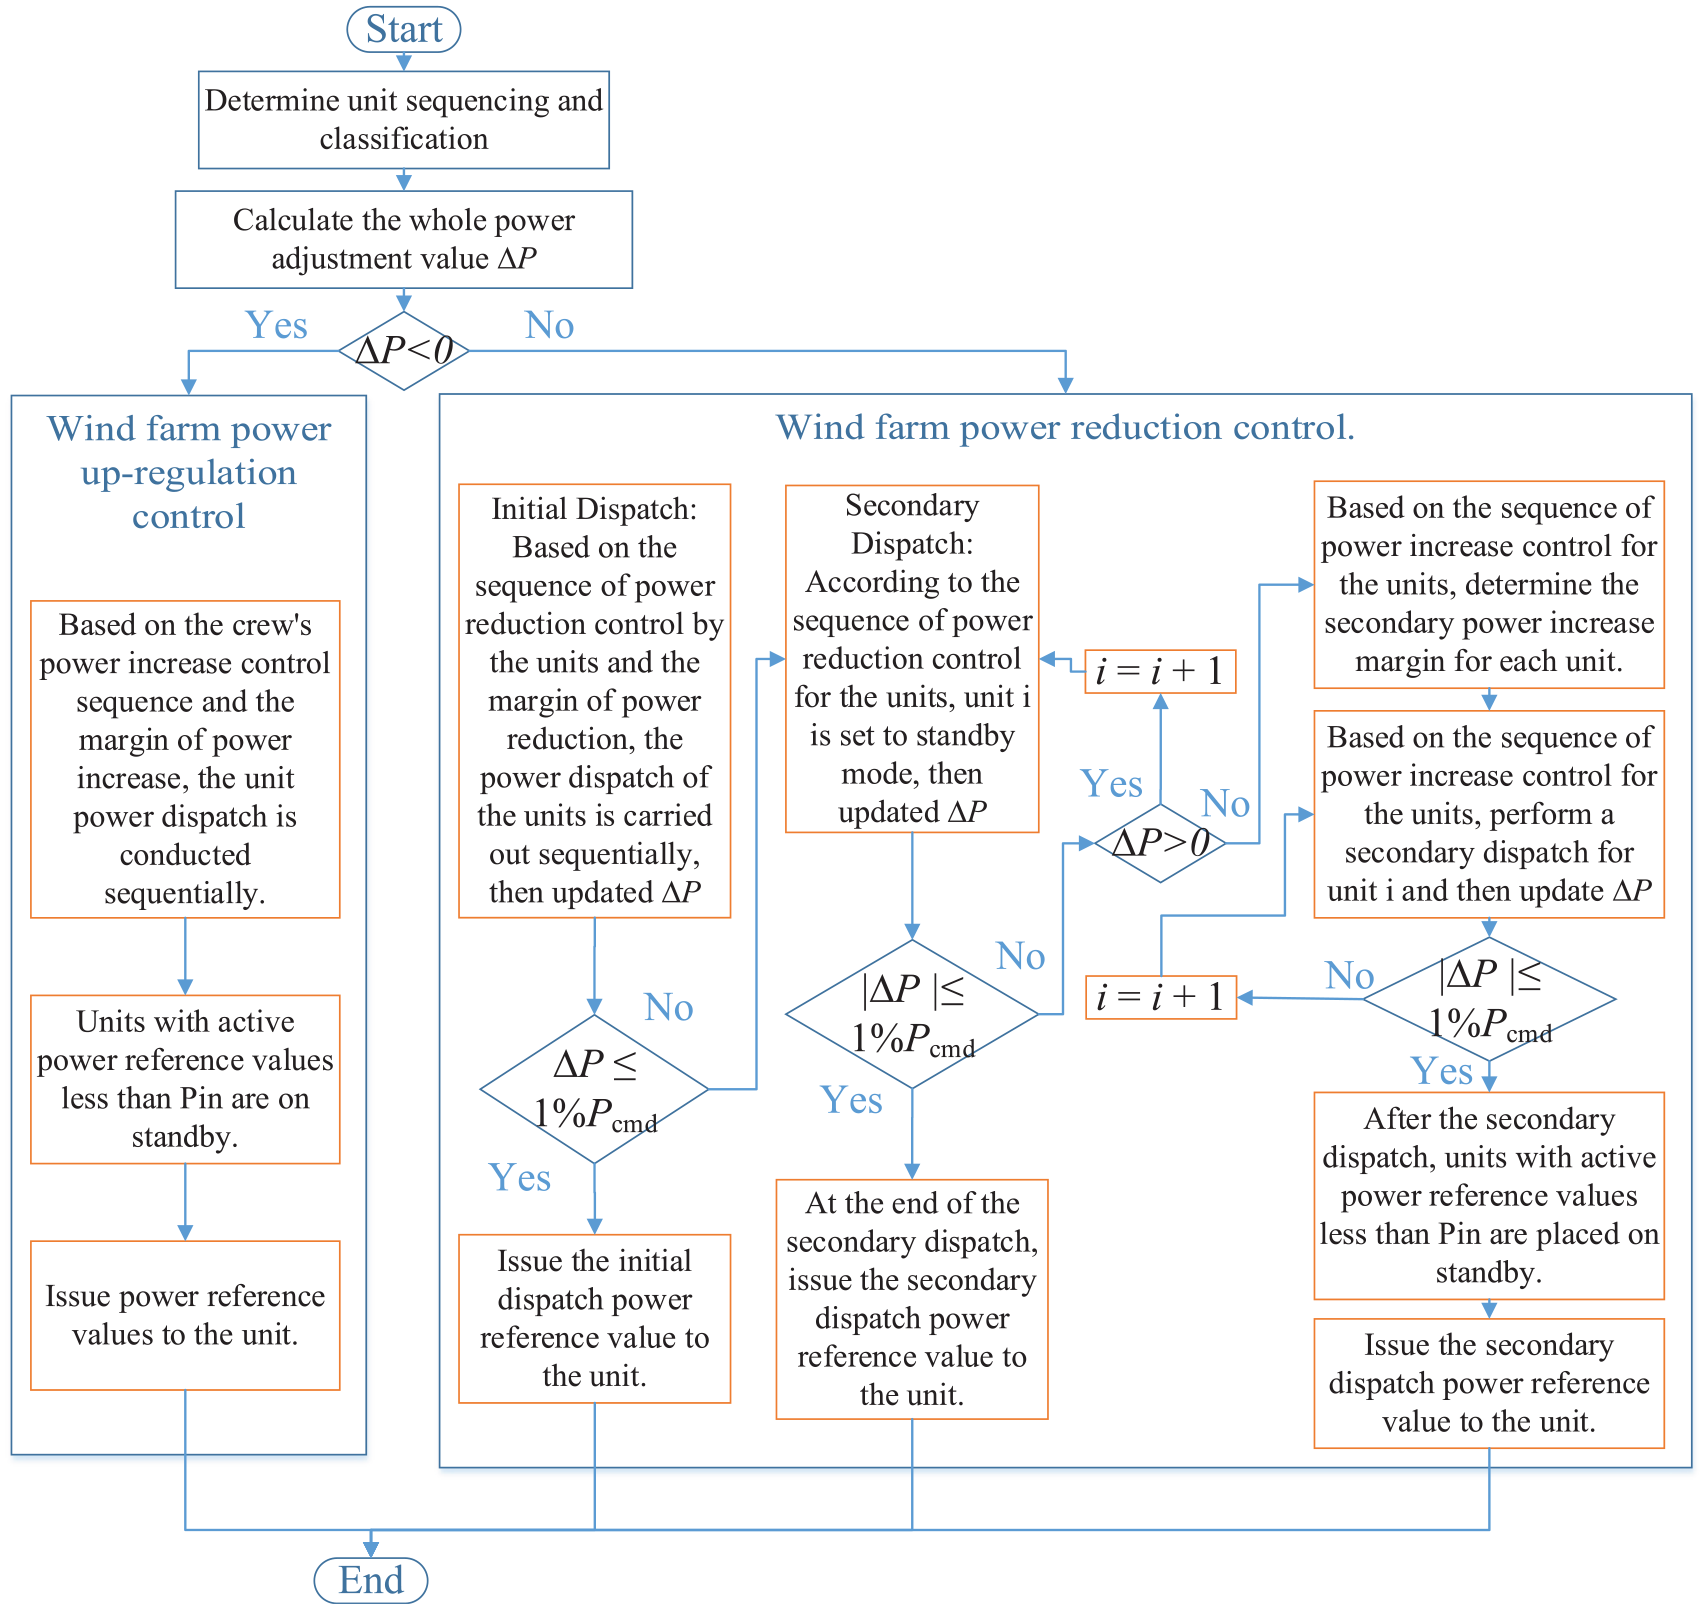
Flowchart of active power optimization scheduling algorithms for wind farms.
Example analysis
Parameter settings
The wind speed data from the SCADA system of a wind farm in northwest China recorded from 00:00 on February 10, 2016, to 23:50 on February 10, 2016, with a data collection period of 10 min, are selected for analysis. The wind farm consists of 25 units of 2MW wind turbine, with a total installed capacity of 50 MW. The cut-in wind speed for the units is 3 m/s, corresponding to a cut-in power of 19.86 kW, and the cut-out wind speed is 25 m/s.
In this example, the optimization period is set to be the same as the data collection period, that is,
Example results
Power tracking accuracy under different power limitation levels
The power limitation level
Firstly, the power tracking accuracy is analyzed for different power limitation levels of the wind farm, which is set at 0.9, 0.6, and 0.3, respectively. According to the proposed wind farm active power optimization scheduling method, the overall power for 144 control cycles of the wind farm and the corresponding overall power command are shown in Figure 5. Figures 5(a), 4(c), and 5(e) respectively illustrate the real-time power
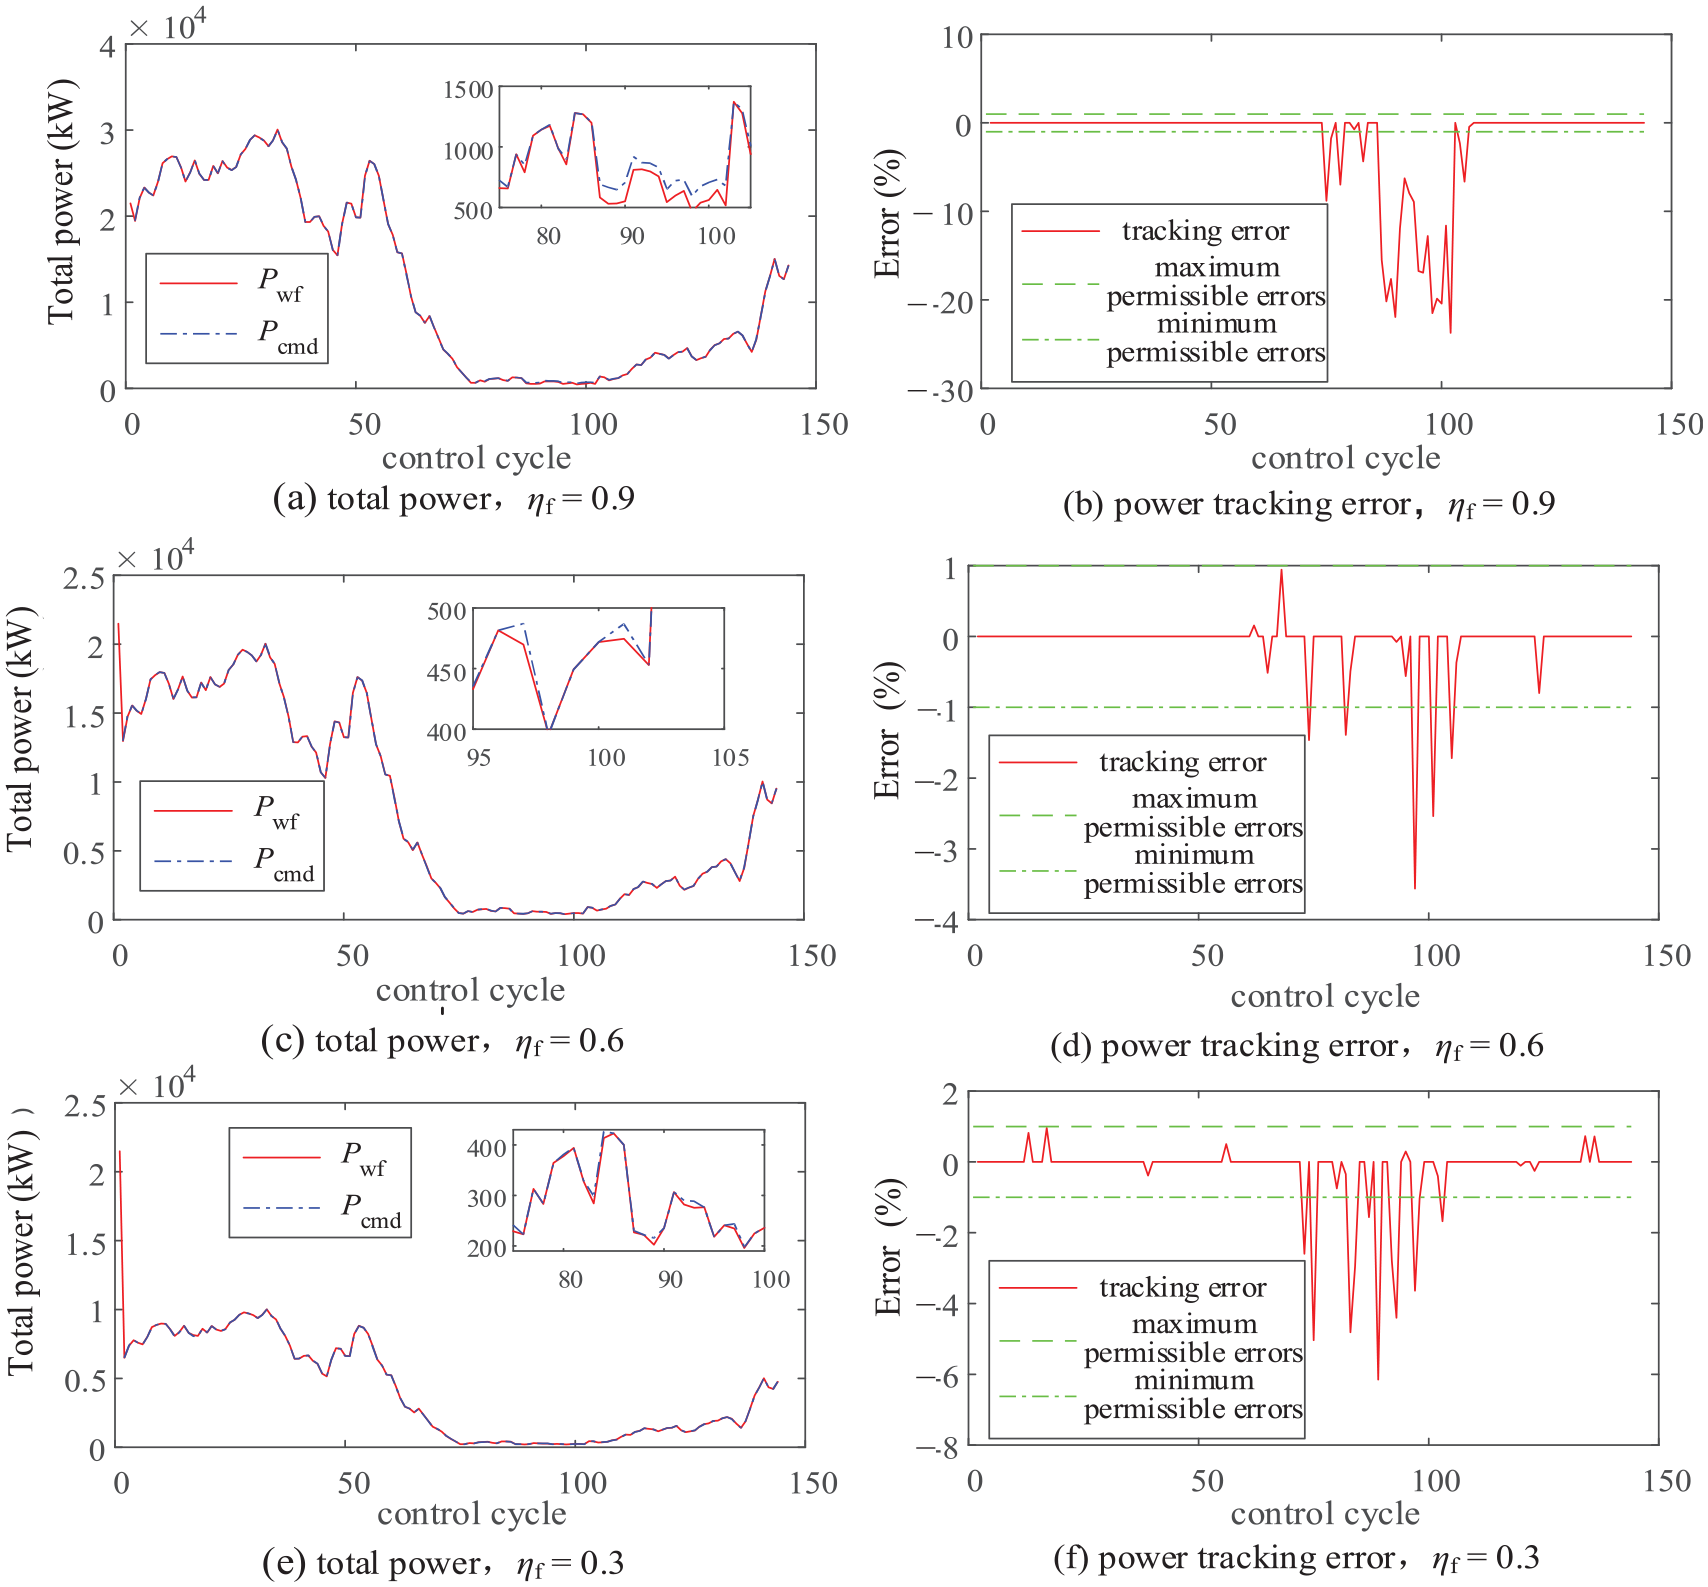
Power tracking performance under different power limitation levels.
Power tracking performance under different strategies.
The analysis indicates that there are the following situations where tracking errors exceed the permissible value.
(1) After the wind farm forces some units into standby mode to achieve overall power down-regulation, if all units in the field lack enough secondary power reserve to compensate for the excessive power reduction during the low wind speed period,
(2) When the wind farm up-regulates the overall power by increasing the power output of certain units, if the units are in state 2 and the power reference value issued to the units is lower than Pin, these units will remain in standby mode and cannot increase power output, ultimately resulting in
Optimization effect analysis
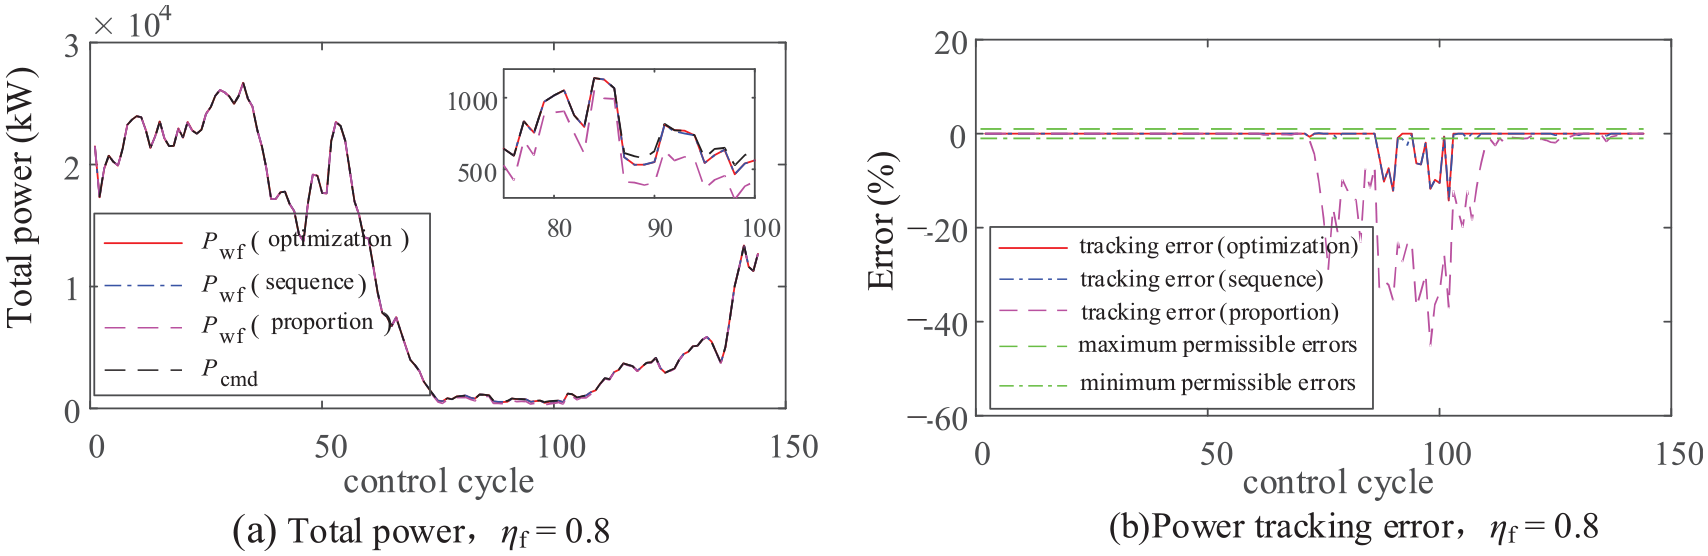
To analyze the optimization effect of the proposed wind farm active power optimization scheduling method based on unit state evaluation (referred to as the optimization method) on unit fatigue damage and power fluctuations within the wind farm, the optimization method is compared with the following two control strategies.
Strategy 1: Proportional Allocation. Different from conventional proportional allocation methods, this strategy allocates power based on the proportion of each unit's power prediction for the next cycle to the total power prediction of the wind farm, aiming to better consider the power adjustment margin of each unit.
Strategy 2: Sequential Method. This strategy is still based on the unit classification method for power scheduling. However, different from the optimization method, the sequential method does not prioritize unit scheduling based on unit comprehensive deterioration. During the power instruction scheduling process, the wind farm performs power up-regulation or down-regulation control in sequential order according to the unit numbers.
The tracking performance of the wind farm with respect to Pcmd under three schemes is illustrated in Figure 6, where the power limit factor ηf for the wind farm is set to 0.8 in all cases. Figure 6(a) illustrates the overall power for each period under different schemes. To better compare the tracking accuracy of different schemes, Table 4 provides statistics on the Mean Absolute Error (MAE), Mean Absolute Percentage Error (MAPE), and Root Mean Square Error (RMSE) for each scheme.
Wind farm power tracking errors under different strategies.
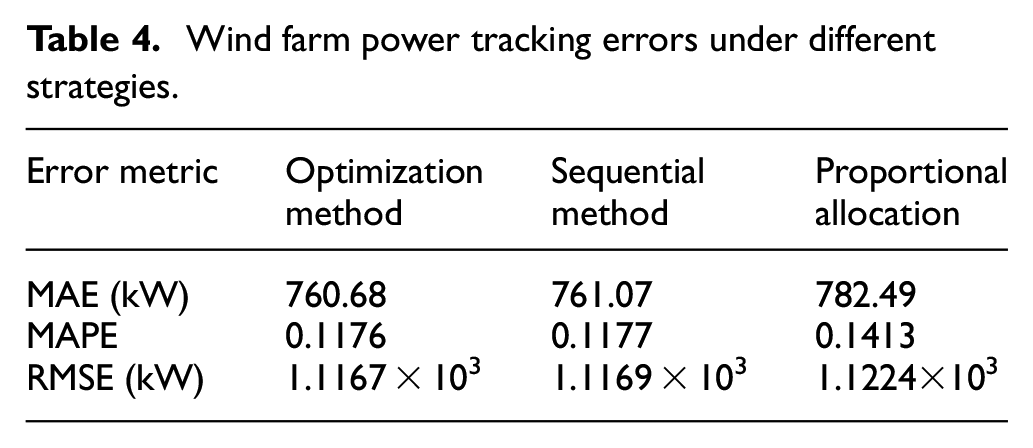
According to Table 4, the MAE, MAPE, and RMSE for the optimization method are 760.68 kW, 0.1176, and 1.1167 × 10³kW, respectively, which are slightly larger than those of the sequential method but significantly larger than those of the proportional allocation method. Figure 6(b) illustrates the percentage tracking error for each scheme, indicating that the tracking deviations of all three schemes are concentrated during the low wind speed period in the wind farm. Specifically, the tracking error of the sequential method is almost identical to that of the optimization method, while the proportional allocation method exhibits significantly larger tracking errors. This suggests that both the sequential and optimization methods, which employ the classification of units by taking account of power regulation margins, can effectively reduce tracking errors with respect to the power command.
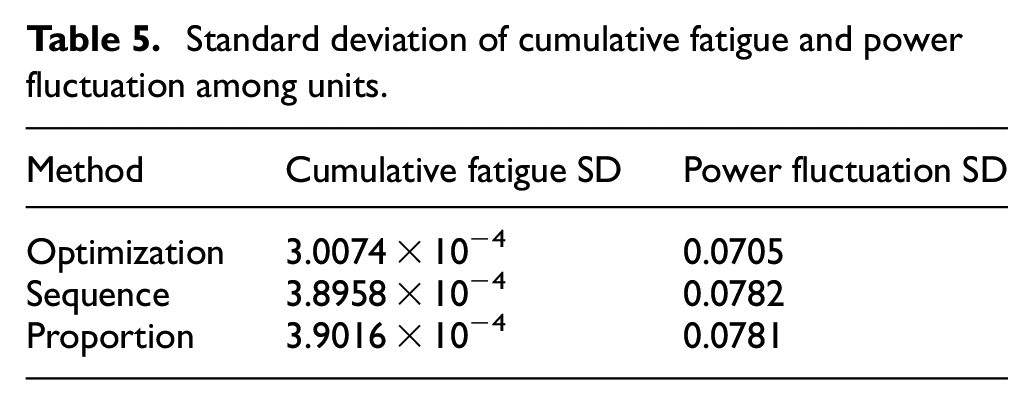
The power fluctuation and fatigue allocation among units under different schemes are shown in Figure 7. Figure 7(a) illustrates the power fluctuation coefficients calculated based on the generated power of each unit over 144 control cycles for different schemes, while Figure 7(b) illustrates the cumulative fatigue coefficients of each unit at the end of the 144th control cycle. Correspondingly, the SD of the cumulative fatigue coefficients and power fluctuation coefficients among units at the end of the 144th control cycle for different schemes is listed in Table 5. A smaller SD indicates less variability among units. It can be observed that after the 144th control cycle, the SD of the cumulative fatigue among units under the optimization, sequential, and proportional allocation methods is 3.0074 × 10⁻⁴, 3.8958 × 10⁻⁴, and 3.9016 × 10⁻⁴, respectively. The optimization method effectively reduces the difference in fatigue damage among units compared with the other two schemes. Moreover, the SD of the power fluctuation coefficients among units under the optimization, sequential, and proportional allocation methods is 0.0705, 0.0782, and 0.0781, respectively. The optimization method significantly reduces the difference in power fluctuations among units compared with the other two schemes. Figure 7(c) illustrates the SD of the fatigue coefficients among units for different schemes over each cycle. It can be observed that with an increase in control cycles, the difference in fatigue among units under different schemes presents an increasing trend, with the fatigue difference under the optimization method consistently lower than the others.
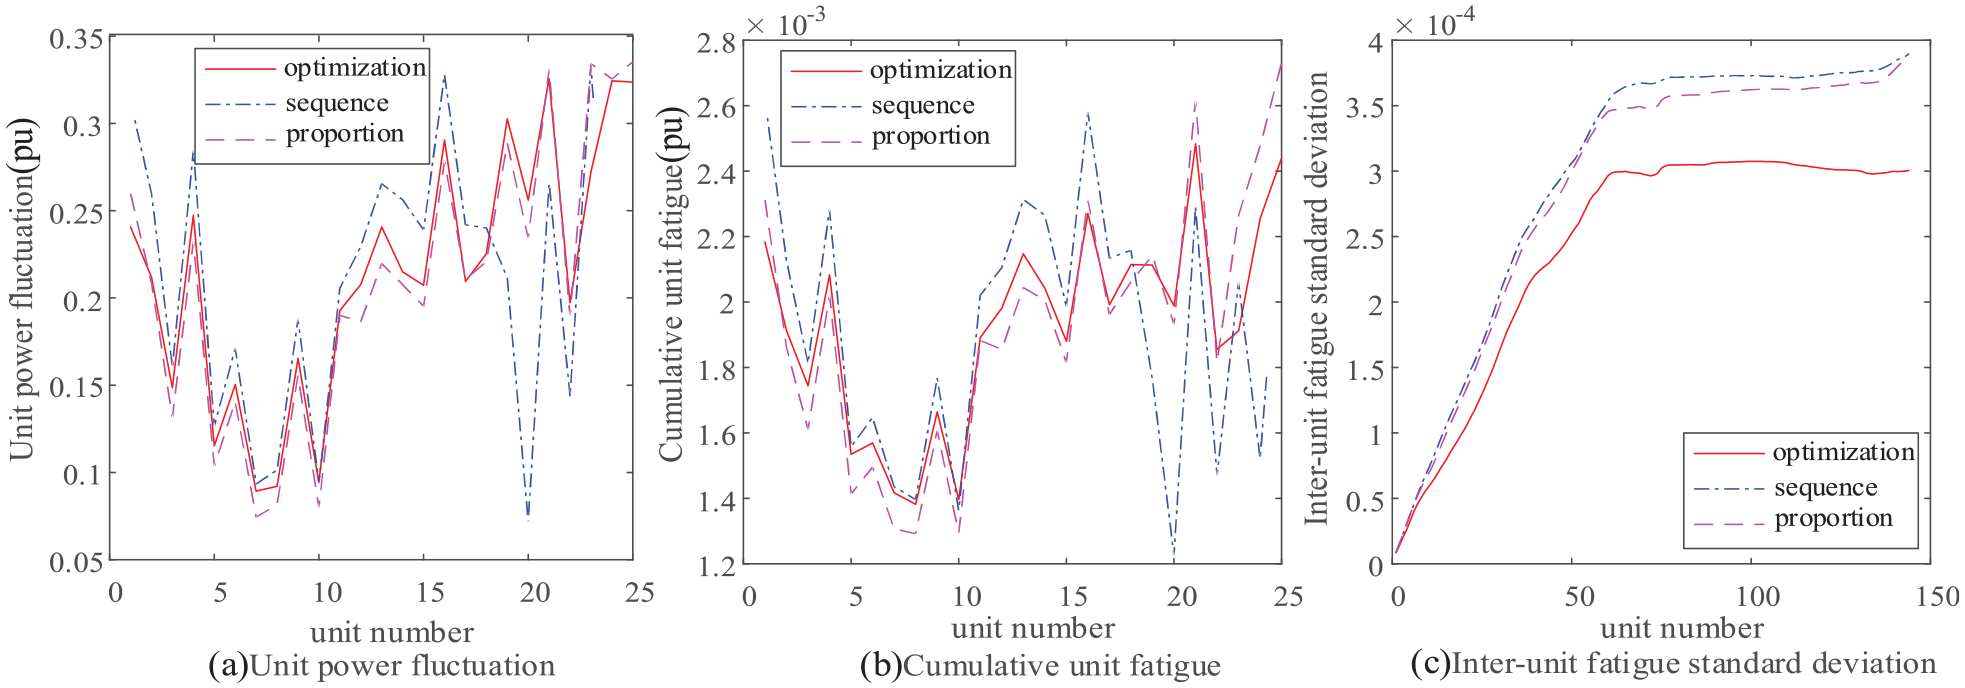
Power fluctuation and fatigue allocation among units under different schemes.
Standard deviation of cumulative fatigue and power fluctuation among units.
Under different schemes, the power generation of each unit in each control period is shown in Figure 8, with the label "#i" in the top left corner of each subfigure indicating the corresponding unit number. When using the proportional allocation method (shown as magenta dashed lines) for intra-field power scheduling, the power fluctuations of each unit are relatively large. With the sequential method (shown as blue dashed lines), as units are always scheduled by the wind farm in sequence according to their numbers, units with lower numbers exhibit larger power fluctuations, while those with higher numbers show the smallest fluctuations due to less scheduling among the three schemes. The wind farm effectively reduces the overall power fluctuations of each unit using the optimization method (shown as red solid lines) compared with proportional and sequential allocation. The comparison of the power of units WT1 to WT18 under the three schemes reveals that units under the optimization method exhibit smoother power fluctuations; The comparison of the power of units WT19 to WT25 under the three schemes reveals that although the power fluctuations of units under the optimization method are slightly larger than those under the sequential method, they are still significantly smaller than those under the proportional allocation method. The result consistent with the pattern described in Figure 7(a), indicates that the proposed optimization method can effectively reduce overall power fluctuations of each unit and decrease differences in power fluctuations between units.
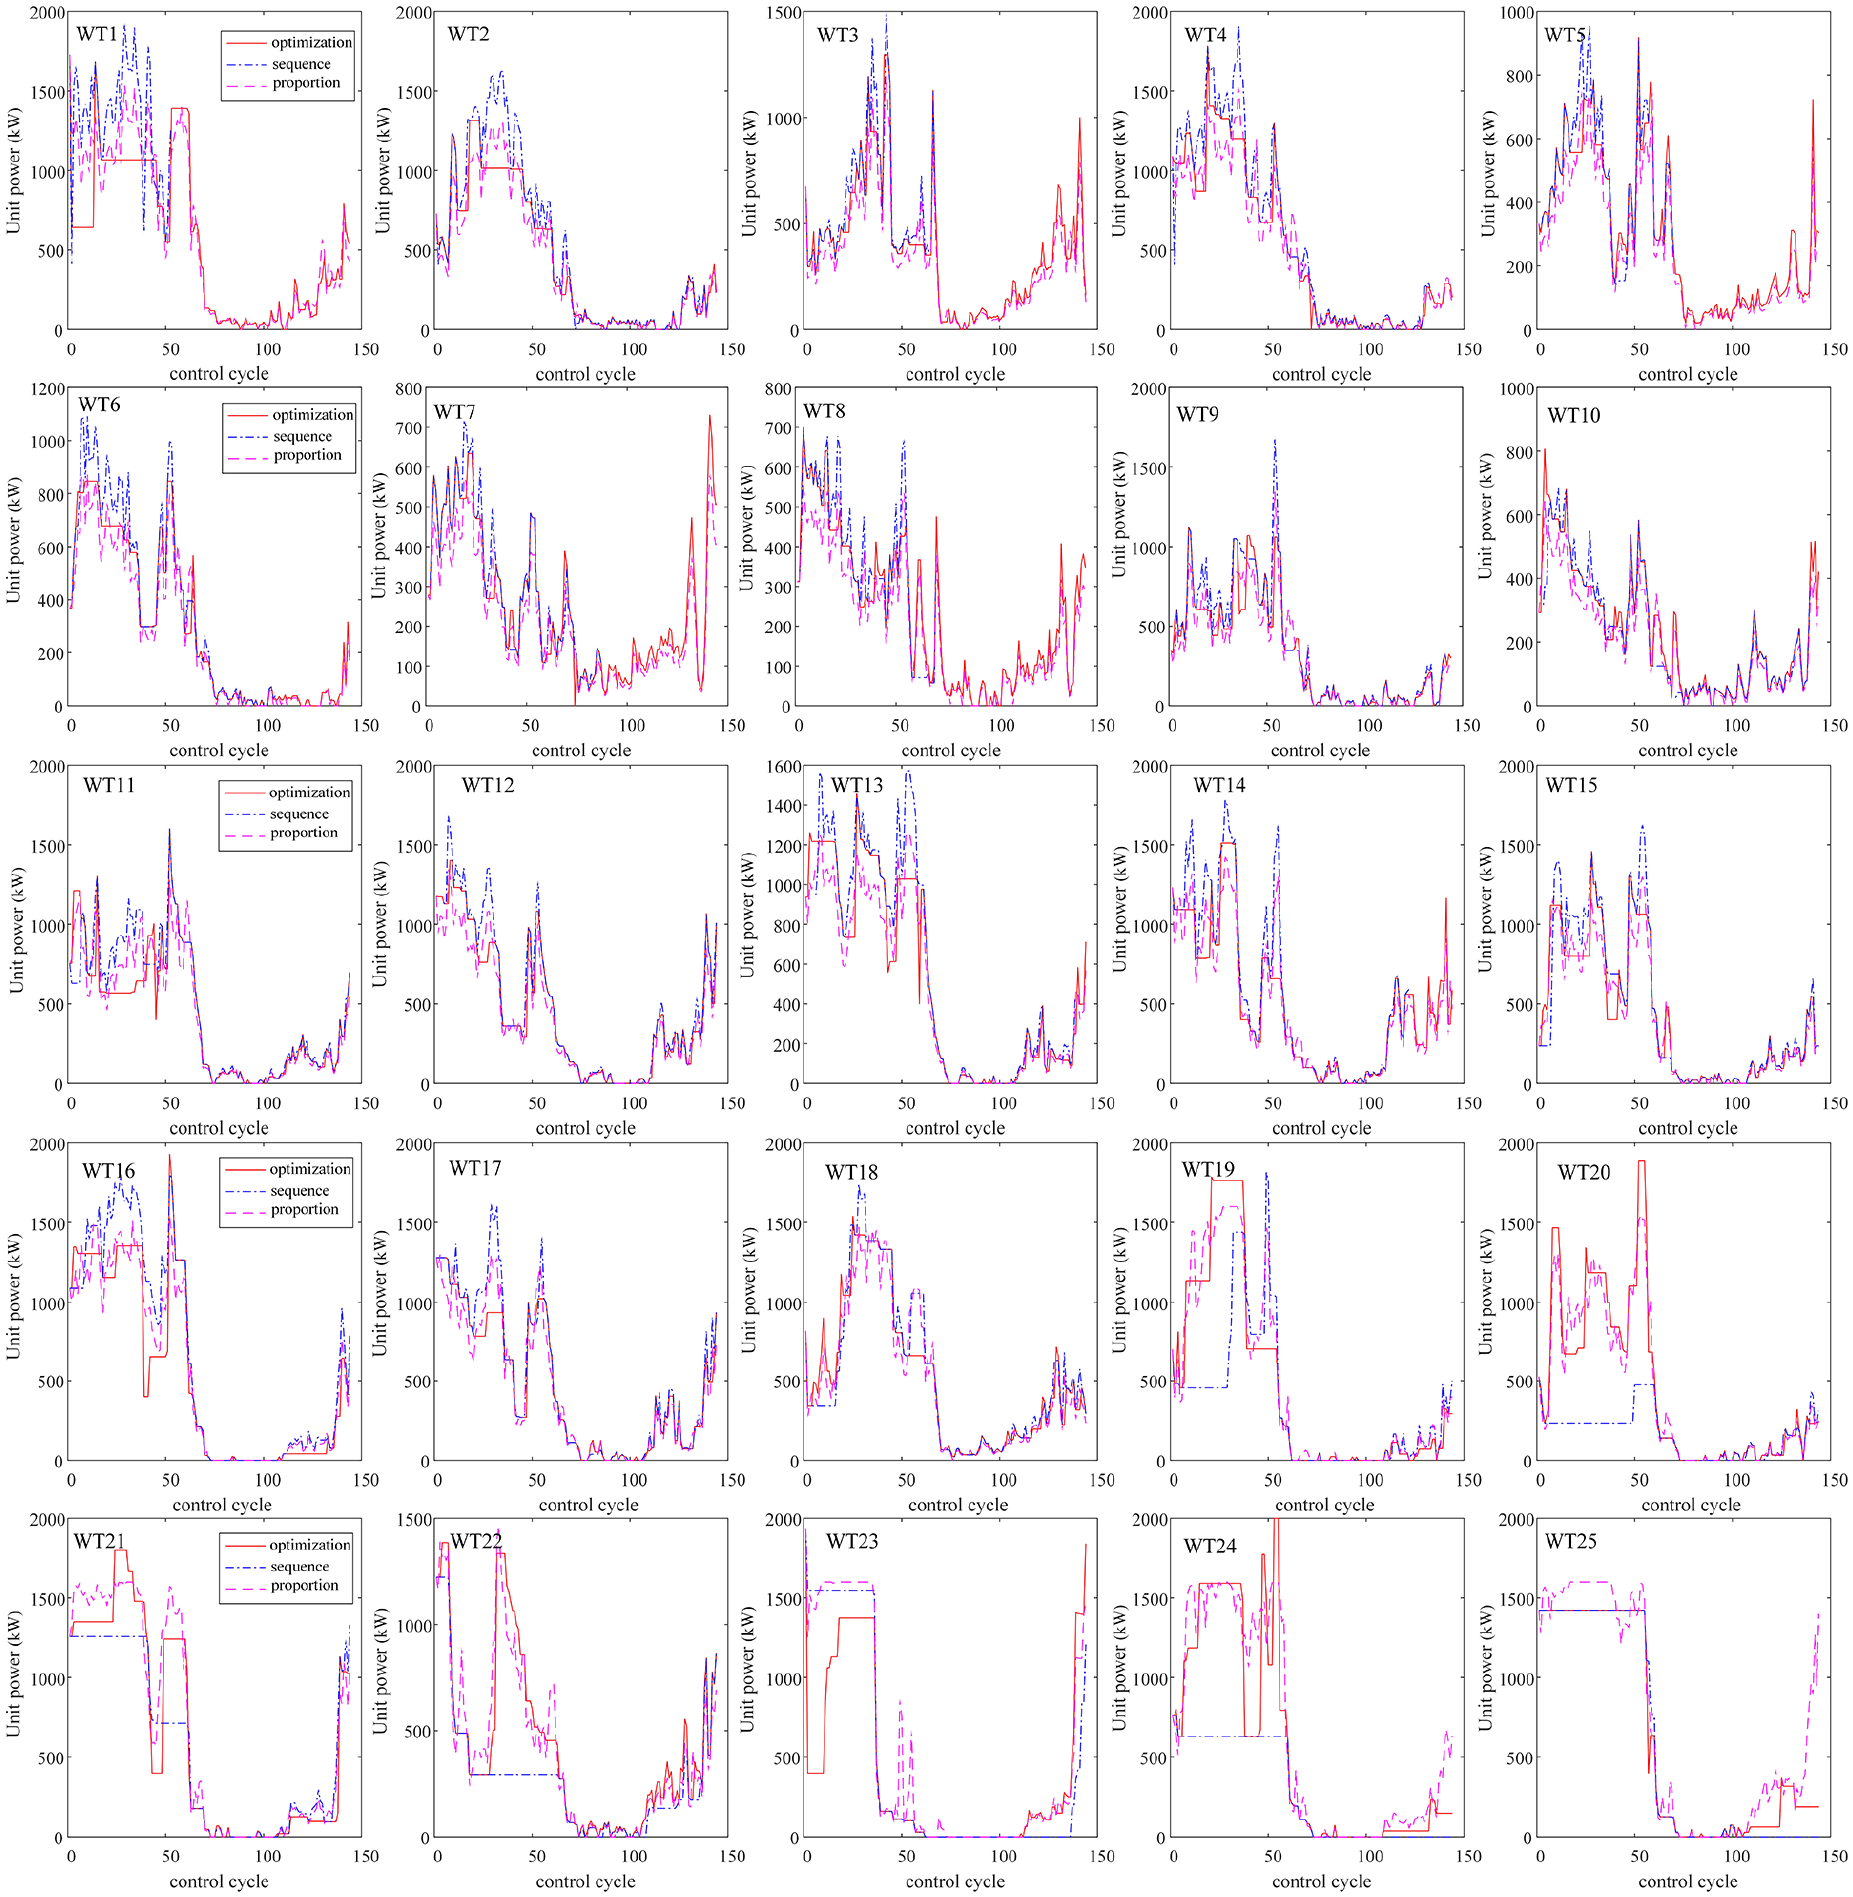
Power generation of each unit under different schemes.
Overall, the proposed wind farm active power optimization scheduling method based on unit state evaluations can effectively track power commands under different power limitation levels. Furthermore, it can significantly reduce power fluctuation differences between wind turbine units, load fatigue differences, and overall power fluctuations of each unit, thereby reducing wind farm operational costs.
Conclusion
Intelligent optimization algorithms and unit state evaluation methods are primarily employed in current research on active power scheduling of wind farms under power-limited operation. The former can achieve operational optimization for wind farms. However, the long calculation time and high dependence on the model accuracy of intelligent optimization algorithms are not conducive to real-time control applications. The latter is efficient in the calculation process but currently has deficiencies in wind farm operational optimization. In response to these problems, this paper investigates an active power optimization scheduling method for wind farms based on unit state evaluations, in an attempt to achieve operational optimization control of wind farms with lower computational complexity. More specifically, the following achievements are made in this study.
(1) Indicators in the comprehensive unit scoring system are defined, including the comprehensive fatigue coefficient, power fluctuation coefficient, wind curtailment rate, and power regulation margin of units. Using these indicators, the fuzzy entropy method is applied to calculating the comprehensive deterioration degrees for power up-regulation and down-regulation of each unit, which are then used for optimized ranking.
(2) Based on the power generation state of each unit, a detailed classification is performed to determine the power regulation capabilities of various unit types, ensuring the tracking accuracy of the overall power command of the wind farm. Active power optimization scheduling under power limitation is implemented based on the unit state classification and the ranked comprehensive deterioration degrees for power up-regulation and down-regulation.
(3) The historical data recorded by the SCADA system of a wind farm in Northwest China is used for the simulation analysis to verify the effectiveness of the proposed active power optimization scheduling method. The results demonstrate that the proposed method can effectively track the power commands of the wind farm under different power limitation levels. When the power limitation degree of the wind farm is 0.8, the proposed optimization method achieves power tracking, with the MAE, MAPE, and RMSE being 760.6784 kW, 0.1176, and 1.1167 × 10³kW, respectively, presenting higher tracking accuracy than the sequential and proportional allocation methods. The SD of the cumulative fatigue and power fluctuation coefficient between units under the optimization method is 3.0074 × 10⁻⁴ and 0.0705, respectively, all indicators have experienced a minimum reduction of 9.85%, both significantly lower than those under the sequential and proportional allocation methods. In conclusion, the proposed method can effectively reduce the power fluctuation differences and load fatigue differences between units, as well as the overall power fluctuations of each unit, thereby reducing the operational and maintenance costs of the wind farm.
Footnotes
Declaration of conflicting interests
The author(s) declared no potential conflicts of interest with respect to the research, authorship, and/or publication of this article.
Funding
The author(s) disclosed receipt of the following financial support for the research, authorship, and/or publication of this article: This work was supported by the Fundamental Research Funds for the Central Universities (Grant No. B240201171), Applied Basic Research Program of Changzhou (Grant No. CJ20240094), National Natural Science Foundation of China (Grant No. 52406234), Research and Application of Key Technologies in the Design of Large Onshore Smart Wind Power Base (Grant No. XBY-ZDKJ-2020-05), Scientific Research Project of China Electric Power Construction Corporation (Grant No. DJ-ZDXM-2020-52).
Ethical approval
The authors declare that all subjects in the study herein were not human and did not include any animal studies conducted by the authors. Informed consent was obtained from all participants in the study. There are no human participants in this article and informed consent is not required.
Informed consent
Written informed consent for publication was obtained from all participants.
Data availability statement
Data sharing not applicable to this article as no datasets were generated or analyzed during the current study.