
Abstract
Zambia's electricity generation mix currently excludes wind power, despite the potential for wind energy to mitigate power deficits and increase renewable energy generation. This study evaluates the wind energy potential in Lunga District, Luapula Province, using wind speed data collected at 40 m, 50 m, and 60 m hub heights from 2017 to 2018. The annual mean wind speed was found to be 5.4 m/s at 60 m and 6.8 m/s at an extrapolated hub height of 116.5 m, indicating moderate wind conditions suitable for wind energy harvesting. Two wind farm scenarios were analyzed: (1) two Vergnet GEV MP-200 wind turbines (60 m hub height) and (2) two Vestas V117-3.45 wind turbines (116.5 m hub height). Using WAsP and WindPRO software, the P50 net energy yields were 525.4 MWh/year and 30.2 GWh/year, respectively. This study highlights the feasibility of utilizing wind energy for rural electrification and provides a basis for policy formulation to encourage private sector investments. Future research should include financial feasibility studies and environmental assessments to support the deployment of wind energy projects in Zambia.
Introduction
Zambia's energy resources include hydropower, petroleum, coal, biomass, and other renewable energy sources. The country only imports petroleum. The energy sector in Zambia consists of three main sub-sectors: electricity, renewable energy, and petroleum. The installed generation capacity in Zambia is 3356.6 MW. The installed capacity comprises 83 percent of hydro, 9 percent of coal, 5 percent of heavy fuel oil, and 3 percent of solar PV. The mining sector remains the largest consumer of power at 51% of total generated electricity, followed by the domestic sector at 33% (Ministry of Energy, 2023). During the last 15 years, electrification rates have marginally increased from 3 to 11% in rural areas, representing the status quo of access to modern energy in these areas but also showing the unlikelihood of attaining the 2030 rural electrification target of 51% (Kaoma and Gheewala, 2021b). In Zambia, the rate of deforestation is approximately 250,000 and 300,000 hectares a year (ILUA, 2010). The household sector is the largest energy consumer in the form of woodfuel for cooking and heating (ILUA, 2010). Rural Electrification Authority (REA) has the responsibility to spearhead the rural electrification agenda for the country with an overall mandate of increasing the availability of electricity in rural areas from the current 4%–51% by 2030 (Kaoma and Gheewala, 2021a).
Many human activities in the world contribute to enormous emissions of contaminated gases and increased pollution of the environment. Among all these activities, the primary and most significant cause is the generation of electricity by nonrenewable sources (Khan et al., 2023). Energy, primarily in the form of electricity, has become an indispensable element for the success and growth of a nation. Conventionally, the ever-increasing energy demand requires the utilization of fossil fuels; however, due to rising environmental concerns and the depletion of primary energy supplies, it is necessary to enhance the usage of renewable energy resources to meet the increased energy demand (Mohamadi et al., 2021).
Governments have turned to renewable energy to reduce the use of fossil fuels since they play a significant role in mitigating global warming and reducing greenhouse gas emissions. Renewable energy is environmentally friendly, low-cost, and sustainable. Renewable energy technologies lead to sustainable economic development and environmental protection (Mutale et al., 2024a; Zaid et al., 2023). Global sustainable development is heavily dependent on Annual Energy Production (AEP). It is estimated to reach three times its current value by 2050, especially for the rapid economic growth of countries like China and India. Energy consumption per capita is a result of the demographic conditions of a particular region and grows over time (Adnan et al., 2021).
The growth of wind power is due to declining costs, improved technology, and supportive government policies. The average cost of wind power has fallen dramatically over the past decade, making it increasingly competitive with traditional energy sources such as fossil fuels. In addition, advances in wind turbine technology have improved the efficiency and reliability of wind power systems, increasing their appeal to investors and consumers alike (Odoi-Yorke et al., 2022). The Agenda 2030 for sustainable development comprises three facets: decreasing poverty, the correct distribution of resources and justice, and sustainable energy and environment of the planet. On the face of it, green energy was central to an agenda that focuses on reliable, affordable, and accessible energy to all. The overall objective of the United Nations General Assembly (UNGA) is to meet future energy demands via renewable energy is achievable while minimizing the impact of a dangerous environment (Hulio, 2021). With this background, there is a dire need for the supply of modern energy carriers from sources that are alternative or complementary to those currently being used in the rural areas of the country (Kaoma and Gheewala, 2021a).
Among other potential energy sources, this study focuses on wind energy. Several authors have applied different methods or techniques to assess the feasibility of wind energy for electricity generation. Mohamadi et al. (2021) used WAsP, and results show that Mapna 2.5 MW and Vestas V100–1.8 MW 60 turbines were more efficient in terms of annual energy production and cost of producing electricity. Economic analysis showed that investment in wind farms in eastern parts of Iran may result in high profitability. Zaid et al. (2023) employed WAsP, and results indicate that annual energy production of 29,7859 MWh is possible with an optimized design of wind farm that will help to reduce 12,648 equivalent tons of CO2 emissions in the Northern coastal region of the Arabian Sea. Dabar et al. (2022) applied the ERA5 model wind reanalysis in the Republic of Djibouti. Results indicate that the seasonal variability of wind is stable between different years. The study estimated that proposed wind farms could generate 1739 GWh per year of electrical energy with LCOE ranging from 6.94 to 13.30 US cents/kWh less than the local electricity tariff.
Kaoga et al. (2016) studied wind energy potential and estimated wind-generated electricity potential at hilltops surrounding the city of Maroua in Cameroon by applying numerical computations. The results establish that the lowest costs per kWh were obtained from YDF-1500-87 (1500 kW) turbine, while the highest costs delivered were by P-25-100 (90 kW). The lowest costs (US$) per kWh of electricity generated vary between a minimum of 0.0294 at hilltops 350 m AGL and a maximum of 0.0366 at hilltops 150 m AGL, with corresponding energy outputs that are 6125 and 4932 MWh, respectively. Olayinka et al. (Ohunakin et al., 2012) applied wind energy conversion systems (WECS) in Nigeria for 6 locations, and the results showed that the capacity factors of the two turbines in the selected sites ranged between 4.6 and 43%. The average minimum cost per kWh was obtained in Kano as $0.0222/kWh with AN Bonus 1 MW, while the highest average cost was $0.2074/kWh with AN Bonus 300 kW in Kaduna. The highest cost in each location was obtained by using medium WECs (AN Bonus 300 kW). In addition, Kano and Katsina had very economical results for any of the adopted wind turbine models. Gusau and Kaduna, at a cost of unit energy of about $0.30/kWh, were found to be more profitable for non-connected electrical and mechanical applications (water pumping, battery charging) than diesel generators.
Alham et al. (2023) investigated the potential of wind energy and economic assessment in Egypt considering optimal hub height by equilibrium optimizer. They developed a MATLAB program for statistical analysis of wind data. The results showed that Ras El-Hekma's average wind speed was higher than other sites, and its wind energy potential is the most economical. Moreover, the economic assessment for selected locations was that Ras El-Hekma, using EWT-DW61/22, the turbine has the lowest Cost of Electricity (COE). Farivar et al. (Fazelpour et al., 2017) investigated wind energy potential and economic assessment of four locations in Sistan and Balouchestan province in Iran using Windographer software. The estimated annual energy densities were 2495.36, 2355.69, 1265.24, and 1214.01 kWh/m2 /year, and the annual mean power densities were 284.97, 269.02, 144.49, and 138.64 W/m2. Results show that Zabol and Zahedan are suitable for large-scale power generation. The results indicate that using DW61-900 kW wind turbines is highly beneficial for Zabol and Zahak, while for Zahedan, DW52/54-250 kW wind turbine is more appropriate for generating electricity. However, Mirjaveh is suitable for off-grid applications. Harijan et al. (2010) revealed that the annual technical potential of centralized grid-connected wind power in the coastal area of Balochistan is estimated to be 42.5 TWh, which is about half of the current gross electricity generation in Pakistan.
Lack of appropriate industry-standard wind data is the major challenge in wind power development. The available wind data is used for agriculture and weather forecasting purposes and has been recorded for over 30 years. The Zambia Metrological Department (ZMD) is responsible for recording and analyzing the wind data. This data is recorded at heights of between 2 and 10 m (Banda et al., 2019; Mutale et al., 2024b). There are only three notable wind resource assessment studies in Zambia. The World Bank, working with the Ministry of Energy, engaged Garrad Hassan America, Inc. (DNV GL) to conduct a 24-month wind resource assessment, which consists of an independent analysis of the wind regime and energy production at eight locations across Zambia, as part of the renewable energy wind mapping for Zambia (part of the ESMAP Program). Based on two years of data collection, DNV GL has evaluated the wind resource at each location, the long-term wind regime, and the estimated energy production based on a generic 4 MW wind turbine with a rotor of 140 m and a hub height of 130 m (Department of Energy, 2019). The second assessment was by RINA on behalf of Kafue Gorge Regional Training Centre (KGRTC). The aim was to install a mast and conduct a feasibility of installing a single Wind Turbine Generator (WTG) at a site within the Kafue Gorge. The proposed WTG is of grid-scale despite its purpose being for training applications. Data collection commenced on 7 February 2017 using the installed 60 m mast. At the time of the Energy yield analysis (EYA), 13.5 months of locally measured data was available for processing. The annual average wind speeds obtained in Namalundu indicate average wind speeds of 5.2 m/s at 95 m above ground level for Class IV WT, which is adequate for its operations (Harijan et al., 2010).
This study is the third wind resource assessment conducted by the Technology Development and Advisory Unit (TDAU), University of Zambia, working with the REA in Lunga District. The study's main contributions are as follows;(1) Wind characteristics analyzed at 40 m, 50 m, and 60 m; (2) Assessment of two wind turbines from notable manufacturers suitable for wind power generation: and (3) EYA performed. The findings from this study will provide insights into the feasibility of wind power projects in Lunga District and support the Zambian Government and REA to develop policies that encourage private sector investment. The results will also enhance the knowledge of wind power in Zambia, promoting the country's transition towards clean and sustainable energy. Further, the findings will be important as guidance for developing wind power projects in Zambia and other places where the wind speed is low to moderate for the particular wind turbine.
Materials and methods
Site description and energy data
The project site shown in Figure 1 is located in Lunga District which is one of the poorest rural districts in the country (Mutale et al., 2023). It is located approximately 800 km north of Lusaka the capital city of Zambia. The terrain in the study area is relatively flat with minimal topographical variations, as observed through field inspections and satellite imagery. The roughness class for the site was estimated to range between 0.03 and 0.1 m, representing grassland to sparse shrubland conditions. These characteristics make the application of logarithmic and power-law models suitable for wind speed extrapolation. However, the models have potential limitations, particularly in accounting for microscale terrain variations or non-neutral atmospheric conditions. To mitigate these, sensitivity analyses were performed, comparing model extrapolations to long-term reanalysis datasets (MERRA2 and EmdERA), which showed strong correlations. This ensures the reliability of the models for the given site conditions. People use firewood and charcoal as a source of energy. The Government through REA plans to set up a wind farm to power Institutions and the community in the district.
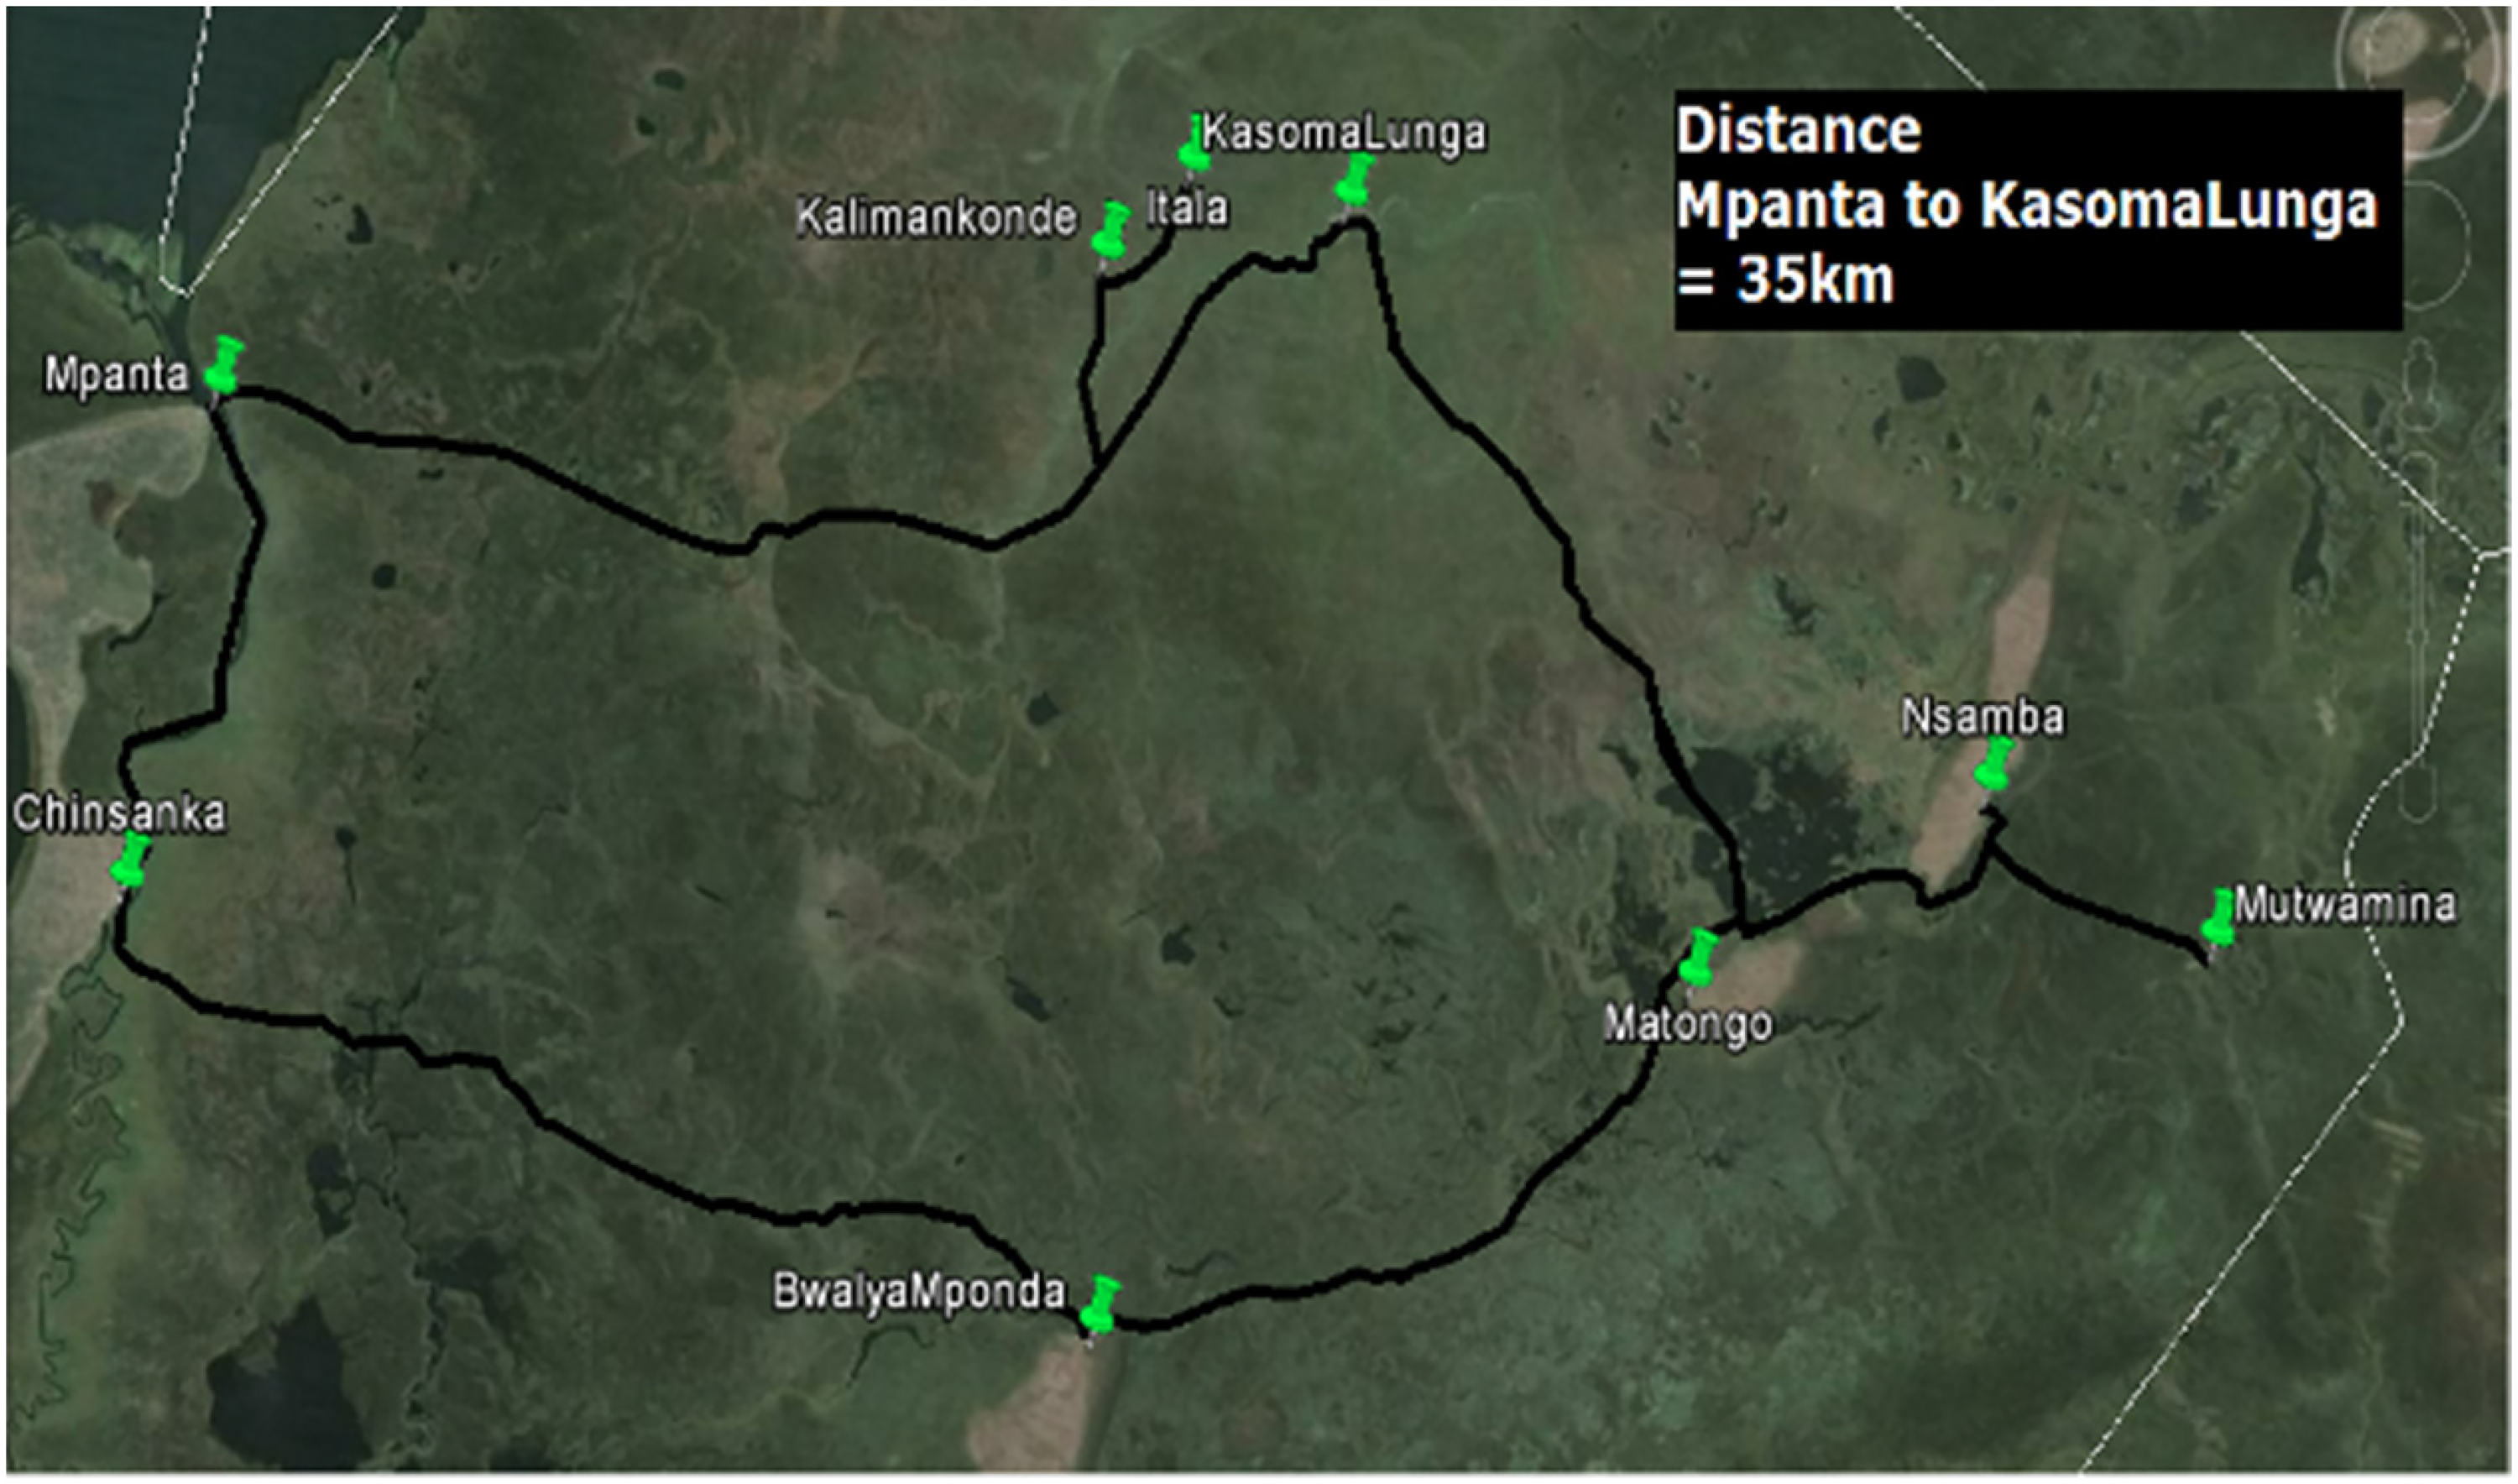
Project site; Lunga district.
One of the two wind atlases considered in this study was the first Zambia wind map shown in Figure 2 generated under the ESMAP-funded World Bank project on renewable energy resource mapping and geospatial planning.
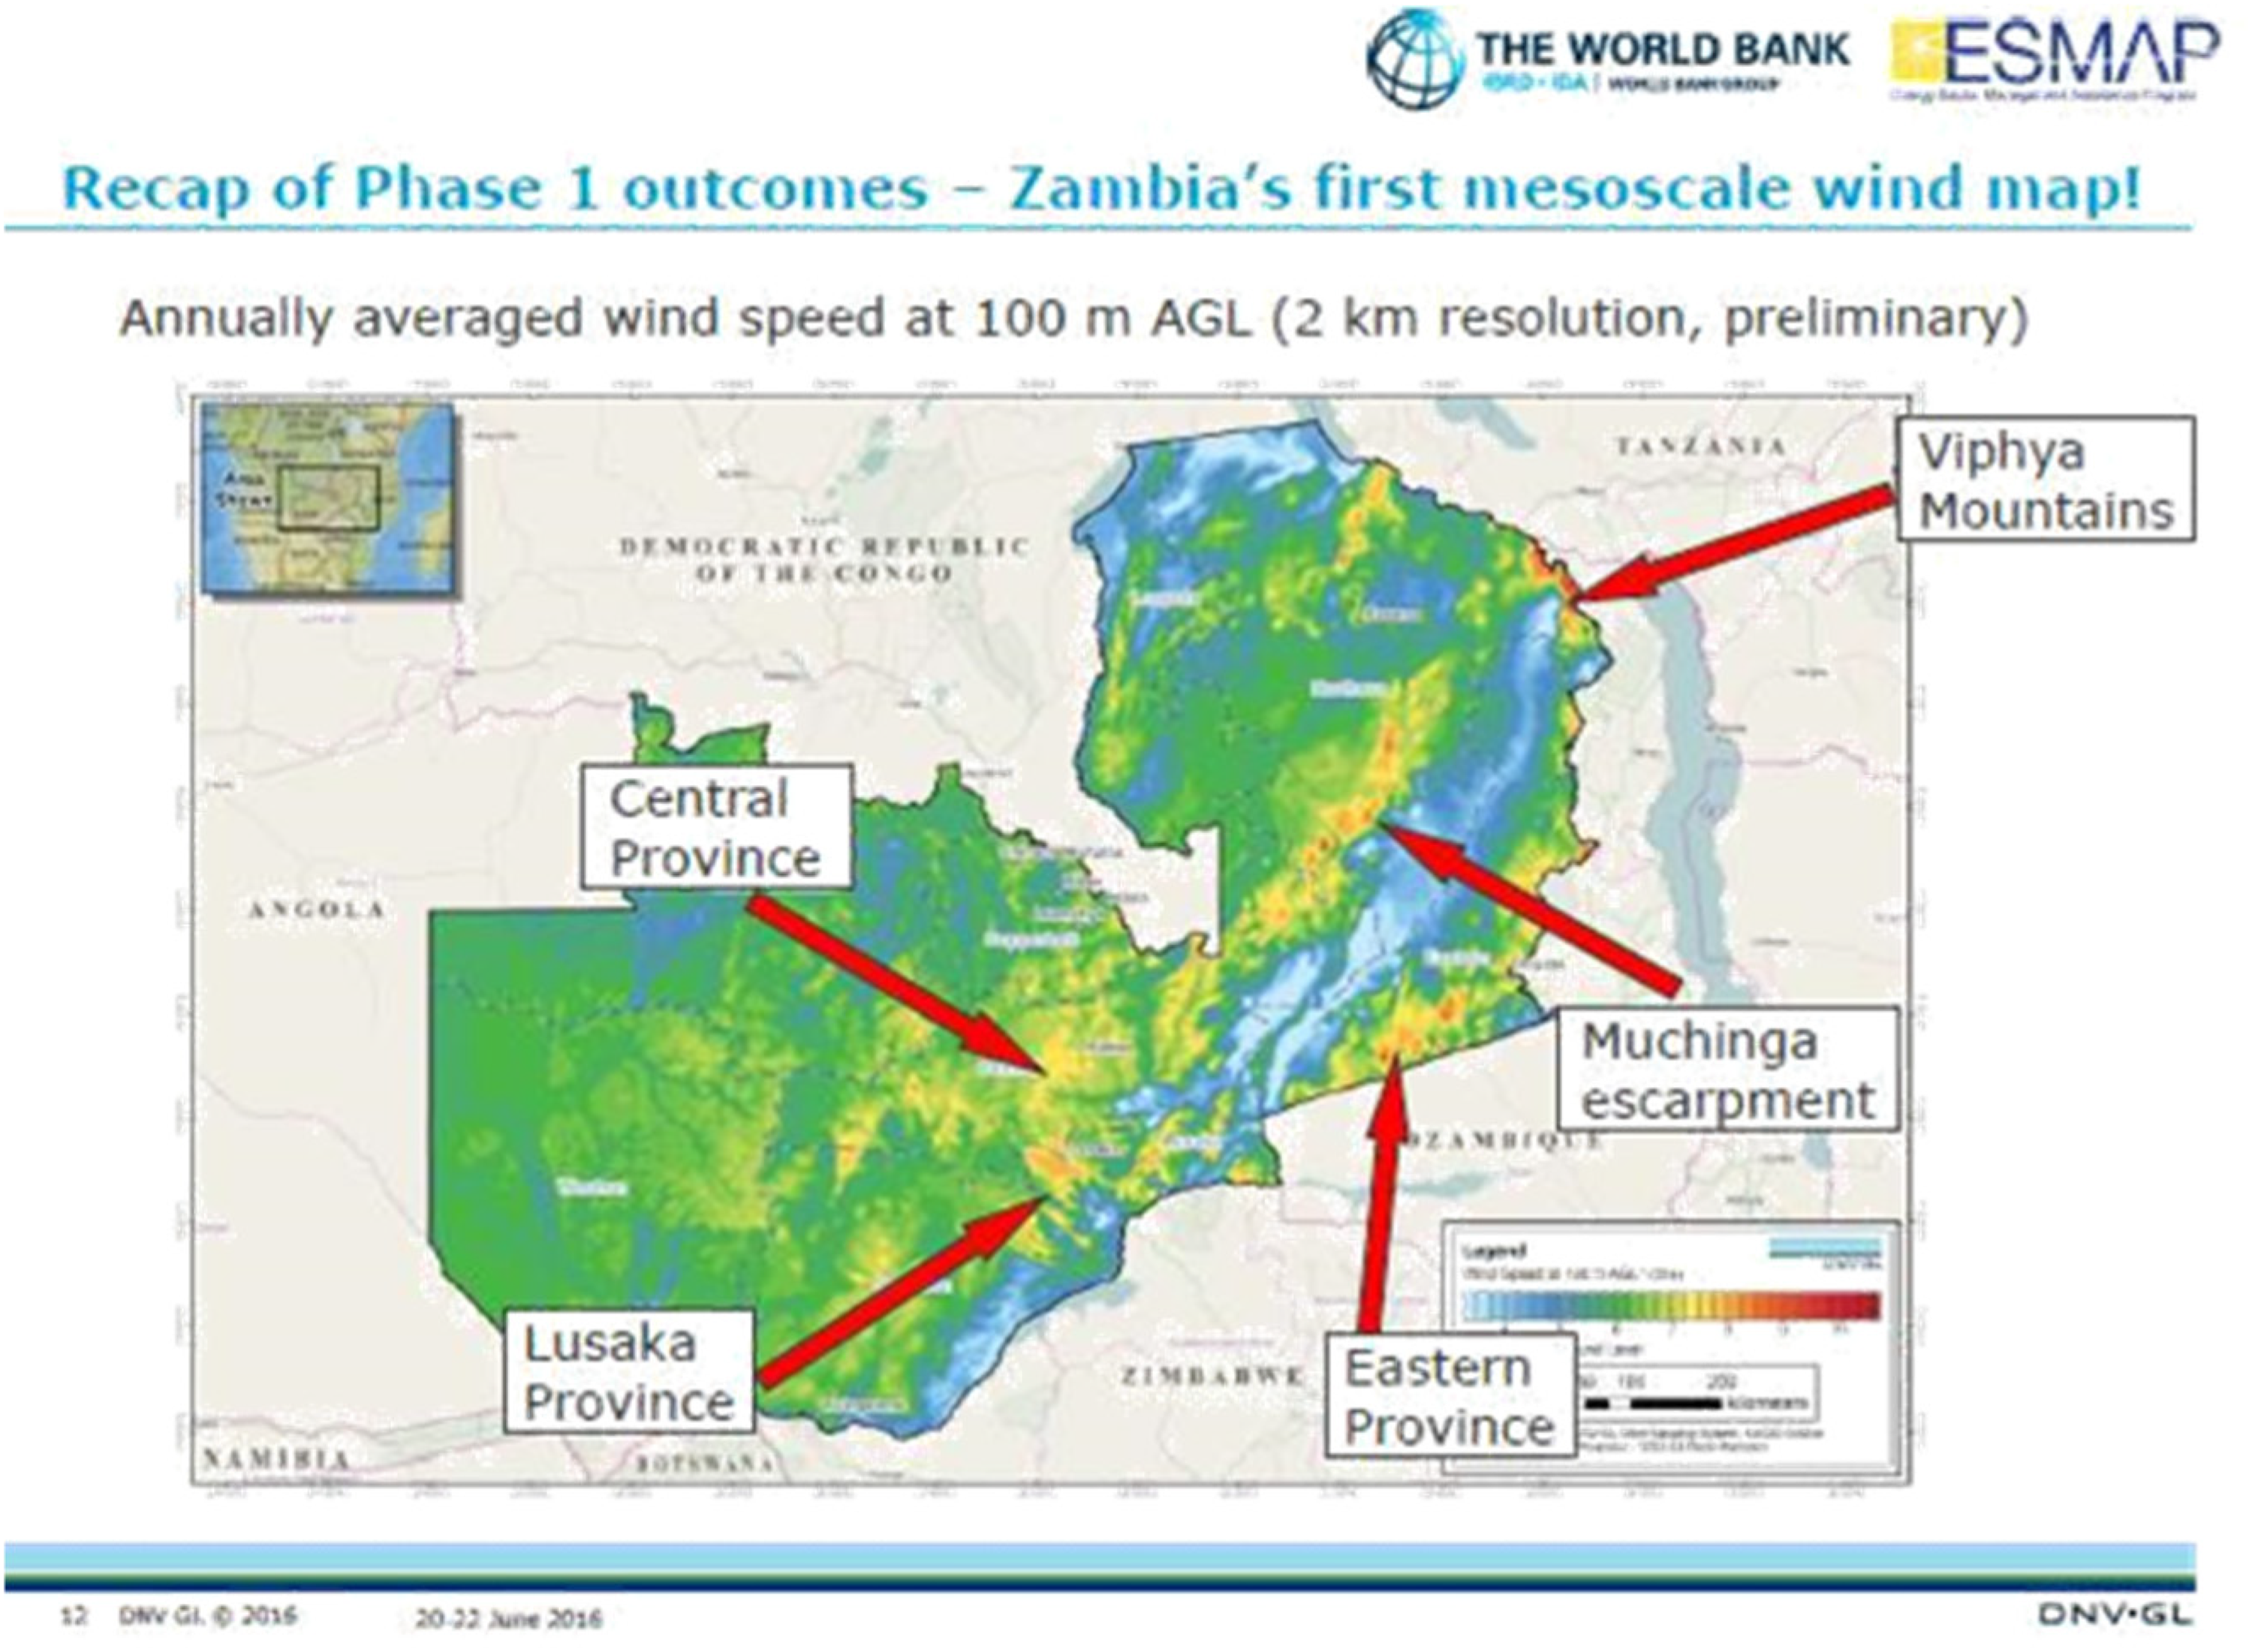
ESMAP/World Bank project on renewable energy resource mapping and geospatial planning.
The second wind atlas considered is shown in Figure 3 by the Technical University of Denmark (DTU) Global wind atlas obtained from the IREENA platform. However, the first interim Zambia wind map has a resolution of 2 km and is a work in progress. The material was provided to specific stakeholders and was not for public distribution. The wind speed for the site was estimated using DTU global wind atlas with a resolution of 250 m. From the DTU Global wind atlas, the site had an indicative wind speed of around 5.5 m/s.

DTU global wind atlas from the IREENA platform.
The data used in this EYA was measured on-site using a 60 m met mast. Mast installation was in the last week of February 2017, and approximately 12.7 months of data collection. Table 1 presents a summary of the mast details.
Details of RNRG Systems 60 m XHD monopole mast.

Wind resource evaluation and assessment requires a dedicated International Electrotechnical Commission (IEC)-compliant met mast to measure the wind speed at a hub height. The met mast has the necessary instruments to measure and record wind and atmospheric data. Table 2 presents the Instrument configuration of RNRG systems 60 m XHD monopole mast. The mast has structural components, instrumentation, and data-logging equipment for measuring, recording and storing wind data.
Instrument configuration of RNRG systems 60 m XHD monopole mast.

Figure 4 shows the installed 60 m XHD tall tower and inspection of the data logger in Lunga District.
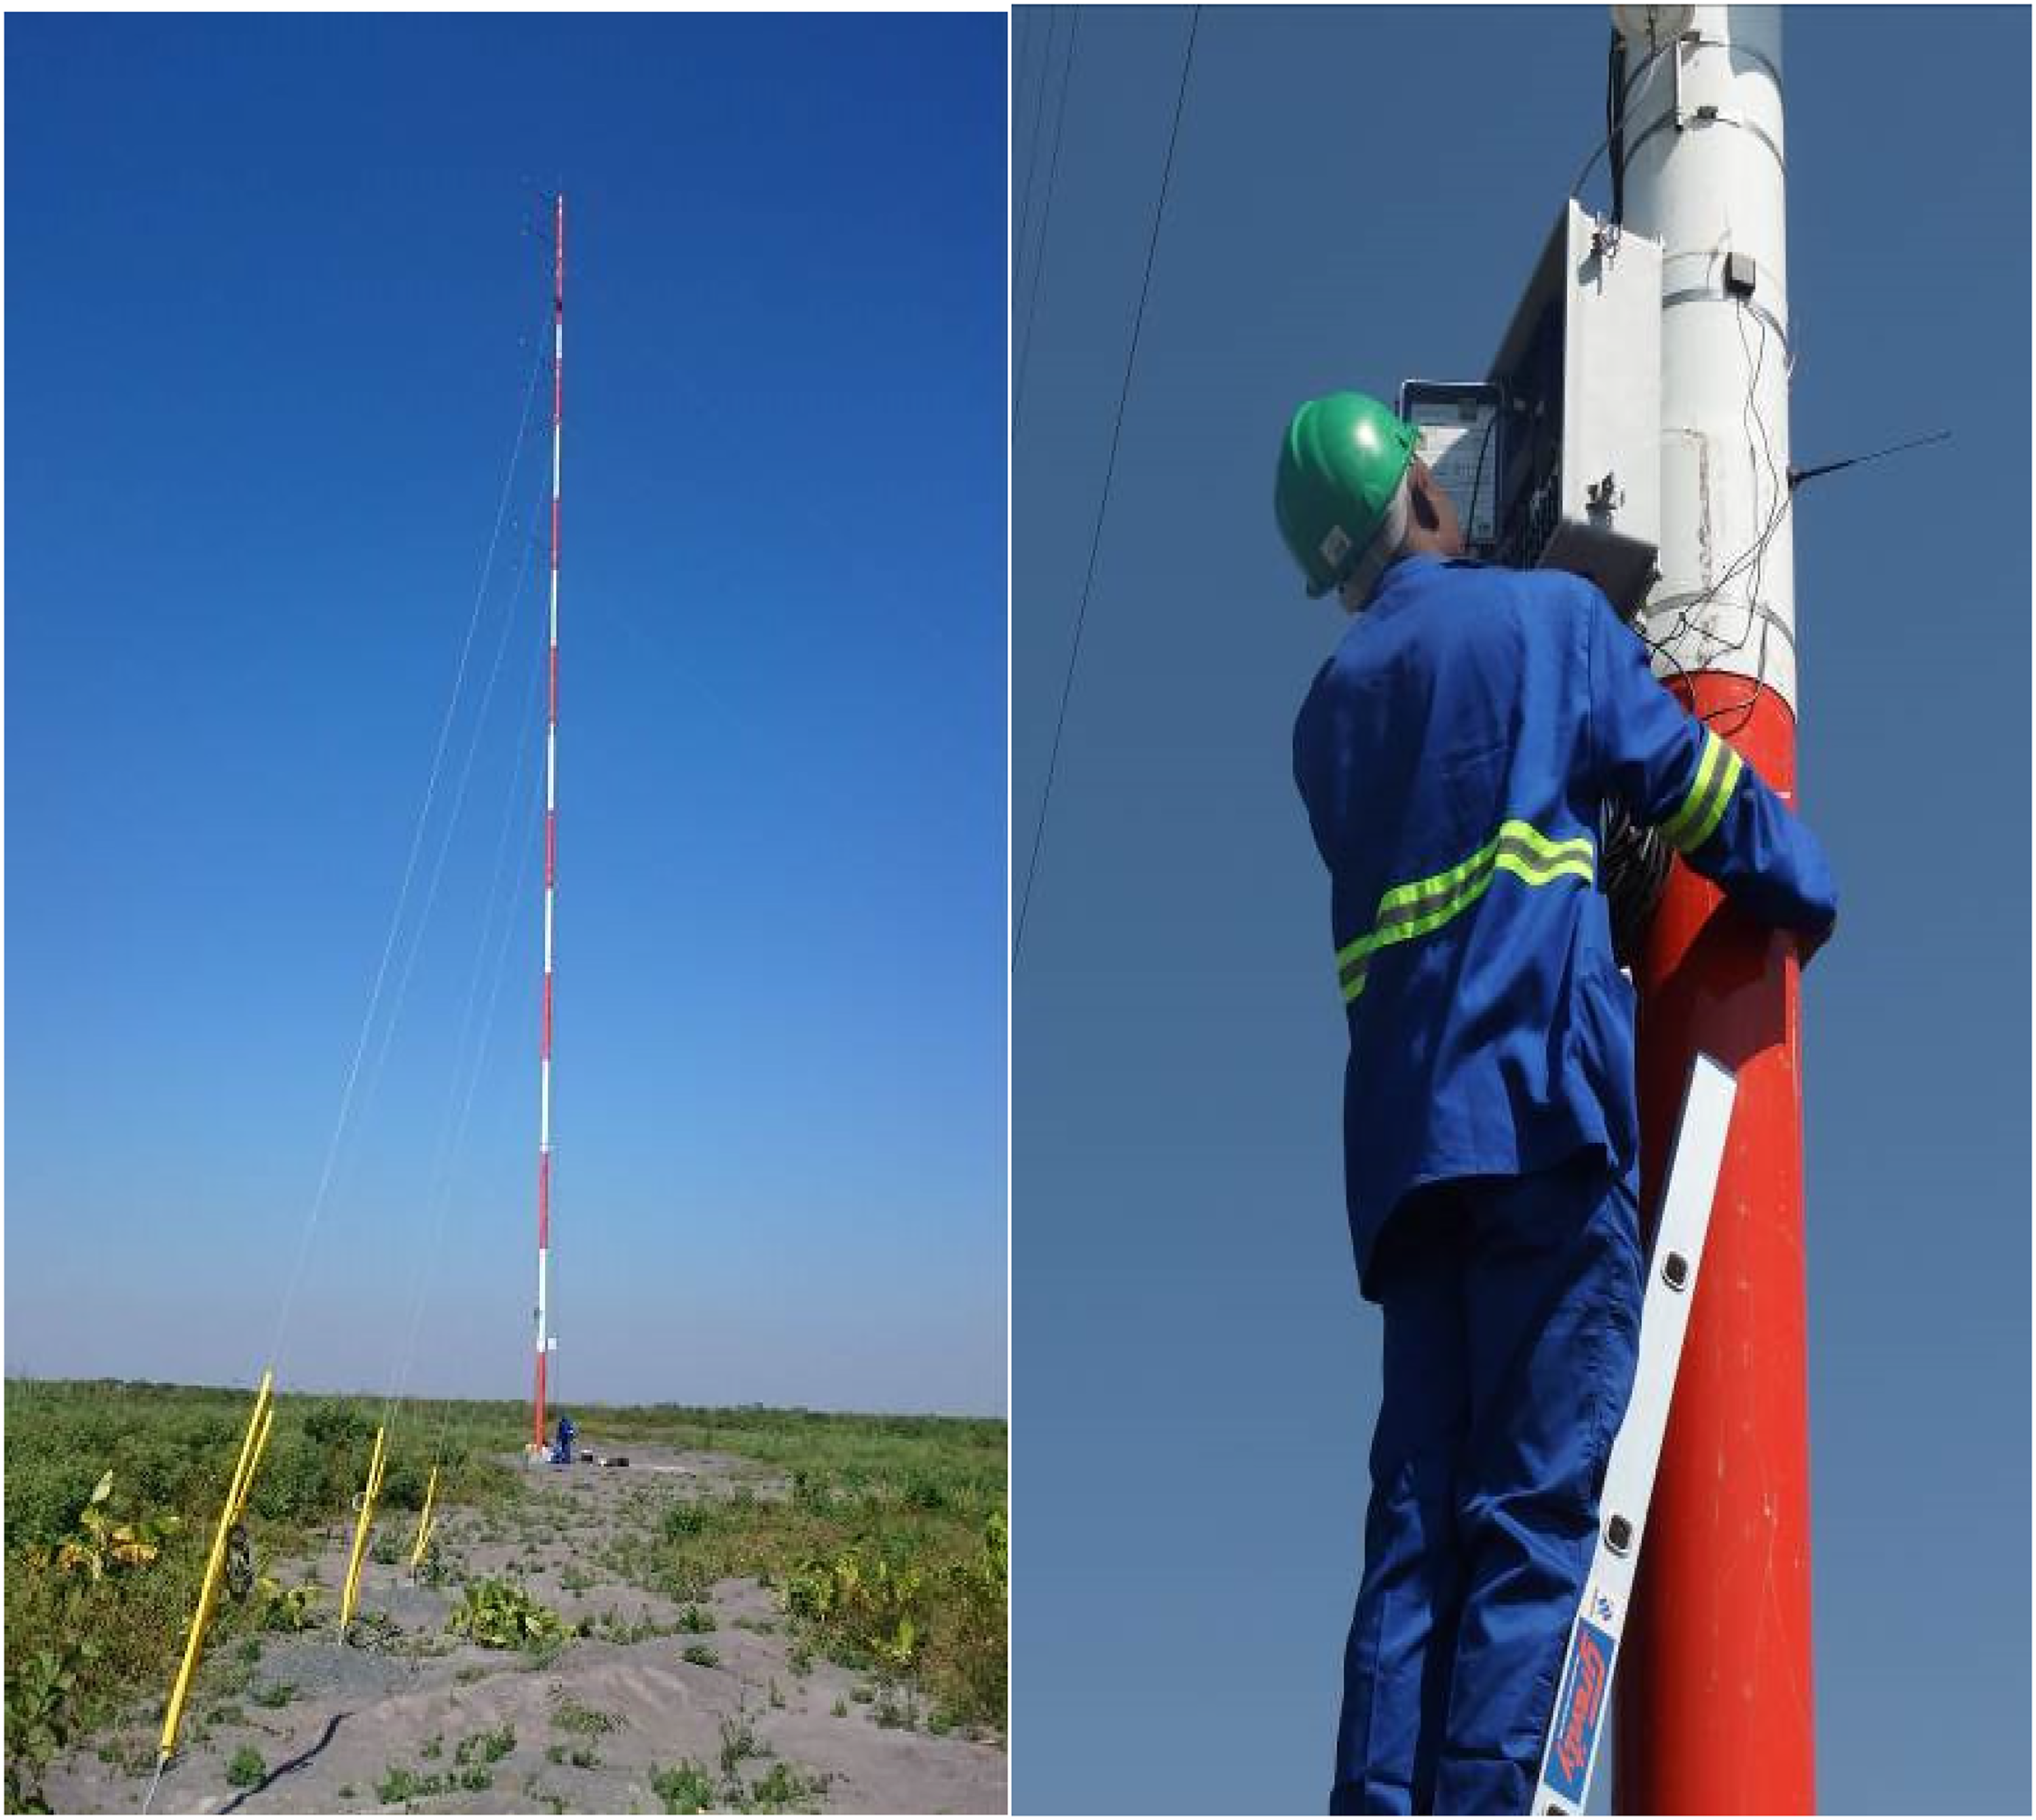
Installed 60 m XHD tall tower, inspection of the data logger and shelter box.
Methodological approach
To analyze the data generated, WAsP software was applied for wind energy analysis. In this study, performance optimization of two commercial wind turbine models was by WindPRO software for the wind farms. Figure 5 presents the methodology approach for wind energy analysis and EYA calculation.
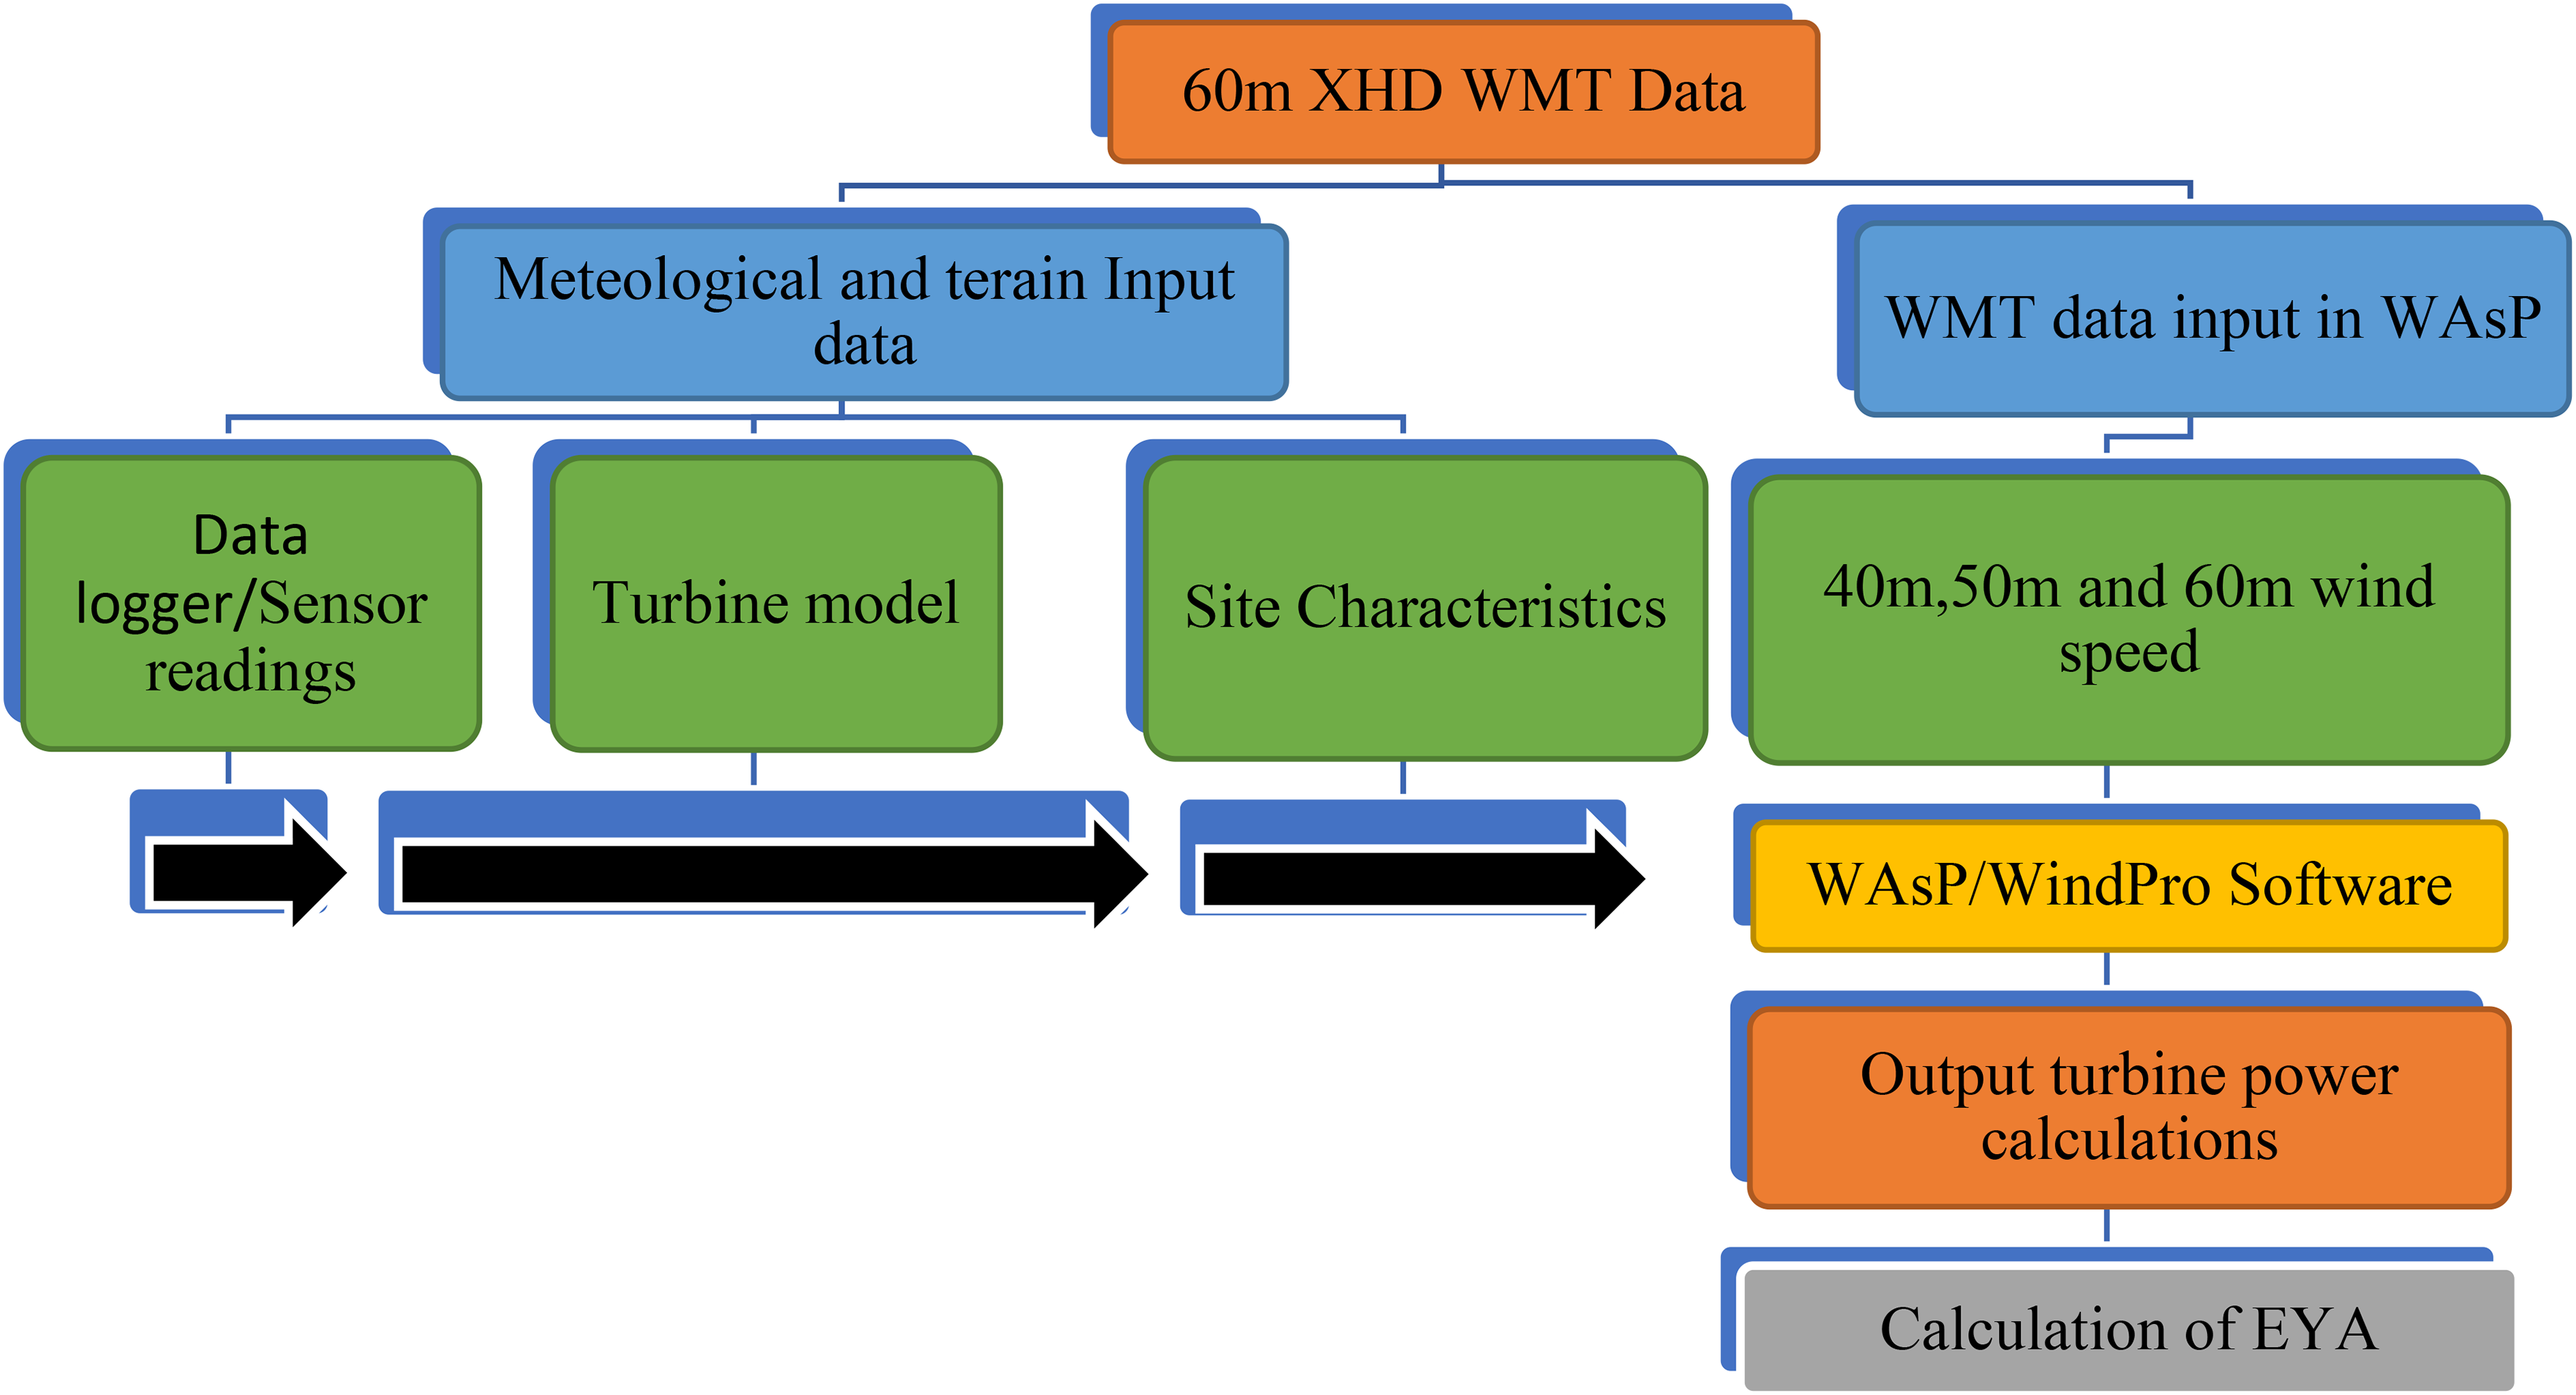
The methodology applied in calculating EYA.
Wind analysis model
To calculate the frequency distribution of wind speeds, WAsP uses the Weibull function shown in the following equation:

Wind power density
The power of the wind that flows at a speed of (v) through a blade sweep area of (Sw) is as shown in the equation below.
The study assumed neutral atmospheric stability for wind speed extrapolation using the logarithmic and power-law models. This assumption simplifies calculations but may not fully capture the effects of non-neutral stability conditions (e.g. stable or unstable stratification). While the Richardson number (Ri) is a standard parameter for evaluating atmospheric stability, it was not calculated due to the lack of on-site temperature gradient and vertical wind shear data. Instead, diurnal wind speed and turbulence intensity patterns were analyzed to infer stability qualitatively. Higher wind speeds and reduced turbulence at nighttime suggested stable conditions (Ri > 0.25), while lower wind speeds and increased turbulence during daylight hours implied unstable conditions (Ri < −0.25). These qualitative observations align with typical atmospheric behavior in flat terrain.
The potential impact of non-neutral conditions includes suppressed vertical mixing under stable conditions, which could underestimate extrapolated wind speeds, and enhanced mixing under unstable conditions, which may overestimate extrapolated wind speeds. To account for these effects indirectly, sensitivity checks were performed by correlating the site-measured data with long-term reanalysis datasets (MERRA2 and EmdERA), which inherently consider stability effects. Future studies at the site should incorporate high-resolution temperature and wind shear measurements to calculate Ri and explicitly model the effects of non-neutral stability. This approach would provide a more robust evaluation of atmospheric stability and improve the accuracy of wind speed extrapolation.
The Weibull probability density function is used to calculate wind power density as shown in the following equation (Mohamadi et al., 2021; Zaid et al., 2023):

Wind energy density
Wind energy density estimation is knowing the wind power. The following equation for calculating wind energy density in a desired time, T (Fazelpour et al., 2017):
Vertical extrapolation of mean wind speed
Various mathematical models are used to describe the vertical profile of wind speed. The logarithmic law; is used to calculate the average wind speed V at height Z. This method depends on the roughness Zo in the situation of neutral stability. For a relatively flat field close to the ground, the calculation is as shown in the following equation;
Wind turbine energy production
The average power generated by that turbine is expressed by (Gaddada and Kodicherla, 2016; Kaoma and Gheewala, 2021b). Where; time ti to ti + Δt for N observations and Ui is the average wind speed over the time interval.


Capacity factor
Capacity factor is termed as the energy output of wind turbine and expressed as follows (Ohunakin et al., 2012):
Results and discussions
Wind data characteristics
Wind energy potential was analyzed using data recordings for one year (12.7 consecutive months) at 40 m, 50 m, and 60 m. Mean wind speed (m/s), wind direction, and turbulence intensity are; as shown in Figures 6 and 7. Time series of the measured wind speeds show that the graphs do not exhibit any irregularities as missing data or abnormal readings.
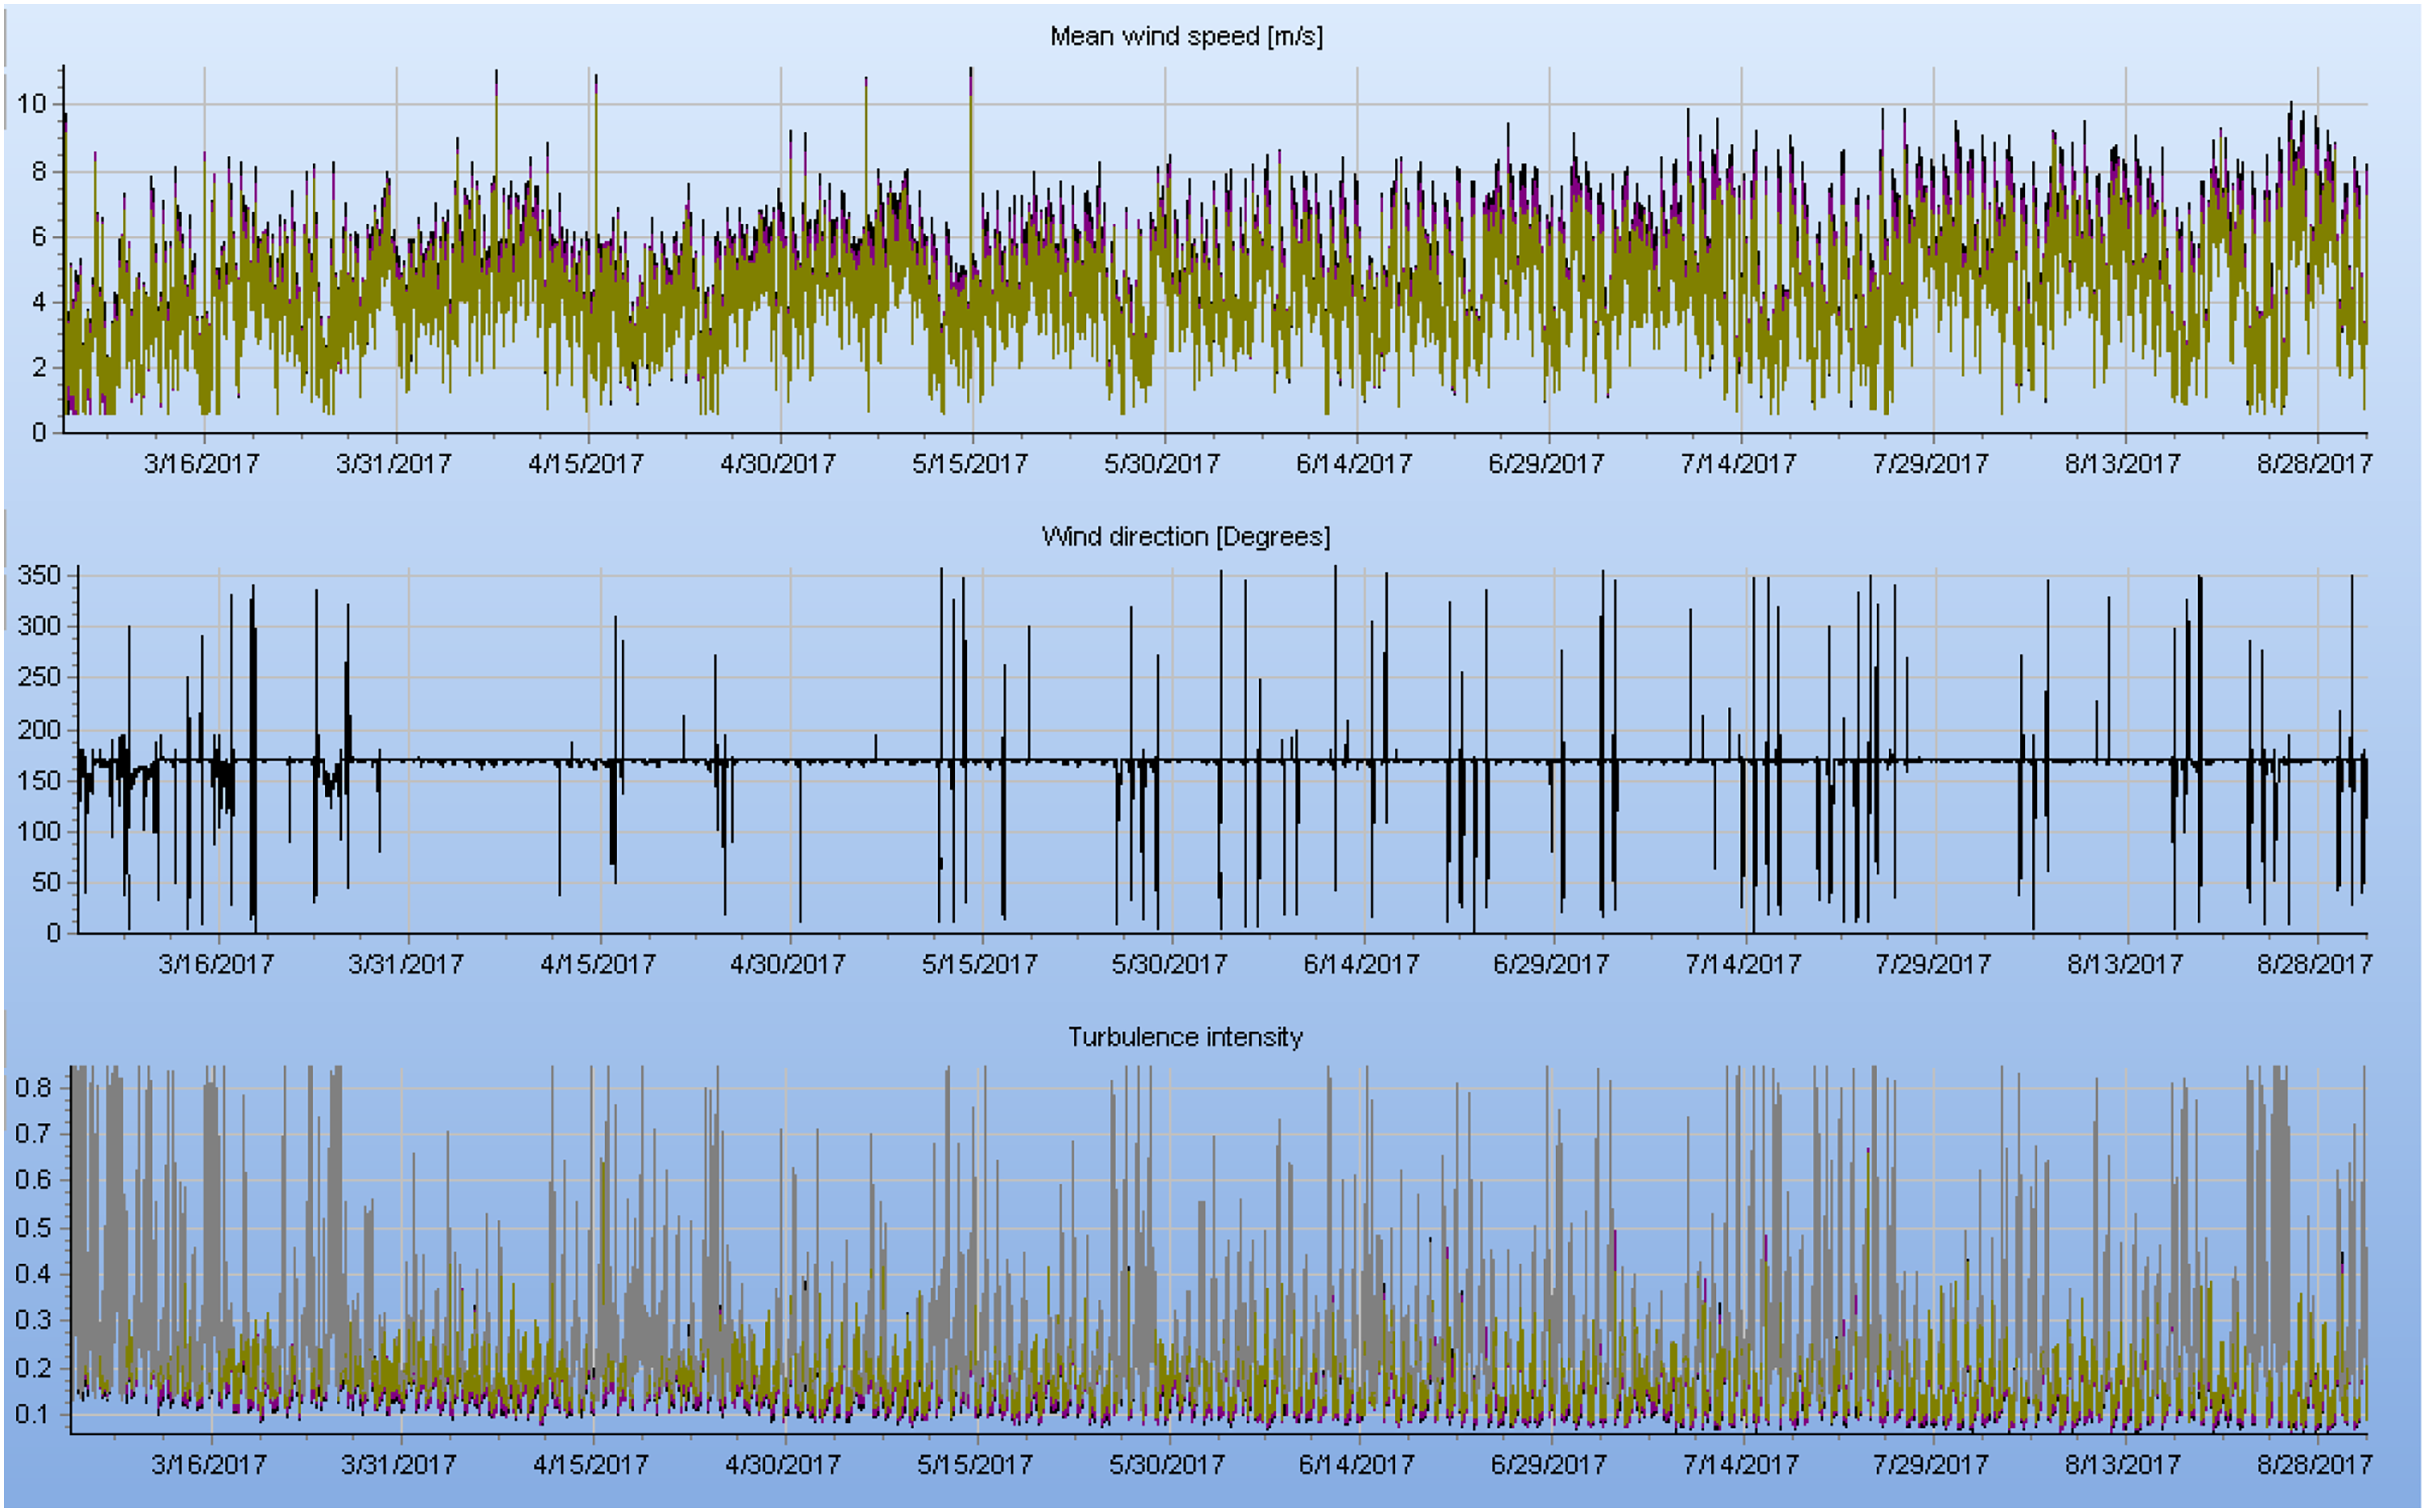
Time series for right-side orientation.

Time series for left-side orientation.
Figures 8 and 9 show the wind speed frequency distribution at 40 m, 50 m, and 60 m. The wind distribution at the three levels has shown normal behavior, as indicated by the distribution curves fitted to the graphs.
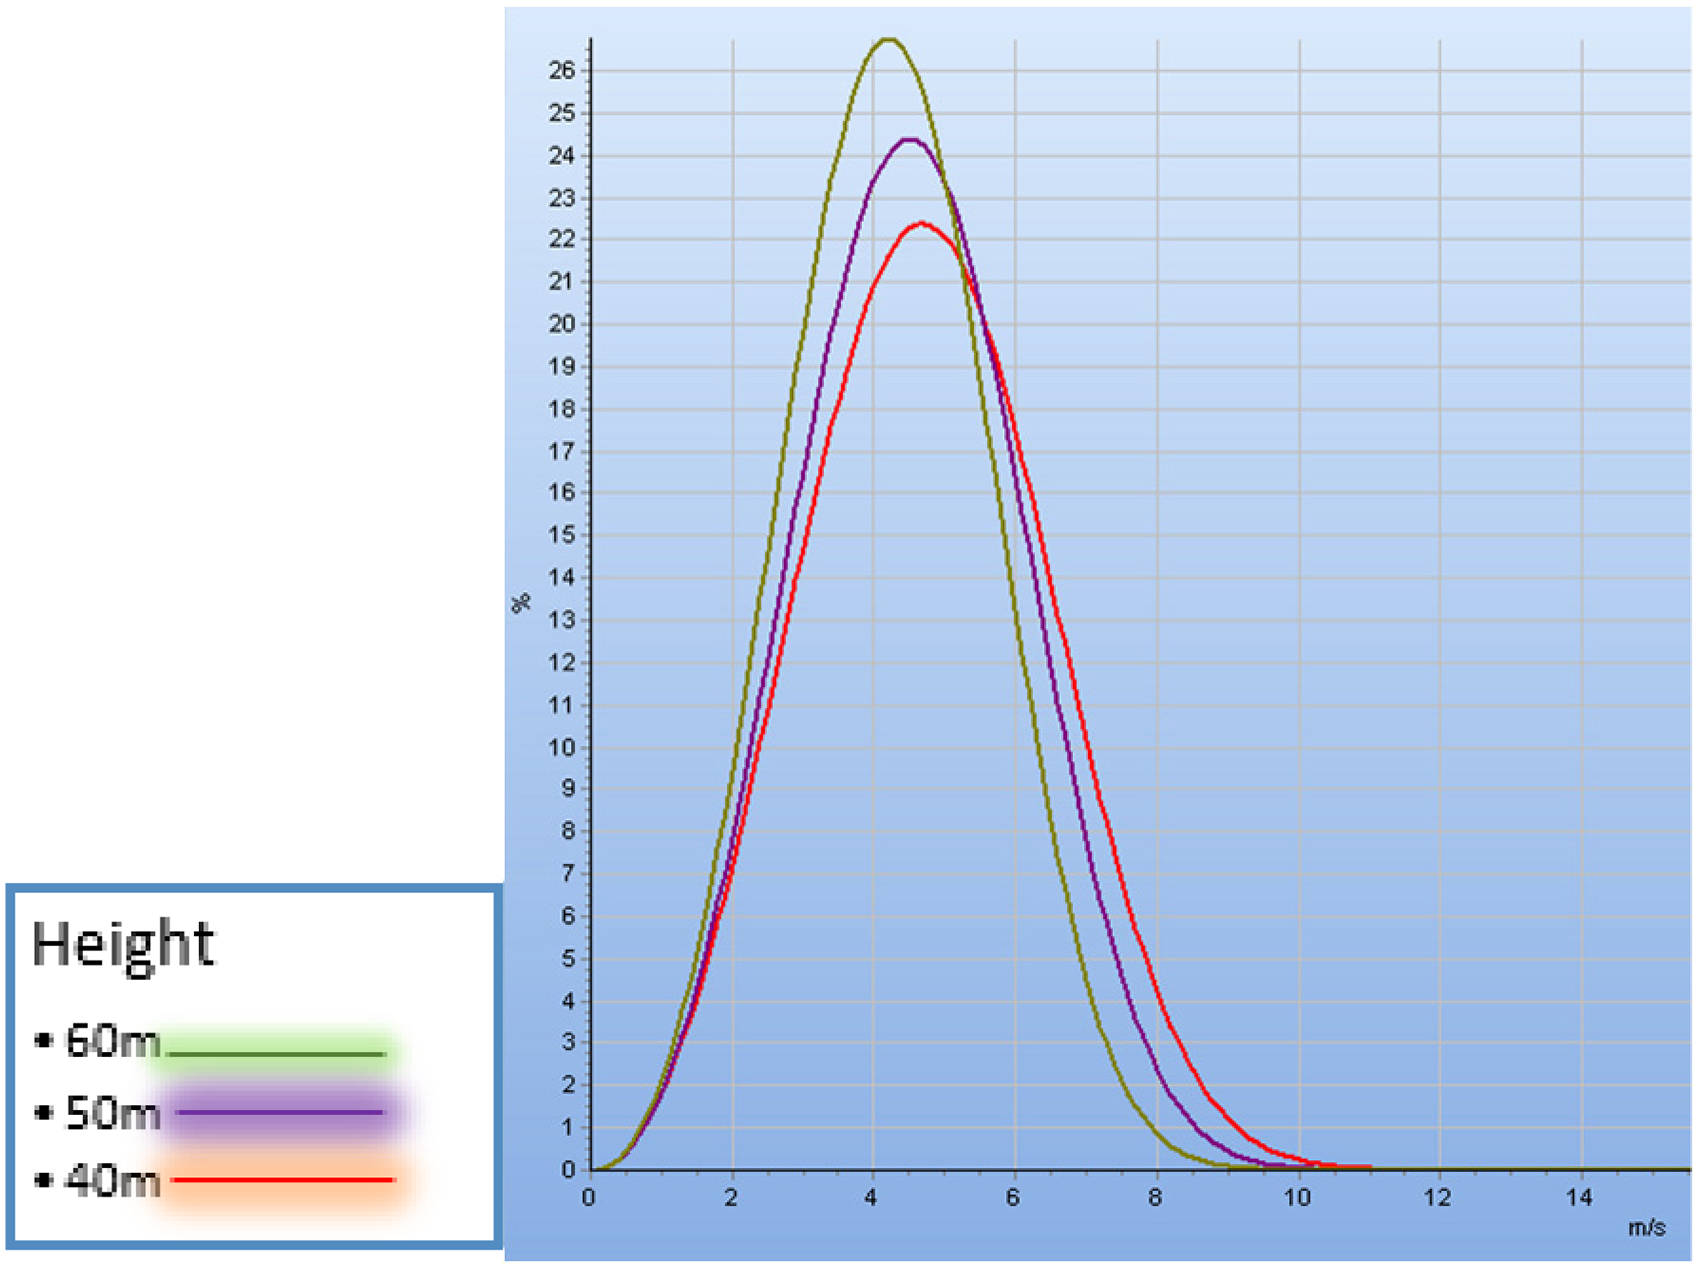
Wind distribution for right-side orientation.

Wind distribution for left-side orientation.
The wind rose shown in Figures 10 and 11 indicate that the wind was coming from the south-south-east.

Wind rose for wind vane 57R.

Wind rose for wind vane 47L.
The two daily mean wind speed graphs presented in Figures 12 and 13 indicate that higher wind speeds are during the nighttime hours between 20 h to 23 h. The lower winds are during daylight hours between 13 h to 16 h.
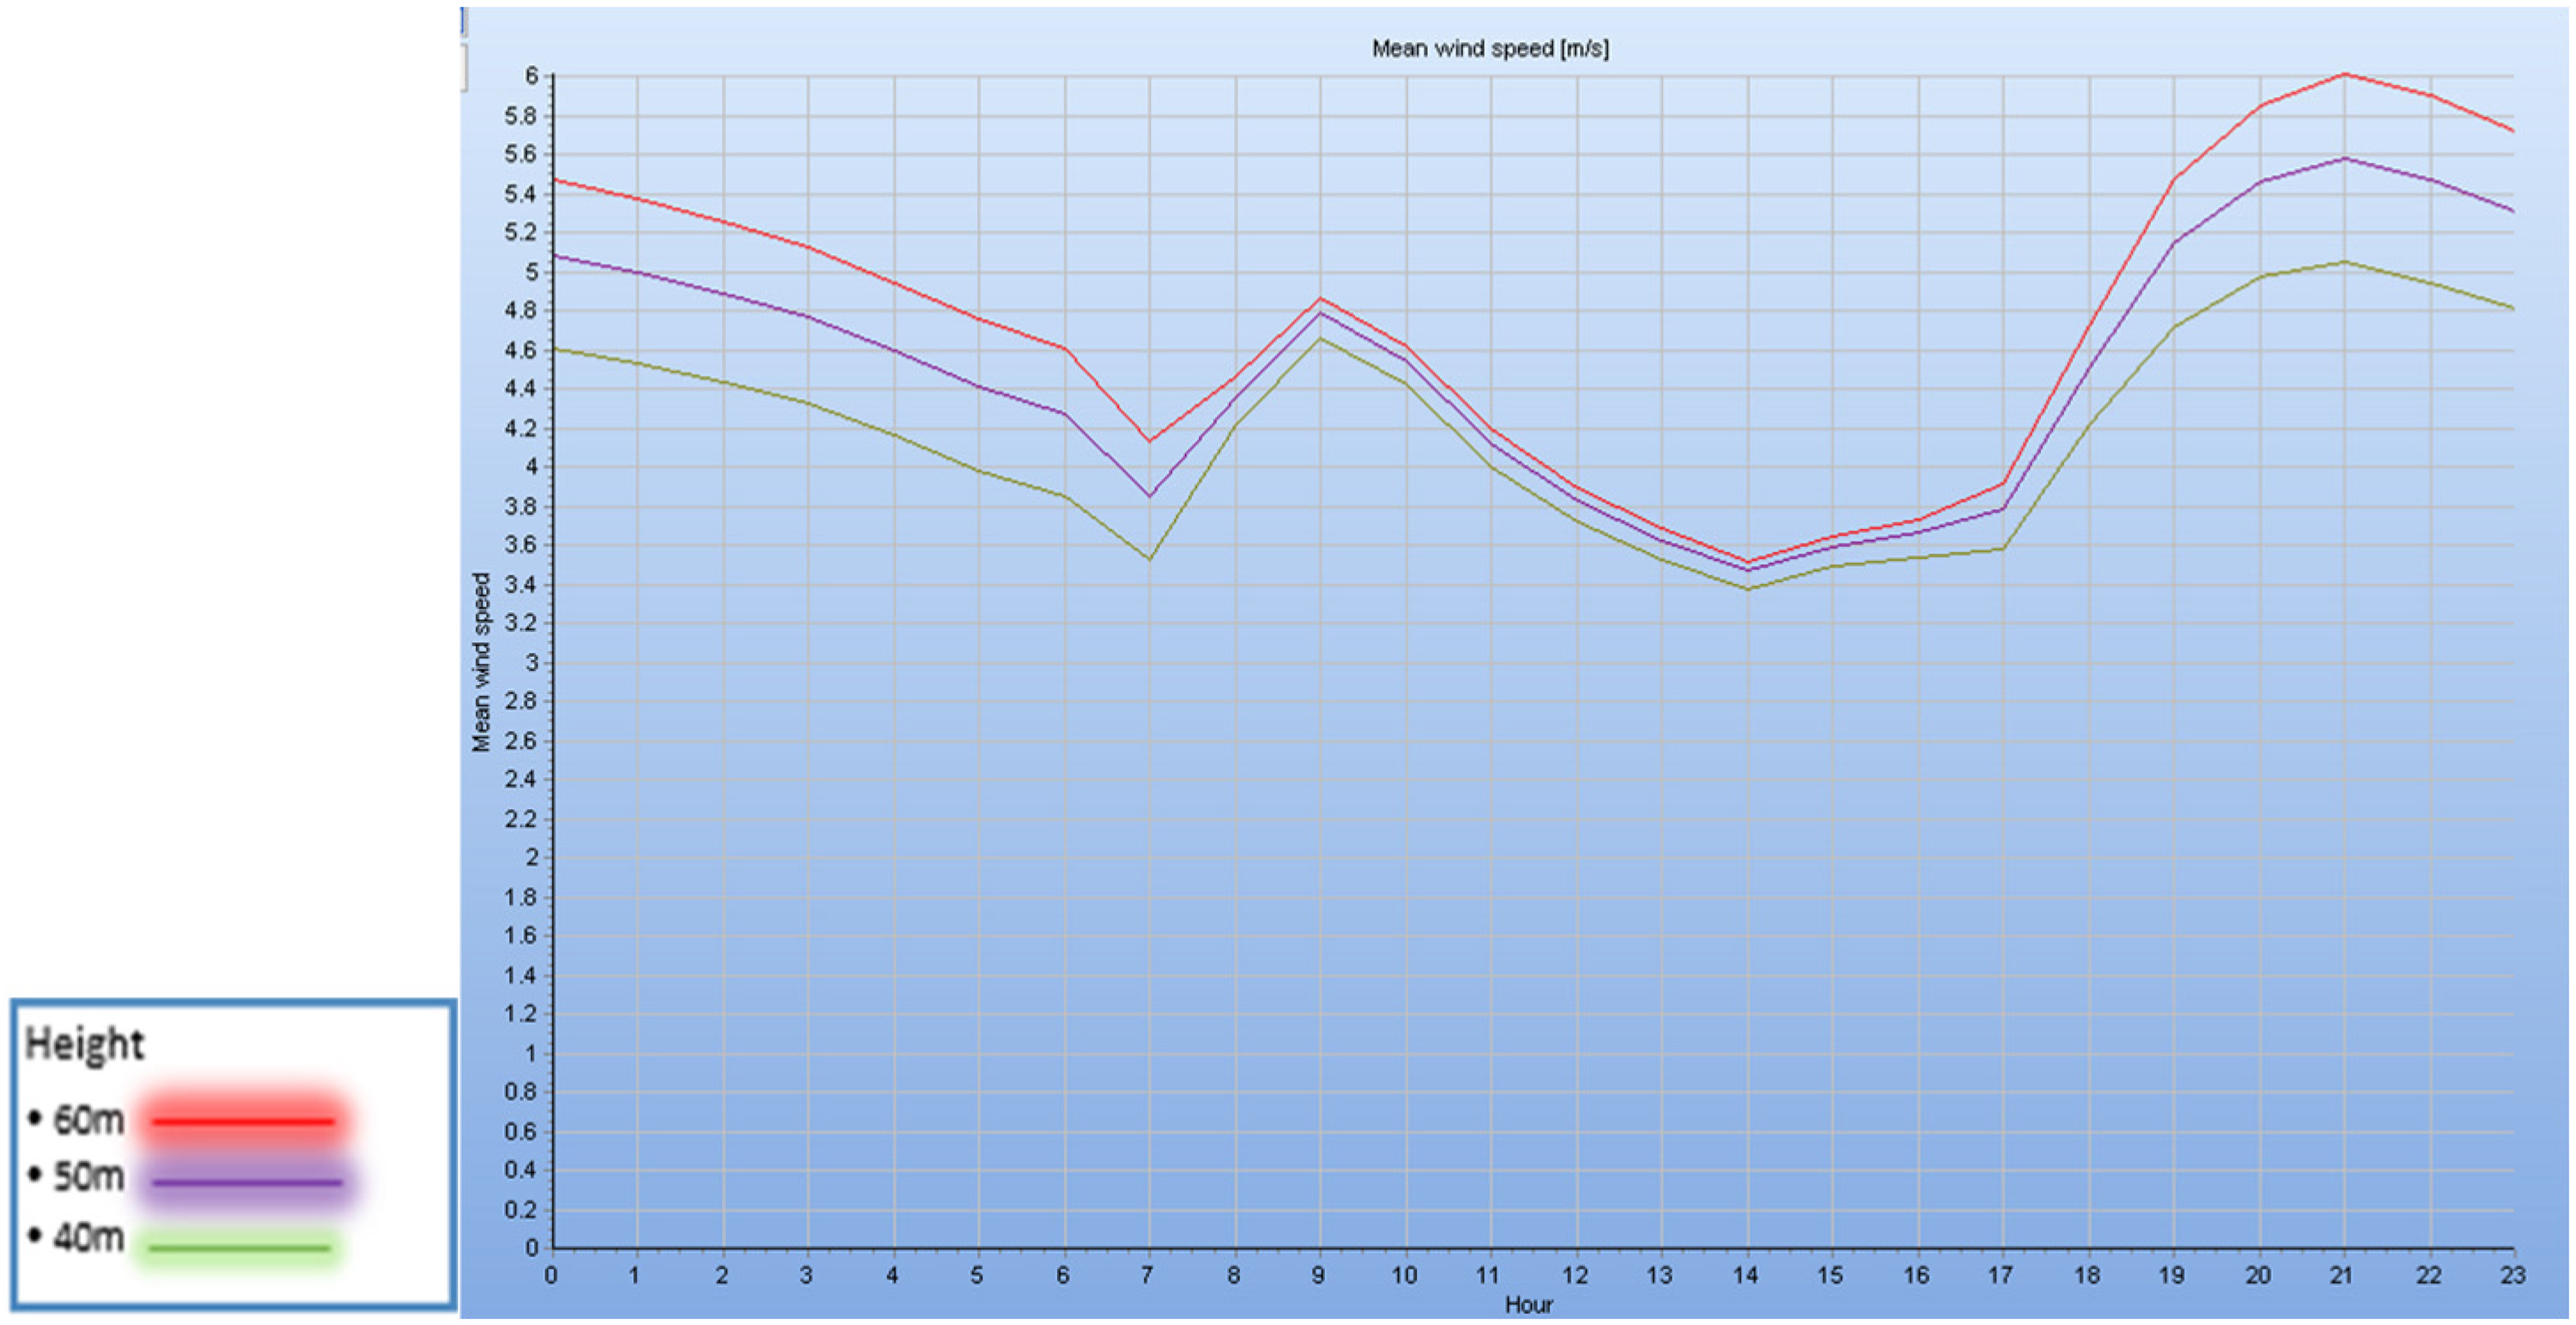
Diurnal behavior for right-side orientation.
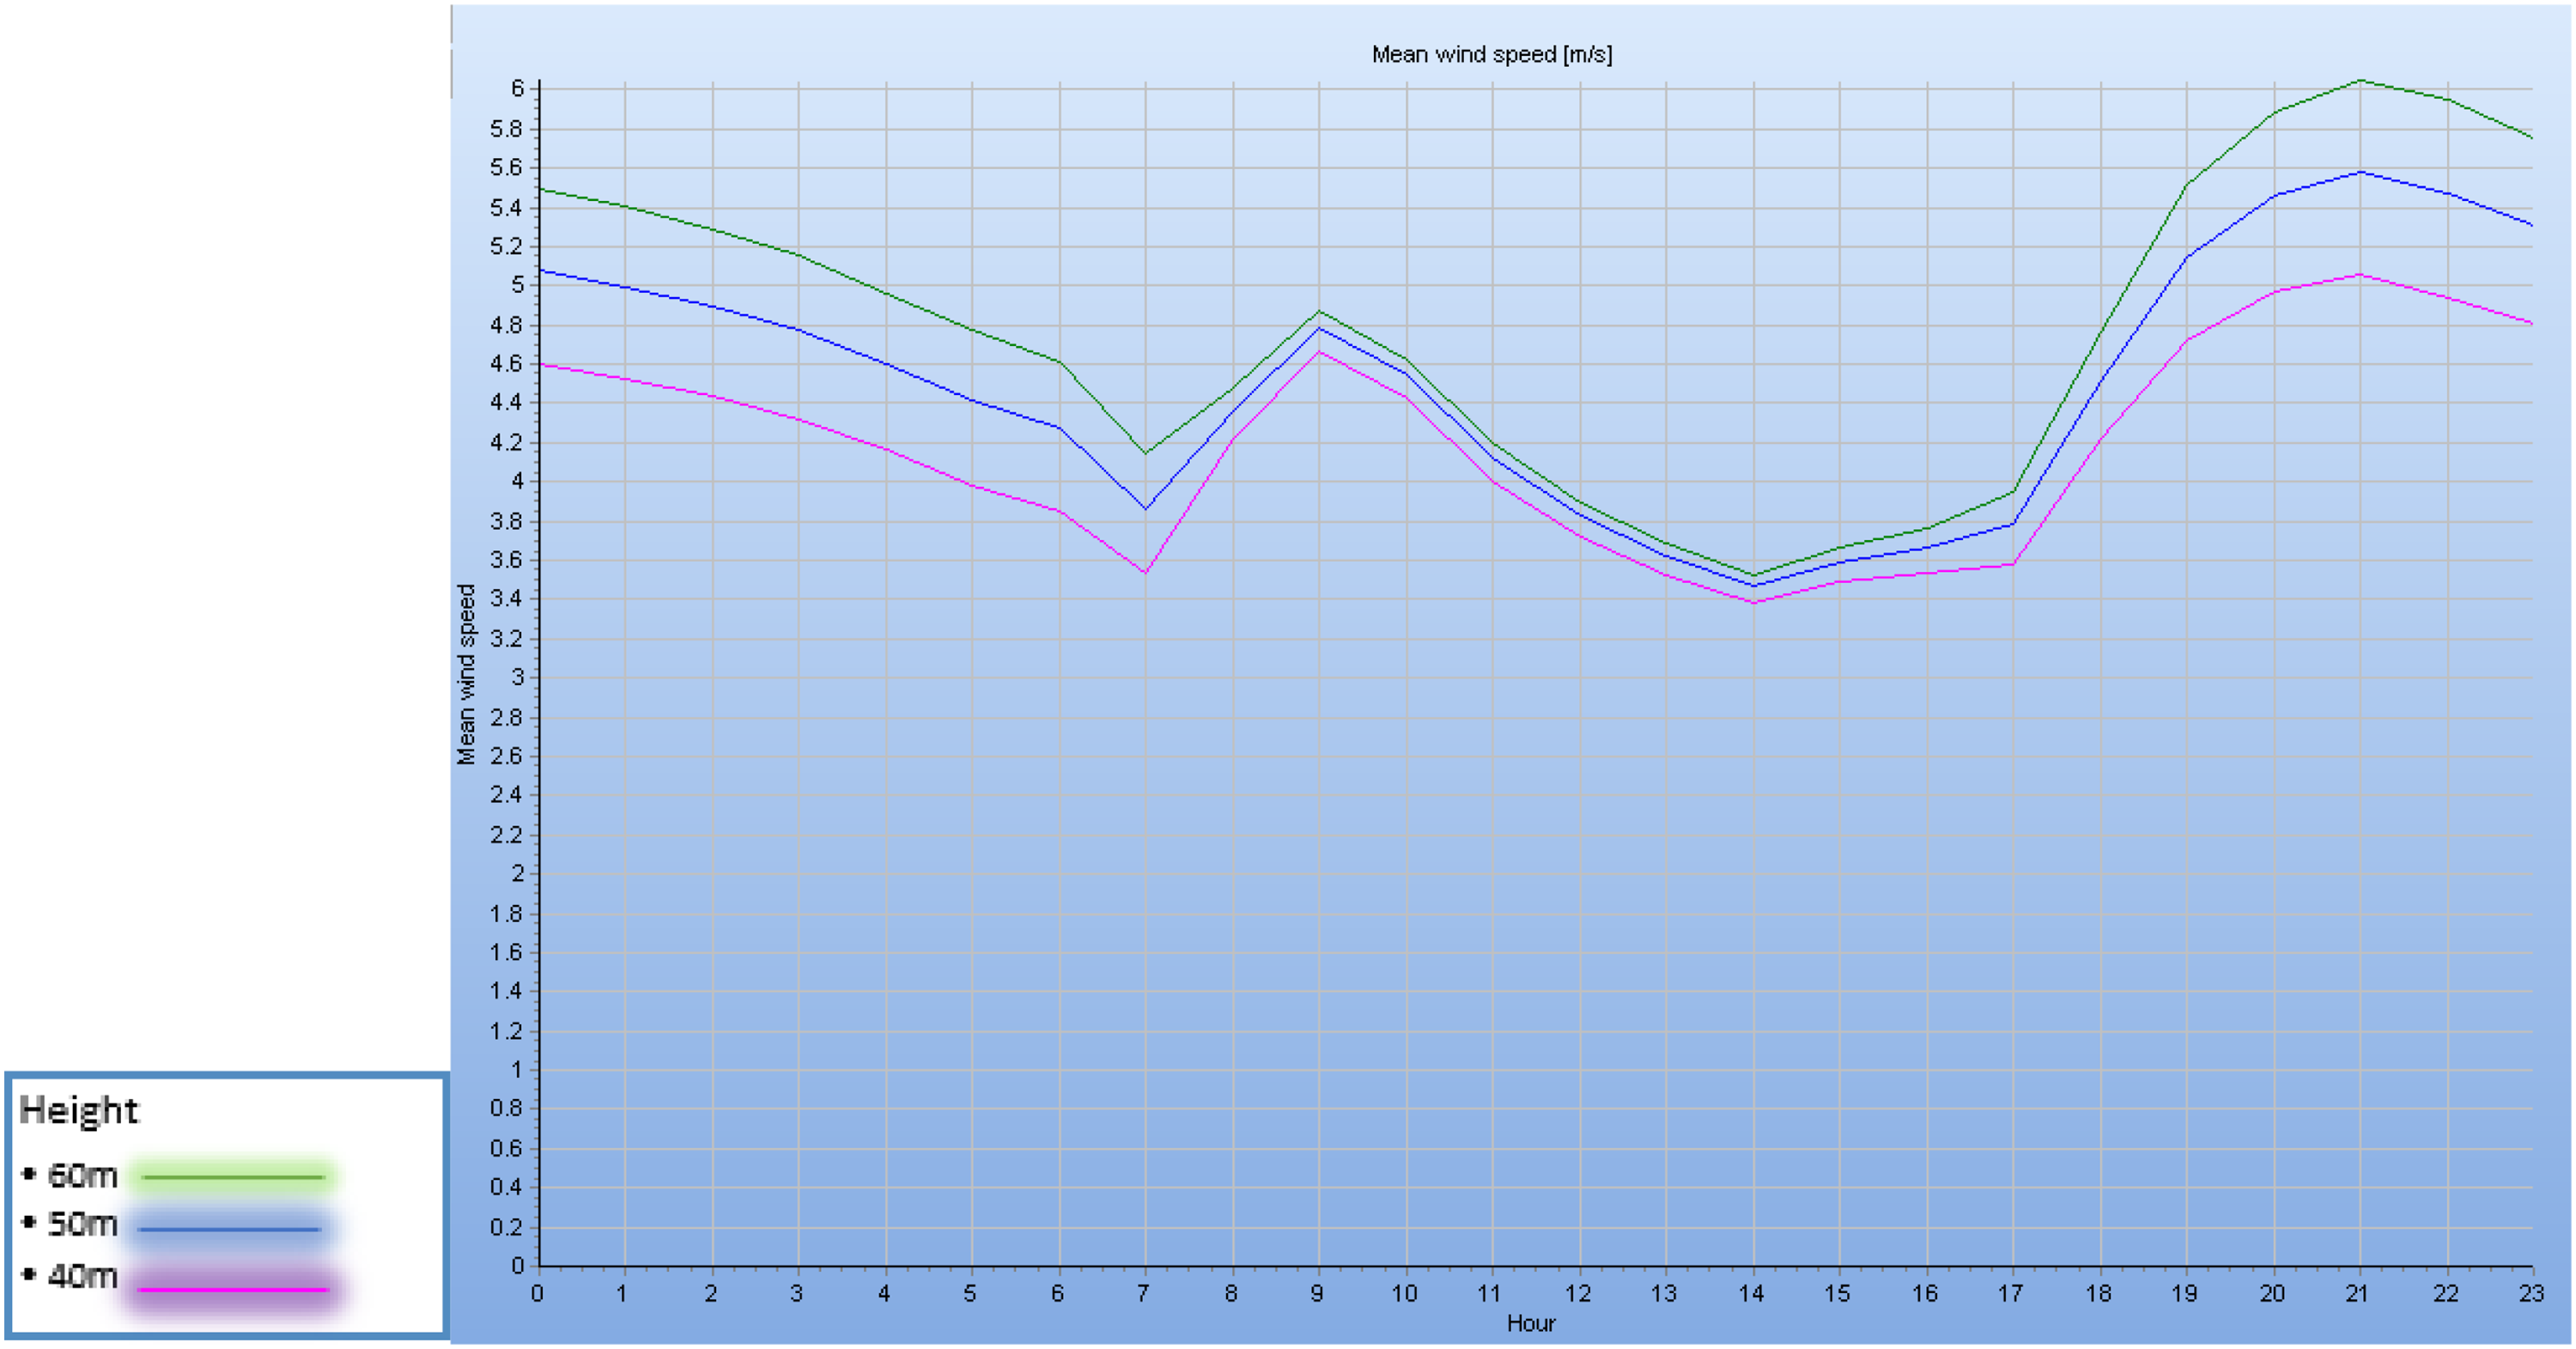
Diurnal behavior for left-side orientation.
The wind profile presented in Figure 14 was generated using the logarithmic law and the power law. Both plots indicate there is an exponential increase in wind speed with increase of height.

Wind profile.
Energy yield analysis (EYA)
The wind data from the site was normalized using WindPro software. The mast data was vertically extrapolated to the WTG hub heights using a 12-sector seasonal and diurnal power law matrix of measured data. Table 3 shows data correlation to MERRA2, EmdERA, and CFSR met mast reference data sources. The frequency distribution measured; was scaled up to the expected long-term wind speed based on the results of the wind index scaling with MERRA2 and EmdERA. Wind resource grid; for the area surrounding the mast was generated to calculate the areas with the highest wind production potential around the site. Long-term frequency distributions; were horizontally extrapolated to the WTG locations using speed-ups derived from the WAsP linear flow model. The scaled hub height time series at WTG locations; were applied to the WTG power curves, and internal wake effects were calculated: including wake effects from each neighboring Project (Brower, 2012; Renewable NRG Systems, 2015).
Available long-term reference data sources.

The data measured on-site was for 12.7 months; however, this data is not enough to capture the long-term weather pattern and predict long-term energy yields. To correlate the site wind data to long-term weather: re-analysis data sets: were used to correlate the site wind data to long-term weather with different sources. This process is essential to identify data with similar trends as the site data (European Centre for Medium-Range Weather Forecasts (‘ECMWF’); Pranesh, 2009). Table 3 shows the reference data considered in the analysis.
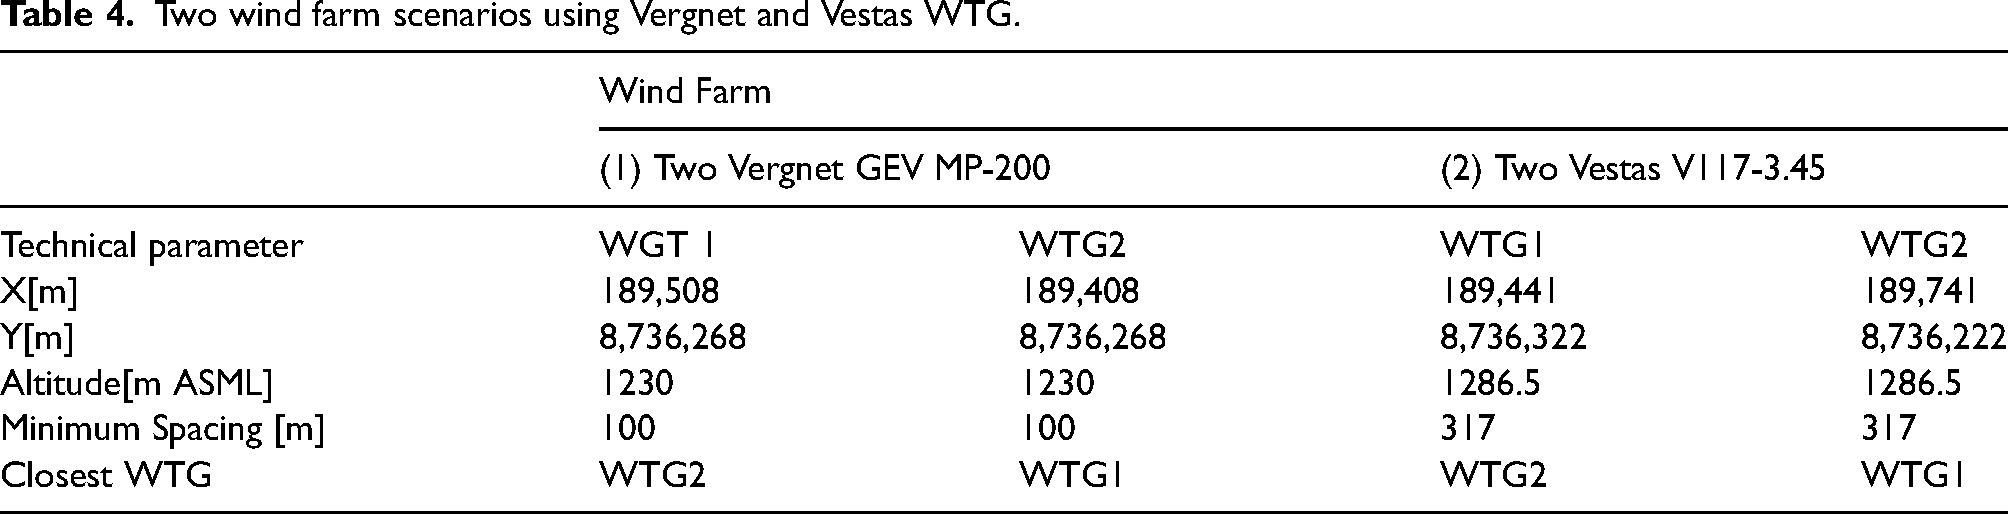
The experience among wind power experts is positive, with no inconsistencies and reasonable correlation coefficients, particularly in the absence of suitable weather station data, despite the spatial resolution that can restrict correlation quality (Ohunakin et al., 2012). The study used small WTG: however, the analysis included a scenario with two large turbines to gain insight into the wind potential for commercial application. Table 4 shows the two proposed wind farm scenarios.
Two wind farm scenarios using Vergnet and Vestas WTG.
A preliminary layout for the two WTG scenarios was developed in wind farms using the wind resource grid and physical, environmental, and social restrictions. Figures 15 and 16 show the two proposed areas for wind farms. The WTGs used in the study can be used at the wind farm development stage unless other studies indicate otherwise. Kindly refer to Appendix A for a power curve analysis of the WTGs at the site.

Vergnet GEV MP-200 WTG 1 and WTG2.

Vestas V117-3.45 WTG1 and WTG2.
To conduct the EYA for the proposed layouts: wind data at hub heights for each layout was required. The study used merged data for the analysis at 60 m. However: extrapolation to a 116.5 m hub height was achieved by using site data. The wind profile was plotted using the merged data and then estimated the wind data at 116.5 m. The site data was correlated to the long-term data by linear regression and matrix methods. Table 5 presents the resulting correlated annual averages for the site.
Resulting correlated annual averages.

Figures 17 and 18 show Weibull distribution at 60 m and 116.5 hub height.

Weibull distribution at 60 m hub height.
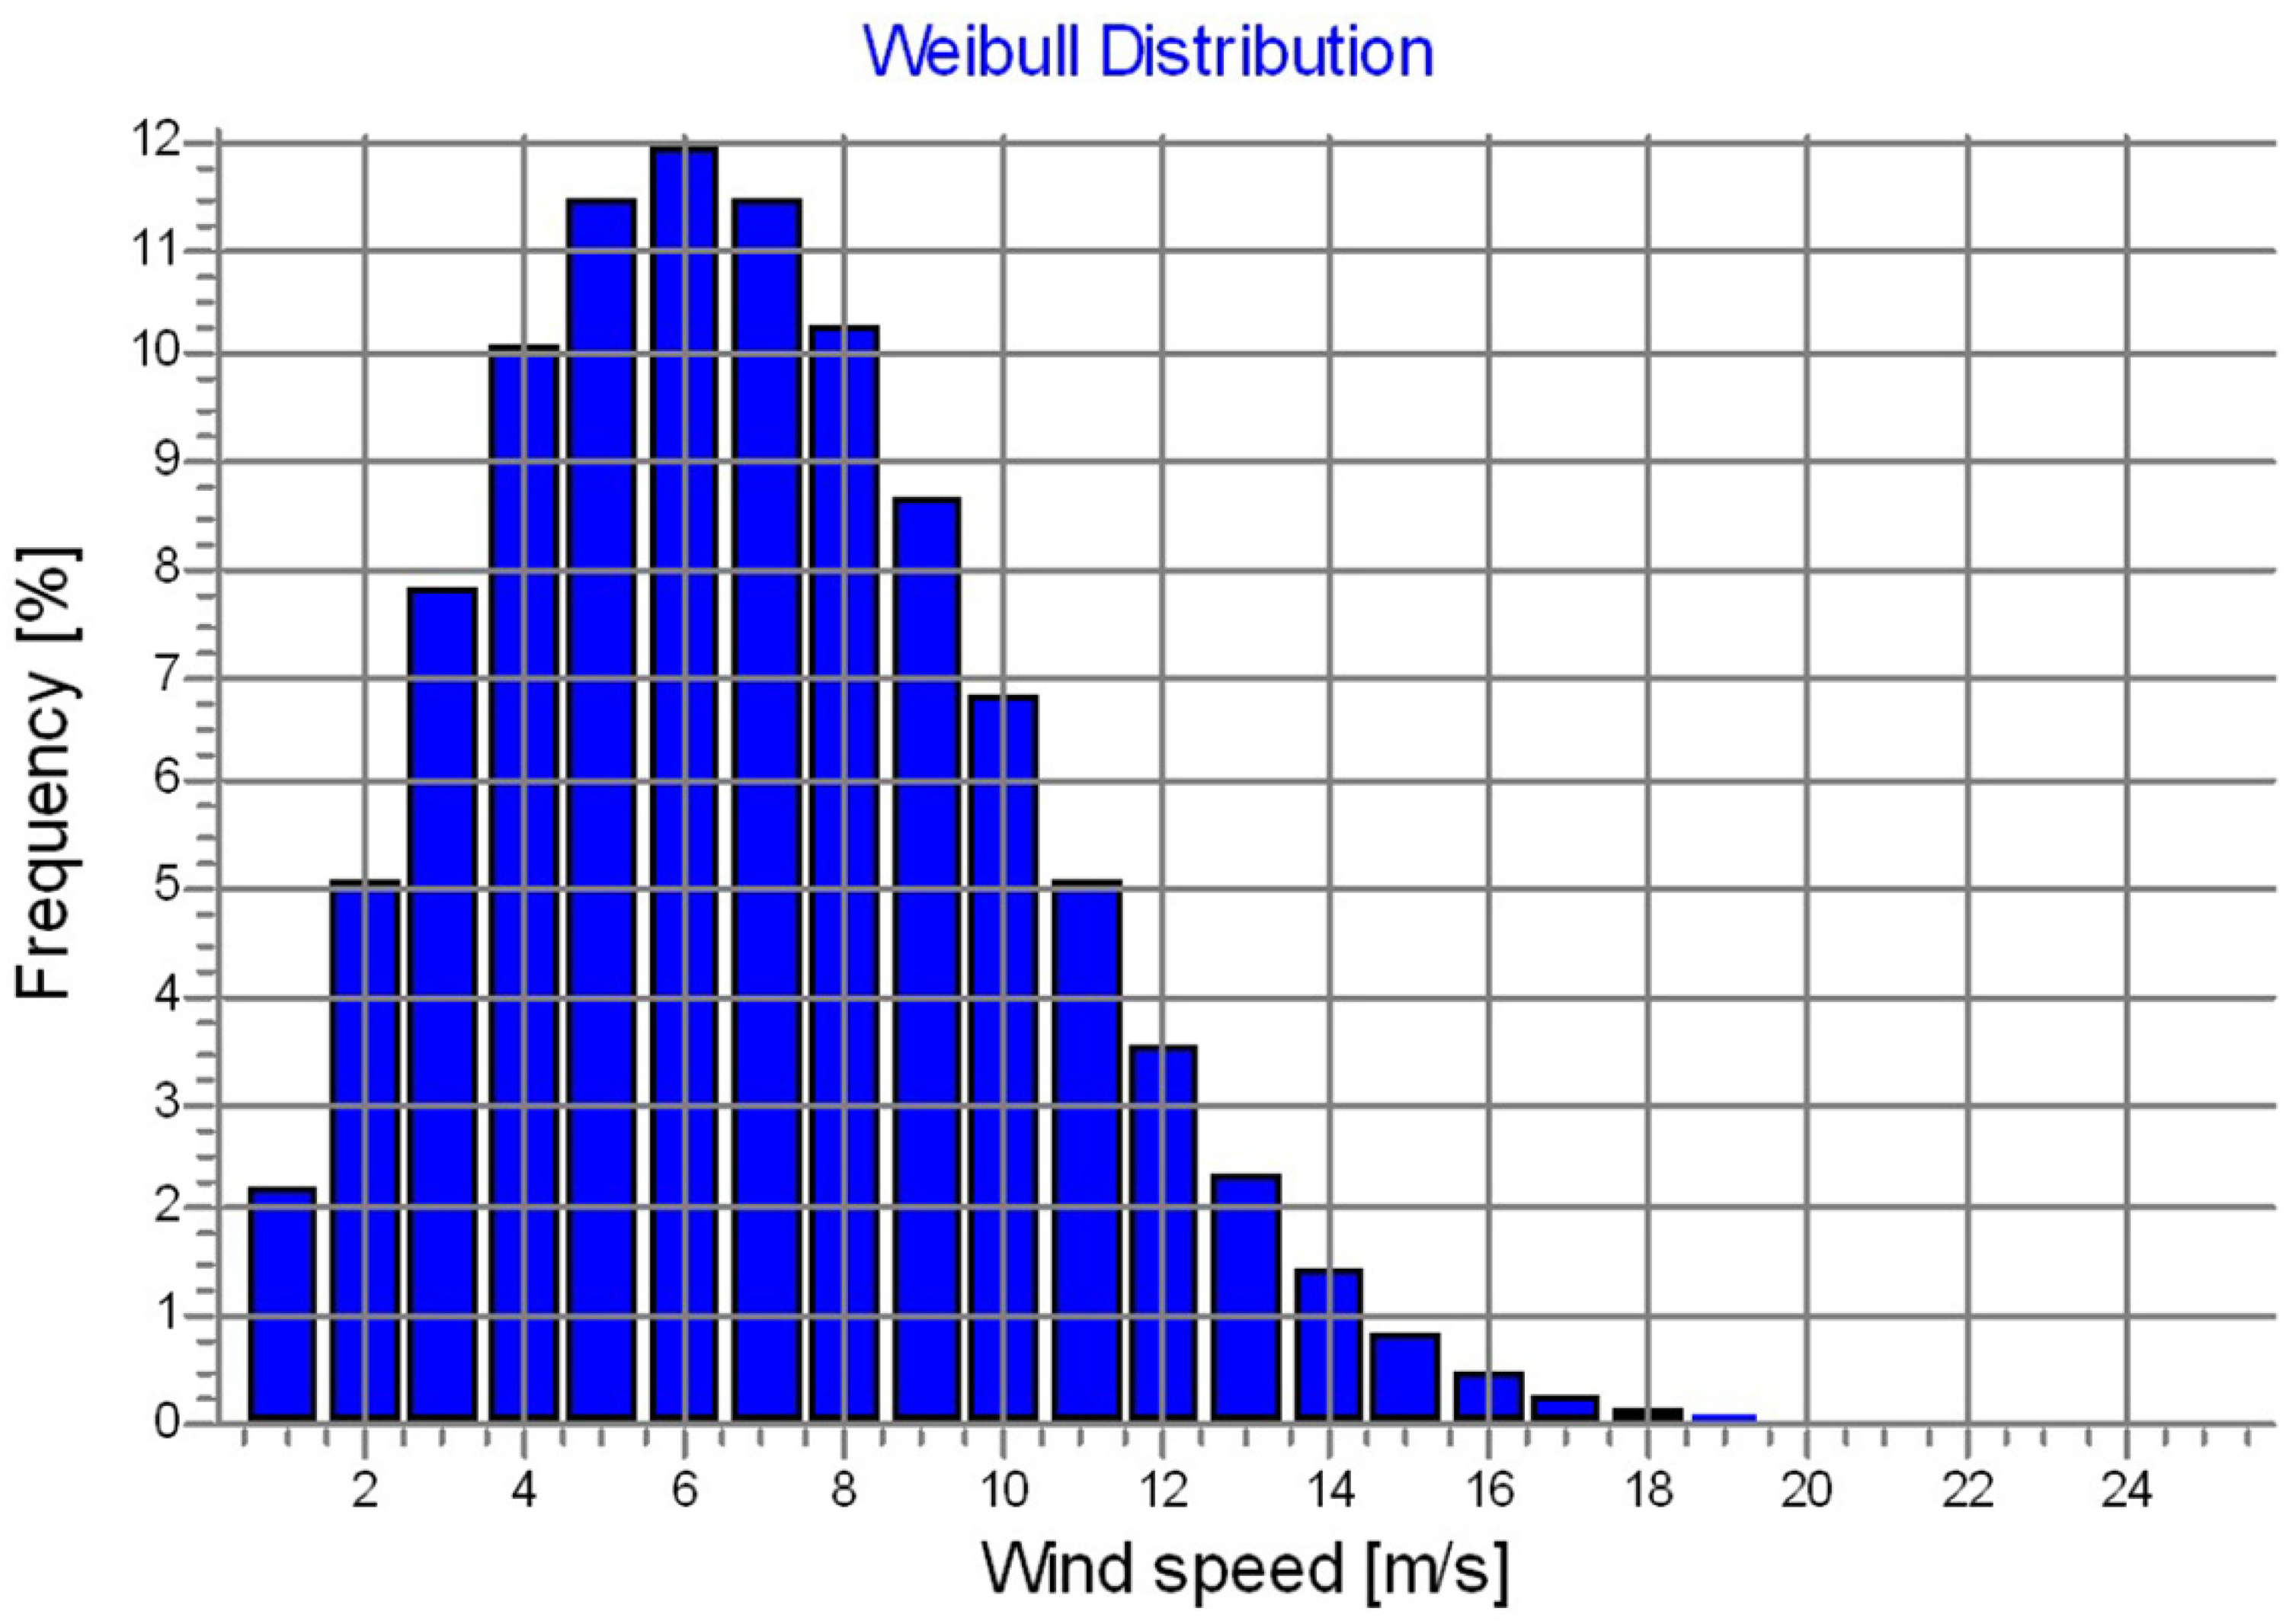
Weibull distribution at 116.5 m hub height.
The initial layouts were automatically optimized using WindPRO by repositioning the WTGs at locations that would maximize energy production. Optimized turbine locations are final unless other studies suggest otherwise. Table 6 presents the technical parameters of the optimized wind farm design.
Technical parameters of optimized wind farm design.

Flow modeling utilized the raw WAsP speed-up output based on the influence of roughness and orography, this includes the impact of terrain on wind direction, and these factors; are applied to the measured mast data on a time-series basis. A corrected time series or frequency table distribution at each WTG location; is developed, negating the need to approximate the site data to Weibull distributions. This method allows for any time-dependent loss factors to be more accurately quantified in addition to being more representative of the expected wind distribution at the WTG locations,
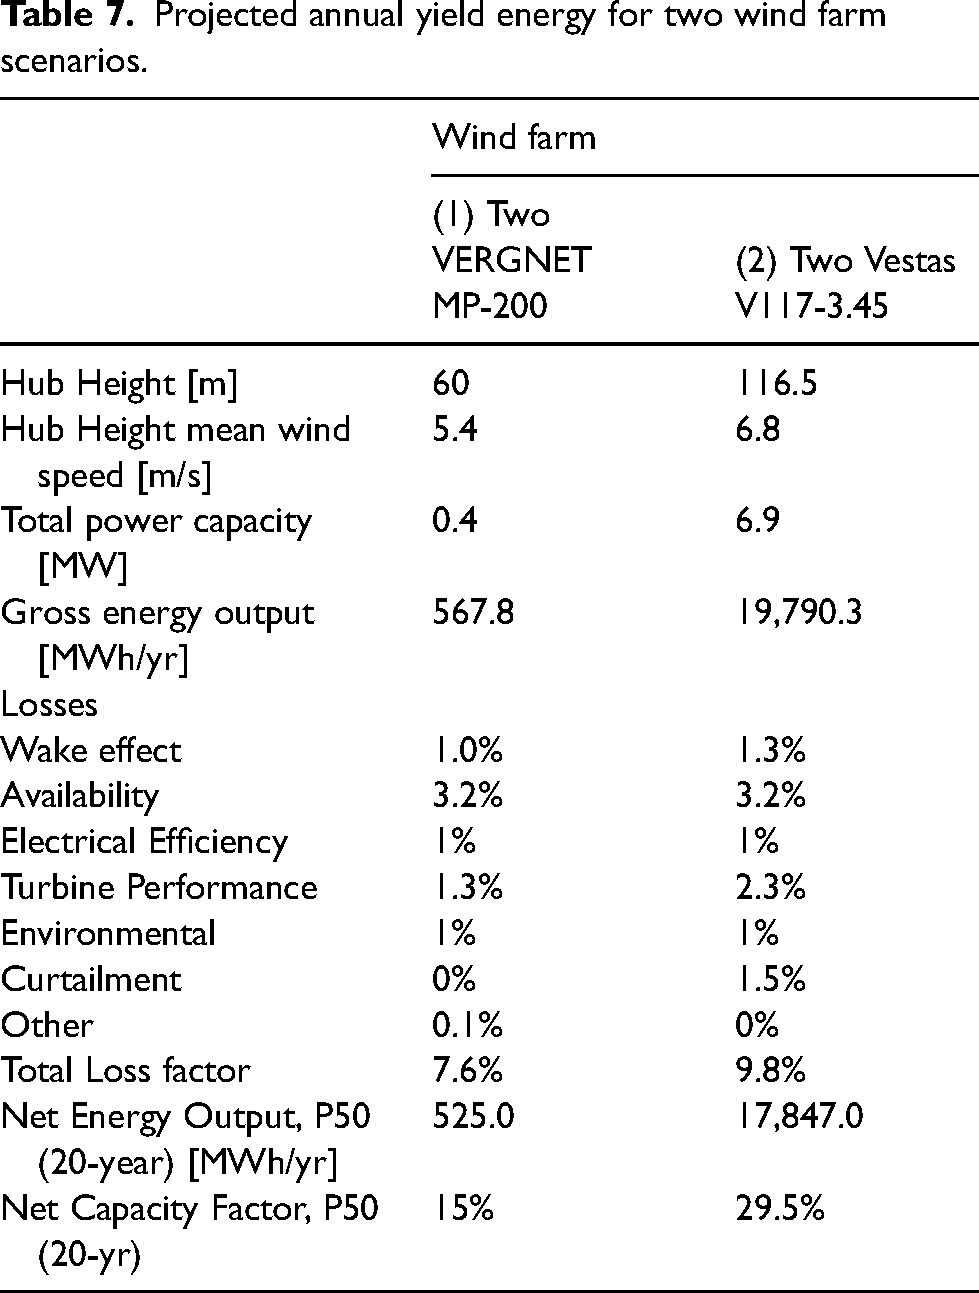
Long-term predicted wind conditions; are extrapolated from the mast location to the Project WTG locations using the WAsP model. The uncertainties associated with the wind flow model, inputs, and wind distribution approximations; are considered in the EYA. The two scenarios; being considered in this study have more than one turbine each; this will induce some wake effects in nearby WTG. Wake affects the overall wind farm production by the wake from each WTG. N.O. Jensen's model with a wake decay constant of 0.082 was employed. The wake effects; were modeled using WindPRO v3.1.617 application software developed by EMD International. Table 7 shows the wind farm energy production obtained from each proposed wind farm scenario. Appendix B provides more details.
Projected annual yield energy for two wind farm scenarios.
The expected energy production presented is for 20 years. Due to wind variability, the proposed operations and maintenance schedule, and many other factors beyond the operator's control, the actual production may fall short or exceed the values presented above, as is the nature of the 50% probability exceedance (P50). Due to the short period of data available from the project, the uncertainty in the energy yield results is high. The study did not provide the uncertainties associated with the analysis.
Conclusions
This study evaluates the wind energy potential of Lunga District, Zambia, by analyzing wind characteristics and performing EYA based on site-specific data. The findings indicate significant opportunities for developing wind power projects in the region. Below are the main conclusions and recommendations:
1. Wind characteristics: 2. Energy Yield Analysis: 3. Key scientific and practical contributions:
Demonstrated the feasibility of harnessing wind energy in Zambia for electricity generation, even in regions with moderate wind speeds, such as Lunga District. Highlighted the economic and environmental advantages of wind energy as a sustainable alternative to wood fuel and diesel generators for rural electrification. Provided validated methodologies for wind resource assessment using WAsP and WindPRO simulation software, which can be applied to similar regions with low to moderate wind speeds. 4. Recommended areas of application:
The results support policymakers and energy stakeholders in formulating strategies to diversify Zambia's electricity generation mix by integrating wind energy. Proposed wind farm configurations can be adapted for rural electrification projects targeting schools, clinics, and community centers in remote areas of Zambia. Scenario 2 (Vestas V117-3.45 turbines) demonstrates the potential for larger-scale commercial wind farm projects that could contribute to the national grid. 5. Directions for future research:
Future studies at the site should incorporate high-resolution temperature and wind shear measurements to calculate Ri. Conduct financial feasibility studies to evaluate the cost-effectiveness of the proposed wind farm scenarios, including tariff structures for mini-grid operations. Investigate the environmental impact, particularly the potential for reducing CO2 and Greenhouse Gas (GHG) emissions through wind power deployment in Lunga District. Explore hybrid renewable energy systems that combine wind energy with solar or biomass to enhance energy security and reliability. Perform long-term wind data analysis to refine energy yield predictions and reduce uncertainties associated with short-term data collection.
The annual mean wind speed at 60 m hub height is 5.4 m/s, while at 116.5 m hub height, the extrapolated mean wind speed is 6.8 m/s. The wind direction is predominantly from the south-southeast (170° from true north), making it conducive for the installation of wind turbines with minimal disruption.
Two wind farm scenarios were proposed: Scenario 1: Two Vergnet GEV MP-200 turbines (60 m hub height, 200 kW each), yielding a P50 net energy output of 525.4 MWh/year with a net capacity factor of 15%. Scenario 2: Two Vestas V117-3.45 turbines (116.5 m hub height, 3.45 MW each), yielding a P50 net energy output of 30.2 GWh/year with a net capacity factor of 29.5%. Losses considered include wake effects, turbine availability, electrical efficiency, and curtailment, with total loss factors of 7.6% for Scenario 1 and 9.8% for Scenario 2.
Abbreviations
Ultraviolet
Greenhouse Gas
Annual Energy Production
Cost of Electricity
Wind Energy Conversion Systems
Energy Sector Management Assistance Program
Energy Yield Analysis
MegaWatt hour
MegaWatt hour per year
Gigawatt hour
GigaWatt hour per year
Wind Turbine Generator
International Renewable Energy Agency
International Electrotechnical Commission
Power Coefficient
KiloWatt hour
Capacity Factor
wind speed (m/s)
Footnotes
Acknowledgements
The authors acknowledge funding from the Rural Electrification Authority (REA) and financial support from the University of Zambia (UNZA), Technology Development and Advisory Unit (TDAU). This work received support from the School of New Energy, North China Electric Power University (Chinese Scholarship Council - 2020), and the University of Zambia (Staff Development Program).
Credit authorship contribution statement
Sydney Mutale: draft and writing, reviewing and editing. Amos Banda: Data review and editing. Yasir Jan: review and editing. Yong Wang: Supervision, review, and editing.
Data availability statement
The data that support the findings of this study are available from the corresponding author, S.M, upon reasonable request.
Declaration of conflicting interests
The author(s) declared no potential conflicts of interest with respect to the research, authorship, and/or publication of this article.
Funding
The author(s) received no financial support for the research, authorship, and/or publication of this article.