
Abstract
In numerous practical applications, particularly in the field of autonomous driving, acquiring annotated datasets that include both images and LiDAR point clouds simultaneously presents significant challenges and incurs substantial costs. To overcome the limitations of limited sample annotations, we propose an innovative weakly supervised learning methodology that utilizes reciprocal knowledge transfer between image detection models and 3D point cloud detection models. To the best of our knowledge, this area has not been explored by prior research teams. Our approach effectively addresses the alignment challenge of diverse modal features from an aerial perspective. Through heatmap prediction, we successfully facilitate knowledge transfer between the image detection and 3D point cloud detection models. Additionally, we conduct extensive experiments to evaluate the performance of our models under different parameters in the domain adaptation process, employing Exponential Moving Average (EMA) progressive learning. Furthermore, we explore the advantages of incorporating regression and prediction fusion heads to enhance weakly supervised learning. Remarkably, our experimental results on the widely accessible KITTI datasets demonstrate that our proposed approach achieves outstanding performance in 3D object detection under weak supervision, surpassing the baseline performance of the original 3D point cloud detection model.
Introduction
In the realm of autonomous driving perception tasks, there is a frequent need to transfer existing perception models to new scenarios to accomplish fundamental perception tasks. This is especially pertinent in the context of 3D detection tasks, where the expansion of detection capabilities for new categories is necessary based on the scene. The conventional approach typically involves gathering additional 3D annotations for new categories and fine-tuning the original model accordingly. However, annotating a significant volume of 3D point cloud samples in new scenarios poses a formidable challenge. In contrast, 2D annotations of images are easier to obtain. Furthermore, by integrating texture information from images into the foundation of 3D point cloud detection models, it would be possible to further enhance the model’s accuracy. Therefore, effectively assisting new-category 3D detection through the annotation of 2D image samples is a meaningful and challenging task.
We aim to integrate models trained on 2D annotated image datasets with detection models trained on 3D point clouds, ultimately constructing a multimodal detection model. We achieve this by training image detection models on 2D images to acquire “knowledge” about new classes. Then, employing various weakly supervised training strategies, we progressively fuse this valuable information with existing 3D detection data. Ultimately, by combining the 2D image detection model with the 3D point cloud detection model, we attain a more generalized multimodal model.
However, achieving the effective fusion of the two single-modal models (2D image detection model and 3D point cloud detection model) requires addressing the following aspects:
(1) elevating the image feature information obtained by the 2D image detection model on 2D anchor points to the 3D space and aligning it with the features acquired by the 3D point cloud detection model to avoid domain mismatch issues.
(2) facilitating the mutual “migration” of information for non-overlapping categories between the two single-modal models and employing effective supervised training with cross-category relevance.
(3) ensuring the robust detection of 3D information for new targets in new categories by the fusion model while maintaining the detection effectiveness of existing categories.
The contributions of this article include: (1) proposing a spatial position based feature alignment method for aligning 2D image features and 3D point cloud features, (2) proposing a weakly supervised training paradigm for training multimodal models, and (3) demonstrating the importance of feature alignment and the effectiveness of our weakly supervised training method through experiments on the public dataset KITTI.
Related work
To the best of our knowledge, there is currently no directly applicable framework to achieve our objectives. However, in recent years, there have been some relevant research efforts worth considering. Socher et al. 1 were the first to introduce zero-shot learning into the field of artificial intelligence. Frome et al., 2 in 2015, proposed the DeViSE model which integrates visual features with semantic representations, achieving zero-shot learning through the embedding of semantic features. Sung et al. 3 significantly improved the effectiveness of zero-shot learning using relational networks. In 2015, Yosinski et al. 4 conducted experimental studies on the transferability of features in deep neural networks, exploring the effects of sharing features between different tasks. Raina et al. 5 discussed how to perform knowledge transfer from unlabeled data. Gopalan et al. 6 explored general methods for domain adaptation in visual recognition tasks. Gong et al. 7 employed manifold learning to enhance performance, while Hoffman et al. 8 employed adversarial training and conditional constraints for pixel-level domain adaptation.
In the field of 3D object detection, significant progress has been made in recent years, with many meaningful contributions. Methods such as Mono3D and M3D-RPN, which rely solely on panoramic images with cameras as the only sensor, have been introduced. However, due to the lack of depth information in images, these methods suffer from lower detection accuracy. On the other hand, 3D object detection methods based on LiDAR point clouds, such as VoxelNet, 9 CenterPoint, 10 SA-SSD, 11 and 3DSSD, 12 utilize structural information from point clouds to achieve more accurate 3D object localization. Nevertheless, they exhibit lower classification accuracy for small targets under poor laser reflection conditions, such as traffic cones. To harness the advantages of both images and point clouds, multimodal models have been proposed. Several outstanding multimodal 3D object detection models, including BEVFormer, 13 BEVfusion, 14 and PMFNet, 15 have been introduced. For instance, Li et al. 16 proposed a Local-to-Global multimodal feature fusion method, while Zhang et al. 17 utilized a 2D auxiliary branch to learn local spatial-aware features from images. However, obtaining multimodal labels, especially annotating 3D objects on point clouds, is challenging and costly. The challenge of training multimodal models solely based on 2D annotations from images to achieve detection capability for unknown categories remains a significant and meaningful task. To address this challenge, Wei et al. 18 introduces a non-learning technique that employs 2D bounding boxes to facilitate the segmentation of frustum sub-point clouds, followed by heuristic methods to compute the most precise 3D bounding box based on the segmented point cloud, Liu et al.19,20 leverages comprehensive image data to tackle the inherent sparsity challenge found in 3D point clouds. These methods are excessive reliance on the internal and external parameters of the camera, and a lack of consideration for the differences in multimodal feature extraction branches. To address these issues, we propose a paradigm using multi-stage weakly supervised training. This approach gradually integrates 2D detection models and 3D point cloud detection models, enabling the final fused multimodal model to achieve detection capability for unknown categories effectively.
Weakly supervised training of the multimodal model
Overview
Despite many of the studies mentioned earlier not directly addressing our problem, they still hold important reference value. To facilitate the construction of a fused multimodal model, we adopt a dual-branch structure similar to BEVFusion. 14 Before combining the image detection model and the 3D point cloud detection model into a dual-branch structure, we separately pre-trained anchor-based detection models for the two feature extraction branches. Specifically, we trained CenterNet 21 on images and CenterPoint 10 on 3D point clouds. During the weakly supervised training phase, pre-training weights were provided for both branches. Additionally, when lifting 2D features to 3D space, we employed the same strategy as BEVFusion, obtaining depth estimation on images using LSS (lift, splat, shoot). 22 Subsequently, we mapped 2D pixel features forward using camera intrinsic and extrinsic parameters and filled them into the feature tensor in 3D space.
During the fusion stage of the two models, our weakly supervised training consists of three steps:
(1) elevating the features extracted by the 2D image detection model into 3D space. Additionally, guiding the “alignment” of 3D features extracted by two branches through predictions of heatmaps strongly correlated with anchor positions.
(2) gradually merging the features extracted by the two branches, predicting heatmaps for new categories, and updating the parameters of the heatmap prediction module through Exponential Moving Average (EMA) during the training process.
(3) leveraging the shared categories between the pre-trained models of the two branches, applying weakly supervised methods to train the parameters of the 3D bounding box regression module.
Feature alignment
When using anchor based detectors for feature fusion, it is necessary to consider the alignment of 2D and 3D features in spatial position, as 2D image features lack depth information and the noise of internal and external parameters affects the projection of image points to 3D space. There is a significant deviation in the center position of the target between 2D and 3D annotations, which is harmful for feature fusion and not conducive to the network’s regression of the center of the 3D bounding box. In the initial phase of model fusion, we consider aligning the different features extracted respectively by CenterPoint
10
and CenterNet.
21
As shown in Figure 1, we devise a training scheme based on predicting heatmaps to align features from a top-down perspective. Firstly, we utilize the pre-trained backbone networks of CenterNet and CenterPoint to extract corresponding features. Then, we map the features extracted from the 2D image branch to 3D space, obtaining voxel features
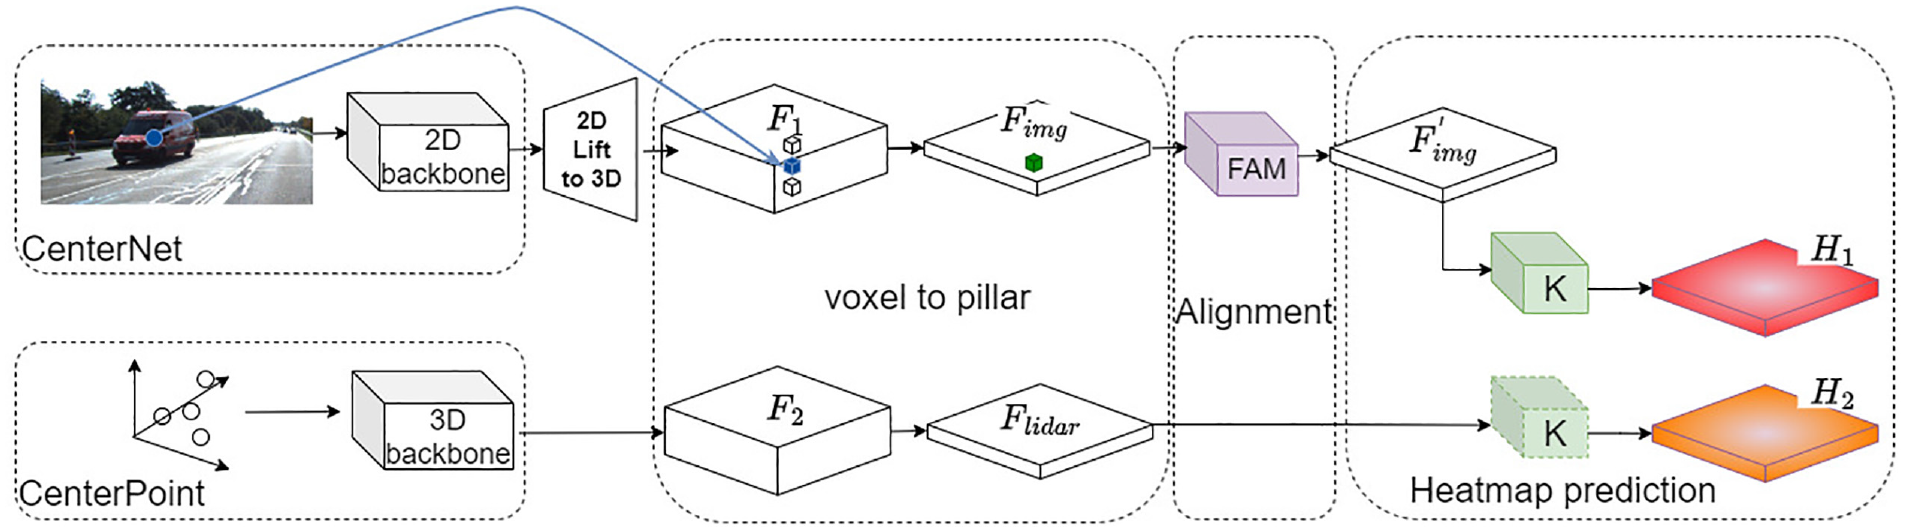
Alignment of heterogeneous features.
In the 2D image branch, the extracted features are based on the 2D pixel spatial positions, and we need to project them into 3D space. Initially, we must establish correspondences between 2D pixel coordinates and points in 3D space. However, due to the loss of depth information, this correspondence from pixel position to 3D coordinates presents singularity issues. To address the problems arising from singularities, it is necessary to utilize semantic information from a single image to infer depth information. Several studies in this regard exist; for instance, Laina et al. 23 proposed a method using Fully Convolutional Residual Networks (FCRN) for depth prediction, while Wang et al. 24 discussed how integrating depth and semantics can provide a more comprehensive understanding of scenes in images, achieving unified depth and semantic predictions from single images. Additionally, Godard et al. 25 utilized consistency information between left and right images for unsupervised monocular depth estimation.
It’s crucial to strike a balance between depth prediction accuracy and module operational efficiency. Moreover, during the feature transformation process, quantization of depth is required, and achieving high-precision depth estimation is not mandatory. Hence, drawing inspiration from Liang et al.’s method in the multimodal fusion detection model BevFusion,
14
which maps 2D features to 3D space, we adopt the LSS model proposed by Philion and Fidler,
22
This model obtains depth probability maps and maps position points in the camera coordinate system to some position in 3D space through camera extrinsics and intrinsics, as illustrated in Figure 2(a). Finally, the feature tensor
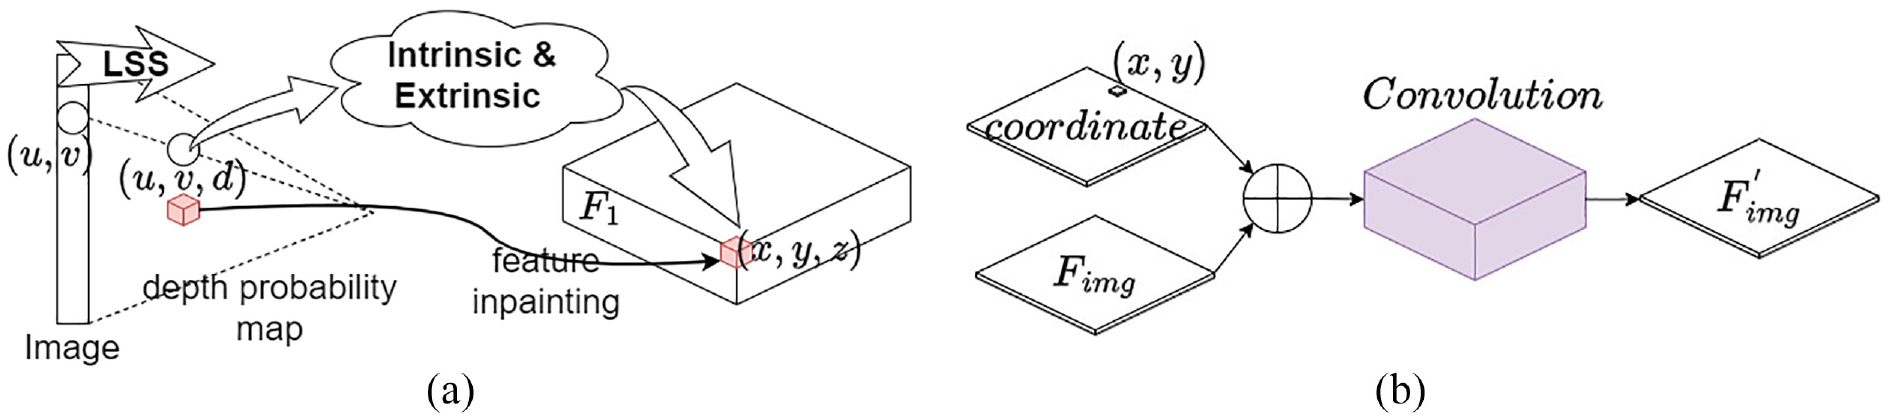
LSS and FAM module: (a) lift 2D feature to 3D space. (b) Feature Alignment Module.
To address the alignment issues of features under a bird’s-eye view perspective, we refer to Lang et al.,
26
under this perspective, we compute the average features of
For the design of the FAM layer, we utilize the improved convolutional layer proposed by Liu et al.,
27
as illustrated in Figure 2(b). We incorporate the coordinate information of the pillar features
Taking the maximum values of
In the first stage of training, we freeze all parameters except for modules FAM and K. We train the model parameters by comparing predicted heatmaps
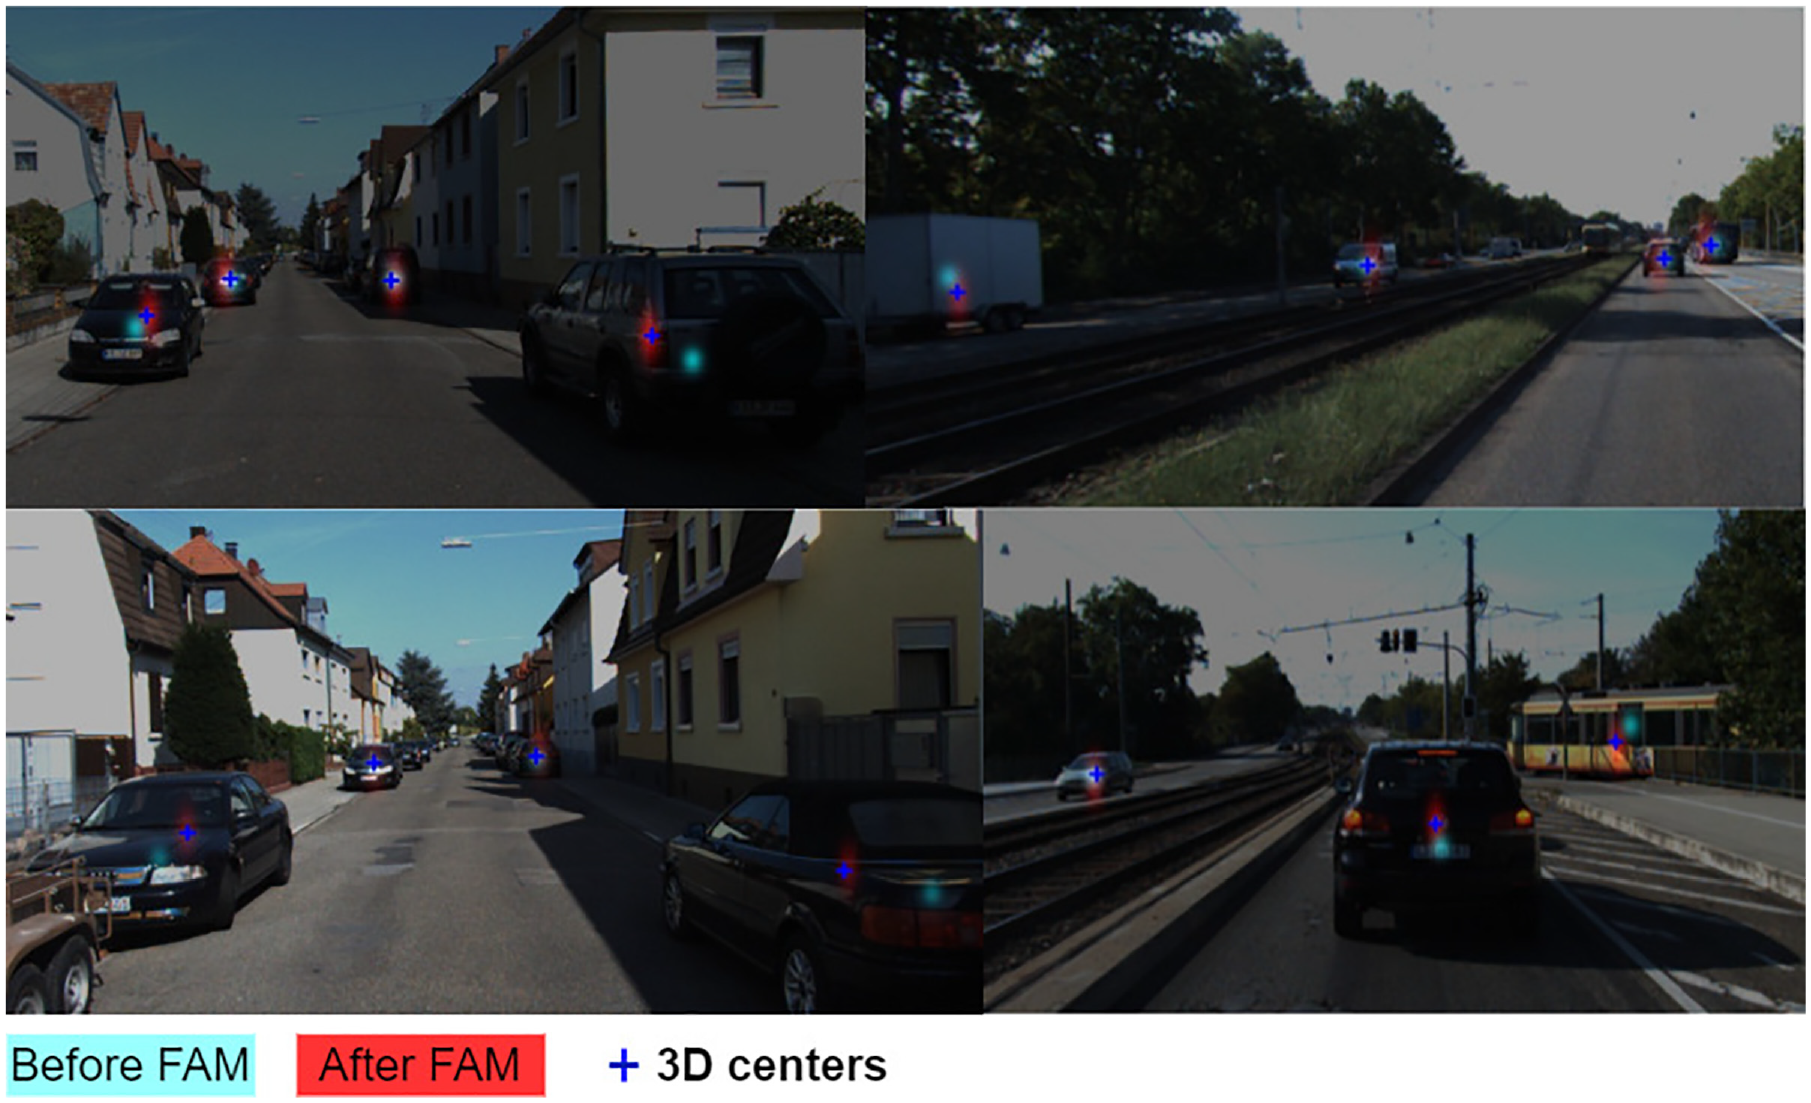
Alignment results on the KITTI dataset.
Generating heatmap for new classes
After the preceding steps, we obtain aligned features
During the second training stage, we solely focus on predicting heatmaps for all categories. This is because the regression of target bounding boxes is inherently more complex than the task of heatmap prediction and relies on anchor points generated through heatmaps. To enhance the accuracy of anchor point prediction while avoiding the introduction of excessive noise from the regression module, we exclusively perform category heatmap prediction in this stage.
Even though
As shown in Figure 4, for the features obtained from two branches,

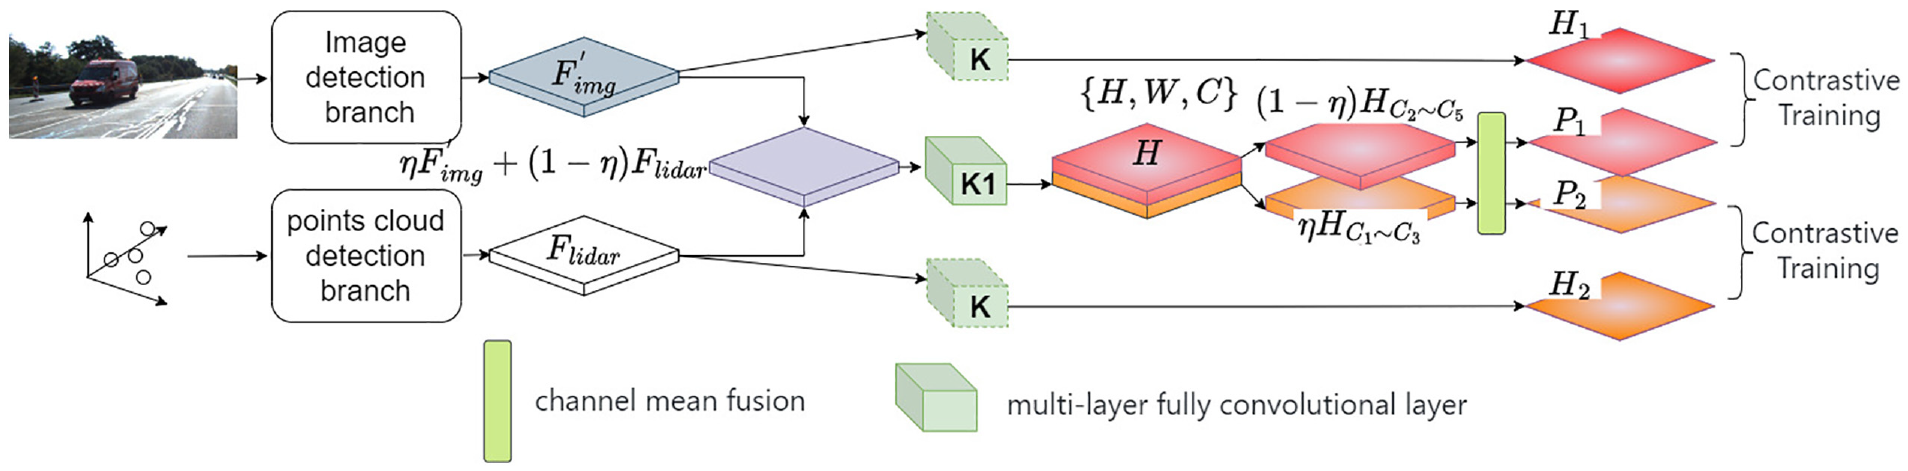
Training heatmaps for new categories.
After passing through a fully convolutional module K1,
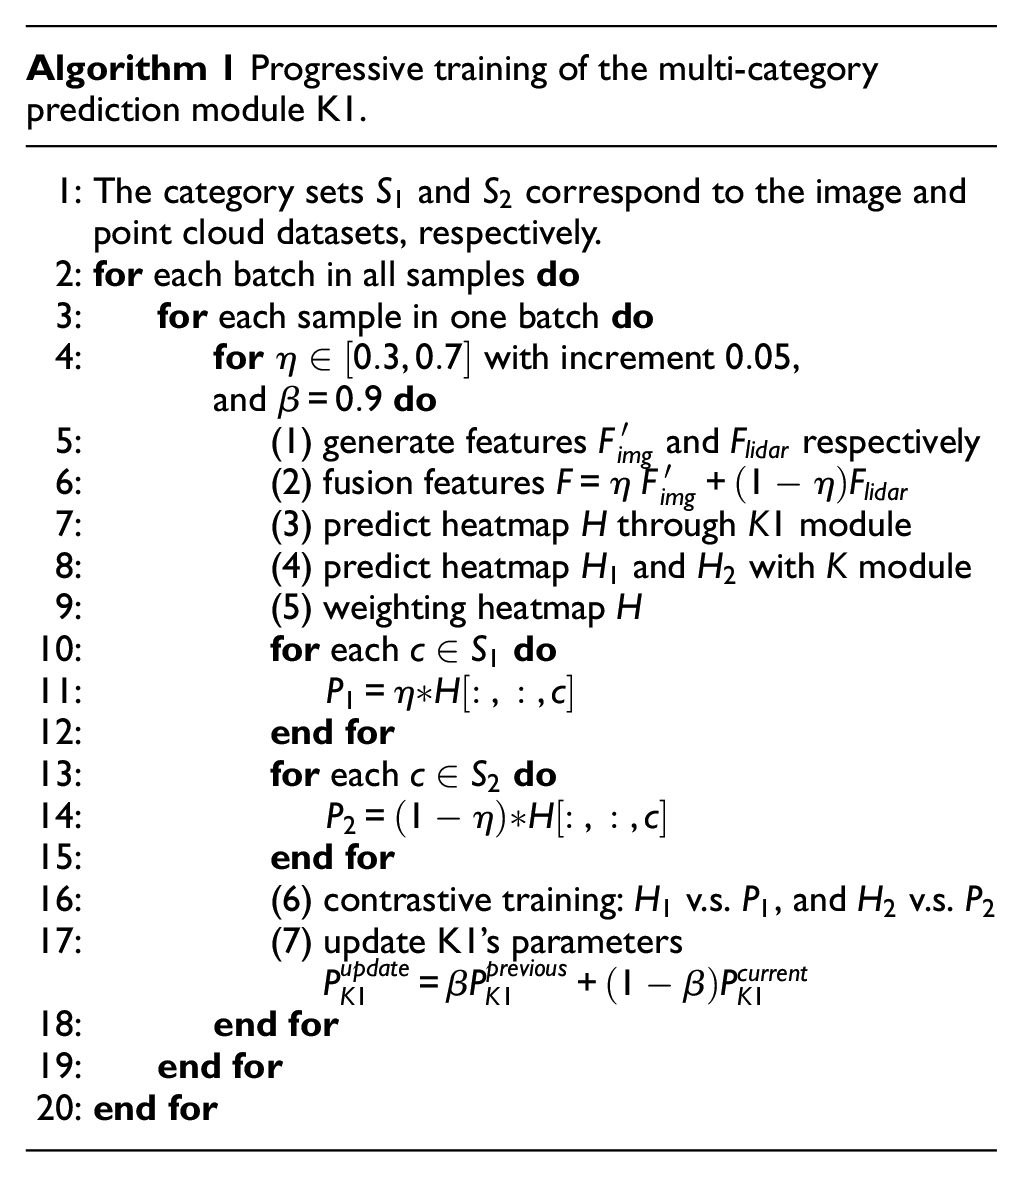
When learning the multimodal feature fusion module K1 through the EMA strategy, it is necessary to use the module K obtained in the previous stage to predict a reference heatmap for the aligned image features
Furthermore, throughout the entire training process, the parameters of the K model obtained in the first stage are frozen. For the training of the feature extraction backbone network, we adopt the approach described in,30,31 where after reaching a certain stage of training, we gradually introduce training on the feature extraction backbone network with a smaller learning rate. This approach helps to avoid instability in the training of the K1 model caused by adjustments to the backbone network parameters in the early stages of training. Additionally, it allows for further adjustment of the feature extraction backbone network to assist in training the parameters of the K1 module when the final loss converges. During the contrastive training process, as we need to use heatmap as the supervised training label, we employ focal loss 32 as the loss function to mitigate the interference caused by imbalanced positive and negative samples. When regressing the final 3D box, we utilize smooth L1 loss 33 as the loss function. To balance regression loss and classification prediction loss, we applied a weight of 0.2 to the classification prediction loss to enhance the stability of training in the final stage.
Training of the boundary box regression branch
The backbone network we employ for extracting features from 3D point clouds shares a similar structure with detection models like PointPillar 26 and VoxelNet. 9 The distinction lies in CenterPoint, where the regression of target positions and bounding boxes is anchor-based. Through earlier training stages, we obtain fairly accurate heatmaps. These heatmaps enable us to determine anchor point positions. During the final training step, we simply need to regress the corresponding 3D target boxes at the respective heatmap positions.
As shown in Figure 5, at this stage, we directly fuse the aligned feature maps
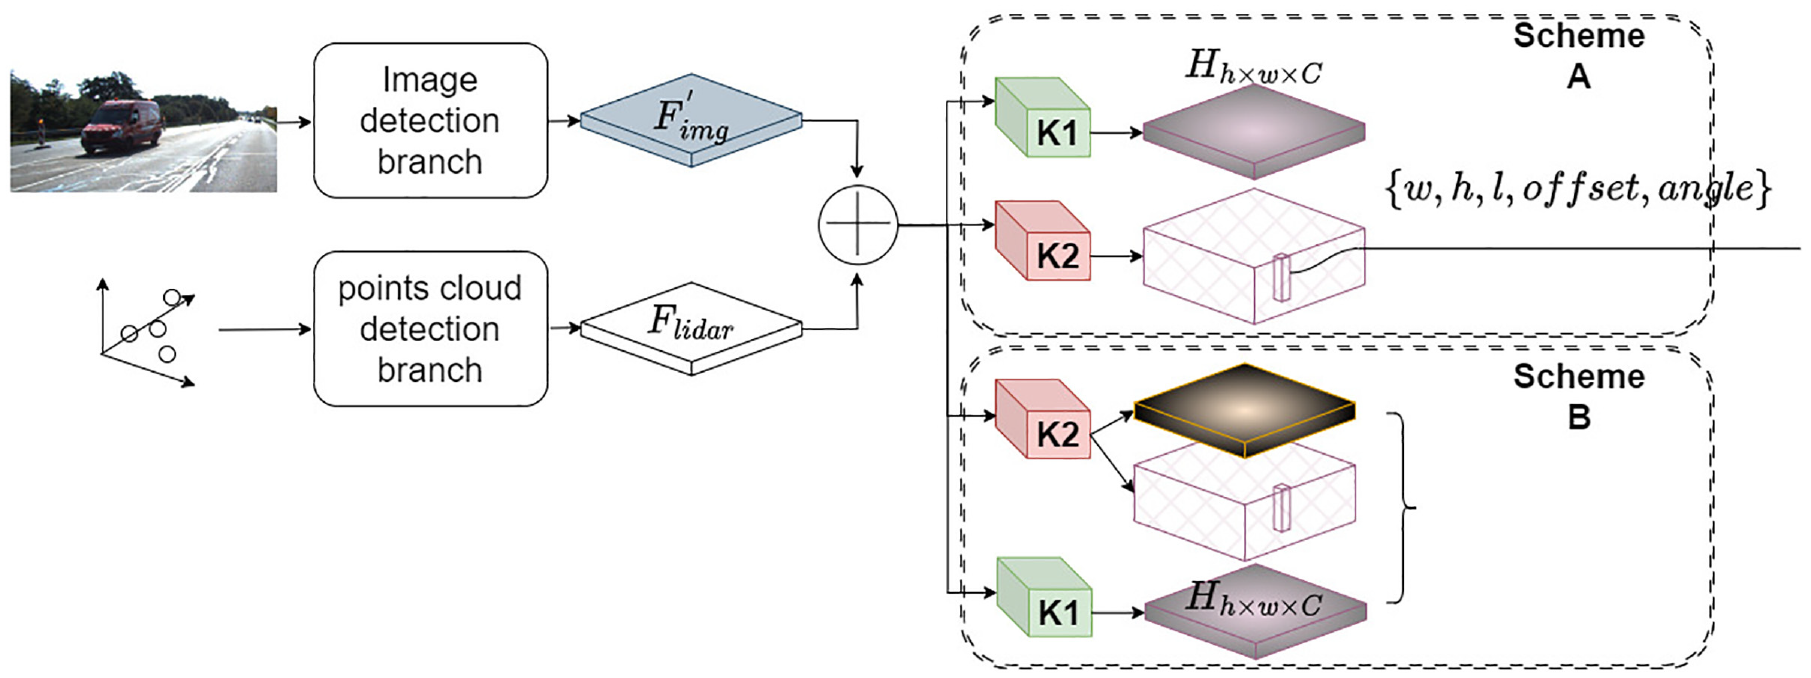
Train the 3D box regression module. K1 module had been trained by previous stage. The K2 module can be designed in two different ways.
Generally, CenterPoint divides the prediction of the heatmap and the regression of the 3D box into two parallel branches. Many studies have mentioned that this design is beneficial for achieving higher accuracy in detection results.32,34,35 However, during the third stage of training, after comparing the detection results of the two options, we found that for small targets, such as pedestrians in the distance, the parallel mode of Scheme A yielded lower detection performance compared to Scheme B. We further analyzed the reasons for this phenomenon in ablation experiments, and in the Supplemental Materials, we presented partial comparative results of the two options.
Experiments
Experiments on the KITTI dataset
We assess the performance of our model using the KITTI 36 3D object detection benchmark, which comprises 7481 training images/point clouds and 7518 test images/point clouds. This benchmark encompasses three categories: Car, Pedestrian, and Cyclist. Evaluation of detection results for each class is conducted across three difficulty levels: easy, moderate, and hard, which are determined based on factors such as object size, occlusion state, and truncation level. Following the experimental setup of Centernet3d, 37 we trained a 3D detection model specifically for the car category and achieved results similar to those reported in the paper on the validate set. Additionally, we trained Centernet on the COCO dataset 38 with the following modifications to the category labels: (1) selecting data for the three categories of pedestrians, cars, and bicycles, and (2) merging bicycles and motorcycles into a single bicycle category. Since the KITTI dataset contains these three categories, we utilize the KITTI validation set to validate the effectiveness of our training.
We utilized the COCO dataset version released in 2017, which consists of 118,000 training images and 5000 test images. For training CenterNet, we chose ResNet-50 as the backbone network to balance speed and accuracy. During training, we employed a multi-scale augmentation approach to ensure the 2D object detection model can accurately localize objects of different scales.
We employed Adam as the optimizer and adopted common image augmentation techniques, including random flipping, random scale resizing, and cropping. Training was conducted for 140 epochs on 8× NVIDIA RTX 3090TI GPUs, with an initial learning rate of 5e-4 and a decay rate of 0.1, adjusted at the 90th and 120th epochs. We set the batch size to 128 and utilized ResNet-50 weights pretrained on ImageNet. On the COCO validation set, our results are as Table 1.
The performance of CenterNet on the validation set of the COCO dataset.
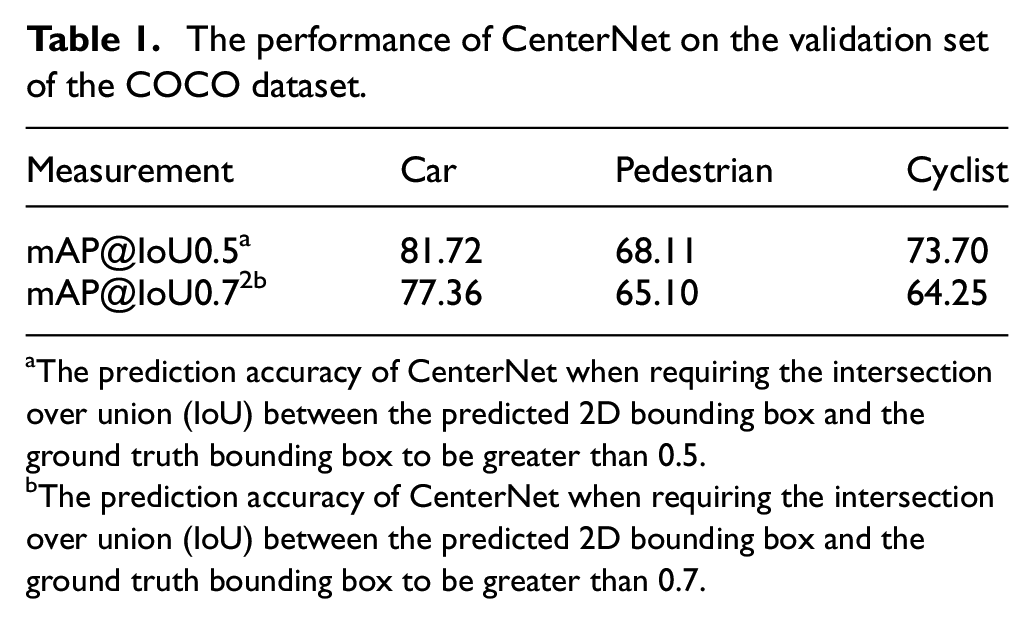
The prediction accuracy of CenterNet when requiring the intersection over union (IoU) between the predicted 2D bounding box and the ground truth bounding box to be greater than 0.5.
The prediction accuracy of CenterNet when requiring the intersection over union (IoU) between the predicted 2D bounding box and the ground truth bounding box to be greater than 0.7.
Following the experimental settings outlined in reference, 37 we evaluated the detection accuracy of cars on the validation set using an intersection over union (IoU) threshold of 0.7. The specific results are presented in Table 2.
The accuracy of CenterPoint on the validation set of KITTI.
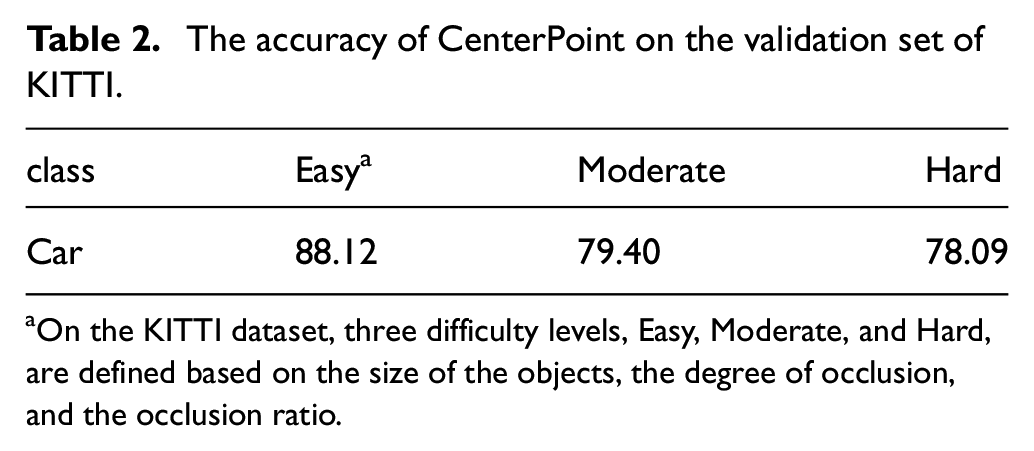
On the KITTI dataset, three difficulty levels, Easy, Moderate, and Hard, are defined based on the size of the objects, the degree of occlusion, and the occlusion ratio.
After pre-training both the 2D image detection model and the 3D point cloud detection model, we move on to the stage of model fusion and training.
Training the fused model is divided into three parts:
PART I:
Drawing inspiration from the Lift method for 2D to 3D feature transformation in BEVFusion,
14
we utilize the LSS model
22
to generate depth probability maps for 2D images. As mentioned earlier, by using intrinsic and extrinsic parameters, we fill 3D feature tensors
PART II:
In the prediction stage of the heatmaps for new categories, as shown in Figure 4, we fuse the feature maps
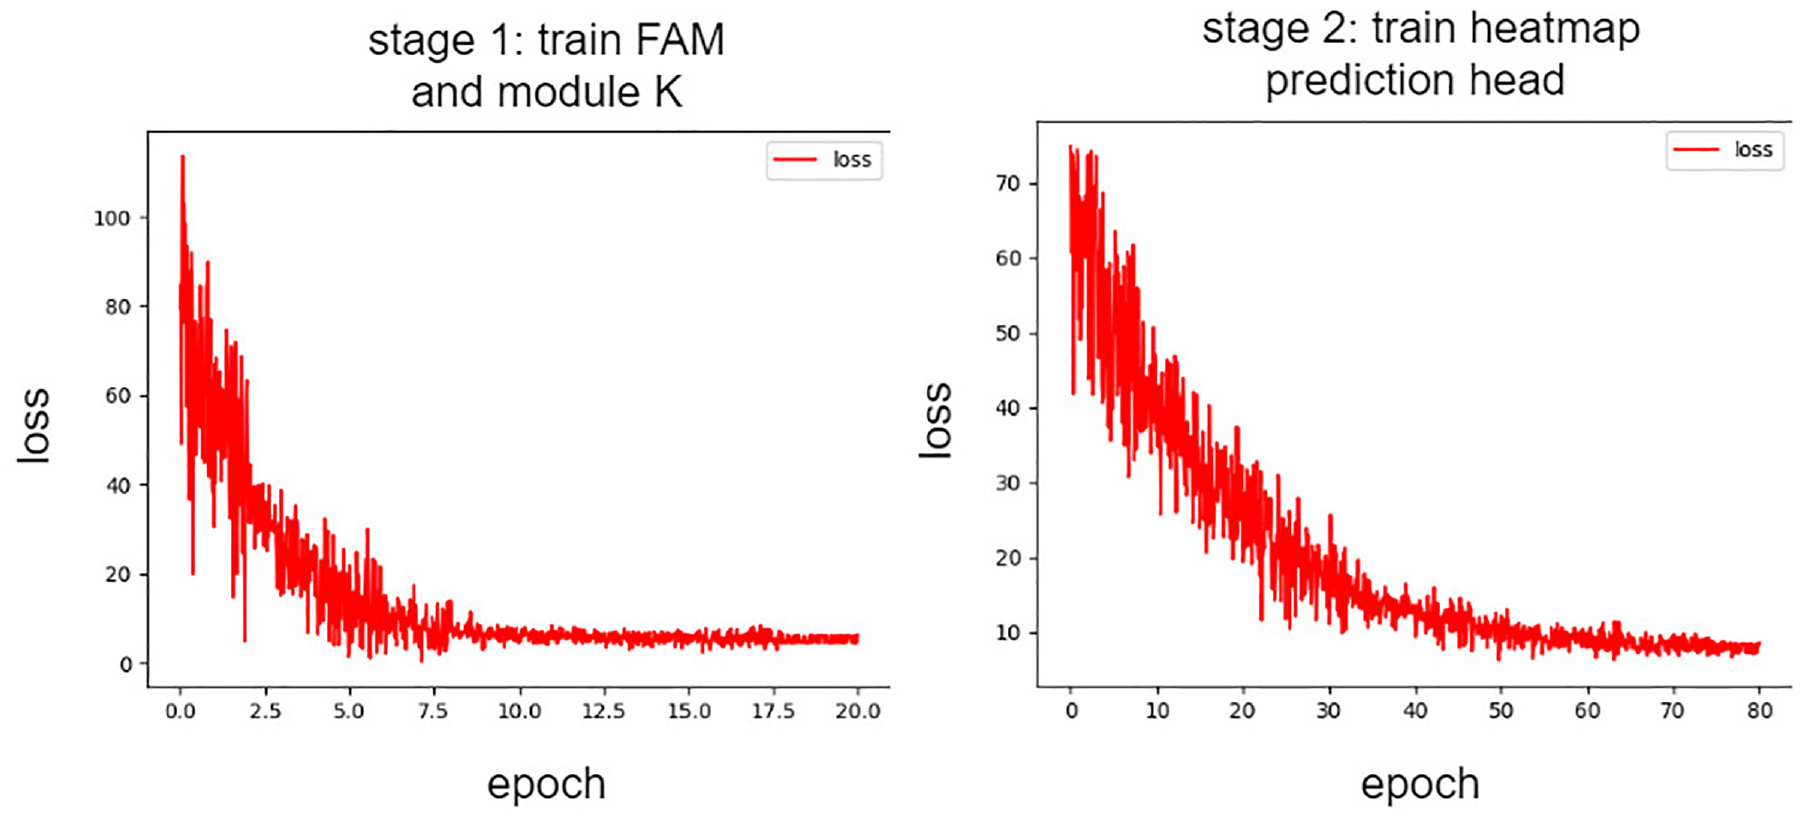
The curve of loss variation. The left figure depicts the change in loss during the first stage of training for the FAM (Feature Alignment Module) module and heatmap prediction module K, while the right figure illustrates the curve of loss variation across epochs during the second stage of training.
We train on the KITTI dataset with a batch size of 8 for a total of 80 epochs. For the first 60 epochs, we freeze all layers except for K1, and in the last 20 epochs, we update the parameters of the feature extraction branch with a very small learning rate. We utilize AdamW as the optimizer with an initial learning rate of 2e-6. Learning rate modification follows a step decay strategy with a decay rate of 0.9, modifying the learning rate at epochs 20, 30, 50, and 70. We set the exponential moving average (EMA) parameter
PART III:
When retraining the regression branch of 3D bounding boxes, we encounter the challenge of lacking effective supervision for regressing 3D boxes of two classes (pedestrians and cyclists). To enhance the accuracy of regressing boundary boxes, we utilize supervised learning with labels from shared categories on one hand. On the other hand, we adopt scheme B as illustrated in Figure 5, where the K2 module also predicts category heatmaps. By comparing the category heatmaps generated by K1 (obtained from previous training) and K2, and minimizing the error between them, we train the parameters of the K2 module.
In this stage, we conducted a total of 20 epochs of training. During the first 10 epochs, the learning rate was set to 1e-4, and the feature extraction branches for 2D images and 3D point clouds were frozen, only training the K2 module separately. Additionally, we used the output results of the K1 module as a reference for comparative training of K2. Simultaneously, by supervised training across different categories, we enhanced the ability of module K2 for 3D target regression. In the final 10 epochs, the K2 module was frozen, and the learning rate was reduced to 1e-5 to fine-tune the feature extraction branches of images and point clouds for optimizing the regression results. We selected AdamW as the optimizer with a weight decay of 0.03. Evaluating our detection performance on the entire KITTI validation set, as shown in Table 3, our detection accuracy ultimately surpassed that of the directly trained CenterNet3D model. Particularly noteworthy is that for the pedestrian and cyclist categories, due to the model’s ability to utilize texture information from images, the detection performance for small objects was better than that of the original single-modal 3D point cloud detection model. As shown in Figure 7, we provide some typical detection result comparisons.
Accuracy comparison on the validation set of KITTI.
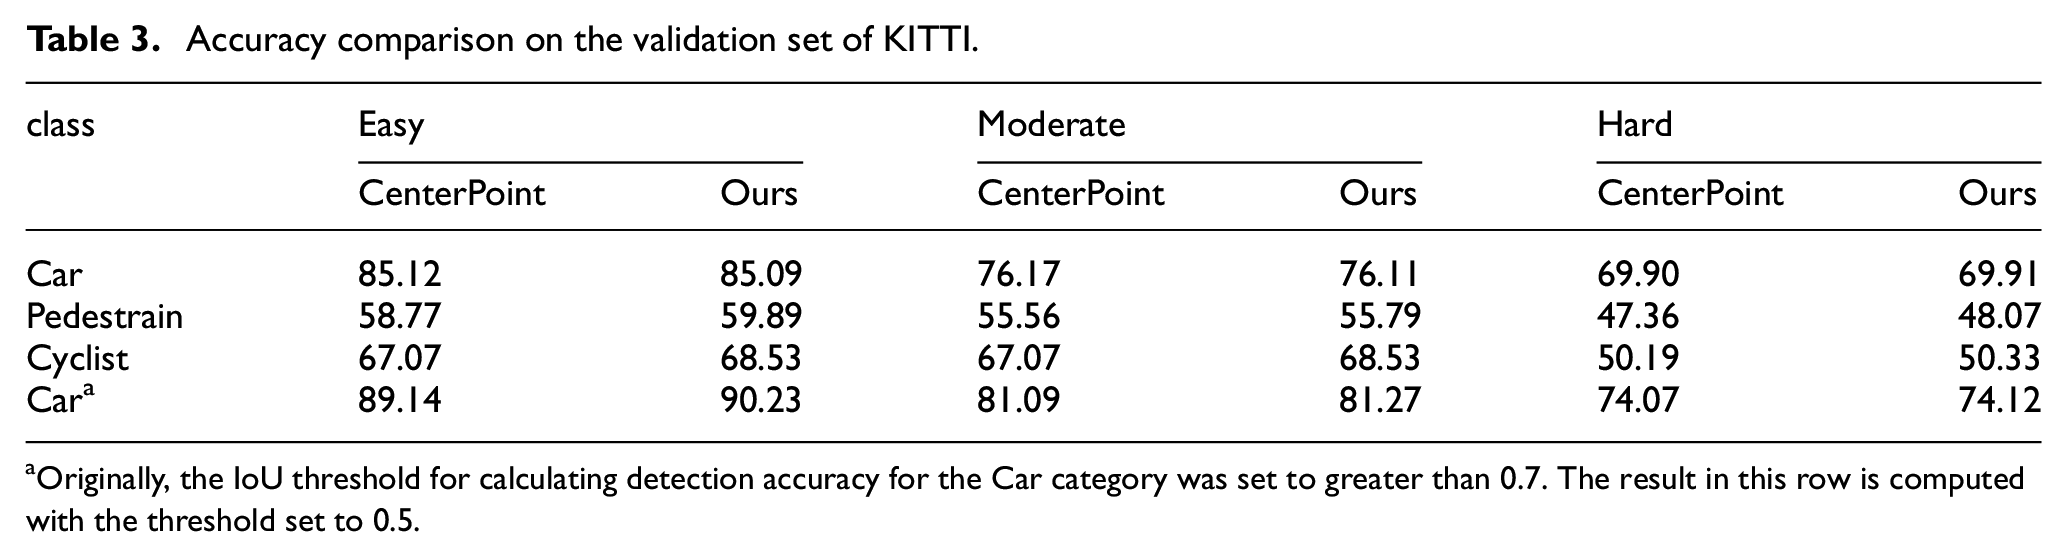
Originally, the IoU threshold for calculating detection accuracy for the Car category was set to greater than 0.7. The result in this row is computed with the threshold set to 0.5.
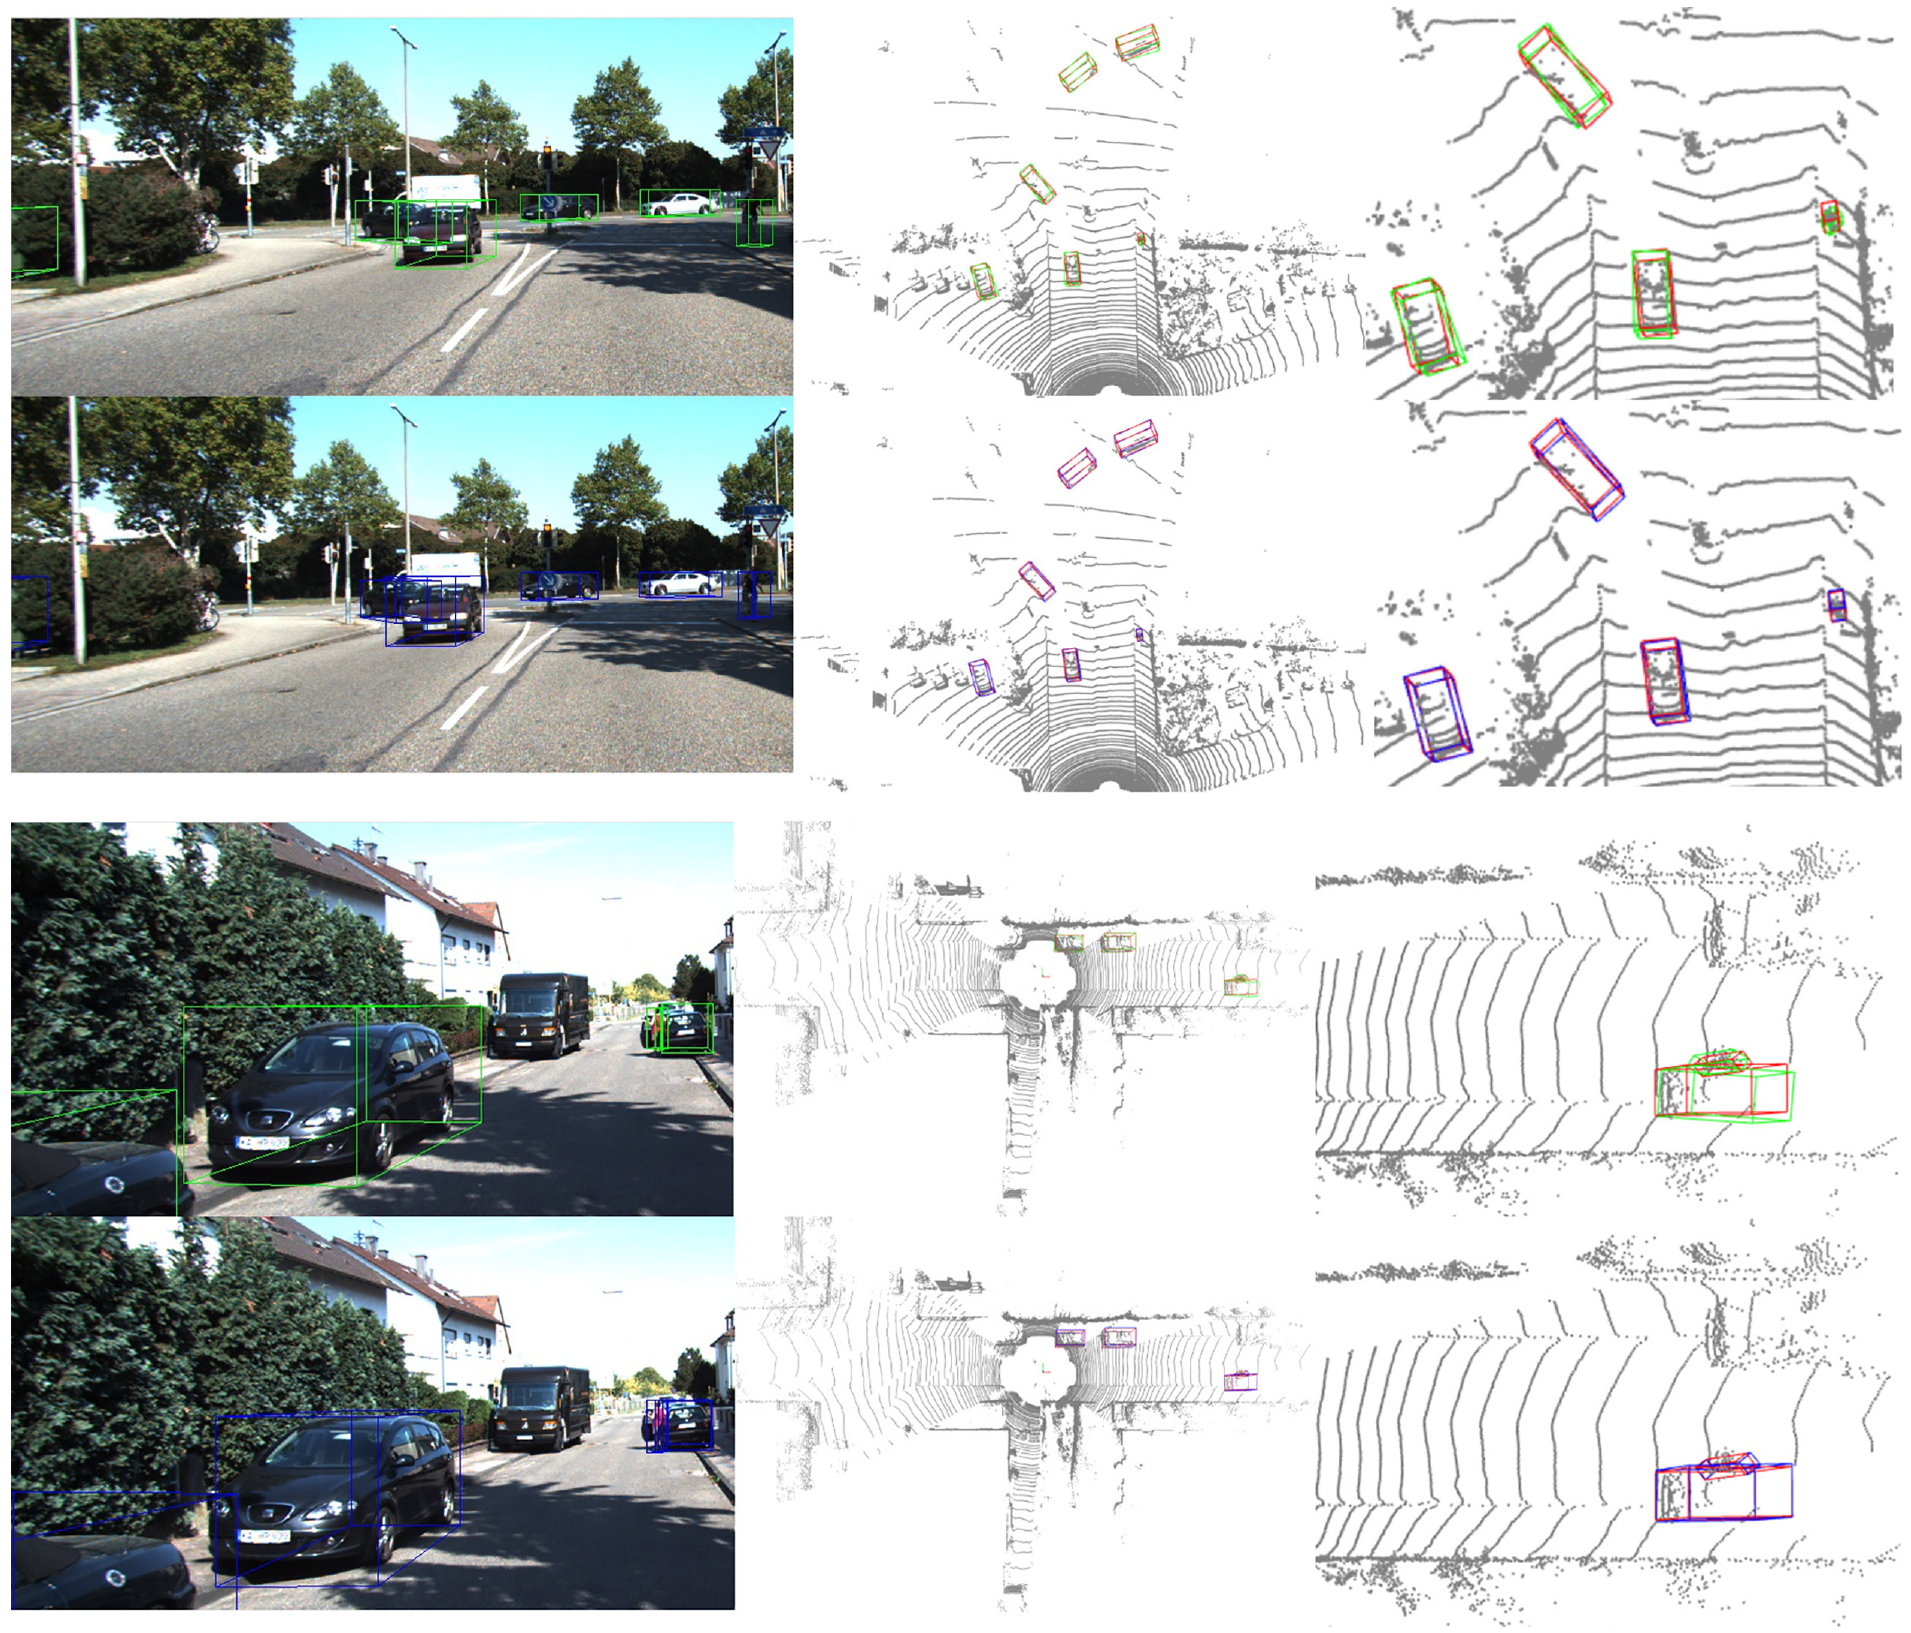
Comparison of prediction results on KITTI. Green boxes on the image represent the results detected by our pre-trained CenterPointNet, blue boxes indicate the results detected by the fusion model, and red boxes represent ground truth.
Comparison with SOTA method
To compare with the state-of-the-art (SOTA) methods in the current field, we designed a new experiment. In the KITTI dataset, we treated “Pedestrians” and “Cyclists” as cross-category classes for two different modal models. We provided only 2D bounding box annotations for the category “Car” during the training of our 2D image detection model. Our 2D image detection model was pretrained on the COCO dataset, while the 3D detection model, CenterPoint, was trained only on samples annotated with the categories “Pedestrian” and “Cyclist.” Training parameters were consistent with those of the previous experiment. We compared the performance of FGR, 18 MTrans, 19 and MAP-Gen 20 on the KITTI validation set, as shown in Table 4. During FGR model training, 2D annotations and sparse point clouds corresponding to the Car category are first used. Pseudo-labels are obtained through 3D bbox estimation, and these pseudo-labels are used to train the 3D point cloud detection model. The MTrans model and MAP-Gen model first trains an autolabeler on a subset of 3D-annotated Car category samples. This autolabeler is then used to re-annotate all Car category samples, and the newly obtained labels are used to train the 3D point cloud detection model. Compare the detection performance of the 3D point cloud models obtained from training with different methods, our approach achieved higher detection accuracy in the “Car” category compared to SOTA methods.
Detection performance of the Car category on the KITTI validation set.
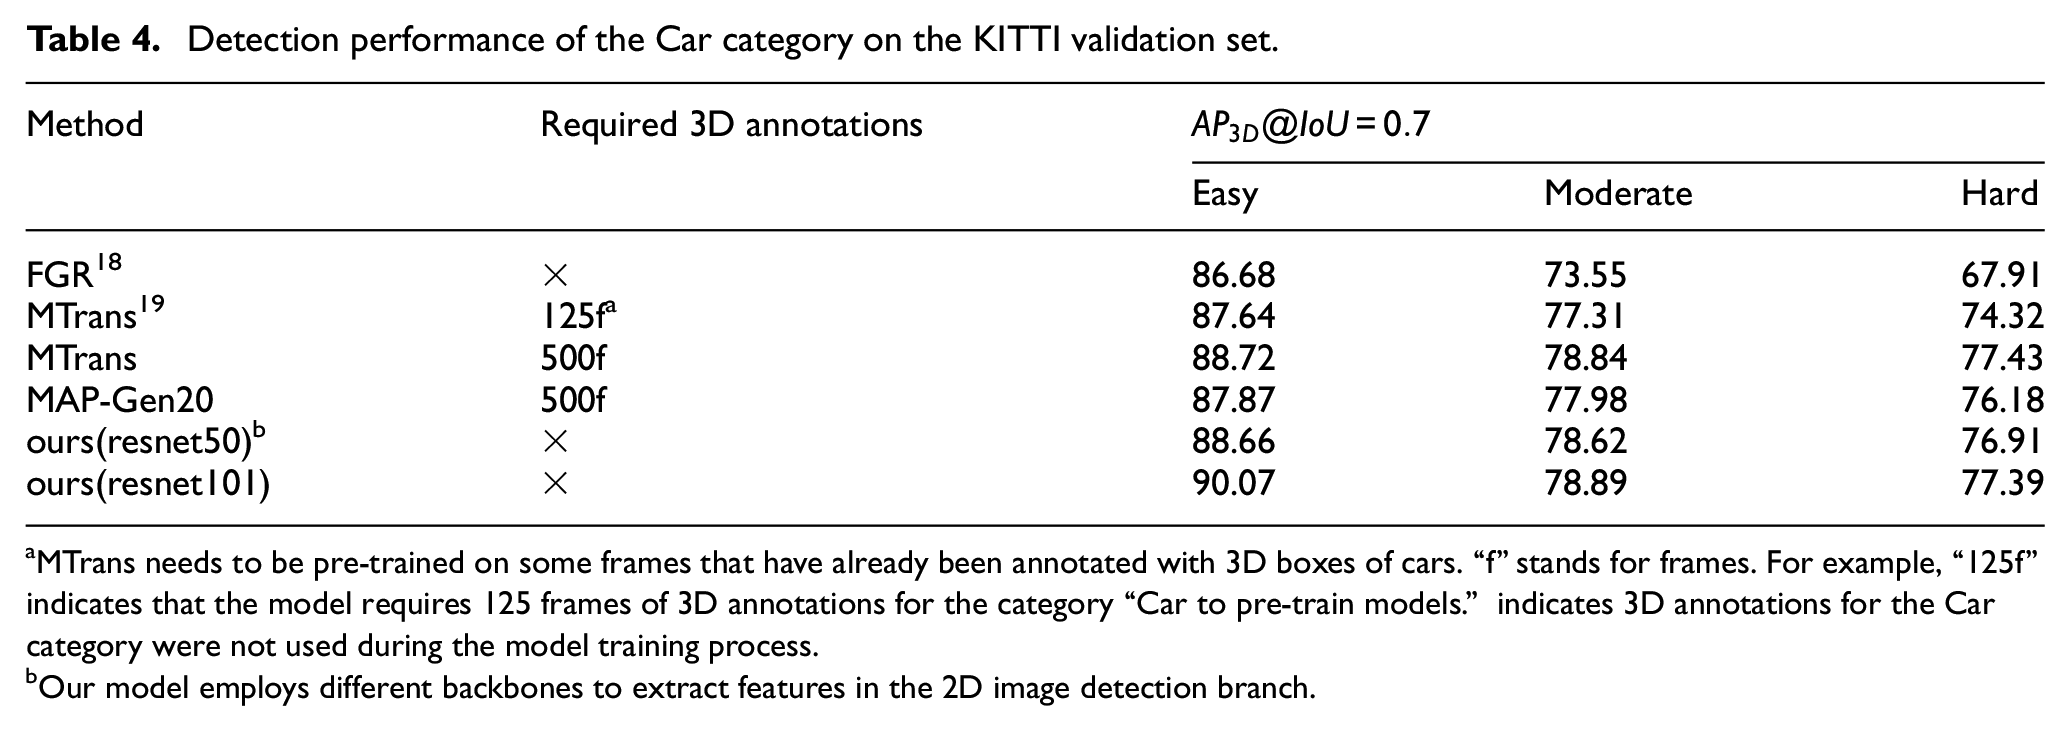
MTrans needs to be pre-trained on some frames that have already been annotated with 3D boxes of cars. “f” stands for frames. For example, “125f” indicates that the model requires 125 frames of 3D annotations for the category “Car to pre-train models.” indicates 3D annotations for the Car category were not used during the model training process.
Our model employs different backbones to extract features in the 2D image detection branch.
Ablation experiment
The ablation experiment for the η step size
As shown in Figure 1, aligning
When comparing the range limits, we examined symmetric ranges:
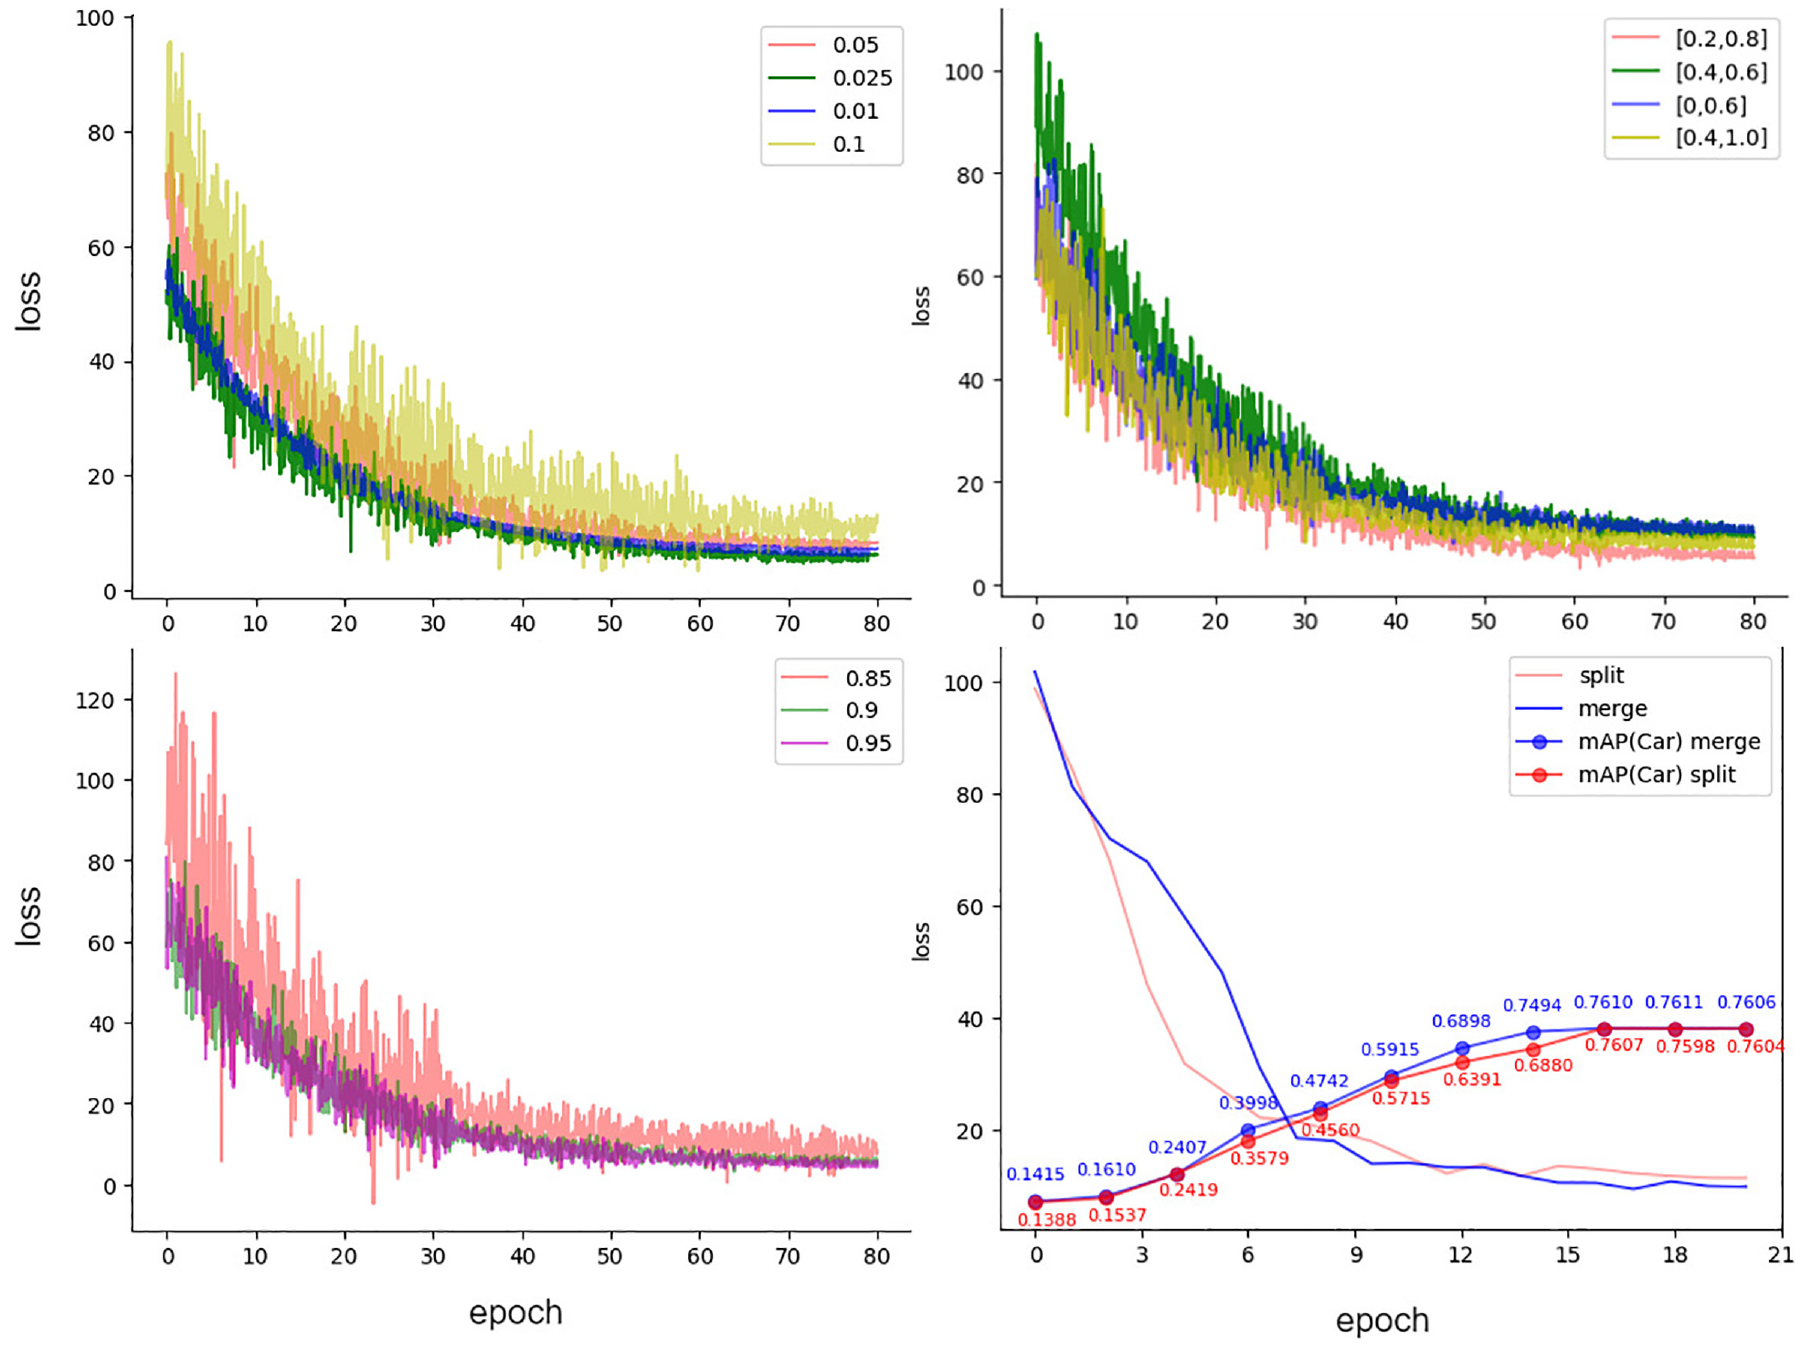
The chart in the top left corner compares the variation of loss during training across different step sizes within the range
Therefore, a larger range for
Ablation experiments on the smoothing coefficient β
After fixing the fusion parameter
Comparing the detection accuracy between combined prediction heads and separate prediction heads
To compare the difference between using separate prediction heads and combined prediction heads in the third stage of fusion training, we trained models under both schemes. As depicted in Figure 8, we comprehensively compared the stability of loss and the average accuracy on the KITTI validation set’s Moderate difficulty level every two epochs. Finally, Table 5 presents a comparison of our results on the KITTI validation set. According to the comparison, we found that using combined prediction heads leads to higher accuracy.
Accuracy comparison of different prediction heads on KITTI.
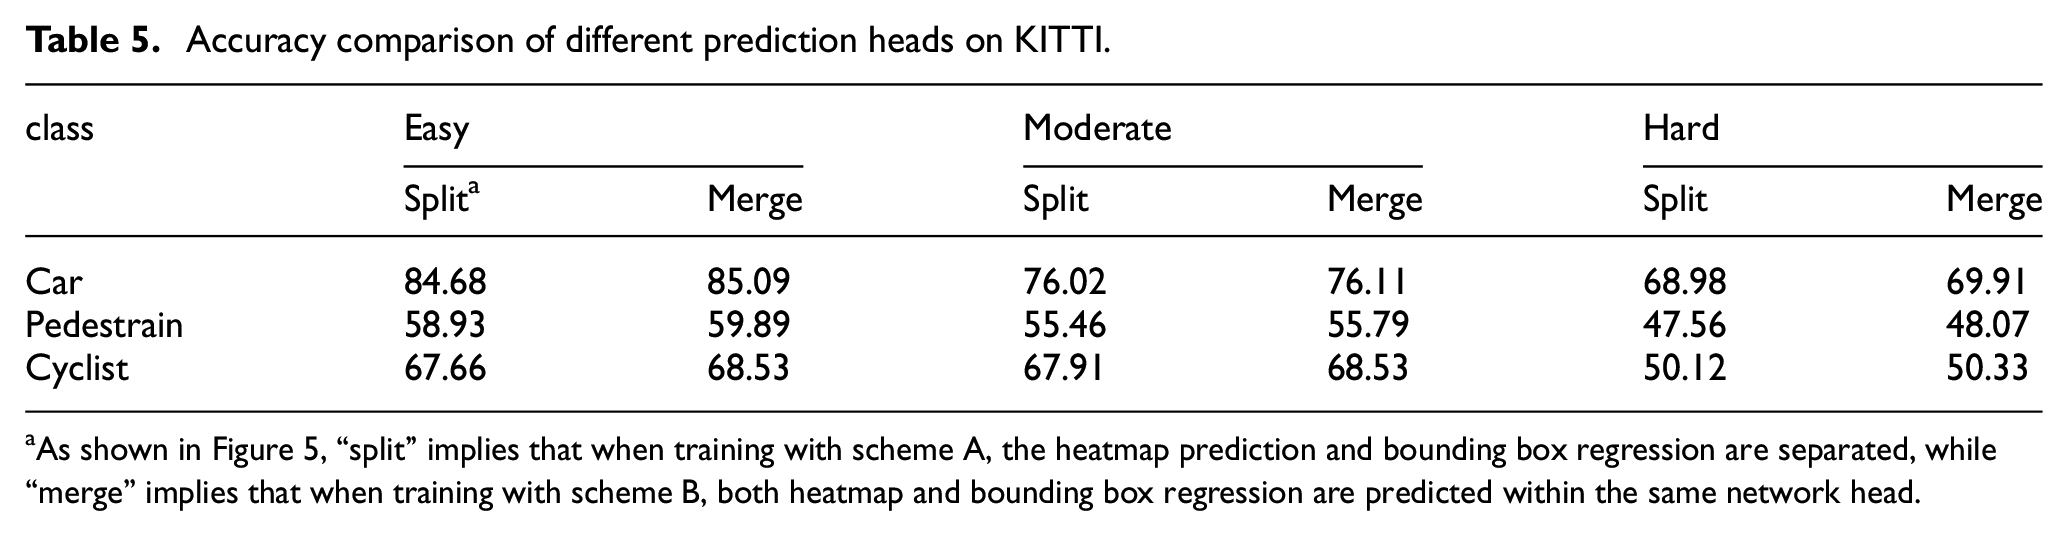
As shown in Figure 5, “split” implies that when training with scheme A, the heatmap prediction and bounding box regression are separated, while “merge” implies that when training with scheme B, both heatmap and bounding box regression are predicted within the same network head.
Conclusion
In autonomous driving, 3D object localization serves as a critical means of environmental perception. Utilizing images for 3D object detection in complex scenarios often results in inaccurate target positioning due to the lack of depth information. Combining texture information from images with positional data from 3D point clouds is a preferred approach in many multimodal 3D detection models. However, compared to image-based 2D annotations, point cloud-based 3D annotations are more complex and costly. To leverage readily available 2D image annotations to guide 3D detection models in detecting new classes and ultimately detecting 3D objects using fused information, we propose a weakly supervised training approach for multimodal models. This method comprises the following steps: (1) predicting positional heatmaps, aligning features extracted from 2D images and 3D point clouds; (2) adding new classes and retraining the heatmaps; (3) retraining the regression heads through cross-category training. Ultimately, we successfully fuse the 2D image detection model with the 3D point cloud detection model, resulting in a novel detection model that surpasses the performance of using the 3D point cloud detection model alone.
Our proposed method guides multimodal models to achieve 3D object detection capability on unknown categories through 2D annotations. However, this method relies on heatmaps as an intermediary for weakly supervised training, which restricts its applicability. In the future, we will extending this training method to query-based 3D object detection frameworks.
Supplemental Material
sj-doc-1-mac-10.1177_00202940241297568 – Supplemental material for A weakly supervised method for 3D object detection with partially annotated samples
Supplemental material, sj-doc-1-mac-10.1177_00202940241297568 for A weakly supervised method for 3D object detection with partially annotated samples by Bin Lu, Qing Li and Yanju Liang in Measurement and Control
Footnotes
Declaration of conflicting interests
The author(s) declared no potential conflicts of interest with respect to the research, authorship, and/or publication of this article.
Funding
The author(s) received no financial support for the research, authorship, and/or publication of this article.
Data availability statement
All relevant data are within the paper.
Supplemental material
Supplemental material for this article is available online.
References
Supplementary Material
Please find the following supplemental material available below.
For Open Access articles published under a Creative Commons License, all supplemental material carries the same license as the article it is associated with.
For non-Open Access articles published, all supplemental material carries a non-exclusive license, and permission requests for re-use of supplemental material or any part of supplemental material shall be sent directly to the copyright owner as specified in the copyright notice associated with the article.