
Abstract
The 13-point laser detection vehicle is widely used for the rapid detection of rutting on national and provincial trunk lines in China. Affected by the road alignment and drivers’ human factors, the inspection vehicle will inevitably shift laterally during the inspection process. Offset wandering of an automated measurement vehicle on the overestimation of rut depth was investigated and analyzed with the objective of determining the impact of this phenomenon on the accurate and timely selection of maintenance and rehabilitation (M&R) actions. For this purpose, three representative rut types commonly used in China with high and medium severity levels of rutting were selected from field surveys and studied. For each rut type, the cross sections with a rut depth between 10 and 15 mm were selected to study the impact of different offset distances on the measurement accuracy. The reliability of lateral offset detection was further validated by simulating different rut shapes. Finally, an error judgment parameter E was implemented and evaluated. The results showed that the overestimation could be observed only at an offset distance lager than 300 mm. The maximum percentage of overestimation could be as high as 86.0%, 93.3%, and 67.5% for Types 1, 2, and 3 rut shapes respectively. The presence of a central upheaval was a dominant factor which reduced the error parameter E. The calculation of the severity error judgment E indicated that the errors were mainly governed by the offset distance; the maximum ratio was 13.0% for 300 mm, and dramatically increased up to 61.3% for 500 mm. Therefore, the maximum acceptable offset within which reliable M&R decision could be taken was 300 mm.
Introduction
As one of the main types of damage to asphalt pavements,1–5 rutting becomes more pronounced with increasing traffic volumes, vehicle channeling, and heavy and overloading problems. The generation of rutting not only directly affects the comfort and safety of driving, but also seriously affects the quality and service life of the road surface.
Rapid and reliable rut depth detection results are an important basis for pavement condition evaluation and maintenance countermeasures selection. At present, multi-point laser technology, generally used for rut depth detection, solves the problem of speed and accuracy of rut depth detection to a certain extent. However, its reliability is affected by many factors, such as the number of sensors, layout method, vehicle lateral offset and depth calculation method. These factors restrict the scientific and refined development of highway maintenance management.6–8
Under the influence of external environment, such as lighting conditions and road alignment, or the subjective effect of the driver (fatigue and distraction), it is difficult to ensure that the vehicle always drives along the centerline of the lane. This will lead to the lack of detection of road profile information. Figure 1(a) and (b) showed the detection of vehicles traveling along and away from the centerline of the lane respectively. 9 The shaded box in Figure 1 was the detection width of the point laser equipment, which ranged between 3.2 and 3.6 m, and its coverage was smaller than the width of the lane (3.75 m). When the vehicle ran straight along the centerline of the lane, the complete rut profile could be collected without offset error. By contrast, when it deviated from the centerline of the lane, it failed to cover the complete rut profile, and there would be offset errors caused by the lack of profile information. The lateral offset in Figure 1 occurred randomly on the left and right sides.
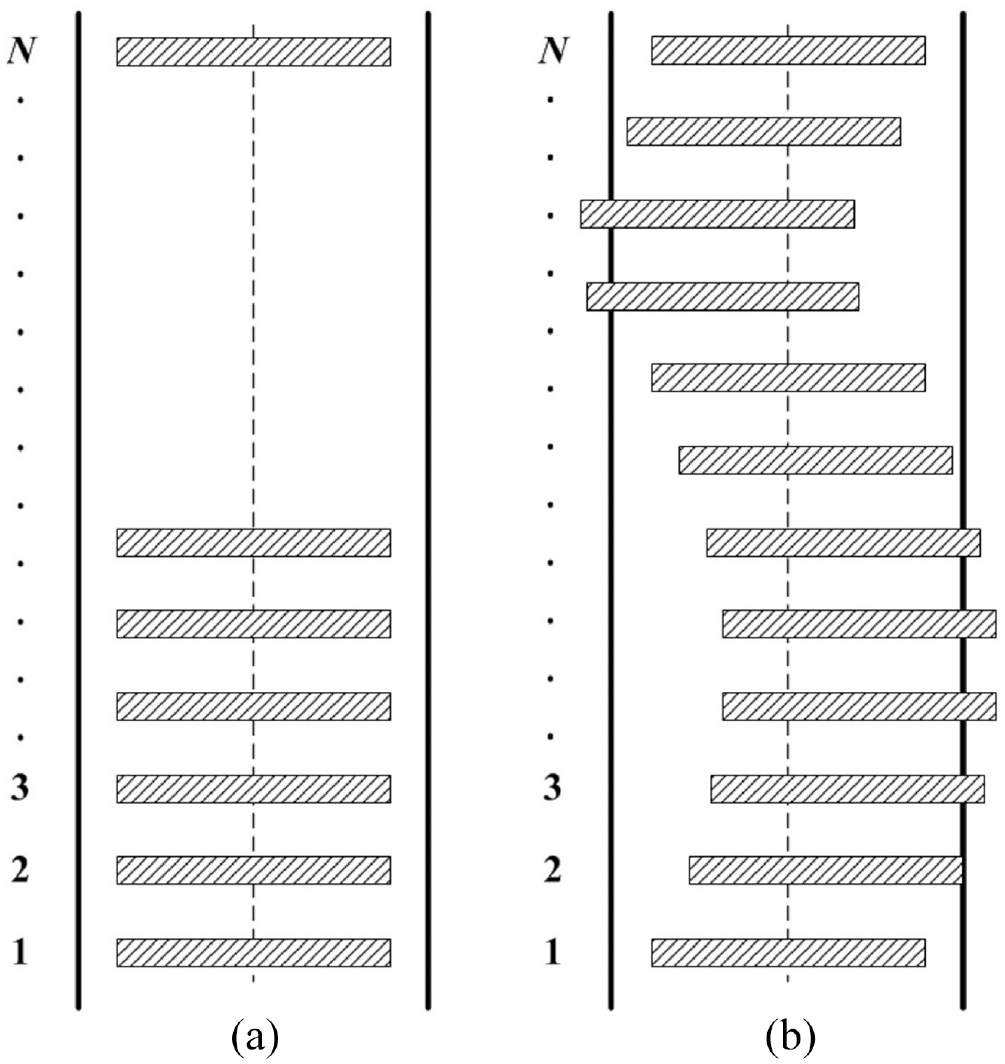
Illustration of lateral vehicle wandering with respect to the pavement lane marking. (a) Ideal. (b) Wandering.
For instance, Simpson10,11 used the simulation method to study the influence of lateral offset on the depth error for the rut detection equipment at points 3 and 5, assuming that the offset would occur randomly on both sides with the offset distance ranging between ±50 and ±250 mm. Tsai et al. and his research team 12 observed that, while the lateral offset would cause rut depth underestimation, a larger number of laser points reduced the measurement errors. In a different research effort, Bennett and Wang 13 employed real cross sections to investigate the errors affecting rut depth measurements obtained with a 30-point-based laser at offset distances of 50, 100, and 150 mm. Both overestimation and underestimation errors were detected. In addition, he pointed out that the various shape of transverse profiles could also induce different offset errors. Comparing the effectiveness of two different measurement devices, Mallela and Wang 14 showed that the 13-point-laser equipment with uneven sensor distribution led to a smaller error in the wheel path compared to a standard 15-point-laser bar, which suggested that the specific layout of a multipoint laser sensor might influence the offset error. Ma 15 simulated symmetric W-shape rutting obtained through a sinusoidal function with n sensors equally spaced by a distance di; it was found that the maximum error was associated with an offset of di/2 on both lane sides. Luo 16 and Li 17 utilized 2D pavement images with lane markings to measure lane offsets, enabling a more precise localization of rutting positions.
In a study conducted by Hui et al., 18 the cross section profile was simulated based on the field measurements obtained via a 13-point based laser configuration, thereby spotting both overestimation and underestimation. The absolute error in the estimation of the rut depth increased for larger offsets up to 6.4 mm.
Most of the research performed in the past indicated that the lateral offset, namely d, contributed to an underestimation in rut depth measurement. However, only Hui et al. 18 observed overestimation errors which increased the complexity of the issue and could ultimately affect M&R decisions.
Objective and research approach
This section presented the research approach to exploring the influence of detection vehicle lateral offset overestimation on asphalt pavement rut depth measurement accuracy, as shown in Figure 2. This paper assessed the impact of vehicle wandering on the precision of rutting measurements, with a focus on determining the maximum tolerable offset distance. Additionally, it aimed to provide estimations regarding the dependability of decisions on prompt maintenance and repair (M&R) actions. To achieve this, three typical rut shapes from field transverse profiles were employed to illustrate the effects of five varying levels of lateral offset severity on rut measurements, encompassing both the right and left sides of the travel direction. Consequently, a comprehensive evaluation was conducted, considering various offset distances on both sides in the measurement process. Different offset distances on both left and right sides associated with the measurement process were evaluated.
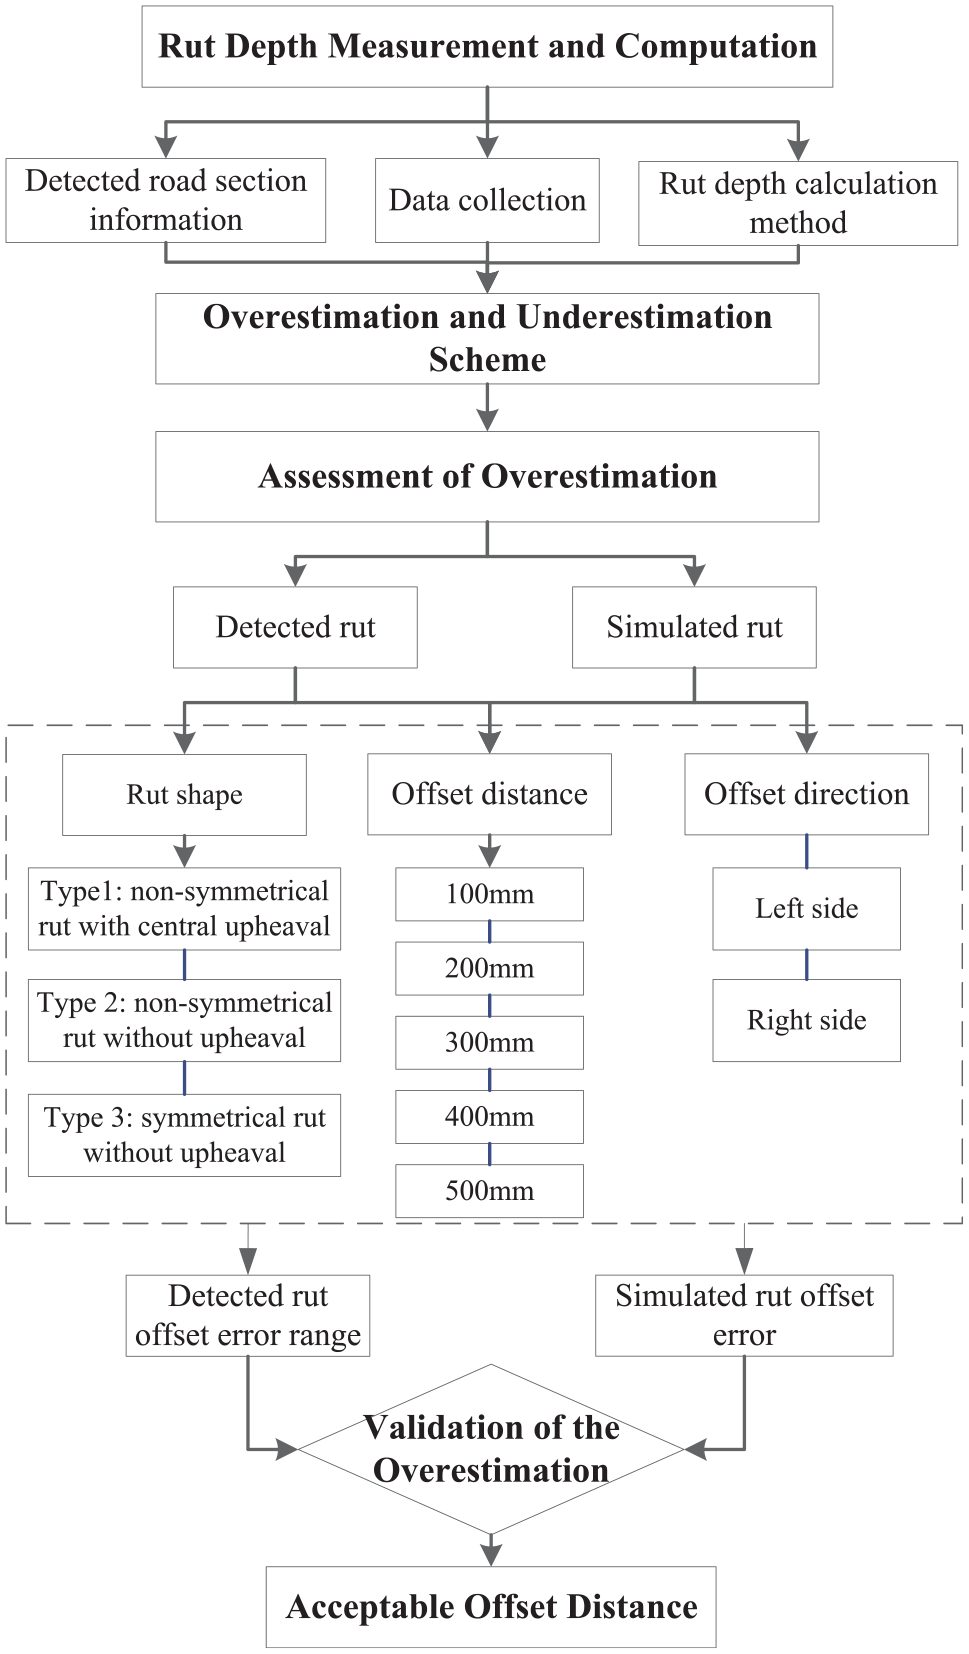
Flow chart of method for detection vehicle lateral offset overestimation.
The contributions of this paper lay in quantifying the impact of vehicle wandering on rut depth measurement accuracy and identifying the factors, including the characteristics of rut shapes and vehicle wandering, which might reduce rut depth measurement accuracy.
This paper was organized as follows. First, the commonly used 13-point laser bar device and the experimental measurements were introduced together with the rut depth computation method. Rutting severity levels were presented, and overestimation and underestimation schemes were established. Next, the overestimation values were used to evaluate the impact of the offset magnitude on the rut depth measurement accuracy for three rut shapes. Then, the reliability of lateral offset overestimation under more rut shapes through the study of simulated rut was validated. Finally, an in-depth analysis of the error judgment E for the M&R decision was performed and a practical recommendation was provided.
Rut depth measurement and computation
Information on detected road section
The studied road section was located on a national road in Jiangsu Province, which was completed and opened to traffic in October 2008. The detected road section was a two-way six-lane road with a width of 21 m and a designed speed of 100 km/h. The pavement thickness ranged between 40 and 50 cm, consisting of layers of 10 cm asphalt concrete and 40 cm cement stabilized macadam mixture. This paper selected the rut detection data of the uplink section (mileage station numbers K09+000–K10+710). The ruts in this section of road were deep and easy to identify, and their shapes were diverse and representative.
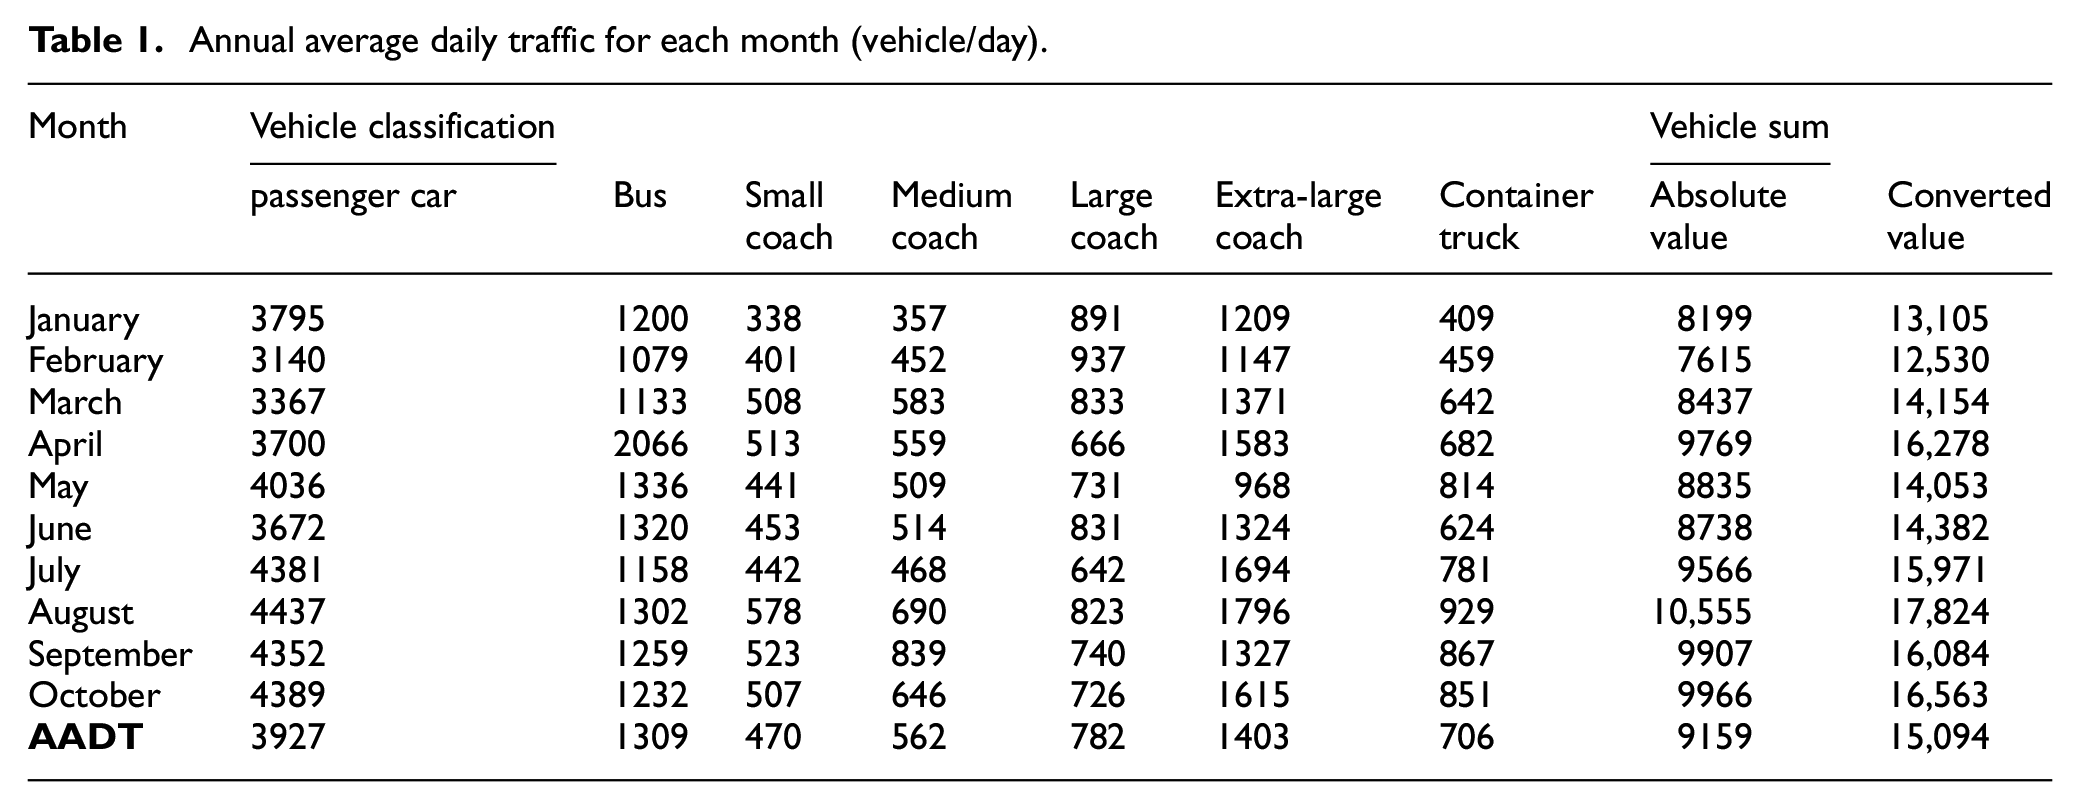
The annual average daily traffic for the first 10 months was shown in Table 1, which displayed that the traffic flow was dominated by small cars and medium-sized coaches. Passenger cars, buses, minivans and medium-sized coaches accounted for nearly 68% of the traffic volume. The traffic volume going up and down was evenly distributed.
Annual average daily traffic for each month (vehicle/day).
Data collection
Laser scanners, considered as a cheap, highly accurate and reliable measurement method, are highly recommended in rutting measurements.19,20 At present, some universities and research institutes purchase and use full-width laser detection instruments and LiDAR to detect indicators such as rut depth, but the use of 13-point lasers for detection of national and provincial coach lines in China remains the mainstream.21–23 In addition, a large quantity of historical maintenance inspection data is also based on the 13-point laser inspection vehicle.
The detection equipment used in this paper was the Road Condition Rapid Detection System (CiCS) developed by the Research Institute of Highway Ministry of Transport, as shown in Figure 3(a).The equipment was based on the principle of discrete point elevation measurement, the width of the detection beam reached 2300 mm, and the installation height reached 300 ± 50 mm from the ground. Nine vertical laser sensors were arranged non-uniformly along the beam direction. Two oblique laser sensors were arranged at the left and right ends respectively, and the lasers were emitted to the road at different deflection angles, which could expand the cross-sectional detection width to 3600 mm without affecting the traffic. The specific layout and spacing were exhibited in Figure 3(b). The vertical laser sensors (D1–D5 in Figure 3(b)) had a fixed horizontal spacing, densely packed at the wheel track (with a spacing between 225 and 250 mm), while sparse at the non-wheel track (with a spacing of 400 mm). The lateral spacing of oblique laser sensors was calculated from the laser reflection time. Due to the unevenness of the road surface, there was a fluctuation of ±5 mm, which could be ignored in actual calculation and replaced by a fixed spacing.
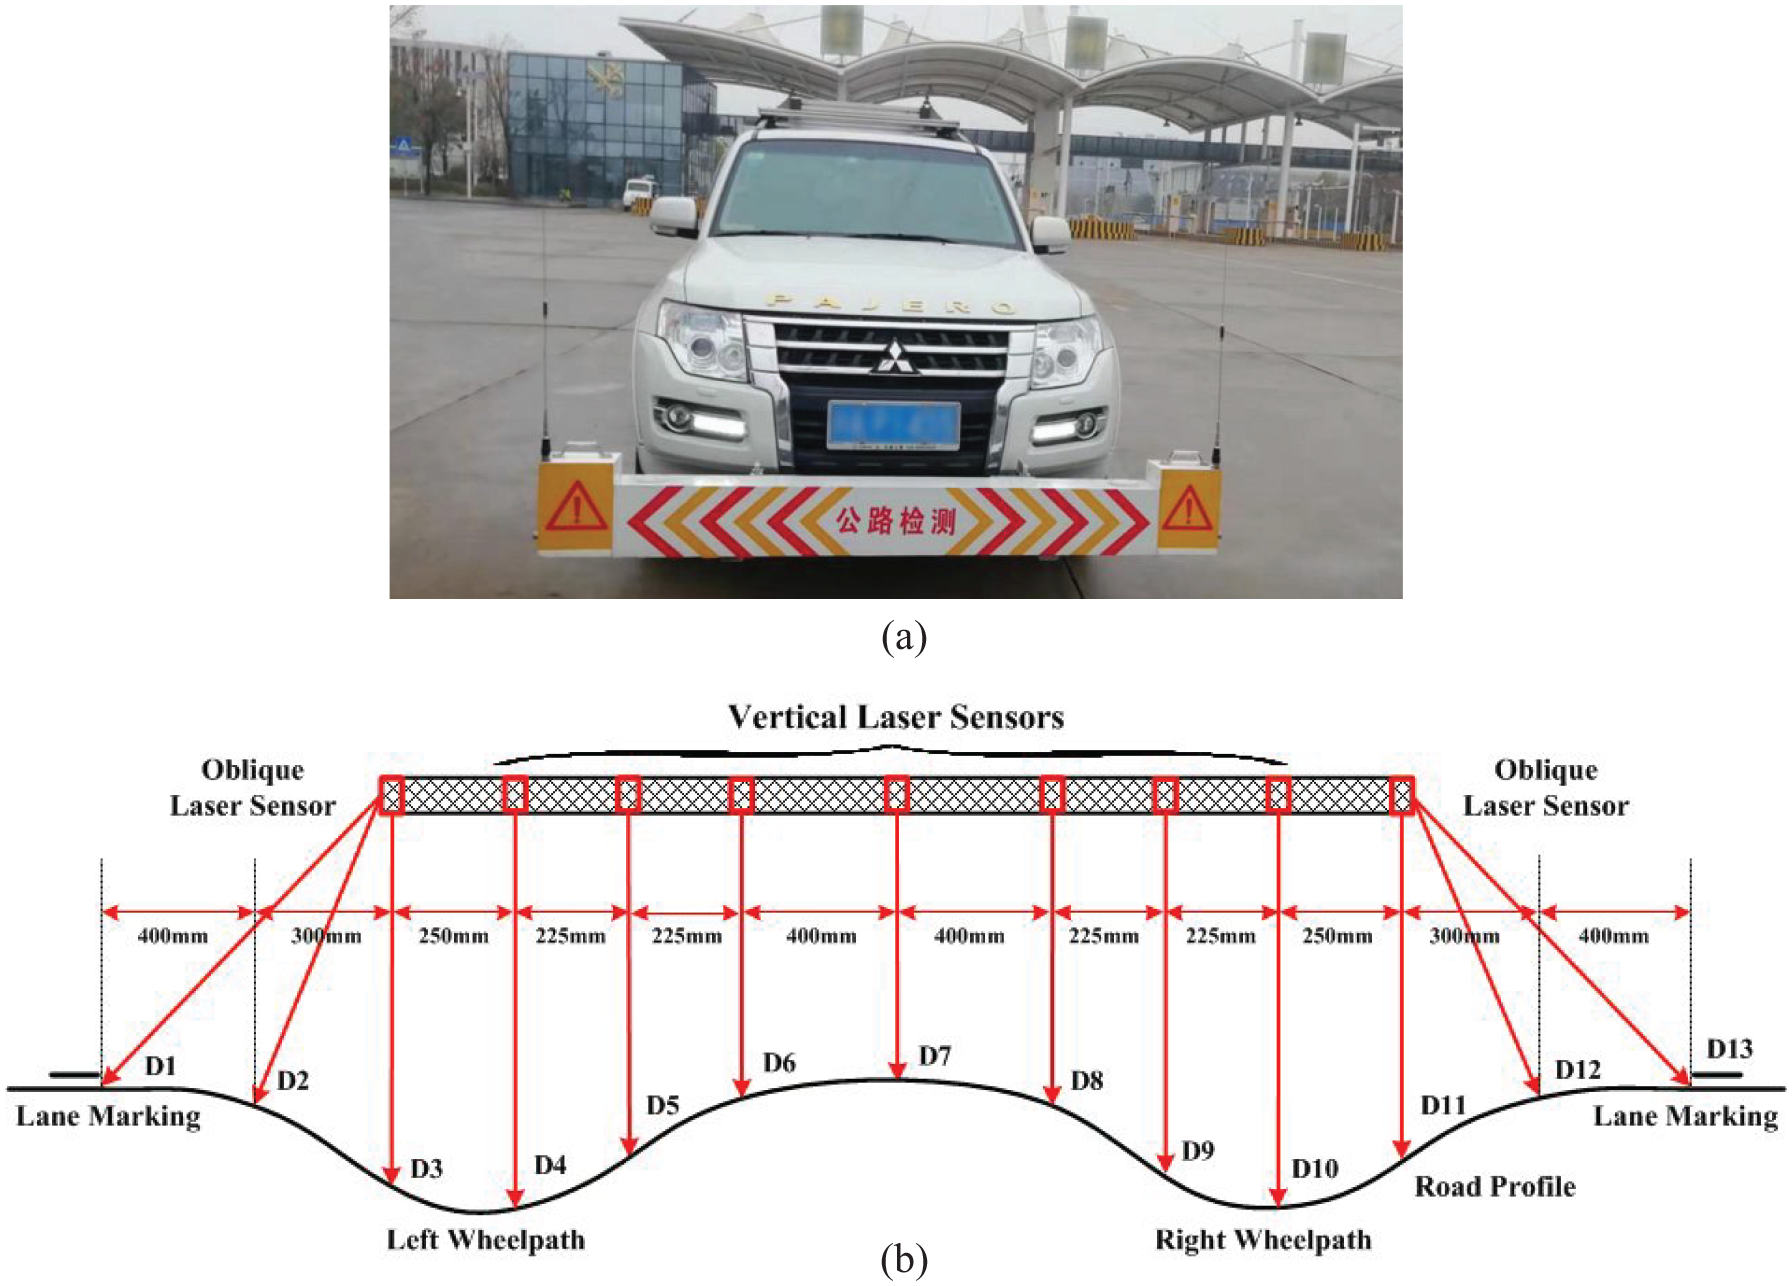
Instrumented vehicle with a 13-point laser bar and layout of sensors. 18 ; (a) Detection vehicle measuring in the road. (b) The layout of laser sensors.
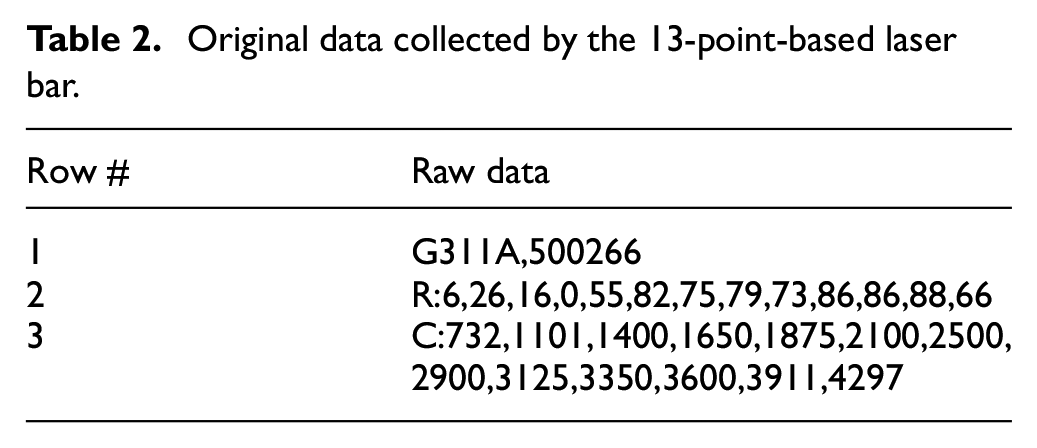
Table 2 listed the original data of a representative rut transverse profile collected by a 13-point-based laser bar. Each profile data consisted of three lines. In the first row, “G” represented the national road (while “S” represented the provincial road). 311 represented the road number, and “A” represented the upward line (while “B” represented the downward line). “500,266 stood for the stake number of the detection point, the unit was cm, and the rut shown in Table 2 was located at K5+002.66 m. In the second row, each point showed the vertical height of the pavement measured by the laser sensors with an accuracy of 0.1 mm. The third row was the horizontal position of the detection laser points in a unit of 1 mm. The lateral coordinate difference between the first and last points was the measurement width range of the rut detection equipment.
Original data collected by the 13-point-based laser bar.
Rut depth calculation method
The calculation principle of rut depth was shown in Figure 3. The laser detection vehicle CiCS detected the scattered points of the rut transverse profile, and could not directly obtain the maximum rut depth. Therefore, the discrete elevation points of the profile data were fitted into a continuous road profile shape, and the corresponding rut depth was secured according to the Highway Performance Assessment Standards 2007. 24 The rut depth under this method was referred to as the maximum vertical distance between the wire line and the road profile.
The shape of the rut transverse profile changed a lot before and after the vehicle lateral offset. The maximum rut depth before the vehicle lateral offset was the right rut RD2, while that after the lateral offset was the left rut RD’1. It could be seen from Figure 4 that the calculation result of the rut depth was more sensitive to the rut shape.
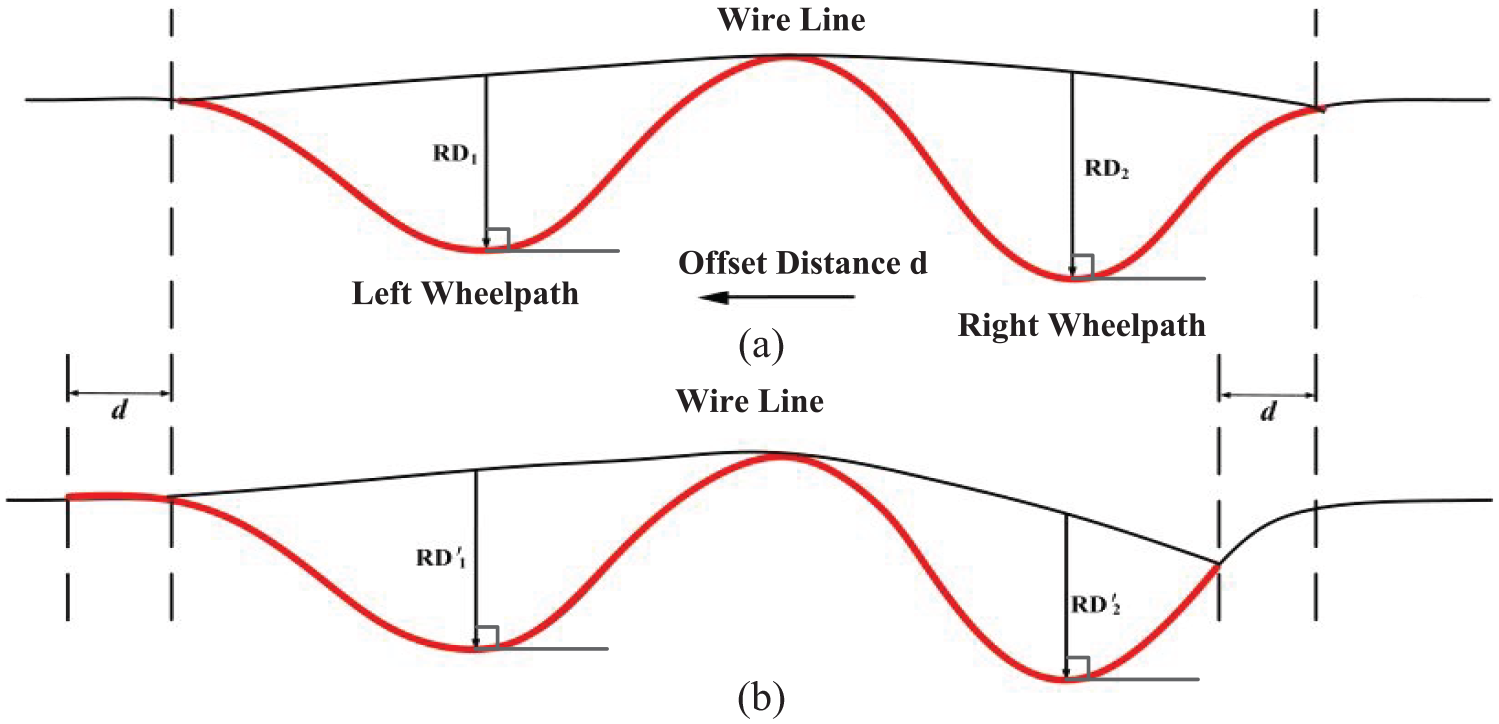
Schematic diagram of the effect of vehicle lateral offset on shape and maximum rut depth.
Overestimation and underestimation schemes
In this study, a highway section at a length of 1.7 km affected by rutting distress was tested with the 13-point-based laser bar, and the cross section profile was measured and recorded every 20 cm. Three typical rut shapes identified in the current Chinese standards were extracted from the data set: (a) Type 1—non-symmetrical rut with central upheaval; (b) Type 2—non-symmetrical rut without upheaval; and (c) Type 3—symmetrical rut without upheaval. The upheaval was defined as pavement material lifted above the original pavement surface due to deformation phenomena. Different rut shapes and maximum rut depths were illustrated in Figure 5.
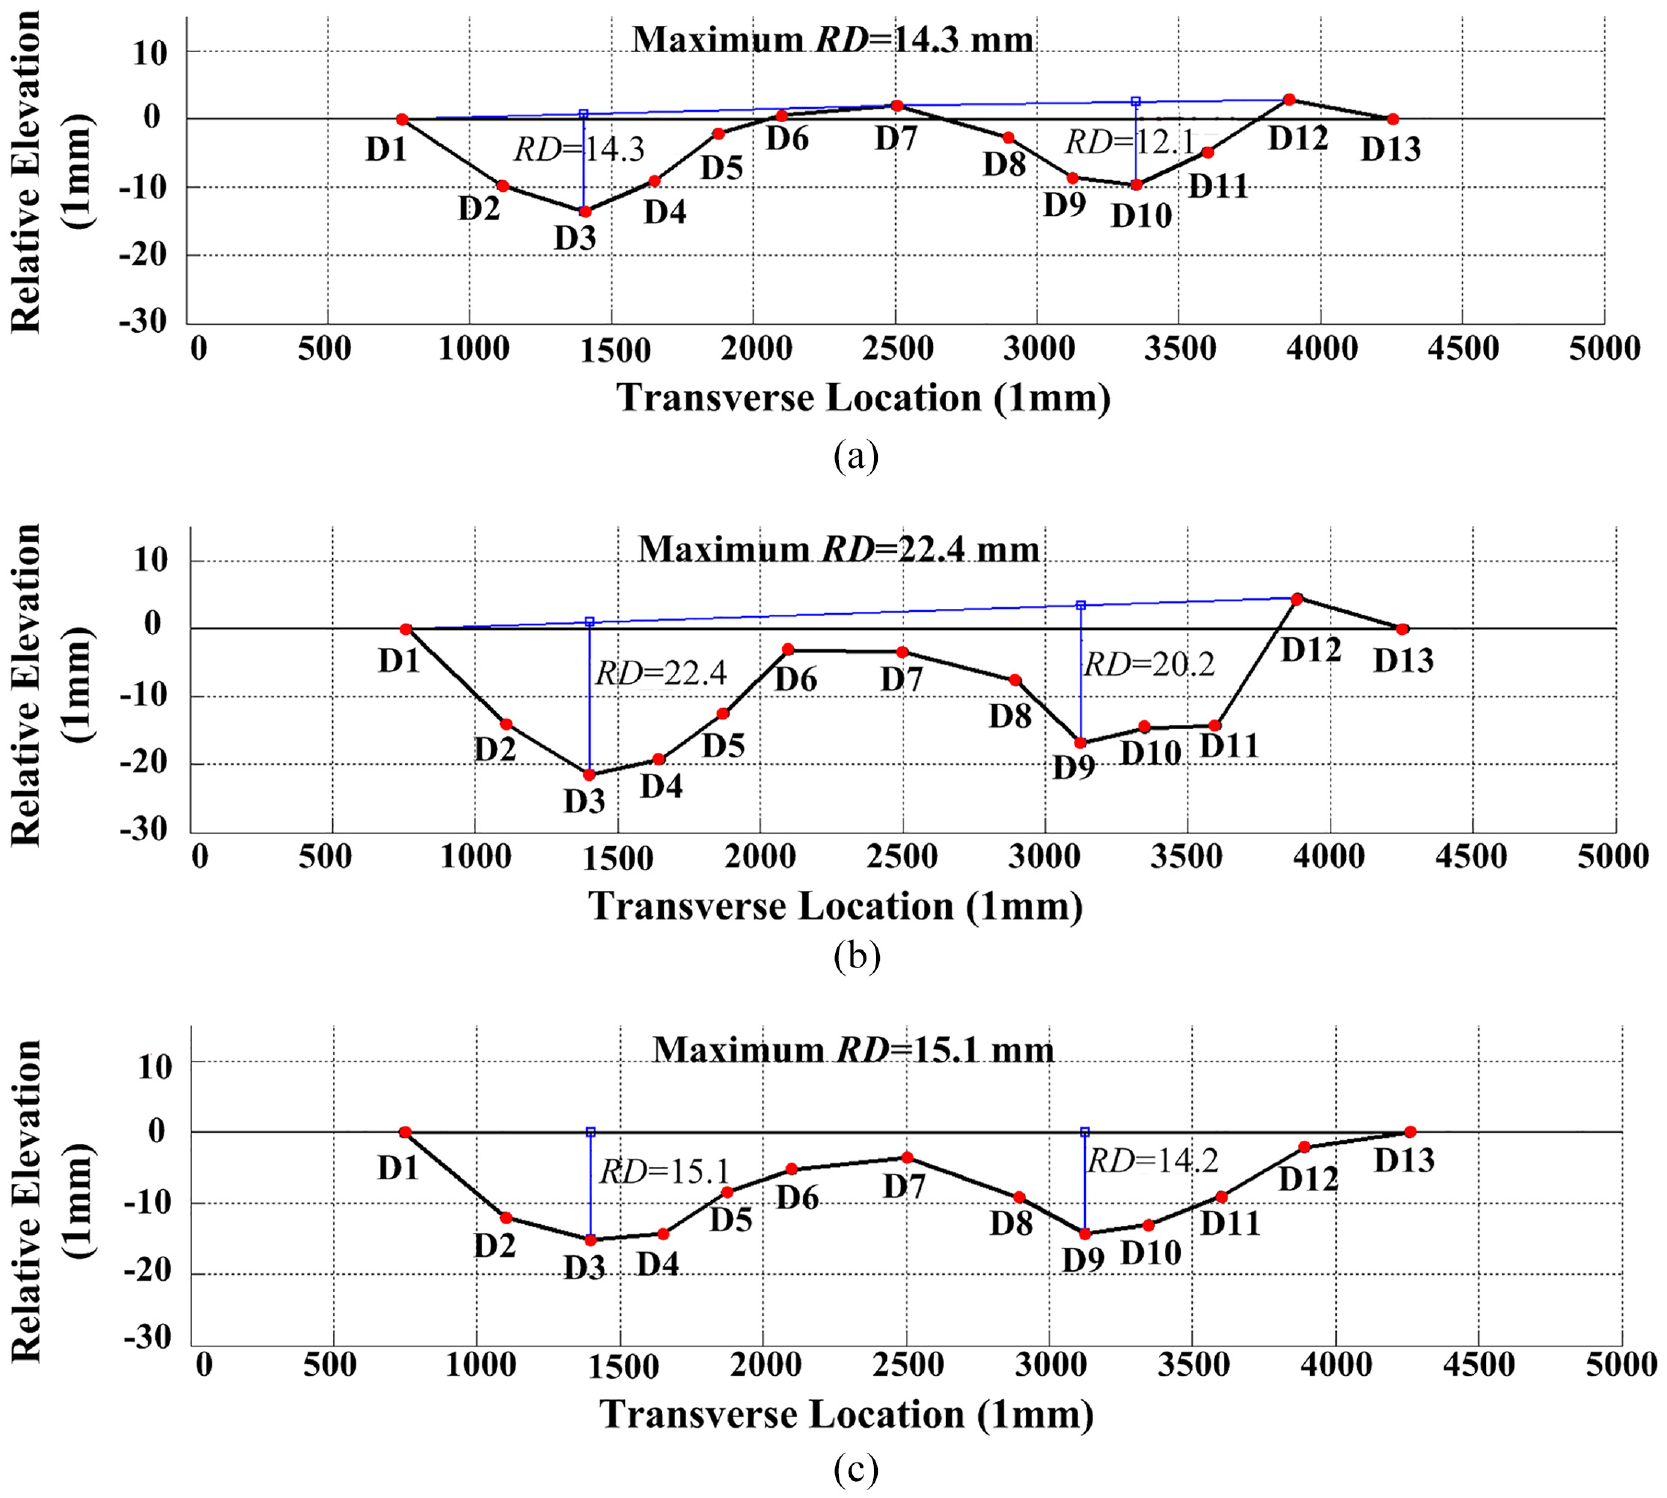
Three common rut types in China. (a) Non-symmetrical rut with central upheaval; (b) non-symmetrical rut without upheaval; and (c) symmetrical rut without upheaval.
In order to analyze the overestimation effect on rut depth, the different field profiles were divided into three homogeneous groups corresponding to Type 1, Type 2, and Type 3 rut shapes, respectively. The number of sections with a rut depth between 10 mm and 15 mm went beyond 300 for each rut type, which guaranteed a significant quantity of data for a reliable analysis.
Five different lateral offset values were associated (100, 200, 300, 400, and 500 mm) with each cross section either on the left side or on the right side of the travel direction for the three rut shapes identified in the previous research (Figure 6). In the case of Type 1 rut shape (Figure 6(a)), when the measurement was affected by an offset, d, on the left side, the right lane marking and the protruding maximum peak remained almost in the original position with respect to the measurement device. Nevertheless, the rut wire line was extended by the offset, resulting in potential overestimation of the rut depth
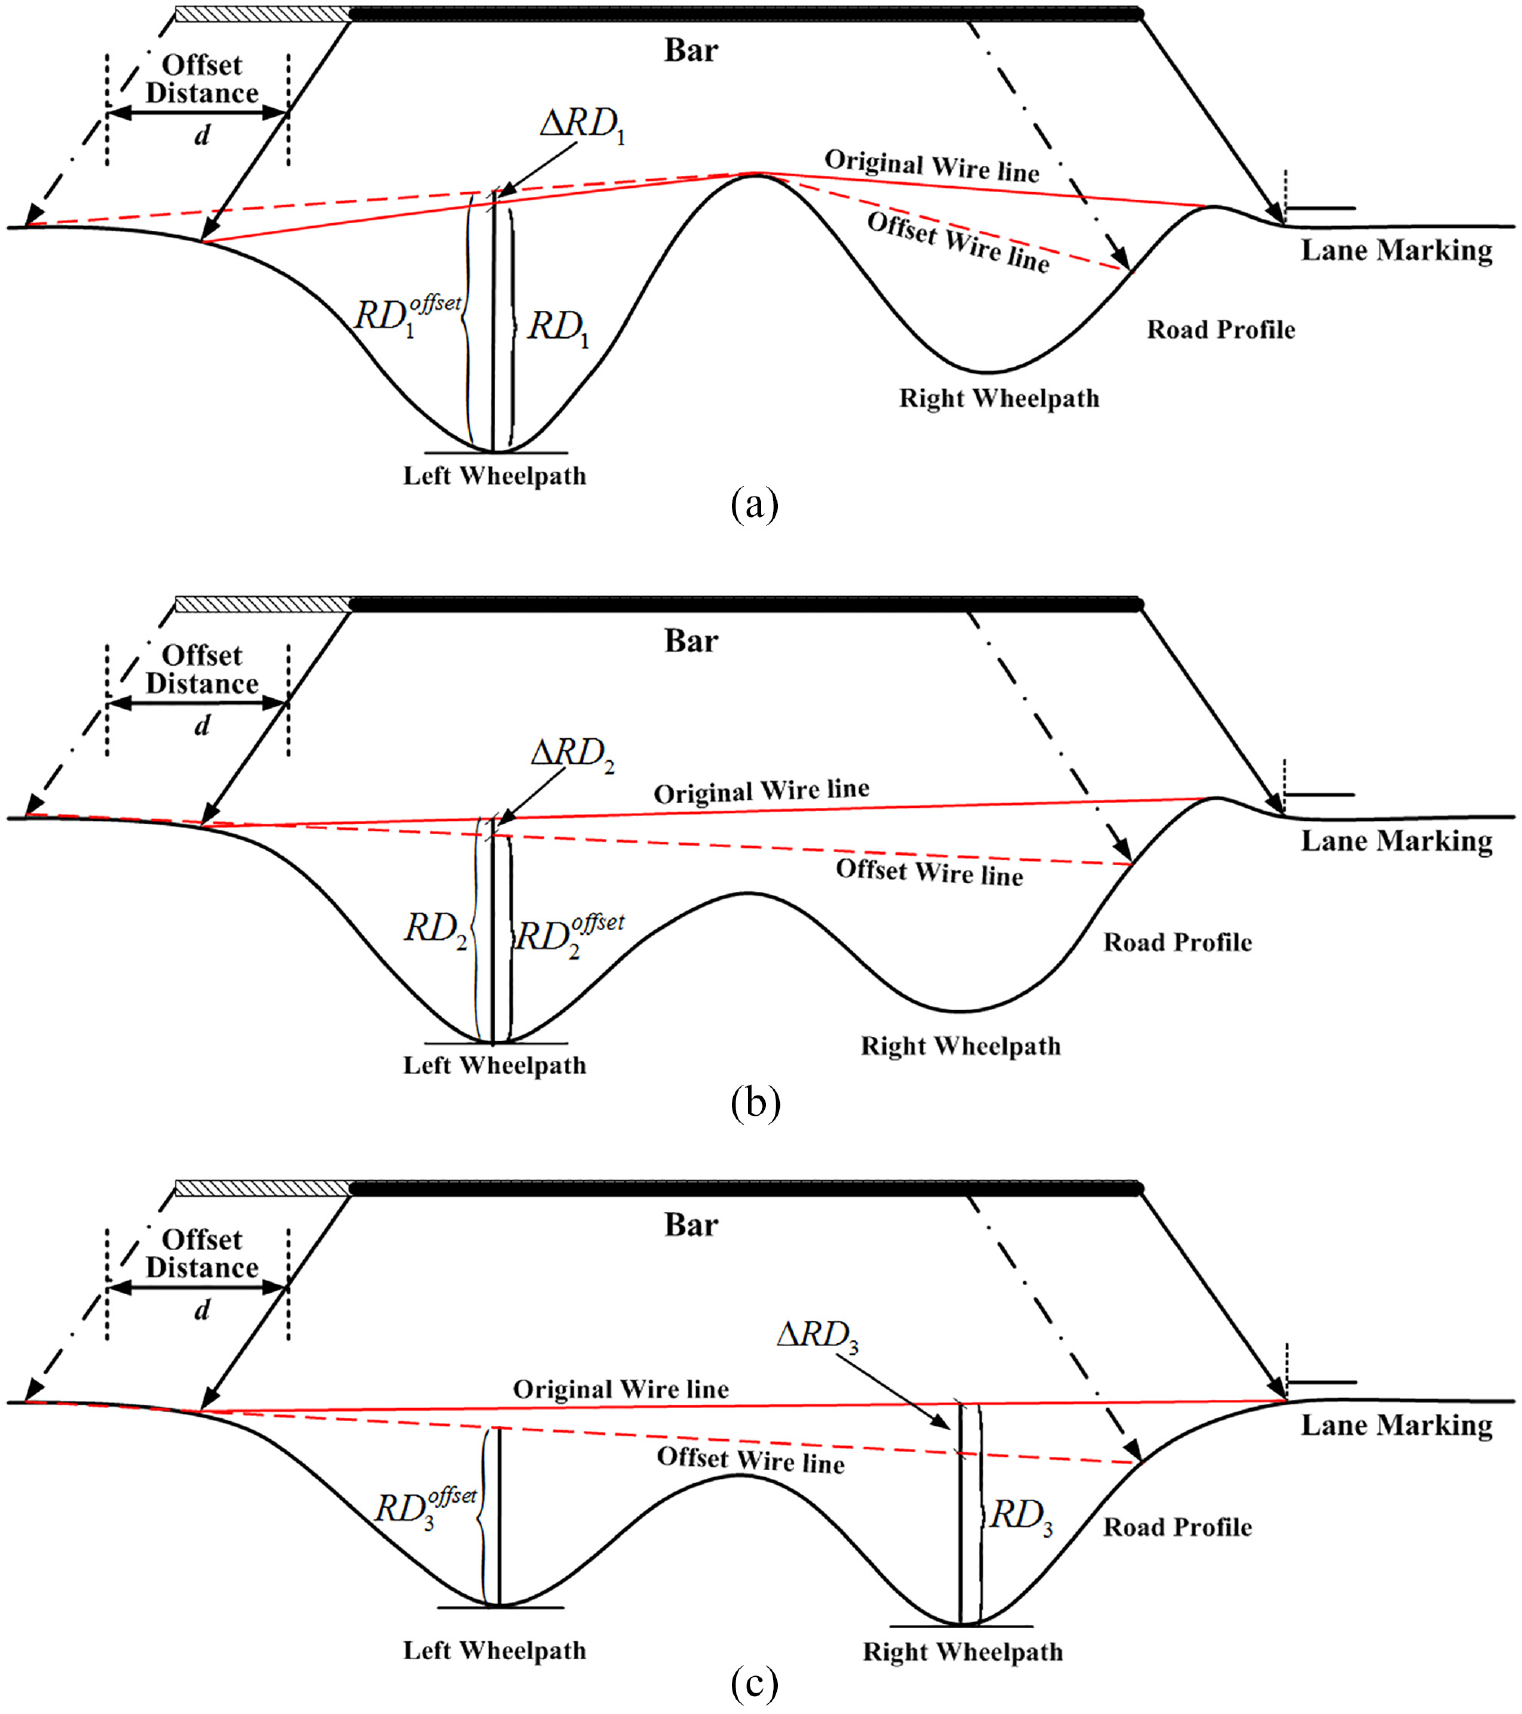
Examples of errors associated with rut depth measurements. (a) The overestimation in Type 1 rutting. (b) The underestimation in Type 2 rutting. (c) The underestimation in Type 3 rutting.
Assessment of overestimation
To investigate the impact of overestimation on the accuracy of rutting measurements, a MATLAB code was prepared to extend the analysis performed at the end of the previous section to all the three rut types for five offset distances on both lane sides: 100, 200, 300, 400, and 500 mm. A database of the results was then prepared and compared with the field rut measurements. A summary of the compared results for Type 1 rut shape was presented in Figure 7, where the two critical rut limits of 10 mm and 15 mm used in China were marked.
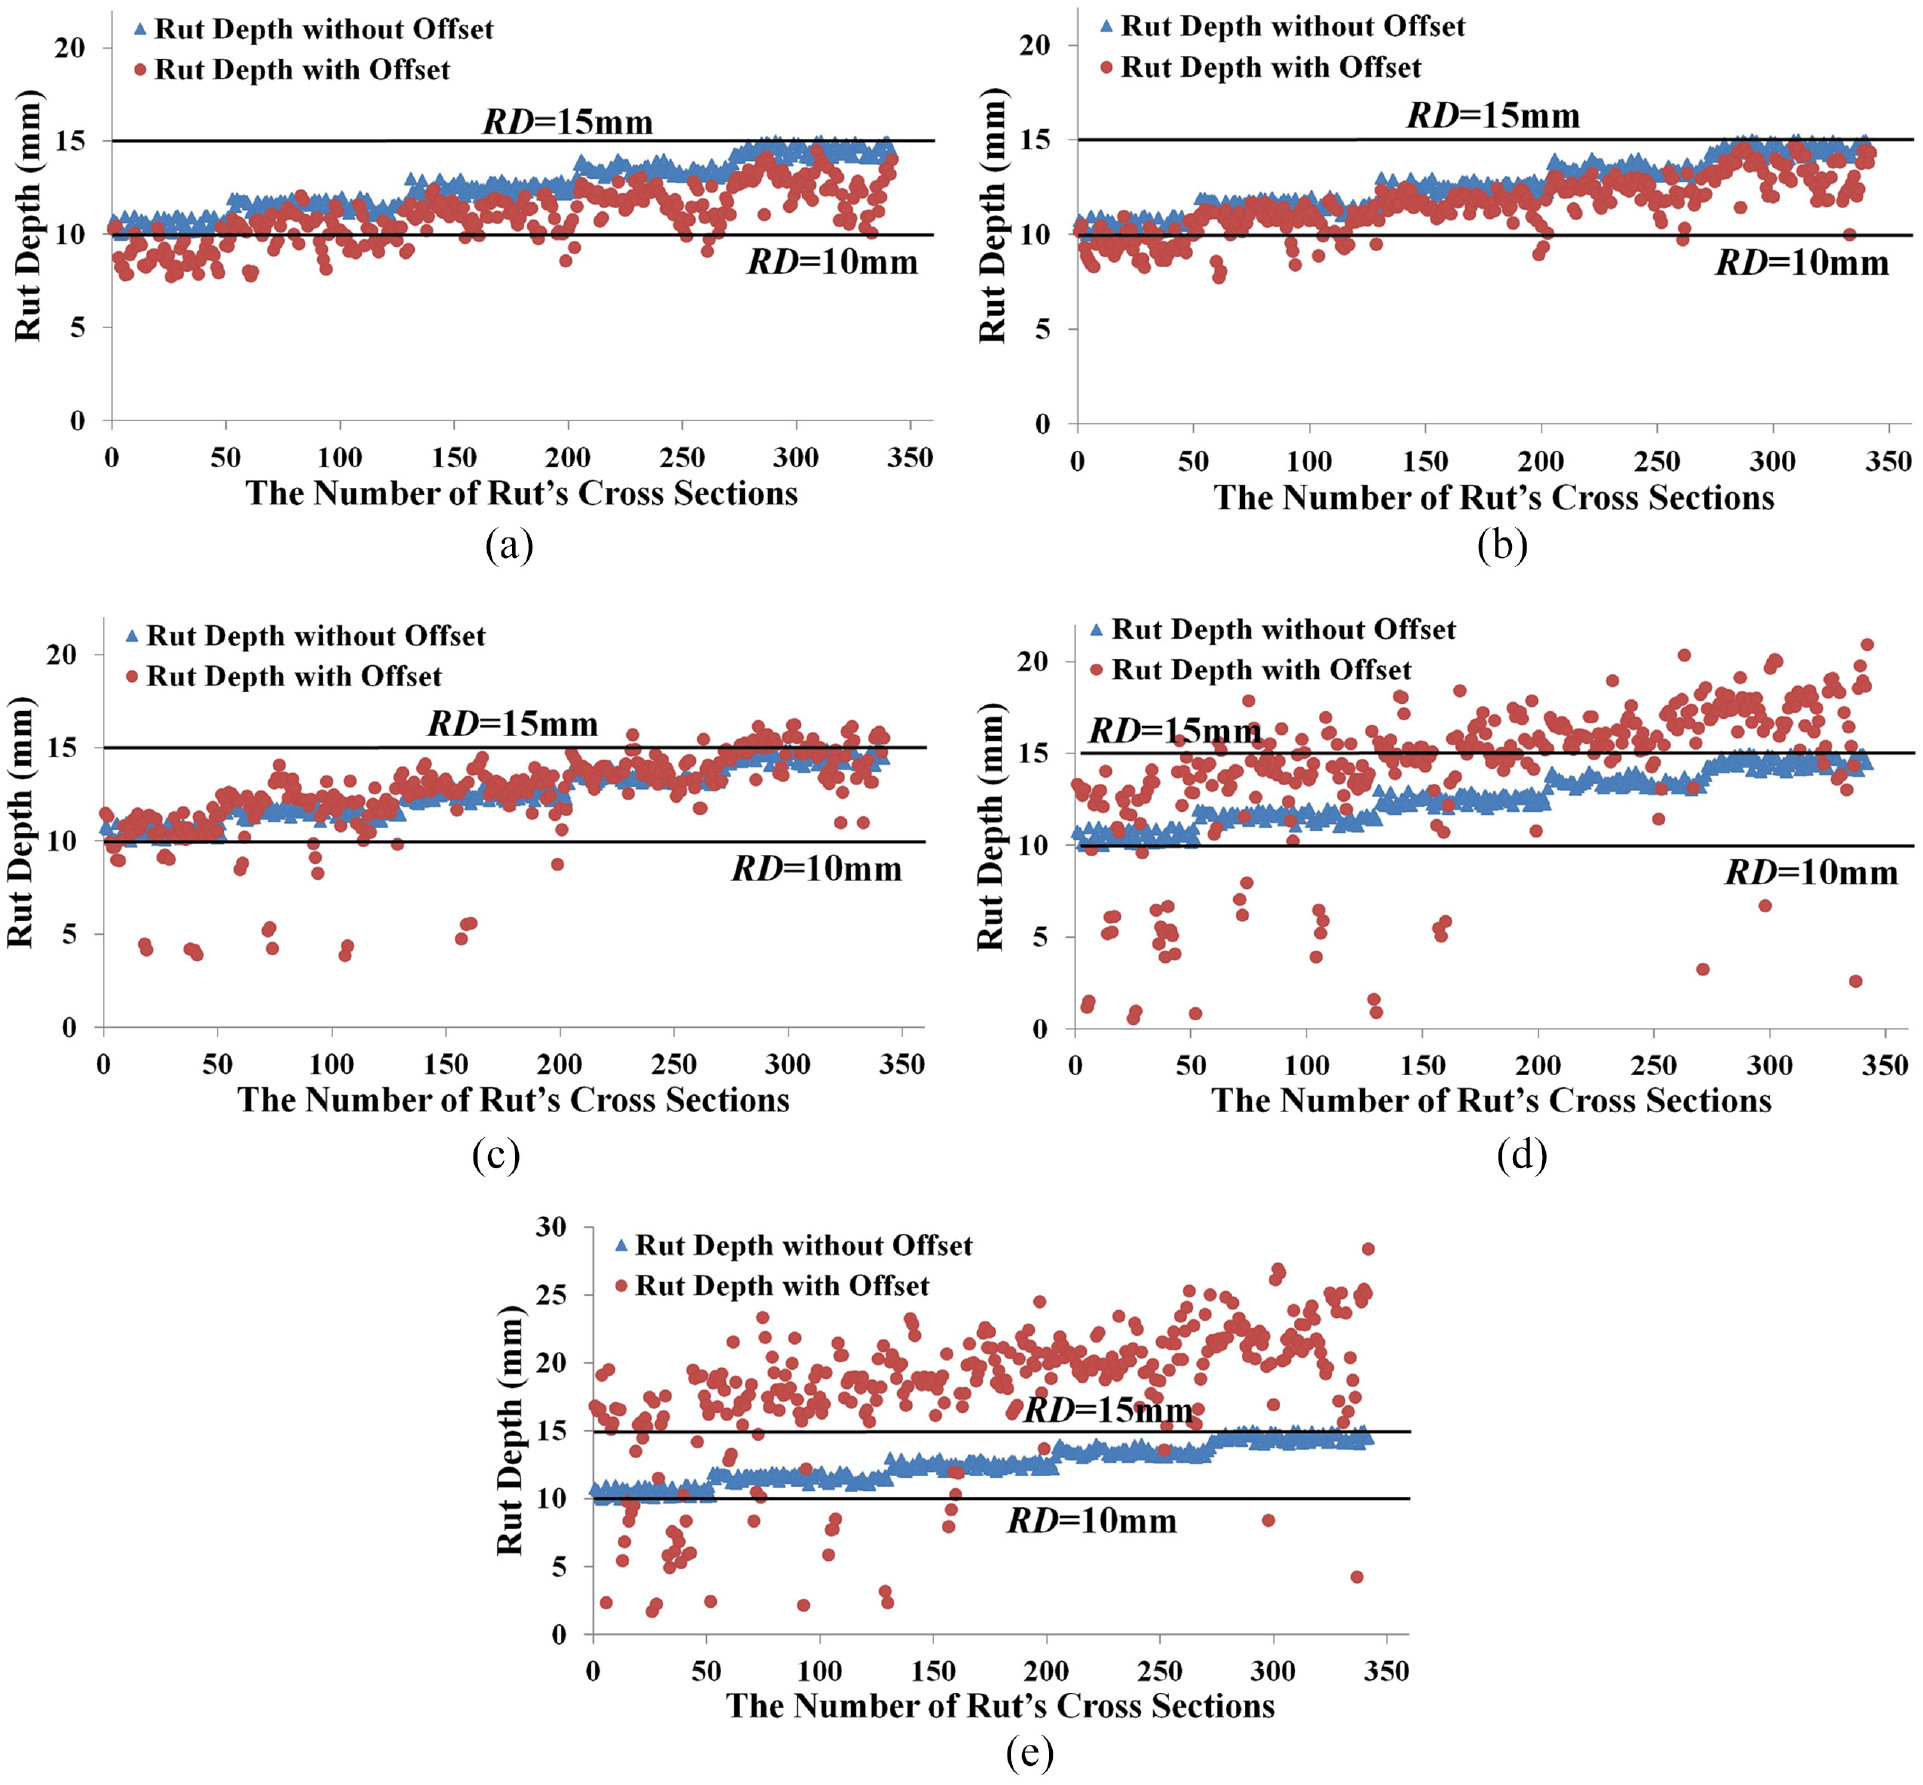
The depth before and after offset comparison in Type 1. (a) 100 mm to left, (b) 200 mm to left, (c) 300 mm to left, (d) 400 mm to left, and (e) 500 mm to left.
All the sections in Figure 7(a) and (b) displayed an underestimation trend and most of them reached the medium severity rut level after offset. In contrast, when the offset distance increased to 300 mm (Figure 7(c)), some of the sections showed a rut overestimation trend, with a dramatically higher increase in the estimated rut depth for wider offset (Figure 7(e)), leading to severely erroneous overestimations.
Discussion on the results for different rut types
In terms of rut shapes termed Types 1, 2 and 3, Figures 8 to 10 demonstrated the relative percentages of rut overestimation and underestimation in the correctly measured sections. In the horizontal axis, the positive numbers represented the offset on the left side, while the negative numbers represented the offset on the right side.
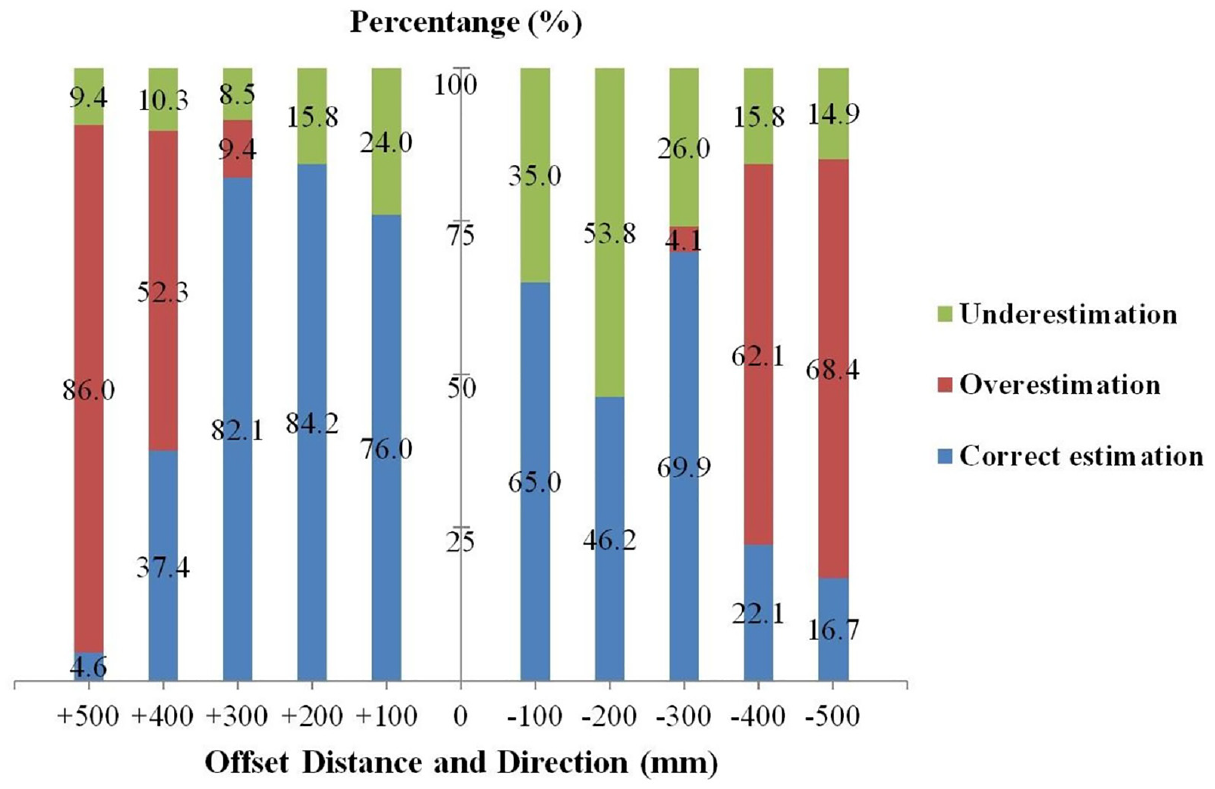
The judgment of rut shape Type 1 in different magnitudes.
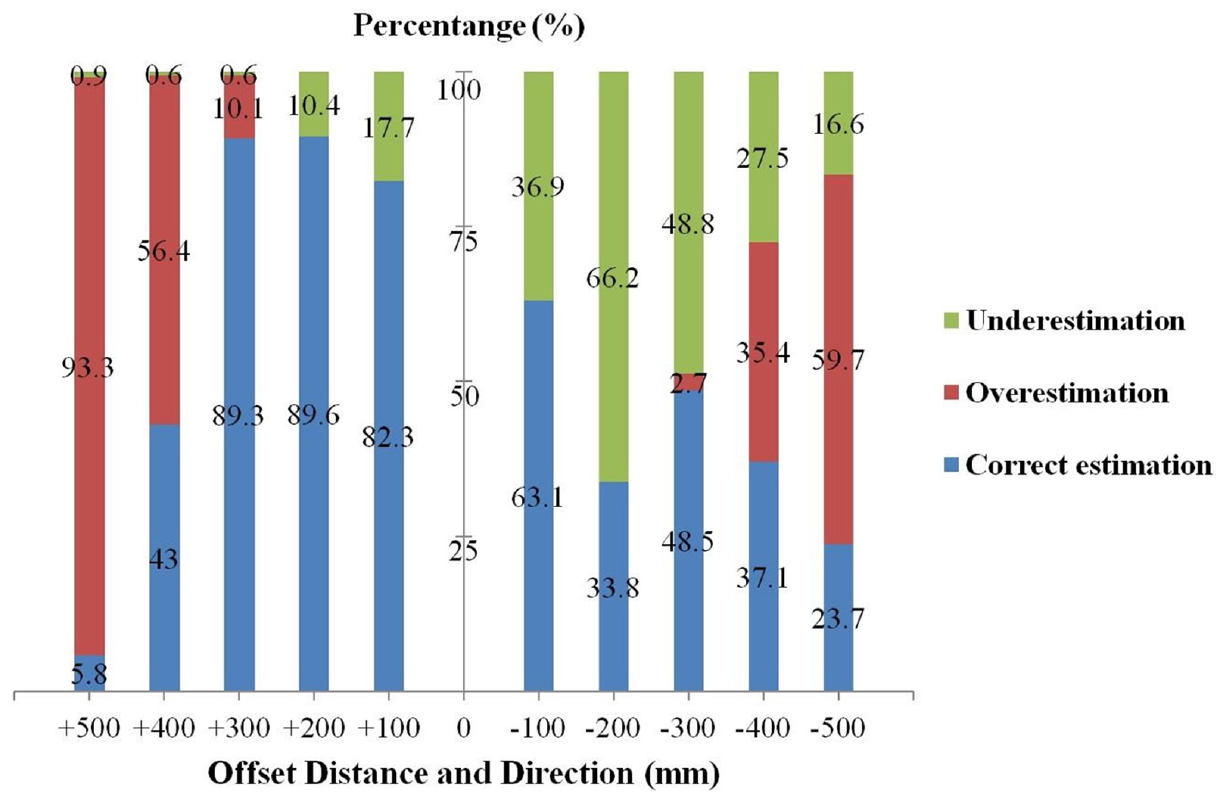
The judgment of rut shape Type 2 in different magnitudes.
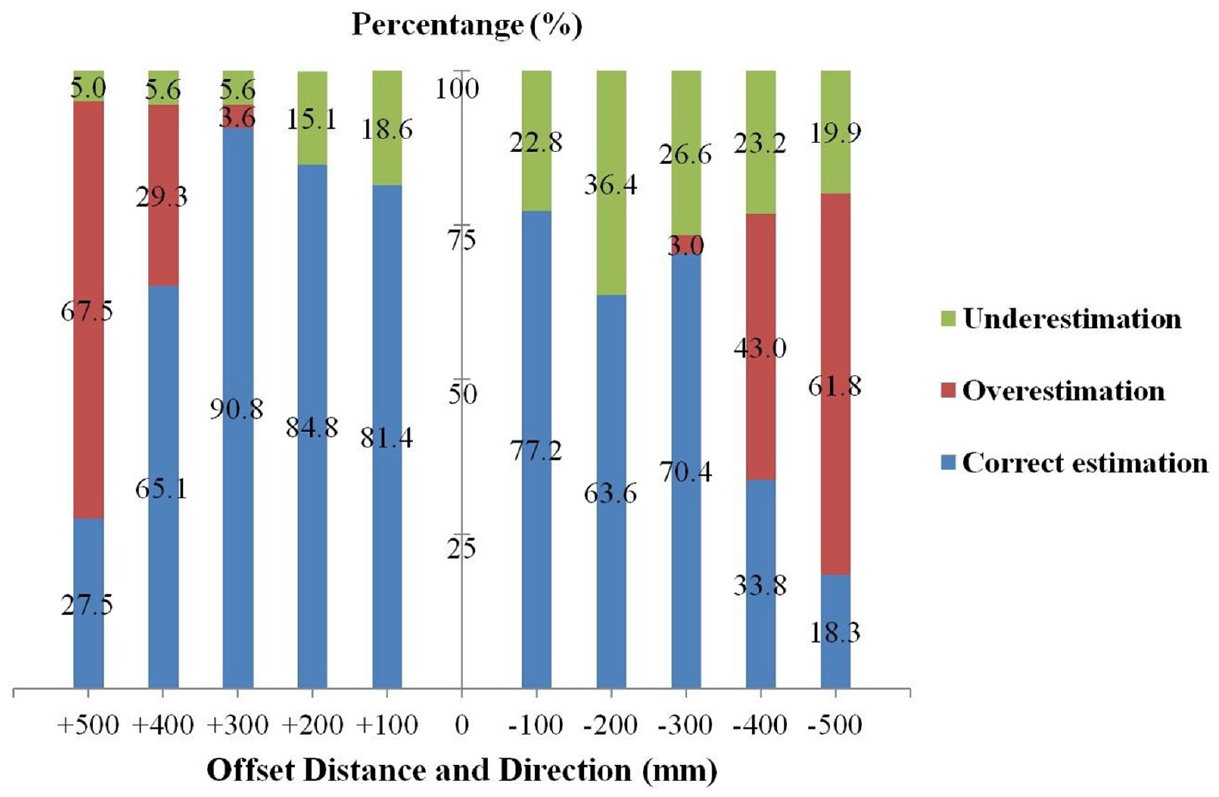
The judgment of rut shape Type 3 in different magnitudes.
The correct estimation showed a fluctuant trend in both left and right directions in all the three rut shape types. Overall, the percentage on the left side was much larger than that on the right side. In contrast, the percentage of underestimation on the left side was much smaller than that on the right side.
As previously observed, overestimation occurred only when the offset distance was larger than 300 mm on both sides, and then increased dramatically for larger offset distances. In the case of Type 1 rut shape, the percentage reached 9.4% at an offset of 300 mm on the left side and rose up to 86.0% for an offset of 500 mm. For Type 2 and Type 3 rut shapes, the maximum overestimation percentages were 93.3% and 67.5% respectively at an offset of 500 mm.
It was worth noting that, the overestimation on the left side was larger than that on the right side. Furthermore, the overestimation percentage for Type 2 profile was much larger than the other two rut shapes, which was probably due to the presence of a central upheaval in the profile of Type 1 and Type 3. As a result, this peculiar characteristic represented a dominant factor which affected the rut depth measurement accuracy and reduced the error.
Validation of overestimation
Due to the small size of the field detection rut samples, only three rut shapes termed Type 1, 2, and 3 were analyzed above, which was not enough to reflect the pattern of offset overestimation caused by the seven common rut shapes in China. This section would validate the reliability of lateral offset overestimation under more rut cross-sections through the study of simulated rut shapes. If the offset error value of the simulated rut fell within the offset error range of the real rut, it was considered that the error analysis of the simulated rutting caused by the lateral offset of the vehicle was reliable.
Rut shape Type 1 was chosen as an example for analysis. The offset error of simulated rut shape Type 1 was calculated under different offset conditions and different depth conditions. The results were listed in Table 3. The leftmost column in Table 3 represented the rut depth distribution interval. The first row indicated the offset distance and direction. As mentioned above, the symbol was “+” when offset occurred on the left side, while the symbol was “−” when offset occurred on the right side. The offset distances were defined as 100, 200, 300, 400, and 500 mm, respectively.
Offset error of simulated rut Type 1 (unit: mm).
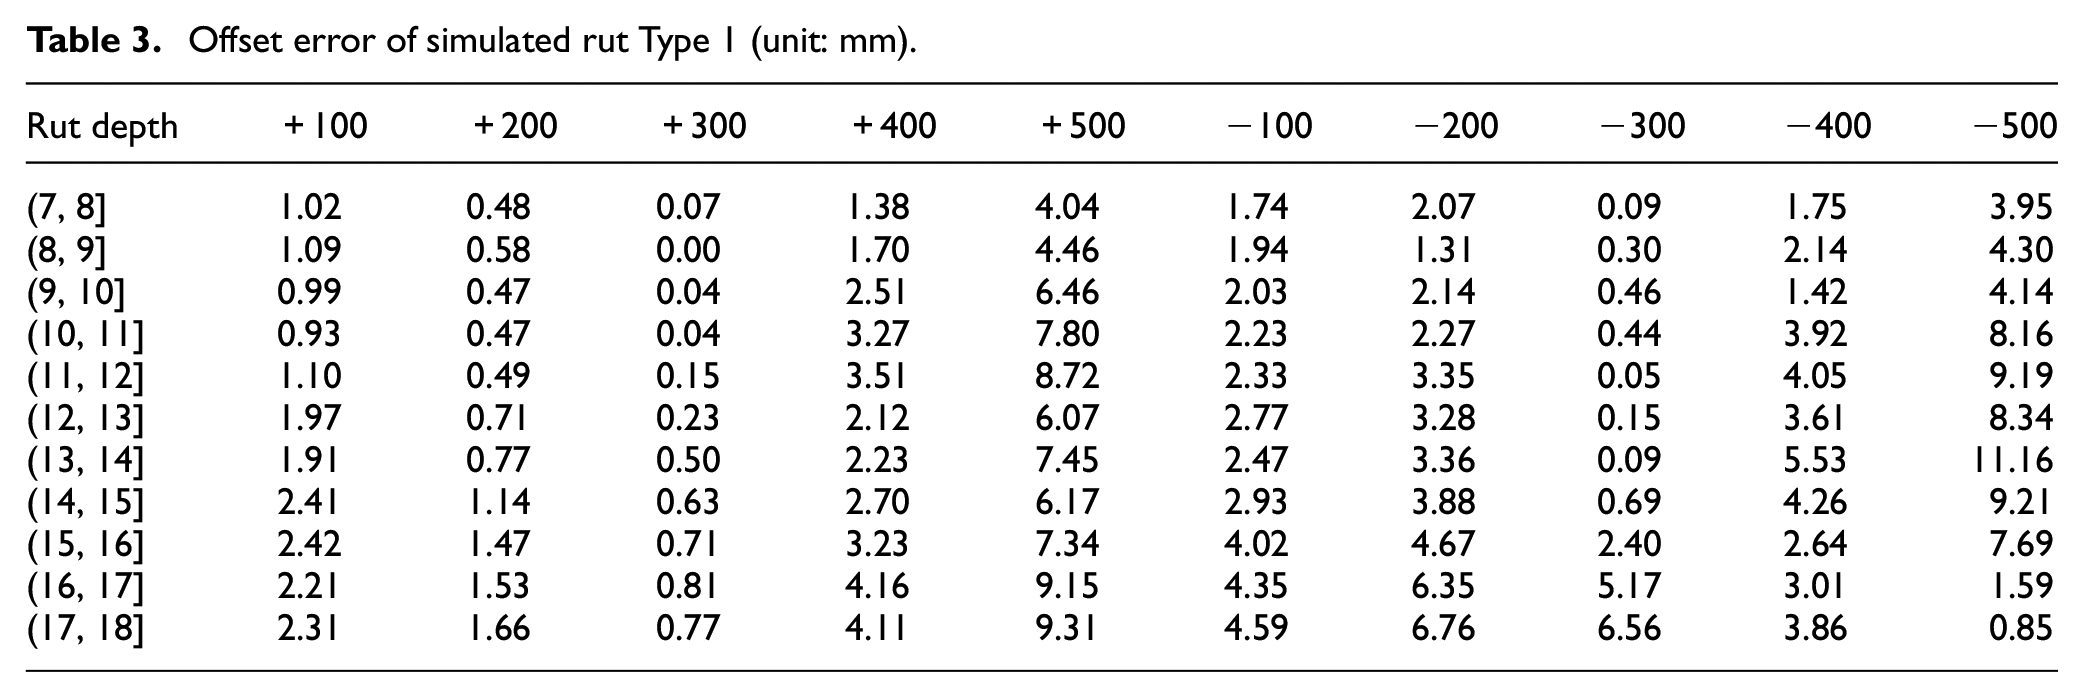
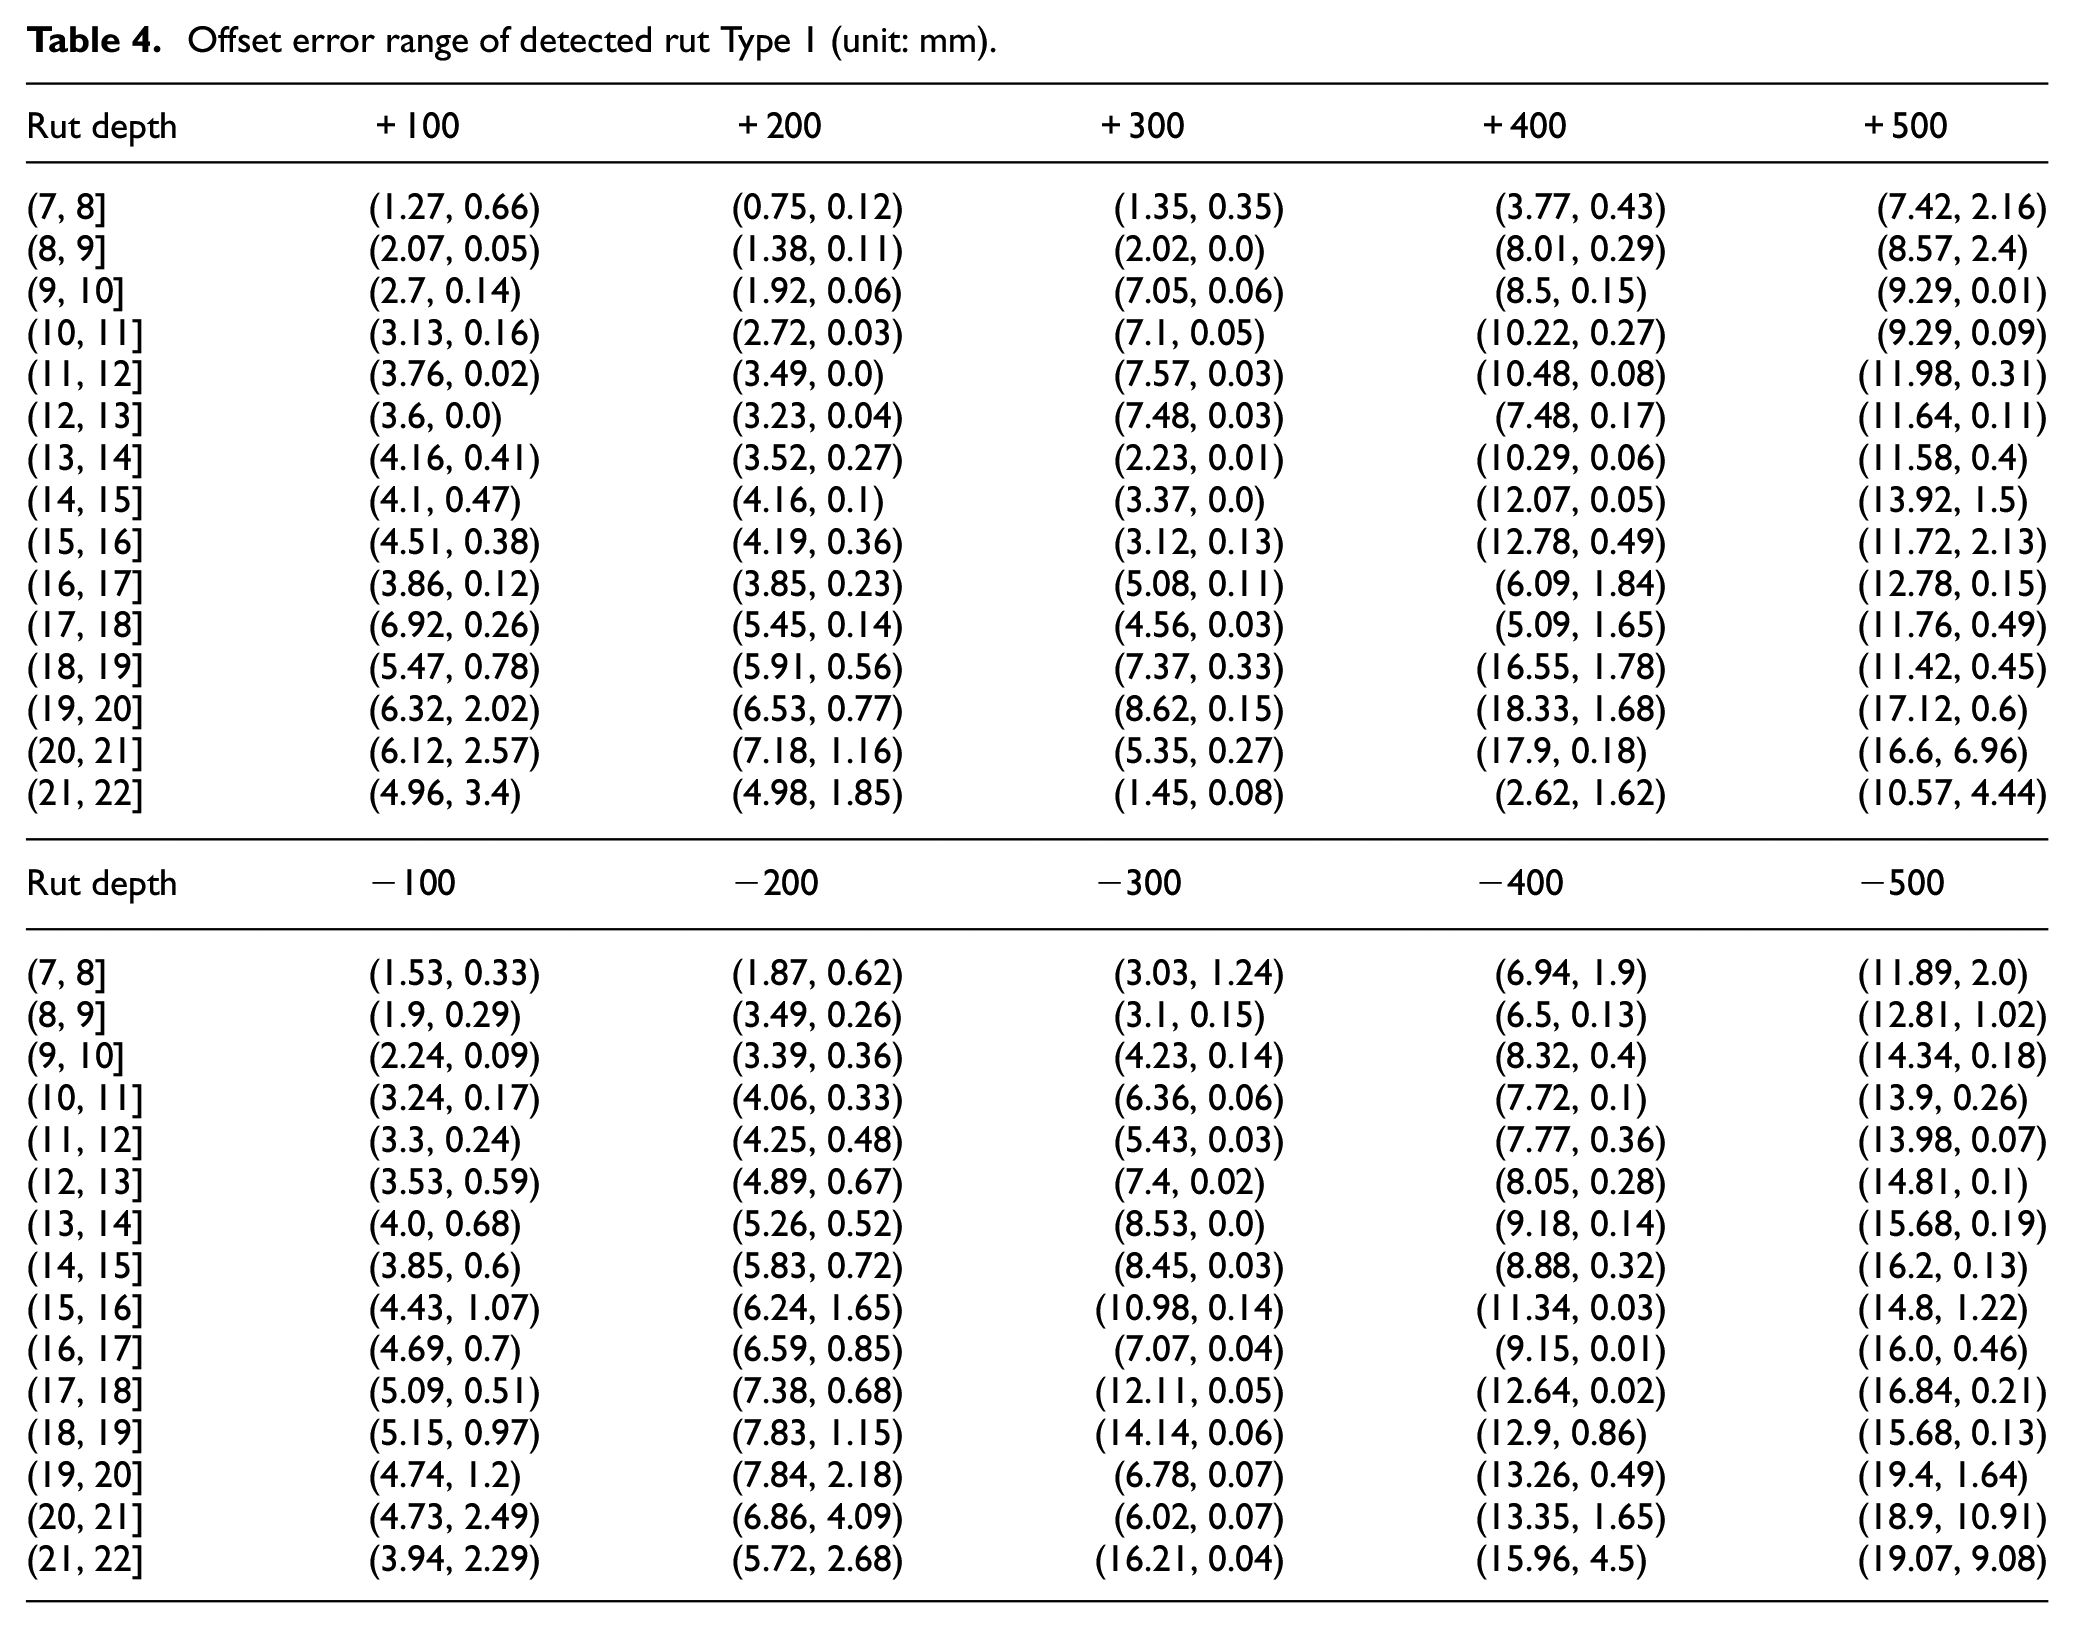
The offset error range of detected rut Type 1 under different offset conditions was shown in Table 4. The error values of most simulated rut shapes fell within the error range of the detected rut, closer to the offset error lower limit of the detected rut. Further observation found that the changing trend of simulated offset errors with the rut depth was similar to the trend of the average value of the detected rut. Therefore, the simulated rut was reliable and could reflect the error change pattern under different offset conditions. Using the same method, the other seven rut shapes were simulated, whose errors were also within the range.
Offset error range of detected rut Type 1 (unit: mm).
Implementation of an error judgment parameter, E, for M&R determination
In this section, a new parameter named error judgment, E, was introduced for discriminating the pavement sections which required M&R. This parameter was defined according to the following equation and was specific for each offset distance:
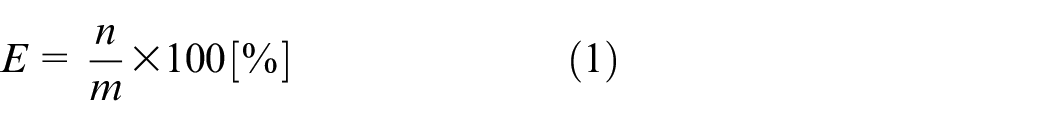
where,
n = the number of sections which were above 15 mm after offset,
m = the number of sections which were above 15 mm before offset.
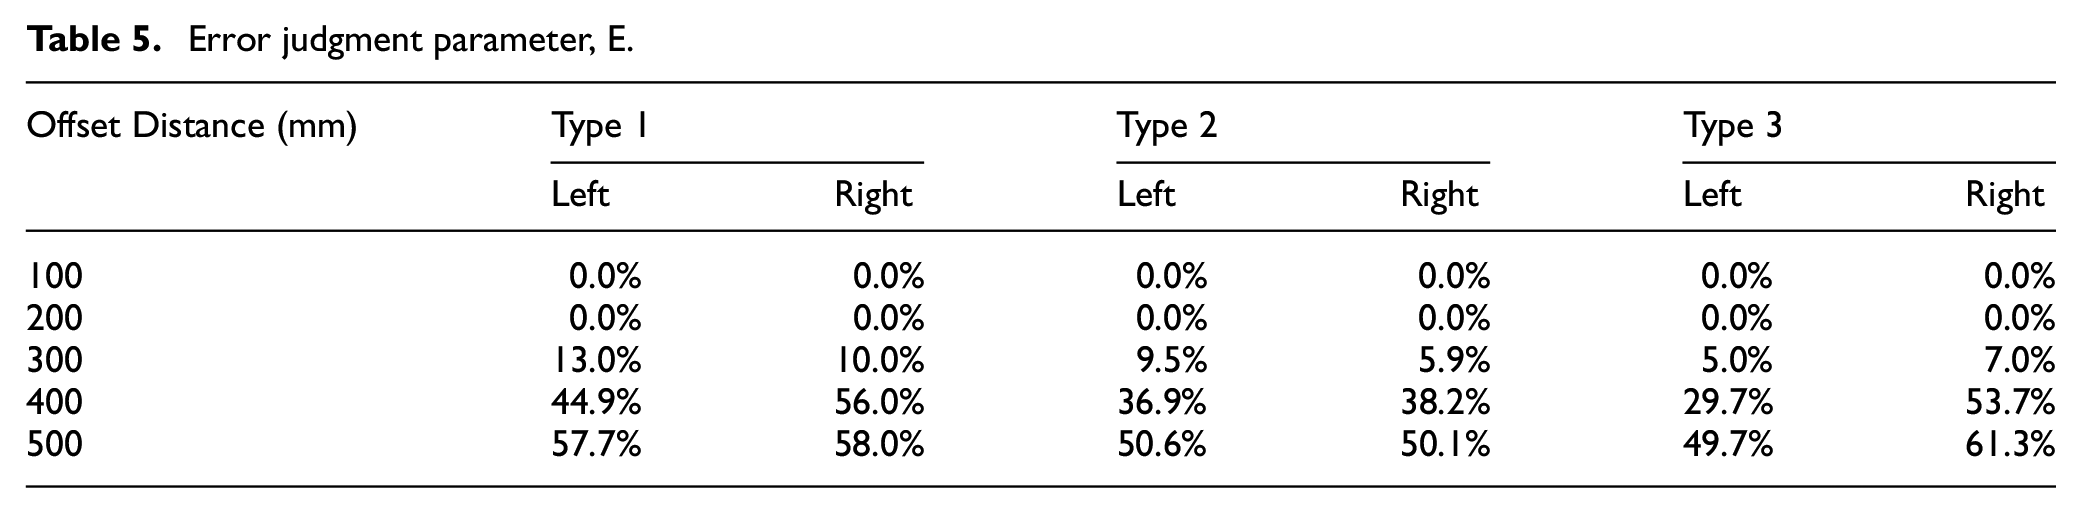
Based on the data set used in this study, when the offset distance was below 200 mm, E = 0% which meant none of the sections displayed rut overestimation. The maximum E for an offset of 300 mm was 13.0%, which significantly increased for larger offsets across the three types of rut shapes investigated: E = 56.0% and 61.3% for d = 400 mm and 500 mm, respectively (Table 5). A small error judgment parameter represented a compromise between the efficiency of rut estimation and the wise allocation of M&R funding. Accepting larger offset would imply higher E values, thereby resulting in unnecessarily anticipated M&R actions and causing a depauperation of very limited public funding available for road infrastructure. Therefore, the maximum admissible offset distance for rut measurements required to be limited to d = 300 m.
Error judgment parameter, E.
Summary and conclusions
The following conclusions can be drawn:
1) Based on the actual transverse profiles derived by a 13-point laser bar, the overestimation can be observed only at an offset distance lager than 300 mm. The maximum percentage of overestimation can be as high as 86.0%, 93.3%, and 67.5% for rut Types 1, 2, and 3, respectively at a large offset distance of 500 mm. Larger overestimation occurs for the left offset and increases as the offset grows.
2) The shape of the rut profile strongly affects the accuracy of rut measurement; the presence of a central upheaval is a dominant factor which reduces the error parameter E.
3) The error judgment parameter E strongly depends on the offset distance, reaching E = 13.0% at an offset distance of 300 mm. This represents a reasonable value for M&R decisions and should be proposed as a practical offset limit for measuring rut depth with automated instrumentation.
Recommendations for future research:
1) Additional actual transverse profiles derived from 13-point laser bars with different rut shapes and severity levels should be further analyzed using the proposed vehicle wandering simulation method to quantify the potential errors and further understand the impact of rut shape on rut depth measurement error in case of vehicle wandering.
2) This paper compares the overestimation of rut depth caused by the offset of the 13-point laser detection vehicle. Other methods also should be adopted, such as computer vision methods using cellular phones for example, imaging techniques, ANNW, and AI. These new detection methods need further comparison and the research results need analyzing accordingly.
Footnotes
Declaration of conflicting interests
The author(s) declared no potential conflicts of interest with respect to the research, authorship, and/or publication of this article.
Funding
The author(s) disclosed receipt of the following financial support for the research, authorship, and/or publication of this article: This paper has been sponsored by the National Key R&D Program of China (No. 2021YFB2601000), the National Science Foundation of China (No. 52178409), the Inner Mongolia Transportation Research Project (No. NJ-2021-17), Natural Science Foundation of Shaanxi Province (No. 2022JQ-547, 2022JQ-535), and the Fundamental Research Funds for the Central Universities, CHD (No. 300102212210). Their support and assistance are gratefully acknowledged.
Data Availability
The data used to support the findings of this study are included within the paper.