
Abstract
Highway access points are places where motor vehicles turn off the roadway onto arterial roads. Numerous conflict points exist at highway access points as a result of access and through traffic. Higher speeds and lateral offset variation cause greater risk of potential crashes. This research aimed to formulate a new method of access weight calculation that would show the speed and lateral offset variation characteristics of various access types under the same traffic conditions. Seven access types commonly found on highways in China were considered and analyzed for their safety performance. Data for a vehicle’s lateral offset, speed, acceleration, and deceleration rate were collected by means of a driving simulation method. Both field tests and simulation tests were compared to validate the accuracy of the simulation results from the viewpoint of vehicle speed and trajectory. Finally, access density, derived from the proposed access weighting model, was analyzed and correlated with crash rates on National Highway G205 (South Nanjing section). Spearman correlation results showed that the access rated crash rates have a high correlation. The proposed access weight calculation method shows promise for its application in safety evaluation, access design, and reconstruction.
Introduction
A highway access point is defined as an intersection, driveway, or opening on either side of a roadway. 1 These access points are places where access traffic and through traffic mingle together and greatly influence the safety performance of traffic on arterial roads. Statistical analyses have shown that a lack of highway access management, such as high access density and inappropriate access design, has a positive correlation with increased access-related crashes and low-level traffic efficiency. Xie and Wang 2 considered the spatial correlation between intersections when establishing an intersection accident analysis model for access safety evaluation. The factors that affected access safety were ranked as average daily traffic (ADT), intersection type, intersection spacing, and so on. Dissanayake and Lu 3 found that by converting a full median opening into a directional median opening, a significant reduction occurred in weighted average delay was experienced by left-turning vehicles, whereas the total travel time remained unaffected. Wang 4 explored the relationship between highway access types and the preponderance of access-related traffic accidents and found that median openings with directional control could greatly improve the safety performance at cross intersections. Malik 5 found that driveways with direct access created operational as well as safety concerns for both mainline and driveway traffic. For mid-block sites, left-turn in/out restriction is recommended when the mainline volume is increased beyond 1500 vph. Access weight is the basic index for safety evaluation, and many previous studies had tried to quantify the access weights using different methods. Saxena 6 assigned weights to each highway access type, taking into consideration the various conflict types. The standardized total number of conflicts for each access type was used as the weighted value. Huang 7 proposed an access weighting model based on traffic speed variations using a microscopic traffic simulation software package, Traffic Software Integrated System-Corridor Simulation (TSIS-CORSIM). The main concerns of the access weight model were that even if speed standard deviations (SSDs) are the same, the crash risks should not be the same for different average speeds, and that any access weight model that does not account for the number of vehicles turning off and onto the arterial road could be flawed.
In addition to traffic vibrations at access points that affect access safety,8,9 crash rates were observed to be highly correlated with traffic lateral offset variation.10,11 Verster and Roth 12 used the standard deviation of the lateral position as an indicator of lateral trajectory control or the amount of “weaving” of the car. Classen 13 explored the driving performance of people from different age groups in various highway access types. The results showed that mutual interaction exists between the transverse and longitudinal speed decelerations. This is because drivers were able to gain greater control over the vehicle’s lateral offset with a decelerated driving speed.
The driving simulation was able to run in a simulated traffic environment with a high degree of practicality. It has been widely used for safety evaluation of road designs by analyzing the real-time driving performance of drivers. Yan et al. 14 validated that a high-fidelity driving simulator is an accurate and reliable method for traffic safety evaluation at signalized intersections. The experimental results indicated that the mean speed obtained from simulator tests was insubstantial agreement with field tests and that both displayed a normal distribution. Stine 15 used the driving simulator for highway median designs, and vehicle trajectory data were obtained through driving simulations. The research results indicated that the cross-sectional geometry of median had a relationship with the frequency of access-related crashes. Rosey et al. 16 used the driving simulator INRETS-MSISSIM2 to conduct a trajectory comparison between the driving simulator and field experiments. The simulator was able to obtain the lateral positioning data in a more convenient way than field experiments, which require high-quality sensors. Godley et al. 17 used an advanced driving simulator to evaluate the driving behaviors of different speeding countermeasures installed at highway access points. The mean speed of each measurement was collected and validated that both the field test and the simulator experiments showed significant canonical correlation.
This article presents a new access weight calculation method based on the combined analysis of speed and lateral offset variation. A driving simulator was used to obtain data with high reliability. The structure of this article is as follows: section “Methodology” shows traffic speed and lateral offset variation phenomena observed in the driving simulation and proposes a methodology for computing access weight; section “Experimental data” presents the experimental data and the validation of field and simulation tests; section “Correlation between access weight and crash rates: a case study” describes the correlation analysis of the proposed access weight and crash rates; and conclusions and suggestions are given in section “Conclusion and suggestions.”
Methodology
Speed coefficient of variation
Washington et al. 18 pointed out that the SSD is a measure reflecting the absolute value of the speed dispersion; the higher the SSD, the greater the risks. However, this value neglects the numerical magnitude of the speed sample, which means that even if SSDs are the same, the crash risks should not be the same for different average speeds. Sometimes, a relative measure that takes into account not only the speed dispersion but also the magnitude of the speed samples is needed. The speed coefficient of variation (SCV) meets this requirement because it is the ratio of SSD to the mean value of the speed sample. As an example, if the average speeds for two sites are 100 and 50 km/h and both sites have SSDs of 10 km/h, the calculated SCV values of the two sites are 0.1 and 0.2, respectively. The latter value is larger than the former because of a larger variation in the data, implying greater risk. Thus, in this study, use was made of SCV values to speculate about the speed performance of different access types more accurately, taking the T intersection with median opening (Type 3, Table 1) as an example.
Seven access types used for obtaining theoretical access weights.

In Figure 1, the lower red line describes the distribution of SCV values along the road section with special access types. It shows that the largest value of SCV exists in the middle of the road section, which is the access point of the driveway and indicates the greatest risk. The upper blue line represents the mean speed at each detected spot site. The measure of speed kurtosis was obtained from the mean speed distribution, which described the steep degree of the curve. Washington et al. 18 pointed out that if the kurtosis is zero, the traffic speed has a normal distribution over a certain distance; if the kurtosis is greater than zero, the speed distribution is steeper than the normal distribution; and if it is less than zero, the speed distribution is flatter than the normal distribution. It is worth pointing out that the speed data shown in Figure 1 were obtained from the simulation results with an input arterial traffic volume of 1200 vph.

SCV of T intersection performance at a high turning percent level.
Lateral offset deviation
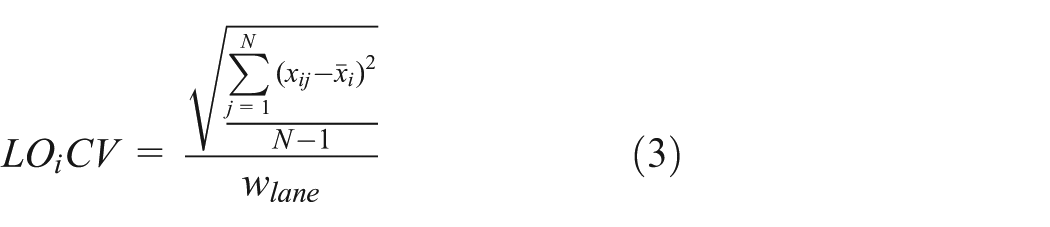
The same theory could be used in the description of lateral offset vibrations. The lateral offset deviation behavior of access Type 3 in Table 1 is shown in Figure 2. The upper blue line represents the mean lateral offset of each detected spot site i. Under the condition of high turning percent, the Kurt value (Appendix 1) of a T intersection with median opening (Type 3, Table 1) is 1.08, which is lower than the value of 1.27 at a low turning percent. This may be because at the center of the access point, the traveling speed is lower and the driver can better control the turning of the vehicle to avoid traffic conflicts. The lower red line represents the lateral offset coefficient of variation (LOCV) and shows that the center of the access point had the highest value of LOCV.

LOCV of T intersection at a high-level turning percent traffic volume.
Access weight calculation
In this study, access weight is defined taking into consideration both the vehicle speed and the lateral offset variations in the nearby access point. The hypothesis is that the greater the traffic speed and lateral offset variations at spot sites, the greater the potential risk. On the other hand, the greater the traffic speed and lateral offset differences between two adjacent points, the greater the exposure to danger. The recommended method of weight calculation is as follows

where


And AW represents the access weight, N the total number of simulation times, M the total number of spot sites around the highway access point,
Experimental data
Driving simulation procedure
UC-win/Road driving simulator
In this study, the UC-win/Road simulation software was used to measure traffic speeds and lateral offset variations. This driving simulator is composed of basic hardware and the new generation of UC-win/Road software provided by FORUM 8 Co., Ltd. The driver controls the car using a steering wheel with force feedback, automatic gear, and brake and accelerator pedals. The animated driving scene, which responds dynamically to all the driver’s commands, is projected onto three screens with a 135° wide-angle field of view. The measurements were continuously recorded with a sampling frequency of 20 Hz. The great advantage in using the UC-win/Road simulation software lies in the fact that it has a good compatibility with the AutoCAD civil 3D software. Three-dimensional (3D) road constructions used by road bureaus can be loaded into the software for driving simulations, which saves a great deal of time in building road scenes in the simulation software. Driving simulation apparatus and simulation scene are shown in Figure 3.

Driving simulation apparatus and simulation scene.
Participants
Before beginning the driving test study, 16 participants holding a Chinese driving license above grade C for more than 3 years were recruited in the preliminary selection step. In the subsequent selection process, each participant was required to fill out a questionnaire about their health condition, age, job description, education level, annual driving distance, and crash experiences. Ten participants within the age range of 23–48 (average 31) years who had no crash record in the previous 2 years were chosen from among these. These comprised five males and five females, to ensure gender balance. According to the questionnaire details, all of them were in good health and met the requirement of average annual driven distance of more than 4500 km.
Each participant was instructed on both the driving simulation requirements and the details of the driving test procedure when they arrived at the simulation laboratory. The participants were each given 20 min to drive in the simulated highway environment as a learning process. There is no standard definition of sample size, with sizes of 5, 10, 20, and 50 all being acceptable; therefore, in order to shorten the length of the simulation procedure and also to eliminate errors trigged by different drivers’ driving habits, and thus increase the accuracy of the data, the sample size of each scenario was fixed at 10.
Scenarios
Based on investigations of traffic in the field, seven access types commonly found on the national highways of China were considered in this study (Table 1). Of all these access types, Types 1–3 and Type 6 are frequently found at highway in rural areas, and Type 5 with lane channeling is common at newly built roadway in suburban and urban areas. The simulation procedure had two stages. First, each participant drove in seven different access scenes that each had one special access type. The length of arterial road in the driving scene was 1 km, with an access point in the middle. The cross section of the arterial was a dual carriageway with two lanes (each 3.6 m wide) and the access driveway was a two-lane road (3.3 m wide) without a central median. Second, each participant drove through two-road section scenarios with different combinations of access types: one was Songze Avenue in Shanghai and the other was National Highway G205 (South Nanjing section).
After the scenes had been modeled using UC-win/Road simulation software, the initial setting of the traffic environment was conducted. According to the ADT volume statistics of highway trunk roads in Jiangsu Province, China (2011–2013), the main road traffic volume was set at 1200 vph in each direction and the traffic volume of the access driveway was set at 300 vph. Traffic volume turning percentage at access points was also considered in initial setting. The Highway Capacity Manual 1 points out that if the left-turning movements on any access approach exceed 20% of the total volume of driveway, it is recommended that the left turns on that approach be protected. Highway access delays can be reduced proportionally when the left- and right-turn percentages are less than 10%. In order to simplify the traffic simulation procedure, two types of turning levels were defined that combined both left turning and right turning: a high turning level with 20% turning percentage and a low turning level with 10% turning percentage. The calculated access weights of the first driving simulation procedure are shown in Appendix 1.
Validation
Traveling speed comparison
To validate the effectiveness of the driving simulation method, it was necessary to collect field experimental data that contained travel speed and trajectory parameters. A video-based road detection (VRD) system operated by the Transportation Research Center at Shanghai Jiao Tong University was used for the field data collection. The VRD system is composed of video, sensor, and server subsystems. Many types of sensors installed in the vehicle can send real-time data (including travel time, travel distance, vehicle speed, and lateral offset from the lane center) to the server subsystem. The vehicle’s onboard computer records all these data for further analysis. The VRD system is shown in Figure 4.

Video-based road detection (VRD) system.
The field test for this research was conducted in Songze Avenue in Shanghai. The total length of the main road study section (Figure 5) was 11 km from milestone K164 + 500 to milestone K175 + 000, with five signal control intersections and six unsignalized access points. The time of day chosen for the field test experiment was 10:00 a.m. when the traffic volume was closest to the average hourly traffic volume during daytime. Each driver drove the vehicle equipped with the VRD system through this road section under the speed limit of 70 km/h. Real-time data, including operational speed, travel distance, travel time, and lateral offset were collected. Field test results of the average speed vibration at each spot site are shown in Figure 6 by the blue line.
Simulated road environment on Songze Avenue, Shanghai.

Comparison of speed vibration of field and simulated test results.
At the same time, simulation tests were carried out in the driving simulation laboratory of the Transportation Research Center at Shanghai Jiao Tong University. Traffic data, including traffic volume, turning volume, time phasing of signals at intersections, and so on, obtained from traffic surveys of this avenue, were input as the initial simulation settings in the UC-win/Road simulation software. Ten participants drove through the simulated road environment once each, and real-time data, including vehicle position with travel time, offset from the lane center, travel distance, and vehicle speed, were generated using the UC-win/Road software. The mean speed data at each spot site generated by the simulation tests are shown in Figure 6 by the red line. The coefficient analysis of the simulation and field tests results showed that both speeds had a high correlation, on the level of 0.01, with r2 = 0.912. The driving simulation corresponded well to that of the real driving environment.
Trajectory comparison
Analyses of the trajectories of vehicles can show whether the design of highway access points is safe across different traffic flows. According to the LOCV performance shown in Figure 2, the interval between a point 100 m from the up and down streams of the access point had the largest speed and lateral vibrations. A comparison of trajectories was conducted at a T intersection with median opening (Type 3, milestone K170 + 000) under the traffic conditions of main arterial volume 1400 vph, access driveway volume 310 vph, and a high turning percent. The mean values of the lateral offset at each spot site around the access point were recorded and are shown in Figure 7. The blue line represents the field test results and the red line represents the simulation test results. The average values in the interval of 200 m of the field and simulation tests are 0.1268 and 0.1317 m, respectively. Paired sample t-test results showed that both values had a significance (two-tailed) value of 0.125, which is above the confidence level of 0.05. This means that the field and simulation tests had no significant difference between them.

Average lateral offset of both test results at T intersection.
Correlation between access weight and crash rates: a case study
Site selection
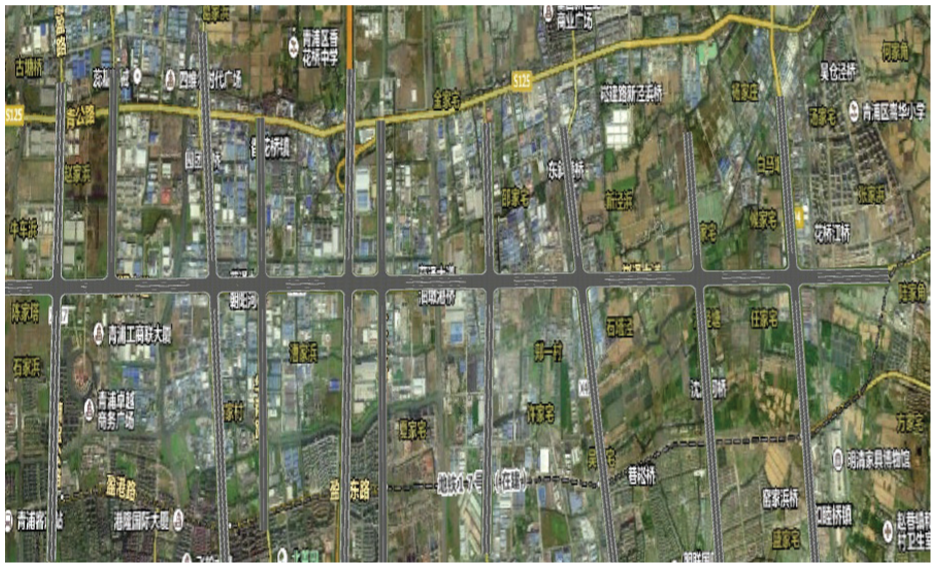
To validate the effectiveness of our access weight models in highway access management usage, the correlation between access density and crash rate was analyzed. For this study, National Highway G205 in Jiangsu Province, China, was selected for analysis (Figure 8). The highway bureau of Jiangsu Province holds the 3D road structure project file of National Highway G205 (South Nanjing section) that was built using AutoCAD Civil 3D software and which had high fidelity with the actual road construction. The 3D project was loaded directly into the UC-win/Road driving simulation software. In our traffic survey, data for the ADT volume of the main road, the ADT of access driveways, access types, and signal time phases were all collected. In addition, data for corner clearance, peak-hour through-movement of queues were also obtained, as these parameters have been demonstrated to have a close relationship with the safety of highway access.19,20 Crash information on the selected road came from the crash analysis report of National Highway G205 in Jiangsu Province for the years 2011 and 2012. The crash rate definition used in this study is crashes per million vehicles, which is a function of the number of crashes and the traffic volume. The highway access density model is described as the ratio of total access weight to the road section length

where

Geographic location of National Highway G205 (Jiangsu section).
In calculating the access weight, the weight coefficient w is a key parameter that represents the relative importance of the speed variation coefficient and the lateral variation coefficient. In our experimental design, 14 senior experts from the Jiangsu Province highway bureau were invited to assign weight values using an expert evaluation method. Five experts gave a weighted value of 0.48, five gave a value 0.52, and four gave a value of 0.5. The average value was 0.5, and the value of w was thus fixed at 0.5.The results for calculated access weights obtained using the proposed method are shown in Table 2.
Crash rate, access weight of G205, South Nanjing section.
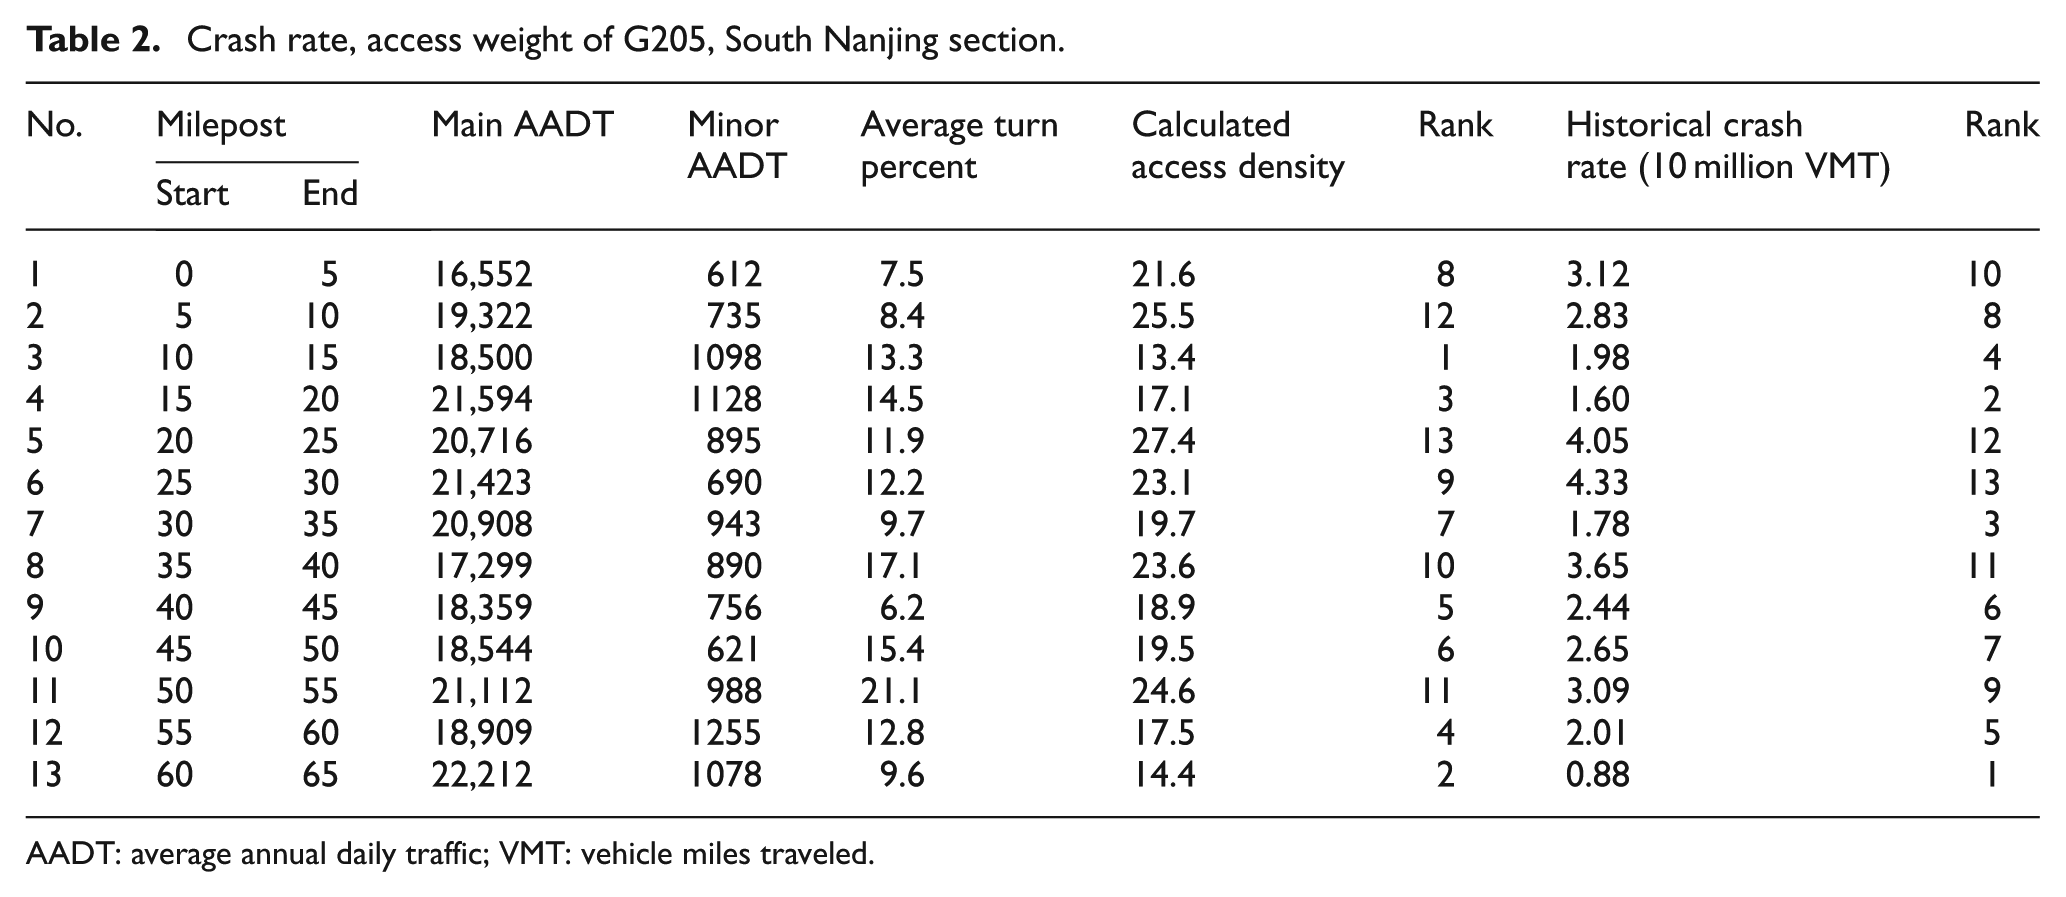
AADT: average annual daily traffic; VMT: vehicle miles traveled.
Simulation results
Spearman’s rank can be interpreted in terms of the amount of mutual information between two variables and the Spearman correlation value is a metric of the consistency of two sets of ranked variables. 21 Both the access-related crash data and the access density are discrete variables, and the relationship between these two variables is quite complex. This article uses Spearman’s rank correlation coefficient to analyze their correlation. Figure 9 shows the crash rate and calculated access density for the simulation driving data. The x-axis represents the access density and the y-axis represents the crash rate. When the access density increases, the crash rate also increases. The Spearman rank correlation coefficient is 0.80, which means that the crash rate and proposed access weight calculation method had a high correlation.

Spearman’s test results.
Conclusion and suggestions
This study has proposed a new method for calculating access weight based on traffic speed and lateral offset variation. The traffic simulation software package UC-win/Road was used to simulate tests and provide traffic speed and lateral offset variation metrics for different access types and turning percentages. Access density was calculated for 13 road sections using the proposed method for the roadway segments in National Highway G205 (South Nanjing section). Our conclusions and suggestions are summarized as follows: (1) the access weights calculated using the new method demonstrate a fairly high correlation with crash rates and (2) simulation outputs of different access weights under ideal traffic conditions are listed, which show diverse impacts of speed variance and lateral offset variance. These results show that the installation of median access points that prohibit left turns could minimize interference with access driveways. This is an effective method of decreasing the access weight by 22.7% at a high turning percentage and by 23.2% at a low turning percentage.
The driving simulation setting for this study did not consider non-motor vehicle traffics or pedestrian traffic accessing the arterial road from the driveways, which is an important factor that affects access safety. The proposed method can further be improved by considering such mixed traffic condition and reflecting this factor in two ways: the value of weight coefficient w need to be adjusted through more questionnaire and survey on experts; this traffic volume should be added in simulation scenes to study the driving performance differences. Notwithstanding, the core principle of the access weight calculation method stated above is to act as a surrogate measure of highway access safety, which should be further validated and improved by means of an empirical Bayes’ before-and-after analysis of crash data. Use of the proposed simulation-based access weight calculation method appears to hold promise in the safety evaluation of highway access in advance of design and construction. It should prove useful in the design of highway access points and should encourage the best combinations of different access types that promote traffic efficiency and road safety.
Footnotes
Appendix 1
“Entering level” is the access driveway traffic volume to the main road, “existing level” is the main road traffic volume to the access driveway, “L” is the low-level turning percentage (10%), and “H” is the high-level turning percentage (20%).
Academic Editor: Xiaobei Jiang
Declaration of Conflicting Interests
The author(s) declared no potential conflicts of interest with respect to the research, authorship, and/or publication of this article.
Funding
The author(s) disclosed receipt of the following financial support for the research, authorship, and/or publication of this article: This research project was partly sponsored by “Shanghai Pujiang Program” (15PJC093) and “the Fundamental Research Funds for the Central University” (1600219254).