
Abstract
An essential application in intelligent transportation systems is multi-target multi-camera tracking (MTMCT), where the target’s activity is tracked from different cameras. Although the tracking-by-detection scheme is the primary paradigm in MTMCT, the object association information from the video frames is lost. This is mainly because the multi-camera multi-object matching uses the information from the video frames separately. To solve this problem and leverage this association information, we propose an MTMCT framework, where features are built in the form of a graph and a graph similarity algorithm is used to match multi-camera objects. In this paper, we focus on the real-time scenario, where only the past images are used to match an object. Our method achieves an IDF1 score (the ratio of the number of correctly identified objects to the number of ground truth and average objects) of 0.75 with a rate of 14 frames per second (fps).
Keywords
City-scale intelligent traffic management is becoming more effective with advancements in computer vision research. One important application in intelligent traffic management is vehicle tracking, where spatial, temporal and visual information of the vehicle are integrated to create the vehicle trajectory from different cameras. Multi-target multi-camera tracking (MTMCT) is an application that extracts the vehicle trajectory on a global scale from cameras located at different locations, as shown in Figure 1. As a result, MTMCT can be used to track vehicles and determine their speed and travel time to optimize traffic flow at the city level. Tracking-by-detection is one of the main paradigms in MTMCT, which is divided into three main components: (i) object detection, (ii) multi-object tracking (MOT) and (iii) trajectory clustering. As illustrated in Figure 1, objects are detected and labeled with an identifier. MCMCT reidentified “Veh-70” in the following intersection and assigned the same label.
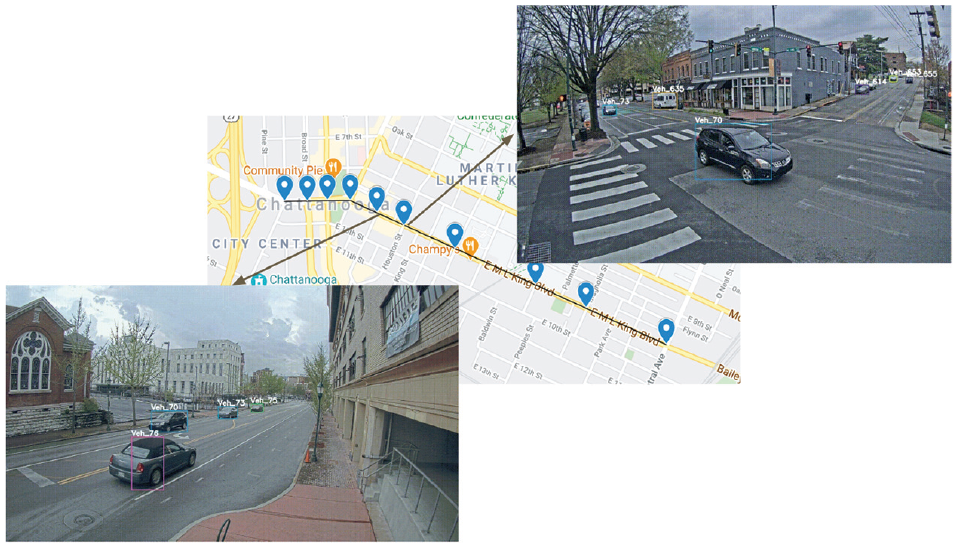
Multi-target multi-camera tracking (MTMCT) tracks vehicles over multiple cameras.
Object detection uses an object detector to extract objects from small images called bounding boxes (bboxes) for each video frame. Then MOT tracks the vehicle from the time it enters to the time it leaves the camera view. To match the detected objects within a single camera, MOT uses a tracker such as Deep SORT ( 1 ). The tracker solves the matching problem by using pairwise object affinities to match detected objects in past frames with detected objects in the current frame. Tracklets containing all bboxes of specific objects in that camera are the result of MOT. Trackers in MOT learn features based on appearance features, such as features from object re-identification (ReID) algorithms. The objective of object ReID is to find exactly the same vehicle from an extensive gallery set extracted from multiple cameras. Primarily, ReID is based on visual features alone, without using other information such as the license plate number or spatial and temporal data.
Trajectory clustering is the final step of MTMCT, where single-camera tracklets from different cameras are coordinated to track the activity of the object globally. This clustering task is also usually performed using features from an object ReID application. The traditional ReID algorithm works with separate images of objects, so when using tracklets in the trajectory clustering task the associated information between bboxes may be lost. A given object can be tracked in both offline and online modes. In offline mode, past and future frames are used to track the object, while in online mode, only past frames are used.
In this paper we focus on the online tracking scenario. We propose a framework for the third component of the MTMCT application (trajectory clustering) that achieves good performance with low latency. Our proposed trajectory clustering technique consists of three sub-steps: (a) bbox feature extraction by a Siamese network, (b) graph-based tracklet features construction, and (c) trajectory matching using a graph similarity algorithm. In other transportation studies, a graph frequently depicts the structure of the road network. However, the graph in this study is formed using Siamase features and Euclidean distances, and it represents the tracklet feature. Specifically, we create a graph with nodes and edges representing bboxes and the Euclidean distance between their embedding features to solve associated information loss. Then, we use the graph similarity algorithm (SimGNN [ 2 ]) to compare the graph-based tracklet features and match the vehicle from different cameras.
In summary, our MTMCT framework consists of three primary steps. (i) A vehicle detection algorithm is used to extract the objects as bboxes. (ii) The single-camera tracklets are generated. (iii) Trajectory clustering that is divided into three sub-steps: (iiia) features are extracted for each image using a Siamese network; (iiib) graph-based tracklet features are constructed; and (iiic) the graph-based tracklet features and the graph similarity algorithm are used to match objects from different cameras. The following is a summary of this paper’s contributions:
We propose a method for creating graph-based tracklet features that leverage the association information between the bboxes.
We propose an MTMCT clustering method using graph similarity algorithms.
Our proposed MTMCT framework achieves an IDF1 score of 0.75 (see “Evaluation Metrics” section below) with a speed of 14 frames per second (FPS).
The rest of the paper is organized as follows. The next section describes the background to the study. This is followed by a literature review section on related work. Then, our proposed method and architecture are described in the “Methodology” section. Next, the “Experiments and Results” section presents our datasets, evaluation metrics, experimental setups and results. The final section, “Conclusion and Future Work” contains our concluding remarks, discussion and future work.
Background
The main contribution of this paper is to propose a strategy for creating tracklets in a graph structure using a Siamese network feature and using graph similarity learning based on graph neural network (GNN) to group single-camera tracklets into multi-camera tracklets. Therefore, the rest of this section provides an overview of these two topics.
Siamese Network
It is common for machine learning to be applied to analyze the similarity between two objects. Accordingly, for example, (i) face recognition checks whether an input facial image resembles one stored in the database; (ii) question-and-answer websites determine whether a new question is similar to one stored in the database; (iii) image search engines display similar images. In this approach, each object is represented as a vector (also known as an embedding). For example, in example (iii), images are presented as vectors by using the output of a pre-trained convolutional neural network (CNN), then the similarity between the two vectors is calculated to determine the degree to which the two images are similar.
Architecture
Two identical subnetworks in the Siamese network, also known as twin networks, are connected at their outputs. Furthermore, the twin networks share not only the same architecture but also the same weights. In parallel, they are responsible for creating vector representations of the inputs. In the case of images, we can use ResNet as a twin network. The Siamese network can be viewed as a wrapper for twin networks. By measuring similarities between vectors, they assist in the creation of better vector representations.
Network Structure
In Figure 2,
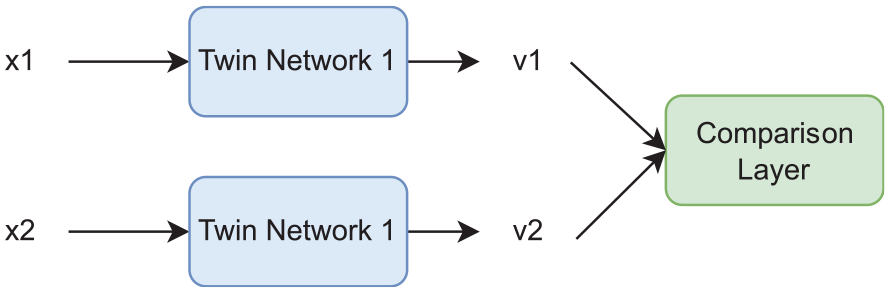
The Siamese network.
The cosine similarity between
We calculate the Euclidean distance (other distances are also acceptable) between
Graph Similarity Learning Based on GNN
A GNN-based similarity learning method performs the similarity learning task in an end-to-end manner while learning graph representations. To learn the features of the nodes or graphs in the encoding space of two input graphs, GNN-based graph similarity learning methods first apply multi-layer GNNs with weights. Because the GNNs of each graph in a pair share weights and/or interact with one another, the learning graphs in a pair may influence each other. A dot product layer or fully connected layer can be used to calculate or predict the similarity values between two graphs based on an output matrix or vector representation provided by the GNN layers. The final step involves combining the similarity scores for all graph pairs and their ground truth labels in a loss function to train the model using weighted parameters ( 2 – 4 ).
A graph similarity learning system should be able to improve accuracy when compared with other state-of-the-art frameworks while maintaining a reasonable computational cost for real-time application. To improve the model’s predictability, all properties of the input graphs, including graph topologies and node and edge attributes, are taken into account. The work should adapt Siamese GNNs by incorporating appropriate mechanisms during the learning process with GNNs, and cross-graph interactions should be considered during the learning process for graph representations. The algorithm may also ignore the input graph’s node attributes to reduce computation time.
In summary, the work combines GNNs with CNNs to predict graph similarity. The first step is to train GNNs to represent graphs, and then the learned representations are used to train CNNs to predict similarity scores. As a result, the model becomes a complete end-to-end learning system with additional fully linked layers used to predict similarity values. In this way, the entire process of predicting similarity values can be completed with an FPS of 14 while maintaining an acceptable level of accuracy. The online scenario is therefore well suited to this approach.
Related Work
Changes in viewpoints, variations in illumination, and the blind areas among the cameras, all make tracking multiple targets with multiple cameras a challenging problem. Several recent studies have investigated the relationship between cameras, including illumination changes, travel times, and entry/exit zones between pairs of cameras.
Since there is considerable variation in illumination between different viewpoints, a brightness transfer function (BTF) is calculated from one camera to another to model these variations. According to Javed et al. ( 5 ), all BTFs are arranged in a low-dimensional subspace that can be used to compute similarities between appearances. Using the cumulative brightness transfer function, Prosser et al. ( 6 ) map colors between cameras situated at different locations. Other works use the spatial constraints and traffic rules as filters to reduce the searching space in multi-camera trajectory clustering tasks ( 7 , 8 ). Specifically, Liu et al. ( 7 ) divide the area in the video into crossroad zones, which are used to track the previous and next cameras of a given tracklet. Similarly, Hsu et al. ( 8 ) propose a traffic-aware module that detects entry and exit zones and is used to match multi-camera tracklets with the camera link model. Besides temporal constraints, some works utilize temporal information in the MTMCT tasks. The model described in Javed et al. ( 9 ) uses kernel-density estimation to determine the relationships between cameras as multivariate probability densities of spatio-temporal variables and then uses maximum likelihood estimation to incorporate appearance features and these spatial-temporal features.
Numerous graph-based models ( 10 – 17 ) are proposed to deal with MTMCT. A mini-cost flow graph is constructed by Hofmann et al. ( 11 ) to complete the data association among cameras in the space of a three-dimensional world. Based on the k-shortest path algorithm, the data association problem in Berclaz et al. ( 13 ) is formulated as a constrained flow optimization of a convex problem. A modified multiple hypothesis tracking algorithm was developed by Yoon et al. ( 15 ) in which branches in track-hypothesis trees represent the trajectory across multiple cameras. Quach et al. ( 17 ) consider the problem of data association as a link prediction between nodes on a dynamic graph, where the graph vertices are associated with the tracklets, and a self-attention has used the module to embed camera number and temporal information.
Some other works focus on the local features since data associated with tracking systems are usually restricted to a local area. While local area refers to consecutive frames in MOT, it relates to neighboring cameras where the target may be visible in MTMCT. Hou et al. ( 18 ) propose a locality-aware appearance metric, where training data pairs from consecutive frames are sampled in MOT, and training data pairs are selected from consecutive frames of neighboring cameras in MTMCT. Although most MTMCT applications formulate the multi-camera tracklet matching problem as a tracklet-to-tracklet assignment, He et al. ( 19 ) show that tracklet-to-target assignment (TRACTA) is a better strategy. Specifically, they use the restricted non-negative matrix factorization algorithm to compute the optimal ID assignment matrix for the tracklet.
In this paper, the best performing MTMCT is used as the baseline described in the “Experiments and Results” section. In this section, we now present related work on two important components of our framework: MOT and graph similarity.
Multi-Object Tracking (MOT)
MOT generates single-camera tracklets, the input for multi-camera trajectory clustering tasks in MTMCT. It has been the main trend in the MOT application for many years to use the tracking-by-detection ( 20 ) paradigm. This paradigm includes three main stages: (i) image object detection, (ii) feature extraction, and (iii) data association.
Deep learning-based methods have become the main trend in the first stage, image object detection, since they can be utilized in small and large networks while preserving speed and accuracy. One of the most common deep learning-based detection algorithms is YOLO ( 21 ) and its related algorithms such as YOLO-LITE ( 22 ) for non-GPU computers, Tinier-YOLO ( 23 ), YOLOv4-tiny ( 24 ) for real-time applications. Furthermore, Ouyang et al. ( 25 ) propose a JointDeep method for identifying candidate parts based on the previous detection method, deformable part models ( 26 ). Other works ( 27 – 30 ) use two-stage R-CNN framework as baseline in object detection architecture. In contrast to detectors that are based on two stages of R-CNN, other works ( 31 , 32 ) use one-stage R-CNN for detecting objects in images.
In the feature extraction stage, the detected bboxes are used to extract the features of appearance, motion and time. For the appearance feature, much research has been done to learn image representation, including auto-encoder ( 33 , 34 ), object ReID ( 35 ), feature pyramids ( 36 ), transformed-based ( 37 ) and Siamese network ( 36 , 38 , 39 ). Kalman filters ( 1 ) and long short-term memory (LSTM) ( 40 ) are usually used for features of motion.
Finally, the data association stage groups the extracted bboxes by using the extracted features. It usually computes the similarity between extracted features by using various metrics, such as cosine similarity, Euclidean distance, intersection over union, and Siamese network ( 41 ). Recent work implements this task using Hungarian algorithms ( 1 ), dynamic programming ( 42 ), and reinforcement learning ( 43 ). Another work, by Hsu et al. ( 44 ), applies post-processing to reduce errors. They use the traffic rule to reduce the ID switch error that splits a single tracklet in a camera into many tracklets.
Graph Similarity
Based on how to graph similarity or proximity is used in learning, there are two main categories of previous GNN-based work on learning graph similarity: GNN-CNN mixed models for graph similarity prediction and Siamese GNN-based graph matching networks.
GSimCNN ( 45 ) is a model consisting of three stages for pairwise graph similarity prediction. As part of this model, multi-layer graph convolutional networks (GCNs) generate node representations and then compute the inner products of all possible pairs of node embeddings between two graphs derived from different GCN layers. Lastly, multiple independent CNNs and fully linked layers are used to process similarity matrices from different layers to predict the final similarity value.
Ktena et al. ( 46 ) propose a method for learning graph similarity by employing the Siamese graph CNN. As part of this model, a pair of graphs are considered as inputs, and then a spectral GCN is applied to generate a graph embedding for each graph of input. In the similar work of Ma et al. ( 47 ), a higher-order Siamese GCN model is proposed to combine the proximity of higher-order nodes with GCNs, and then for the graph similarity learning task, each input graph is applied to higher-order convolutions.
In addition, in recent graph matching networks ( 3 , 4 ) an image matching task is implemented as an application in computer vision, where images are transferred to graph topologies. In particular, the graph nodes converted from the input image represent the unary descriptors of the extracted feature points of the image. At the same time, the connections encode the pairwise relationships among these feature points. Furthermore, based on the new graph representation, the image feature matching problem can be reformulated as a graph matching problem.
Methodology
The framework
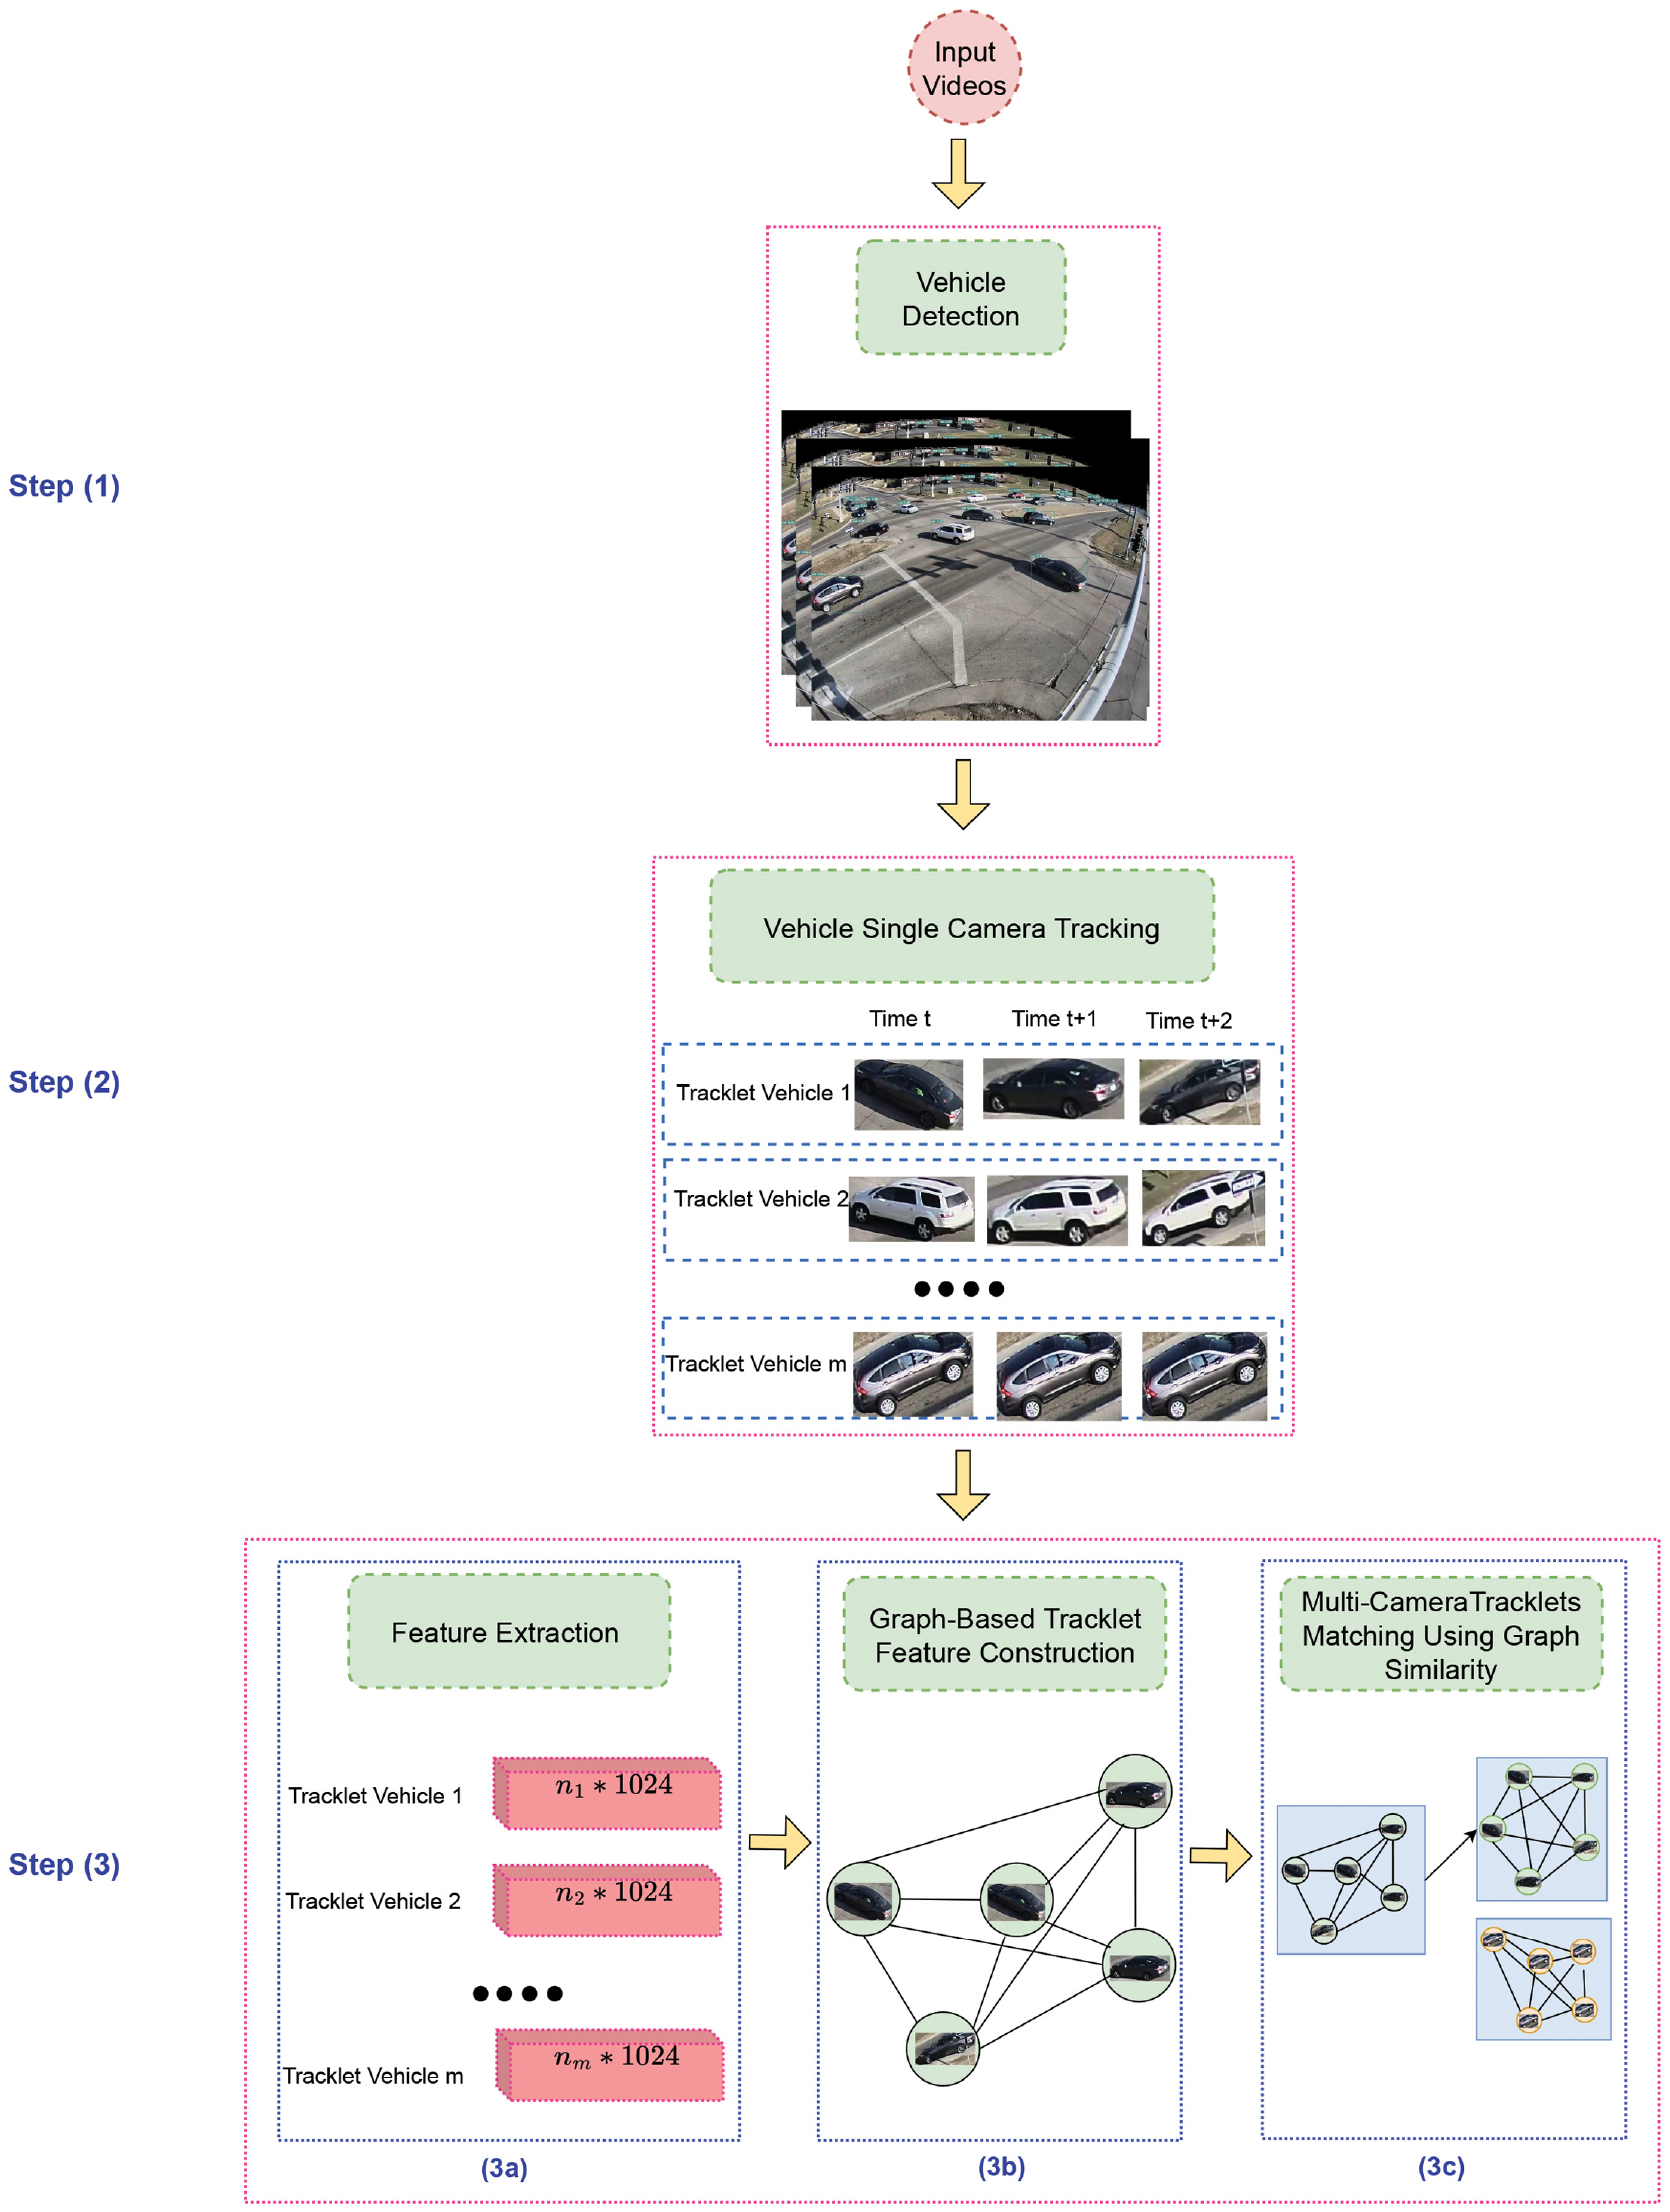
Proposed architecture. During Step 1, vehicle detection, the vehicle is first detected. Based on this detection result, single-camera tracklets are generated in Step 2, vehicle single-camera tracking. In Step 3a, feature extraction, features are learned for each bbox using a Siamese network. Then, tracklet features based on graphs are created in Step 3b, graph-based tracklet feature construction. In Step 3c, multi-camera tracklets matching, the similarity between tracklets is calculated and used to match single-camera tracklets to generate multi-camera tracklets.
Step 1. Vehicle Detection
As described in the section “Multi-Object Tracking (MOT)” above, vehicles are detected from the video images as bboxes in this step. Our vehicle detection model is based on YOLOv5, which was published in 2020 by Glenn Jocher and has been investigated in more than 240 research papers. YOLOv5 is developed using the PyTorch framework. A total of 58 open source contributors have contributed to the development of this latest version of the YOLO object recognition model.There are some model configuration files and different versions of this detector, in which we choose the pre-trained model YOLO v5l6 for our implementation. The result is presented as a set of vectors as follows:

where
Step 2. Multi-Object Tracking (MOT)
This task is also known as single-camera tracking. To track multiple targets within a single view, we employ the tracking-by-detection paradigm, which combines frame-level detection results into tracklets. In particular, we create tracklets using FairMOT ( 48 ). To estimate the position of objects from noisy measurements, it incorporates a Kalman filtering algorithm as well as a cascade matching algorithm. As a result of the combination of deep visual features and moving information as association criteria, it provides much more information for the association task than simple bounding boxes. As illustrated in Figure 3, the bboxes are associated based on this combination of appearance and moving feature. As a result, the single-camera tracklet containing the triplet vectors is generated for each vehicle as follows:

where
Step 3a. Feature Extraction
The Siamese network is used in this step to learn the features of each bbox in tracklets. This subsection describes the details of the architecture implemented in this study, consisting of two symmetric CNNs with identical structures and parameters, as shown in Figure 2. Each CNN is constructed according to the ResNet-50 architecture (
49
) with 50 layers (only the convolutional layers and the fully connected layers are counted). Additionally, to obtain the output with different dimensions, CNN uses a different number of residual units (RUs). Accordingly, CNN contains three RUs that output 256 feature maps, four RUs that output 512 maps, six RUs that output 1,024 maps, and finally three RUs that output 2,048 maps. ResNet-50 initial parameters are the same as those of the original ResNet-50 trained on 1,000 classes of the ImageNet dataset (
50
). The final structure of each twin Siamese network comprises the ResNet-50 architecture enhanced with two additional layers of
In the top layer, we obtain a representation of the feature vector
For network training, the weights of all pre-trained layers of the ResNet-50 model are frozen for each twin network to avoid affecting the weights that the model has already learned. In addition, our own two dense layers with

During the training process, 100,000 triplets were extracted (
Step 3b. Graph-Based Tracklet Feature Construction
According to the section “Graph Similarity Learning Based on Graph Neural Network” above, we need to construct the tracklet features in a graph structure so that we can utilize the association information in the tracklet and compare the tracklets based on their graph similarity. Specifically, feature vectors (embeddings) from the Siamese network are represented by nodes, while Euclidean distances between nodes represent edges and a threshold
As a result of an empirical tuning proposed by Fisichella et al. (
52
,
53
), it was determined that the distance threshold of
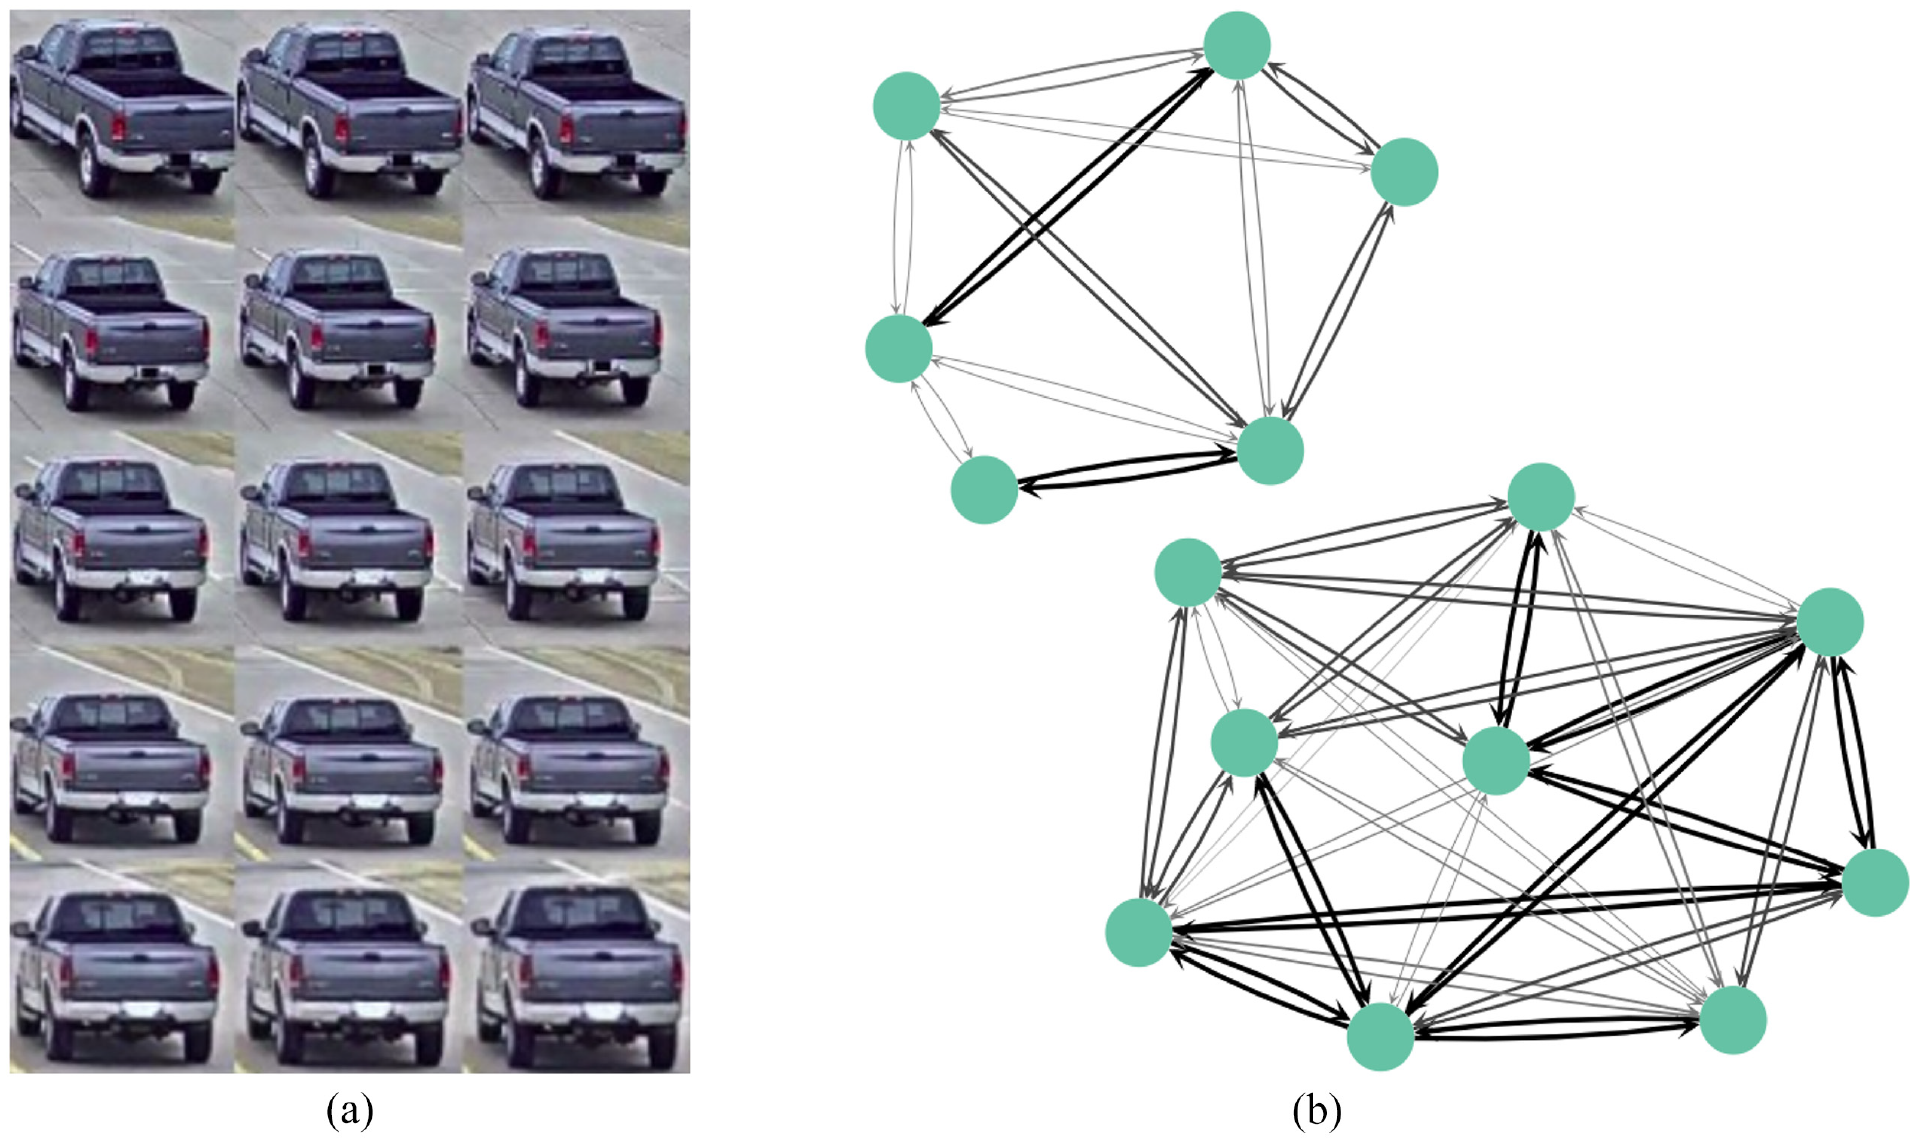
Graph-based tracklet feature visualization: (a) tracklet consisting of 15 bounding boxes collected from various video frames and (b) graph-based tracklet feature in which nodes are bounding boxes and edges represent the Euclidean distance between nodes; the darker the edges, the greater the distance.
Step 3c. Multi-Camera Tracklets Matching Using Graph Similarity
A spatial-temporal filter is applied to increase efficiency before matching. Since all of the cameras are located on the main road, as shown in Figure 5, we divide the camera image into four crossroad zones to utilize the spatial information. Figure 6 show an example of crossroad zone in camera 43: four colors are used to divide the different zones (white: zone 1; blue: zone 2; green: zone 3; red: zone 4). Specifically, zone 3 and zone 4 are connected to the main road where the cameras are situated. In other words, zone 3 is connected to the next camera (camera 44), whereas zone 4 is connected to the previous camera (camera 42).
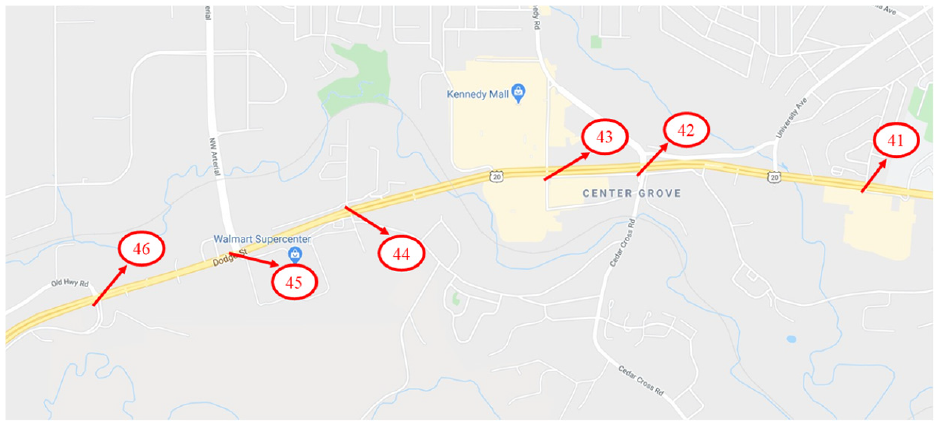
Camera locations: the testing scenario includes six cameras, from camera 41 to camera 46.
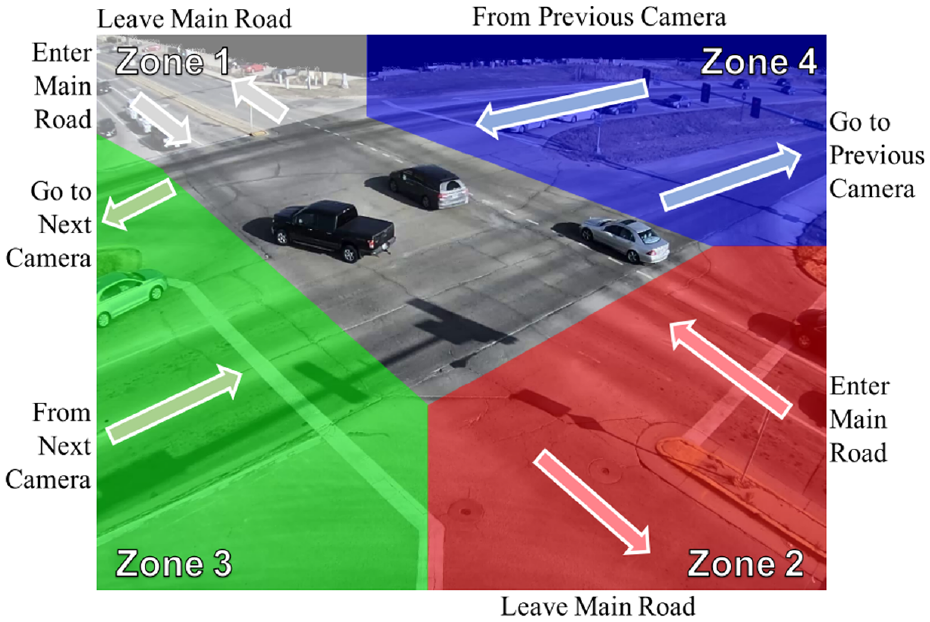
Crossroad zone visualization of camera 43. To utilize the spatial information, the video image is divided into four zones. Zone 4 and zone 3 connect to the previous and next camera. Zones 1 and 2 are the exits from the main road.
As shown in Figure 5, the test scenario includes six cameras with ID numbers ranging from 41 to 46. As a result, we must match tracklets of cameras whose IDs are consecutive. The start/end time
Conflict Table
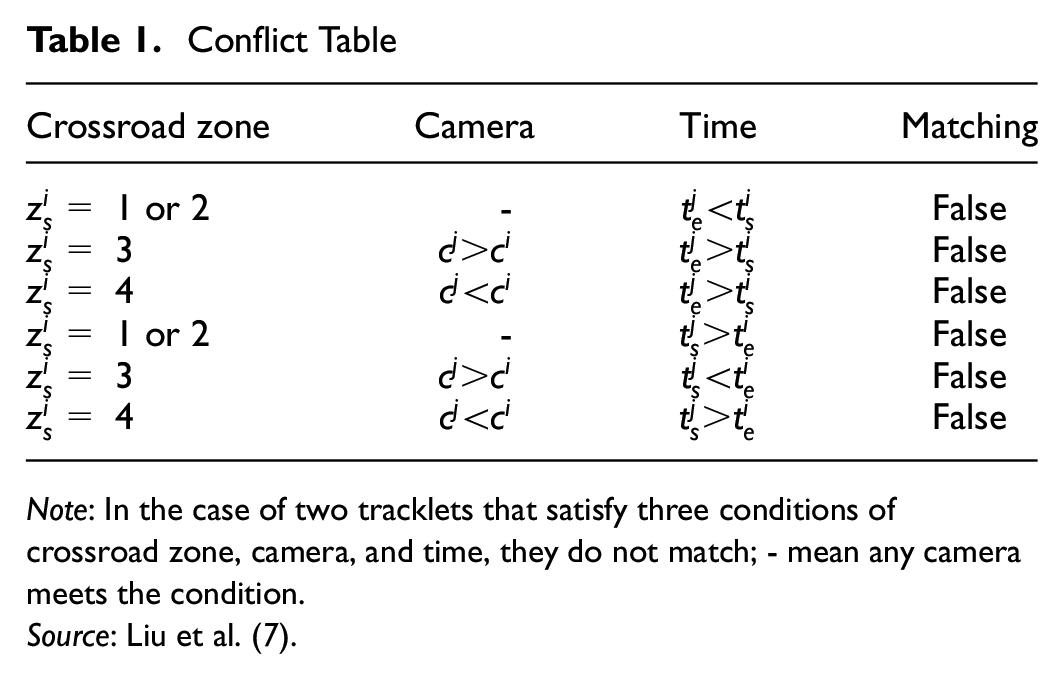
Note: In the case of two tracklets that satisfy three conditions of crossroad zone, camera, and time, they do not match; - mean any camera meets the condition.
Source: Liu et al. ( 7 ).
To explain this filtering process with the conflict table, we will use the example of matching tracklets from camera 42 and camera 43. We only need to filter two groups of vehicles from cameras 42 and 43, as shown in Figure 6:
Group 1: vehicles that move from camera 42 to camera 43.
Group 2: vehicles that move from camera 43 to camera 42.
For the purpose of filtering these two groups, spatial-temporal filtering is employed. Specifically, as shown in Figure 7, we apply the spatial filtering as follows:
Group 1: We match the tracklets that end in zone 3 of camera 42 with those that begin in zone 4 of camera 43.
Group 2: We match the tracklets that end in zone 4 of camera 43 with those that start in zone 3 of camera 42.
Following the spatial filtering, the temporal filter is employed as follows:
Group 1: We match the tracklets in camera 42 (ending in zone 3) that have the ending time earlier than the starting time of pairing tracklets in camera 43 (starting in zone 4).
Group 2: We match the tracklets in camera 43 (ending in zone 4) that have the ending time earlier than the starting time of pairing tracklets in camera 42 (starting in zone 3).
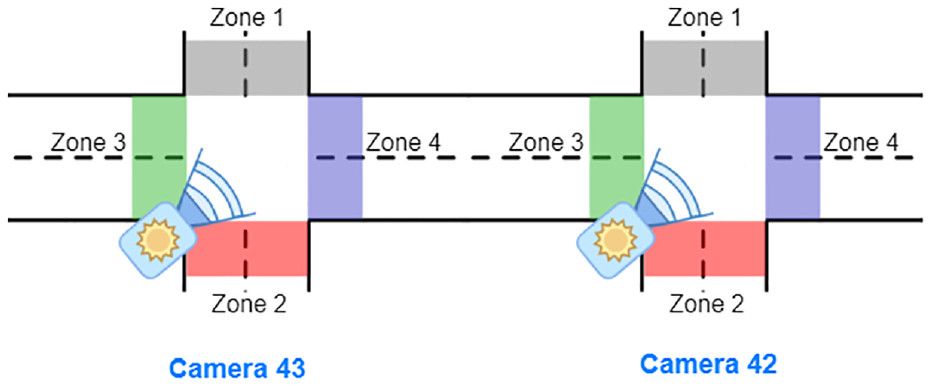
The positions of camera 43 and camera 42 and their zones. Between cameras 43 and 42, there are two groups of vehicles moving. The vehicles of group 1 move from zone 4 of camera 43 to zone 3 of camera 42, while those in group 2 move from zone 3 of camera 42 to zone 4 of camera 43.
A graph similarity algorithm is applied following the application of the above filters to calculate the similarity scores between graph-based tracklet features. To achieve the highest level of performance in matching the input tracklets graphs, the graph similarity algorithm must capture both global (graph–graph) and local (node–node) interactions while also taking into account cross-level interactions between each node of one graph and the other whole graph. Furthermore, since our application runs in real time, the computational cost must be acceptable. In particular, SimGNN ( 2 ), a simplified GNN model that ignores node features in favor of graph topologies, is used to learn graph similarity. Specifically, the model has an FPS of 14 using SimGNN. Additionally, most current state-of-the-art approaches to the MTMCT problem (vehicle tracking) work offline, not online. Therefore, to the best of our knowledge, we are the first to create an approach for handling vehicle MTMCT problems with acceptable FPS (i.e., FPS of 14) and high accuracy (achieving an IDF1 score of 0.75).
Experiments and Results
Dataset and Operation System
To conduct the experiment, we used the CityFlow dataset ( 54 ), which contains multiple street camera images of the actual scenes in a city. A notable advantage of CityFlow is that it covers different types of streets, including intersections, highways, and road extensions. There are 3.25 h of traffic videos captured from 40 cameras at 10 intersections in both the training and validation sets. The test set consists of 20 min of street video from six cameras situated at six intersections. The training experiments are run on four Nvidia Tesla 32GB V100s and the inference experiments are run on one Nvidia Tesla 32GB V100s.
Evaluation Metrics
Our method’s performance is evaluated using precision, recall, and IDF1 ( 55 ). IDF1 is defined as the ratio of the number of correctly identified objects to the number of ground truth and average objects. The IDF1 formula is presented below:
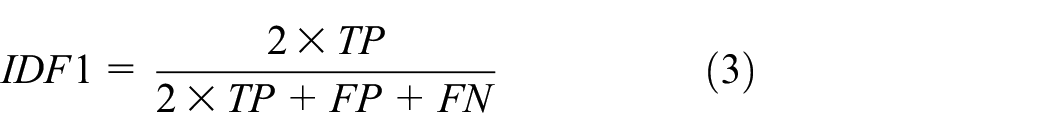
where TP is true positive, FP is false positive, and FN is false negative matching.
Baselines
As mentioned in the “Methodology” section,
Experimental Results
The performance of our methods has been demonstrated in several ablation studies. To begin with, we analyze the results using two different Siamese network architectures: ResNet and Efficient Net. According to Table 2, for features of dimension 1,024, ResNet achieves a better result, whereas Efficient Net has a faster FPS. Our next step is to keep the Siamese network backbone as ResNet and increase the dimension of the feature to 2,048 and 4,096 to determine which is most appropriate for the feature dimension. Based on the results shown in Table 2, it is surprising that the feature with dimension 2,048 obtained the best IDF1 value of 0.7521, while the feature with dimension 4,096 obtained an IDF1 value of 0.7357. The average FPS of our system is 14, which is suitable for a real-time scenario.
Results of Different Siamese Network Backbones and Feature Dimensions Based on SimGNN
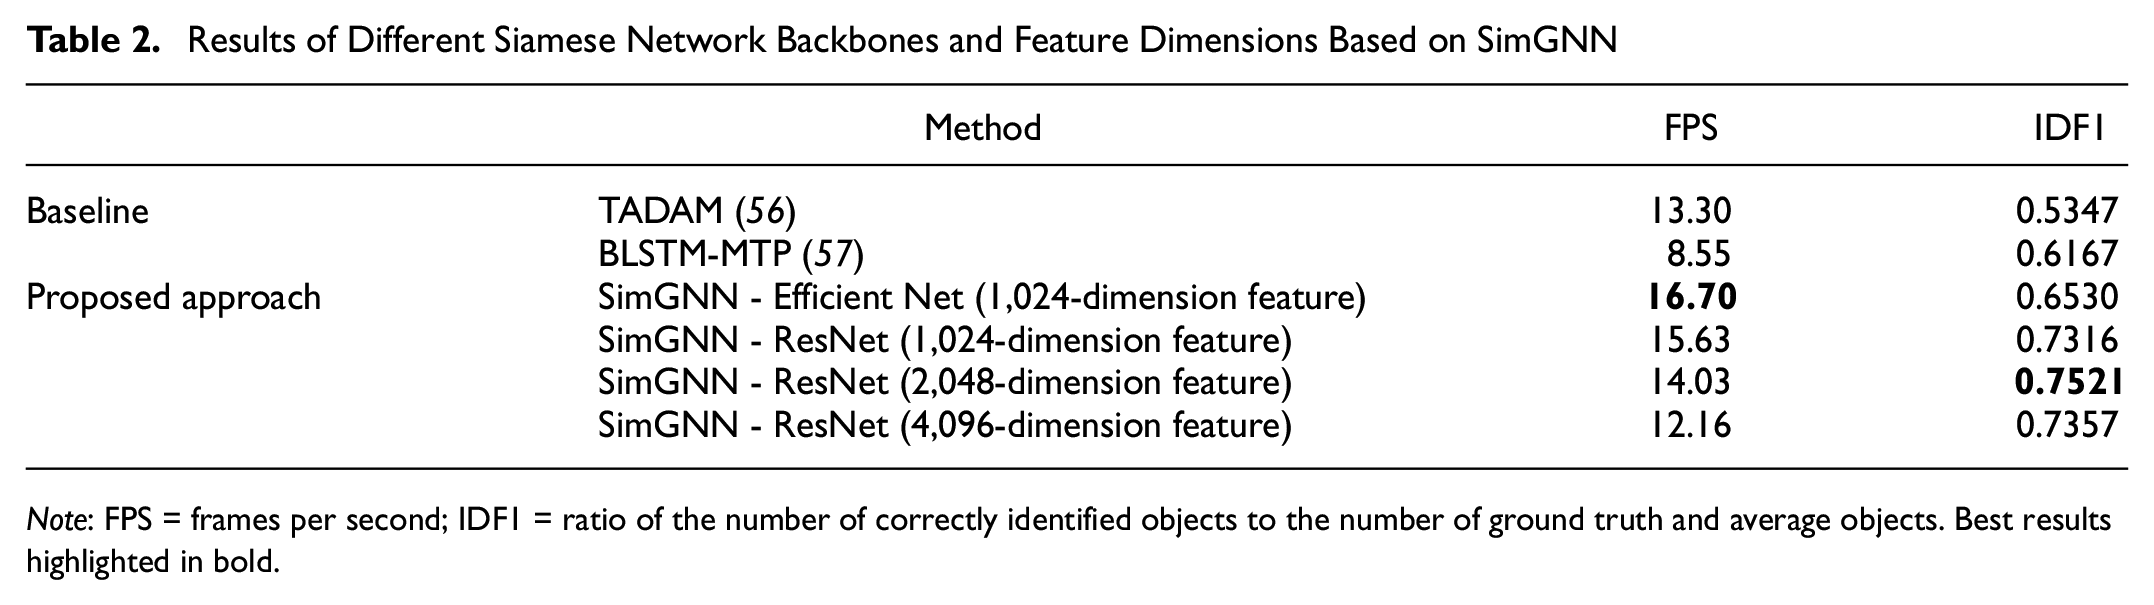
Note: FPS = frames per second; IDF1 = ratio of the number of correctly identified objects to the number of ground truth and average objects. Best results highlighted in bold.
Based on an empirical tuning proposed in Fisichella et al. (
52
,
53
), the distance threshold
Results of Different Graph Construction Thresholds
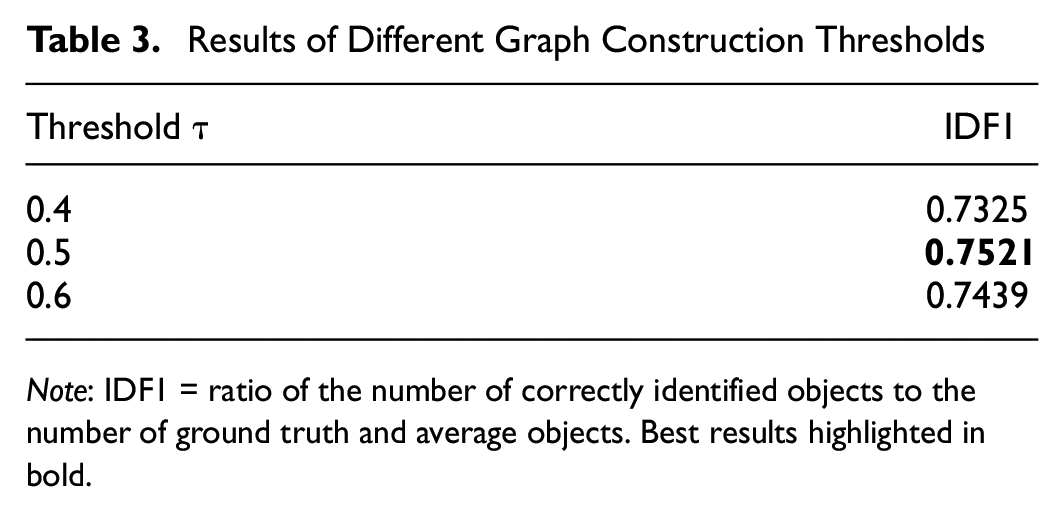
Note: IDF1 = ratio of the number of correctly identified objects to the number of ground truth and average objects. Best results highlighted in bold.
All the above experiments using Euclidean distances to compare the similarity of graph features. In addition, we evaluate the the performance of algorithm of with Manhattan distance and cosine similarity. In these experiments, the backbone is a Siamese network with a 2,048-dimension. The results from Table 4 show that the algorithm with Euclidean distances achieved the best IDF1 of 0.7521. With optimal settings (SimGNN + ResNet + 2048-dimension feature), the overall training time for the 3.25 h training video is 187 h and the total inference time for the 20 min test video is 14.25 min.
Results of Different Similarity Metrics
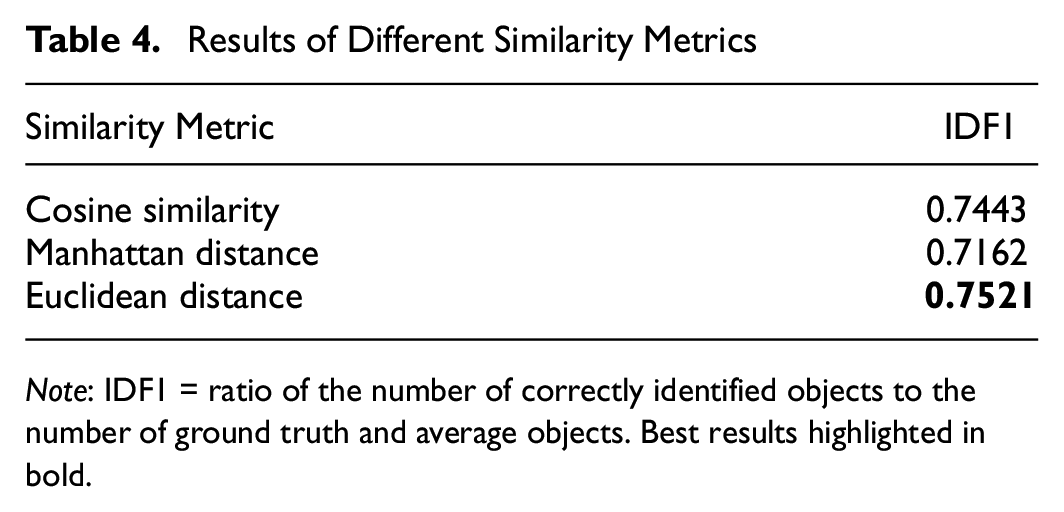
Note: IDF1 = ratio of the number of correctly identified objects to the number of ground truth and average objects. Best results highlighted in bold.
In the baseline comparison, some other online tracking algorithms have also been evaluated, but we train TADAM ( 56 ) and BLSTM-MTP ( 57 ) models on the CityFlow dataset for the comparison in this study. The results of these two algorithms are not comparable since they were developed for pedestrian tracking. The IDF1 for TADAM is 0.53, while the IDF1 for BLSTM-MTP is 0.61. Perhaps more importantly, the FPS for TADAM and BLSTM-MTP are 13.33 and 8.55, respectively, which are both slower than our algorithm. According to Table 2, our FPS is competitive, while the IDF1 is superior to existing methods.
Conclusion and Future Work
As part of an intelligent traffic management system, MTMCT is a critical task. Using this technology, one can track the trajectory of vehicles in the city and determine their speed and travel time to optimize traffic flow. A graph-based tracklet feature is created based on the association information between the bboxes of a tracklet. A graph similarity learning algorithm is then used to determine the similarity value, which is used to match the single-camera tracklets from different cameras to form a multi-camera tracklet for each vehicle. This strategy is used for the online scenario in which objects are only associated with previous frames. Since a real-time application requires a fast inference running time, we customize SimGNN to serve as a learning graph similarity algorithm. Thus, our real-time approach achieves a competitive IDF1 score of 0.7521 with an FPS of 14.
Our work is currently focusing on online vehicle tracking, however, the proposed method can also be applied to pedestrian tracking in that it takes advantage of body-moment matching information. Specifically, a person’s body parts can be used as nodes to create a graph-based structure for that individual. We can then apply a similar technique to match the person from the previous frame with the person in the current frame. As a result, one possible direction for future research is to expand our framework to include pedestrian tracking.
Although all the test set cameras in this study are installed along the same road, this does not limit the applicability of this baseline to other, more complex road networks, such as those with intersections, overpasses, and so forth. In these instances, the application of this study can be simply utilized with a more complex conflict table.
Footnotes
Author Contributions
The authors confirm contribution to the paper as follows: study conception and design: M.F., T.T.N.; data collection:T.T.N.; analysis and interpretation of results: M.F., T.T.N., H.H.N.; draft manuscript preparation: M.F., T.T.N, H.H.N, M.S. All authors reviewed the results and approved the final version of the manuscript.
Declaration of Conflicting Interests
The author(s) declared no potential conflicts of interest with respect to the research, authorship, and/or publication of this article.
Funding
The author(s) disclosed receipt of the following financial support for the research, authorship, and/or publication of this article: This material is based on work partially supported by the U.S. Department of Energy’s Office of Energy Efficiency and Renewable Energy (EERE) under Award Number DE-EE0009208. This work was also supported by the European Union’s Horizon 2020 research and innovation program under grant agreement No. 833635 (project ROXANNE: Real-Time Network, Text, and Speaker Analytics for Combating Organized Crime, 2019–2022).
This paper was prepared as an account of work sponsored by an agency of the United States Government. Neither the United States Government nor any agency thereof, nor any of their employees, makes any warranty, express or implied, or assumes any legal liability or responsibility for the accuracy, completeness, or usefulness of any information, apparatus, product, or process disclosed, or represents that its use would not infringe privately owned rights. Reference in this paper to any specific commercial product, process, or service by trade name, trademark, manufacturer, or otherwise does not necessarily constitute or imply its endorsement, recommendation, or favoring by the United States Government or any agency thereof. The views and opinions of authors expressed in this paper do not necessarily state or reflect those of the United States Government or any agency thereof.