
Abstract
The tillage depth (TD) serves as a pivotal criterion for assessing the operational excellence of rotary tillers, yet the current TD control methods are plagued by a myriad of issues including subpar precision and sluggish responsiveness. The present study aimed to develop a high-precision TD monitoring model that incorporates the tilting attitude of the tractor, and investigate the impact of tractor attitude inclination and lifting hydraulic cylinder stroke on TD. The TD stability control system based on electro-hydraulic control was developed, and the model identification method was adopted to derive the accurate control function. The fuzzy adaptive PID (FAPID) method was adopted to effectively improve the response speed and resisting disturbance capacity of the electro-hydraulic system. Then the co-simulation model of the electro-hydraulic control system was constructed. Under the excitation of step and sine functions, the FAPID control algorithm can reduce the rise time by more than 50%, and the displacement tracking error is also effectively reduced. To verify its effectiveness, the experimental platform was constructed, and then field test trials of TD were conducted. The test results indicate that, under various operational conditions, the developed TD control device can effectively reduce the standard deviation of TD by 0.302–0.464 and decrease the variation coefficient of TD by 2.47%–2.92%. The online monitoring and precise control device of TD investigated in this paper can effectively improve the quality of tillage machinery.
Keywords
Introduction
Tillage is one of the important links of agricultural production, which is beneficial to improve the physical properties of soil and adjust the ratio of solid, liquid, and gas in soil. Tillage increases soil voids, improves permeability, and promotes microbial decomposition of organic matter.1–3 Tillage depth (TD) is one of the important evaluation indicators of the operation quality of tillage equipment. Chinese national standards state that TD stability should be no less than 85%. 4 Due to the continuous advancement of precision agriculture, particularly the emergence of unmanned farms, meeting production requirements solely based on the position of the tractor’s three-point suspension lifting hydraulic cylinder becomes challenging for TD measurement.5–7 Therefore, it is important to develop a high-precision online monitoring and stability control device for TD.
At present, there are four main forms of the operating depth control of agricultural equipment: floating control, position control, force control, and force-position integrated control. 8 The floating control of agricultural machinery relies on its own depth-limiting device (such as a depth-limiting wheel or floating plate) to regulate the operating depth.9,10 The primary drawback of utilizing a floating control mechanism lies in the fact that the inclusion of a depth-limiting device results in an increase in the overall weight of the implement.5,11 And because the weight of agricultural implements is not supported by the tractor, it is not conducive to improving the traction attachment performance of the tractor. 12 The position control means that the agricultural equipment is not equipped with a depth-limiting device, relying on the action of the hydraulic cylinder to maintain the equipment in a certain fixed position. 13 Force control means that the change amount of the resistance control spring is used as the input signal for automatic control, and if the tillage resistance changes, the hydraulic cylinder can automatically adjust the working depth. 14 The force-position integrated control is a combination of resistance control and position control, with both resistance and position change quantities as inputs to the control system.15,16 If the road surface is undulating or the specific resistance of the soil varies greatly, the control effect of the above methods is difficult to meet the requirements. 17 In addition, the solution of the lifting hydraulic cylinder controlled by the solenoid valve has been commonly adopted in tractors, which has problems such as slow response time and large shocks. 18
In the past two decades, several researchers have sought to improve the accuracy of TD monitoring and control. In the study conducted by Kim et al., 19 a full-scale soil-tool-machine coupling model based on the coupling of discrete element method and multibody dynamics was established to predict draft force according to TD during tillage operation.20 Survey such as that conducted by Yin et al. has proposed a TD monitoring method based on the attitude estimation of the deep tiller. Field tests revealed that the maximum error of TD detection is 1.18 cm and the average error is less than 0.45 cm. 20 Sabouri et al. developed a depth control system for the subsoiler of the tillage at various depths. For this purpose, an algorithm was written to investigate the subsoiler location and soil compaction. 21 A novelty TD control method based on sliding mode variable structure control with three parameters of resistance, position, and slip rate adjustment was proposed by Yang et al. The experimental results show that the proposed TD control method can take into account both tillage quality and engine load. 22 One significant study by Xia et al. designed a TD monitoring method based on the rotation angle of the suspension lifting arm and the stroke of the hydraulic cylinder. A SIMULINK simulation model was constructed to optimize the PID control parameters. The device ensures a significant reduction in the variation coefficient of TD under various operating conditions. 23
The main problems of previous studies are as follows: (1) So far, however, there has been little discussion about the effect the pitch attitude of the tractor on TD monitoring model. In this way, there may be a large error in the monitoring of TD. (2) The transfer function of the electro-hydraulic system was obtained by the method of mathematical model resolution. The time-varying parameters in the electro-hydraulic system cannot be accurately considered, and the precision of the constructed control function was difficult to meet the requirements. (3) The intelligent control algorithms were not applied to the electro-hydraulic position control system, and load disturbances during the tillage process may greatly affect the control accuracy. In this study, a high-precision TD prediction model was developed based on the inclination of tractor attitude and hydraulic cylinder stroke. The control function of the electro-hydraulic system was accurately solved using the model identification method. Additionally, a FAPID control algorithm was devised to mitigate disturbances caused by soil cutting reaction force and load inertia of the rotary tiller. The tillage depth stability was significantly enhanced as a consequence.
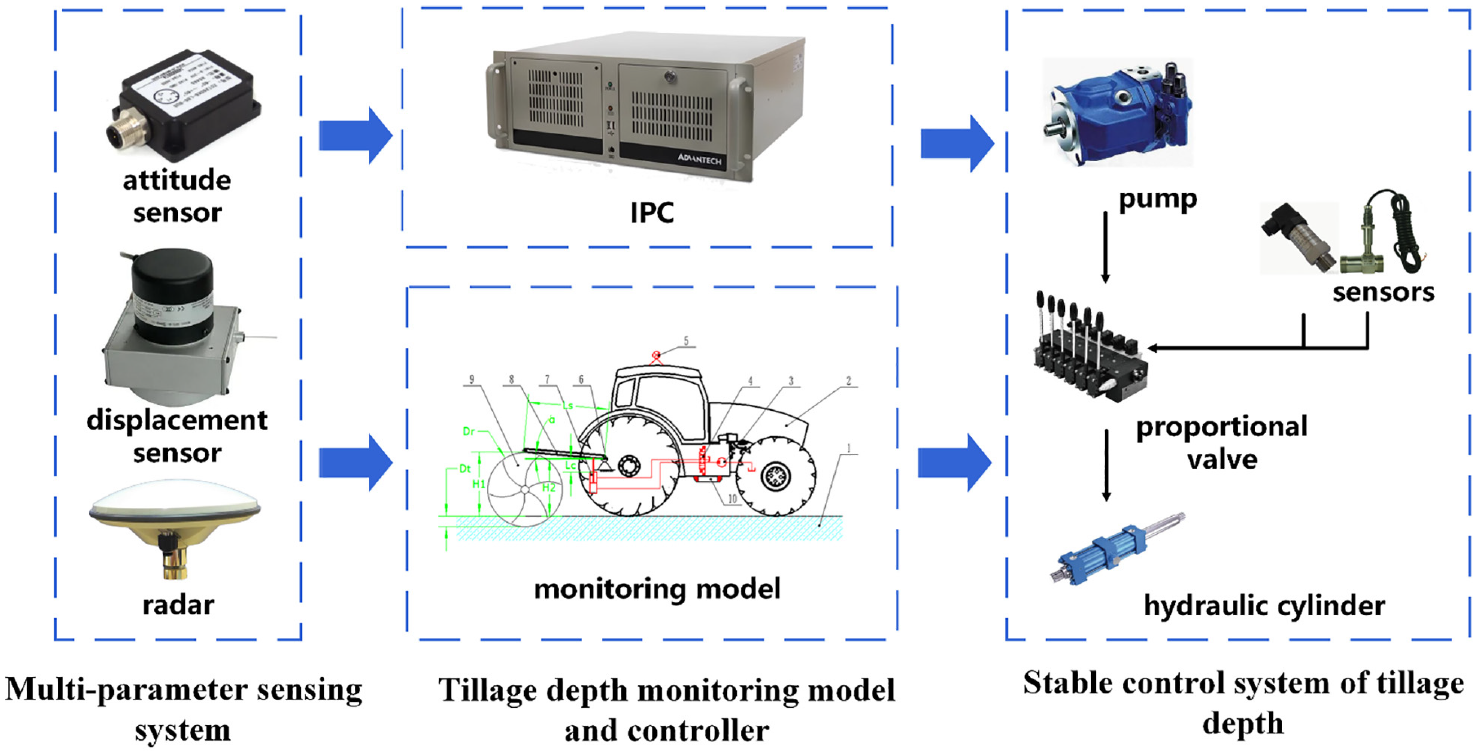
To address the aforementioned challenges, this study presents a TD on-line monitoring model that integrates tractor attitude information. The TD stability control device incorporates multi-sensor information fusion and electro-hydraulic position precision control techniques. A model identification approach is employed to obtain an accurate control function, while a FAPID control strategy is developed to mitigate disturbance signals in the system and enhance control accuracy. The technical flow of this paper is illustrated in Figure 1.
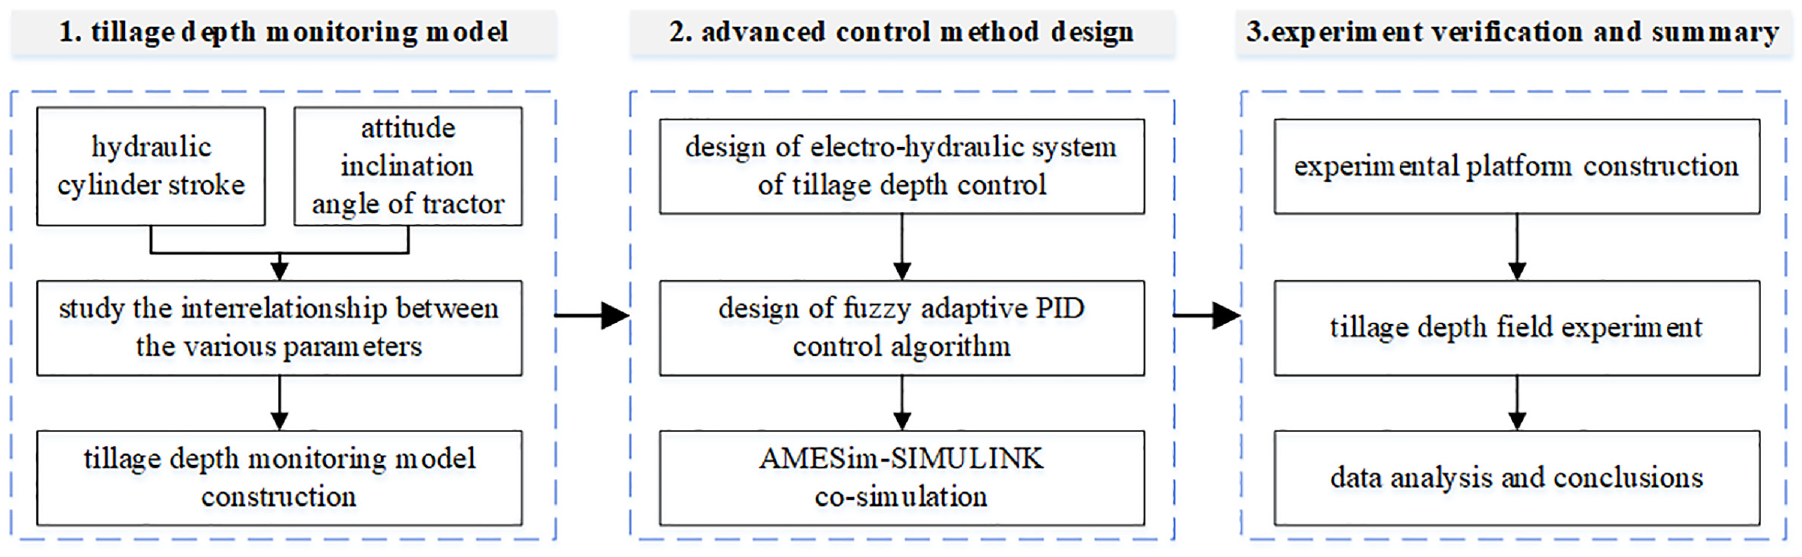
The technical flow of this paper.
TD monitoring model construction
An accurate TD monitoring model should take into account the influence of the suspension hydraulic cylinder stroke and tractor pitch attitude on the TD. In the past, when the hydraulic cylinder is fixed in a certain position, the TD is considered to be constant, and this idea leads to a large TD monitoring error. The schematic diagram of the TD stability control system is shown in Figure 2.
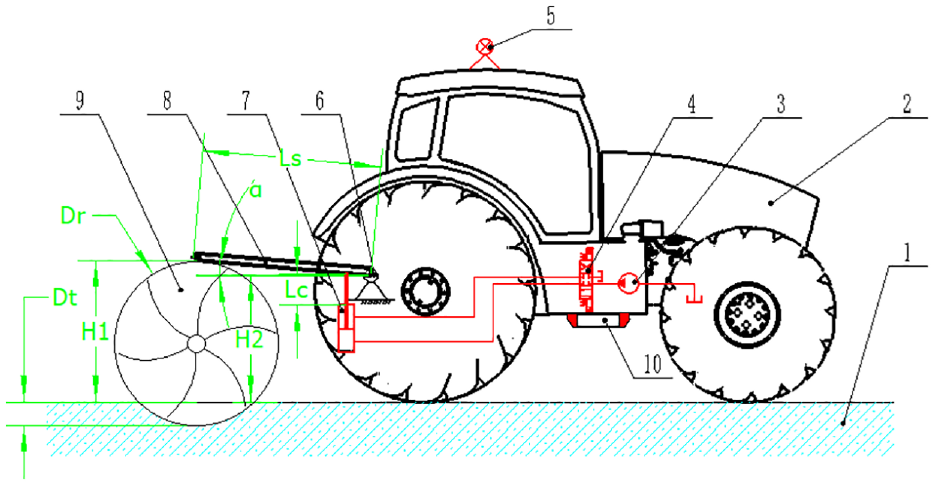
Schematic diagram of the TD control system. 1 – Soil 2 – Tractor 3 – Hydraulic pump 4 – Proportional valve 5 – High precision radar 6 – Lower rod fixing point of suspension 7 – Lifting hydraulic cylinder 8 – Lower rod of suspension 9 – Rotary tiller 10 – Tilt angle sensor.
The TD can be solved according to Formula (1).

Where
For the selected tractor and rotary tiller,
To obtain the relationship between the different parameters, the measurement experiment was carried out. Figure 3 shows the relationship between
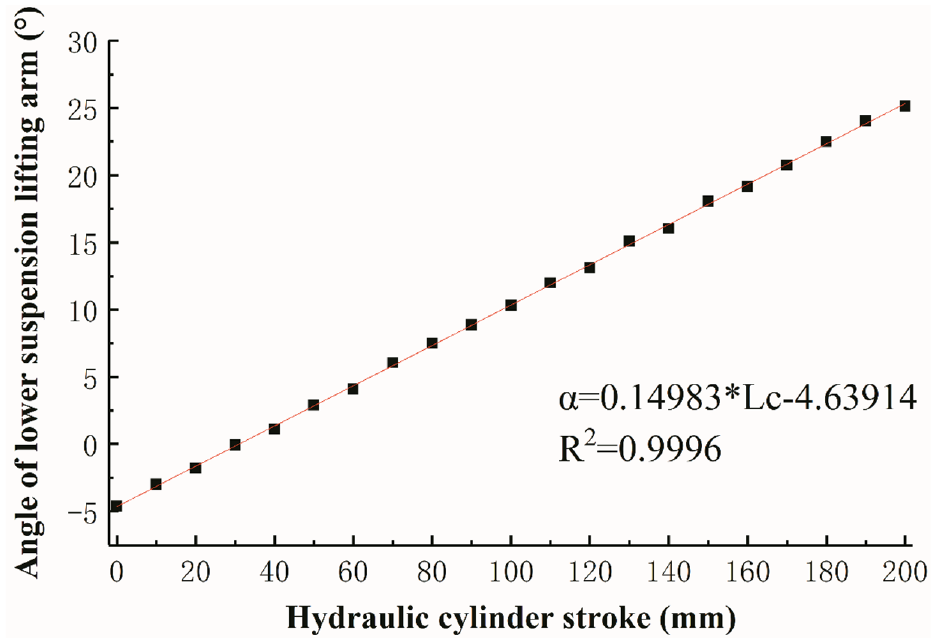
Corresponding relationship between
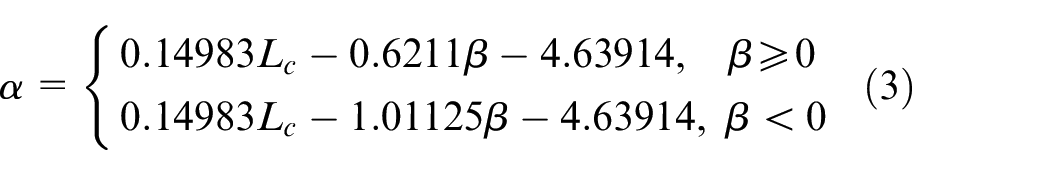
The relationship (formula (2)) between α and

The relationship between the pitch angle (
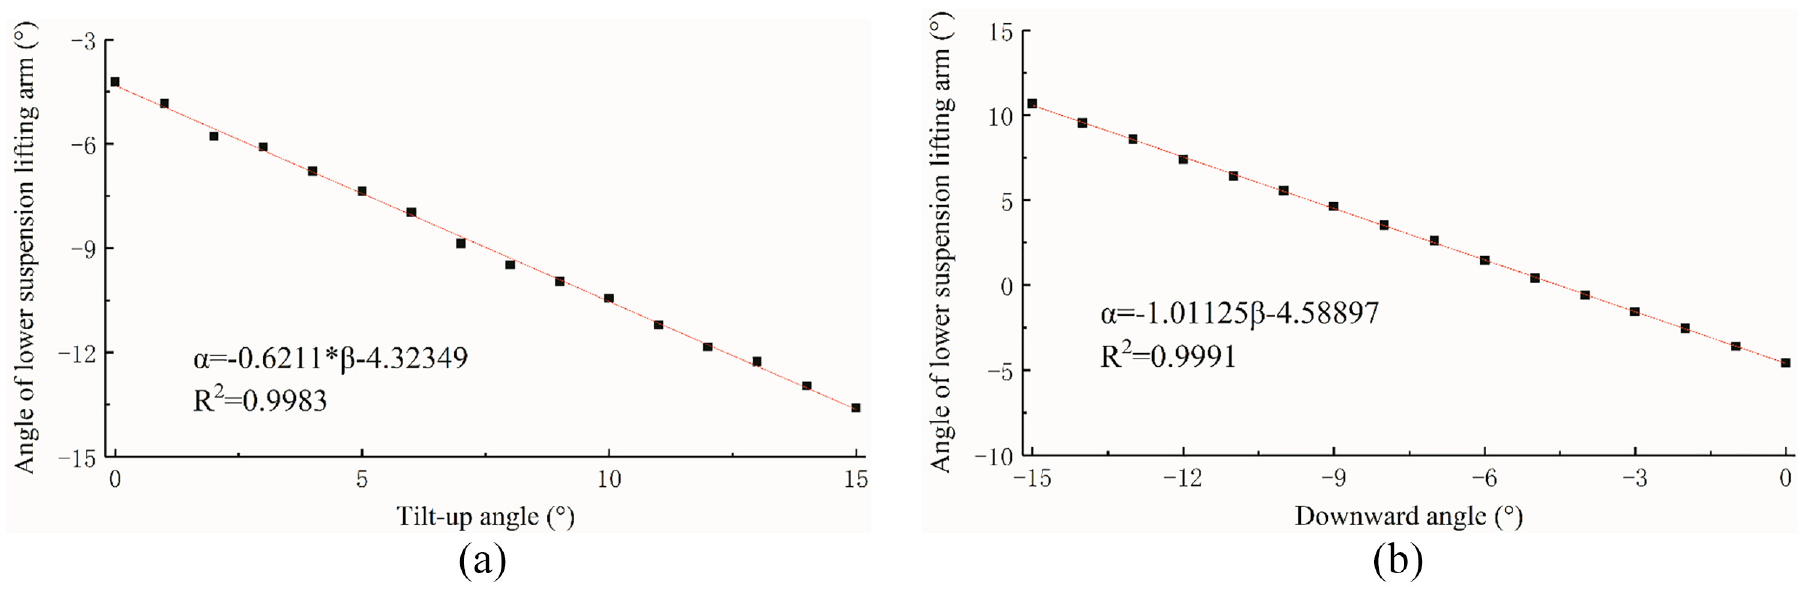
Corresponding relationship between
The function of
The relationship between TD and
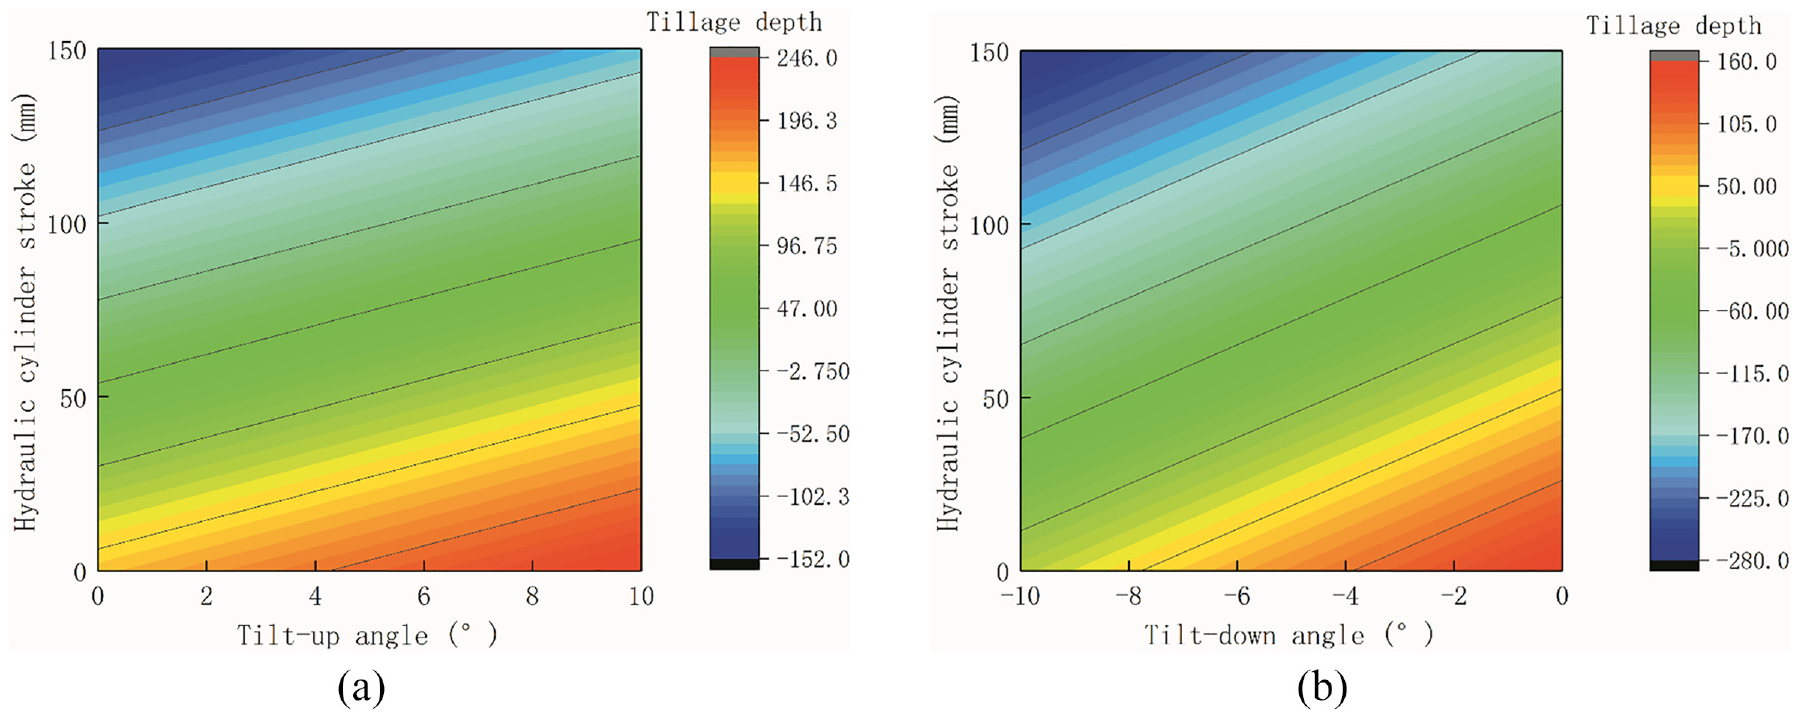
TD under different parameter combinations: (a) in the upward pitch attitude and (b) in the downward pitch attitude.
Control model construction of the electro-hydraulic system
Electro-hydraulic system design
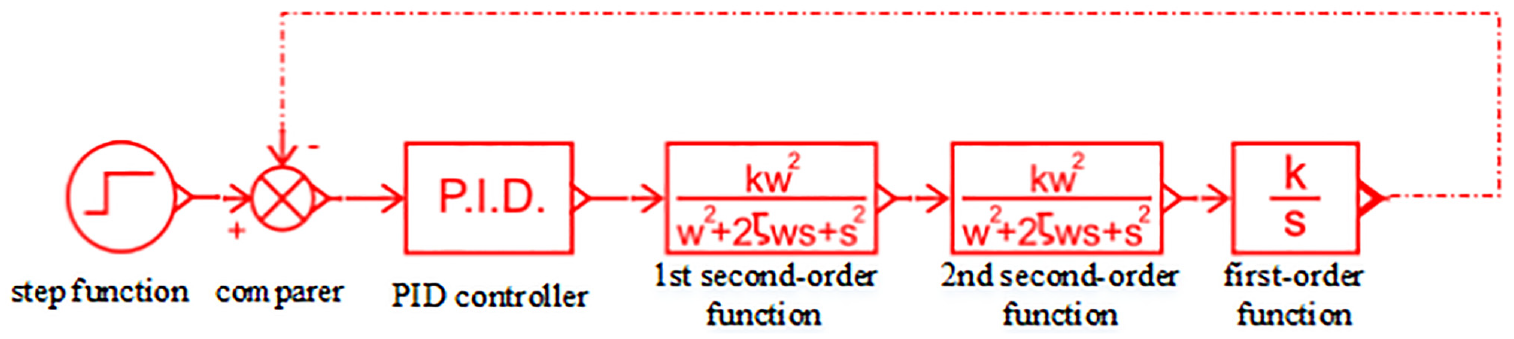
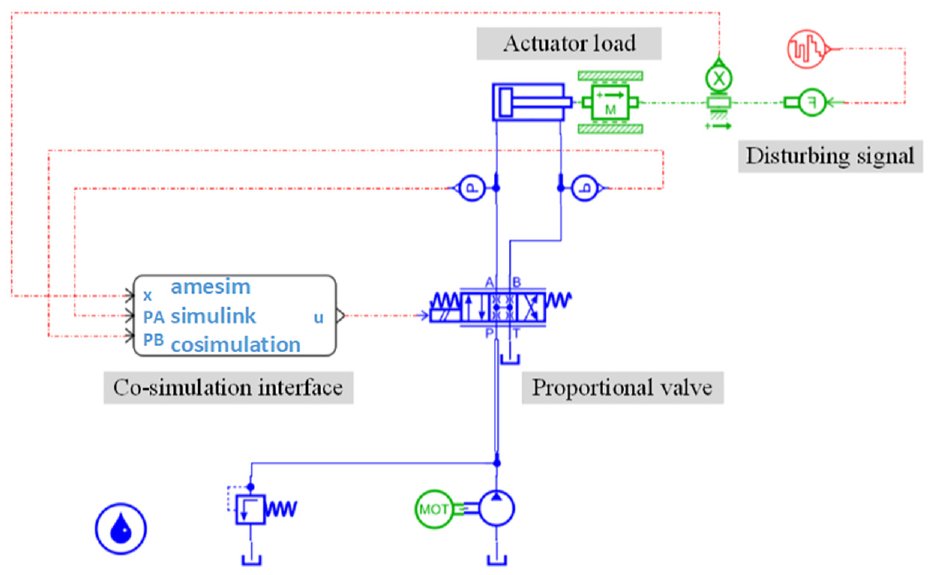
The principle of the electro-hydraulic system is depicted in Figure 6. The engine of the tractor drives the hydraulic pump to rotate to provide power for the hydraulic system. The electronically controlled proportional valve with three-position four-way can adjust the movement direction and speed of the hydraulic cylinder by changing the different working positions and throttle opening. When the electronically controlled proportional valve is in the middle position, the stroke of the hydraulic cylinder is locked and the oil output from the hydraulic pump flows directly back to the tank. In this way, the system heat can be effectively reduced when the hydraulic cylinder is not required to work. A pull-wire displacement sensor is mounted on the hydraulic cylinder to measure its stroke in real time. A safety valve is used to set the maximum operating pressure of the system. When the pressure at the hydraulic pump outlet is higher than the set pressure of the safety valve, the safety valve will be opened to discharge the load to avoid danger. When the attitude sensor detects a change in tractor pitch angle, the controller will adjust the position of the hydraulic cylinder according to the TD prediction model. In this way, the TD can be precisely controlled.
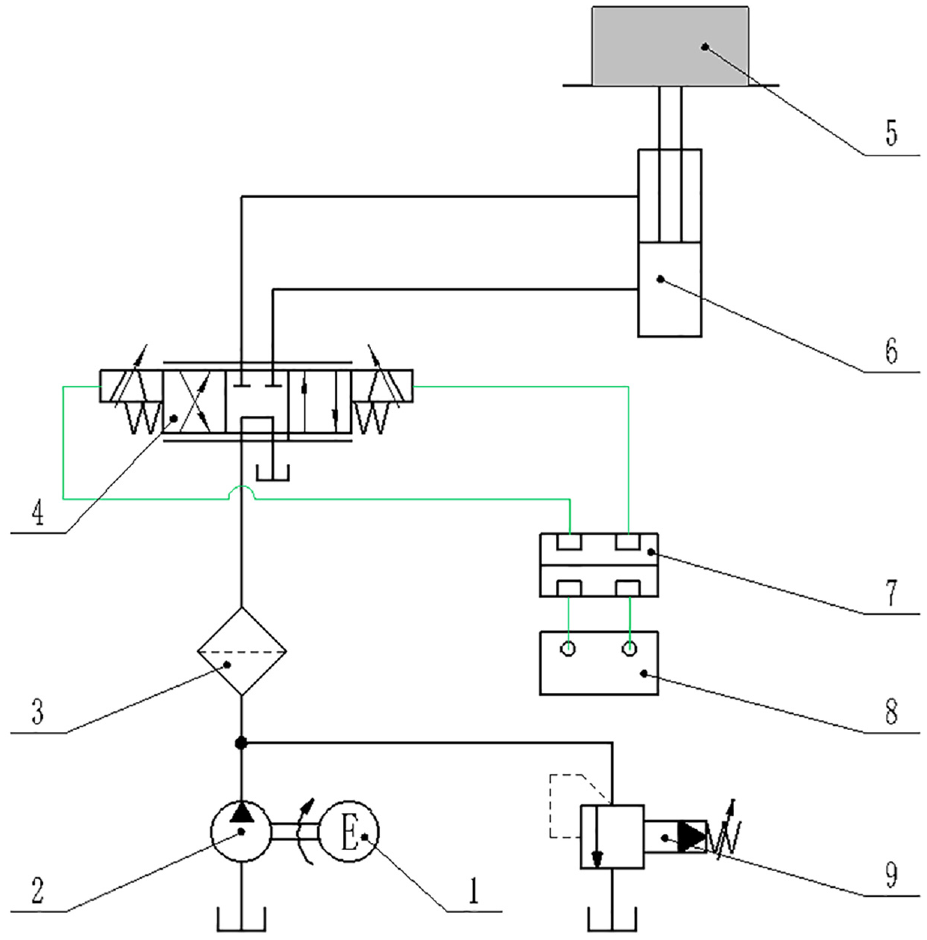
Electro-hydraulic system principle. 1 – Engine 2 – Hydraulic pump 3 – Filter 4 – Electronically controlled proportional valve 5 – Load 6 – Lifting hydraulic cylinder 7 – Proportional amplifier 8 – Controller 9 – Safety valve.
Transfer function identification
It is difficult to obtain the exact transfer function by using mathematical derivation. So, the co-simulation method was adopted for transfer function identification in this study. In the AMESim, the asymmetric hydraulic cylinder controlled by the four-way proportional valve model (Figure 7) was constructed.
Hydraulic system model in AMESim.
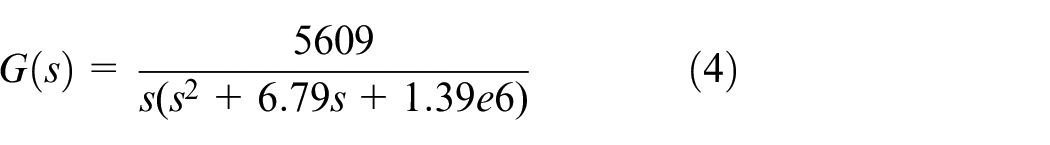
The AMESim simulation was conducted. The simulation time is 10 s and the calculated step time is 1.0 ms. Then the Jacobi data files generated by AMESim calculation were imported into MATLAB to identify the transfer function of the designed electro-hydraulic system. The obtained transfer function from the spool displacement of the proportional valve to the piston displacement of the hydraulic cylinder is shown in Formula (4). 24
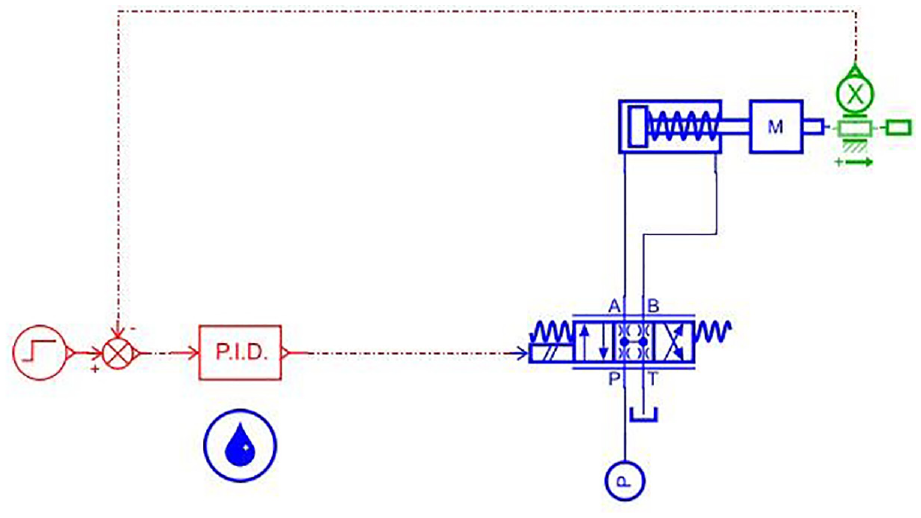
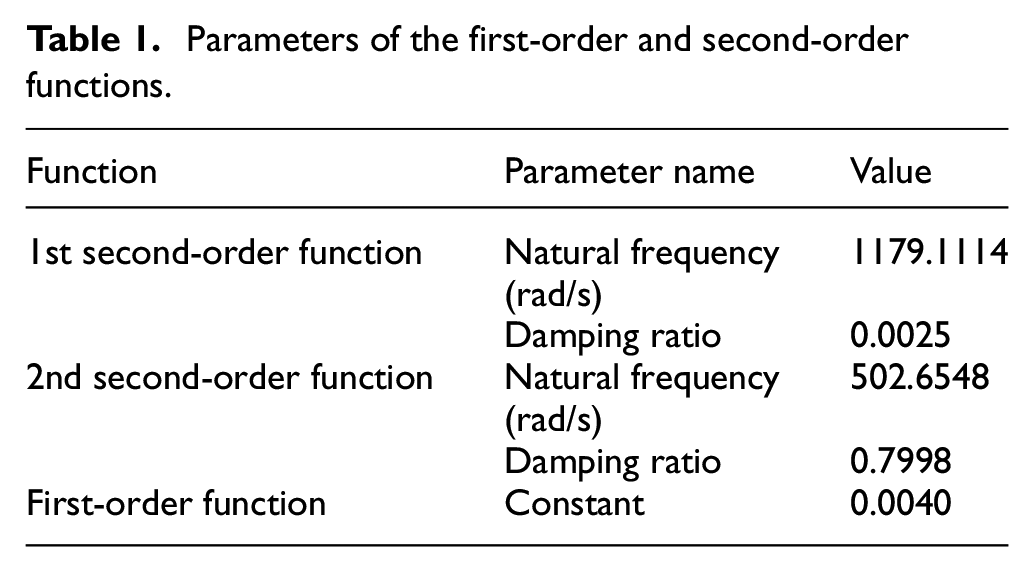
To verify the correctness of Formula (4), an electro-hydraulic control system model (Figure 8) was constructed in AMESim based on the MATLAB solution results. The parameter settings of the first-order and second-order functions are listed in Table 1. The first second-order function is the transfer function from the proportional valve control signal to the spool displacement, and the second second-order function is the transfer function from the spool displacement to the hydraulic cylinder speed. The hydraulic cylinder speed is integrated by a first-order transfer function to obtain its displacement.
Transfer function model of electro-hydraulic control system.
Parameters of the first-order and second-order functions.
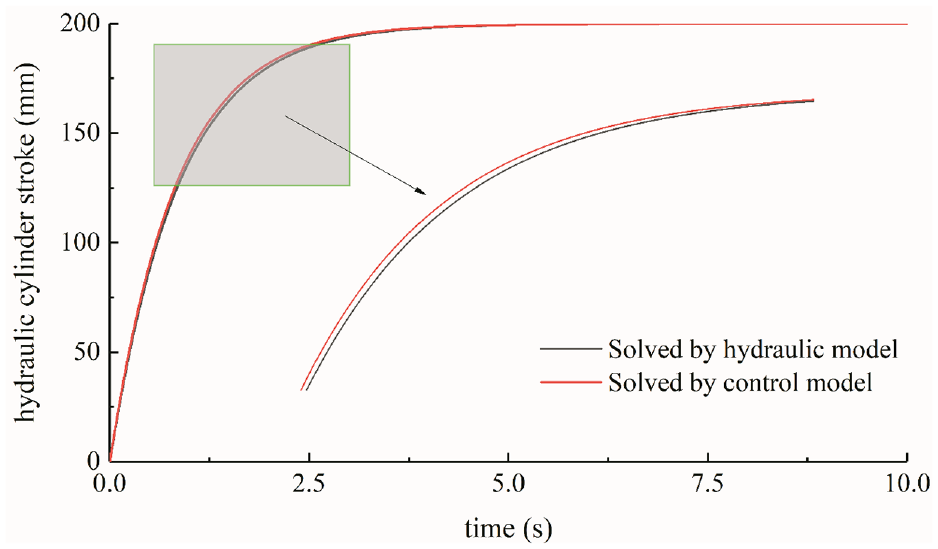
Under the excitation of the step function, the displacement variation curves of the hydraulic cylinder solved by the electro-hydraulic control system (Figure 7) and transfer function (Figure 8) are shown in Figure 9, and the displacement error curve is also shown in Figure 10.
Hydraulic cylinder displacement obtained by two different solution models.
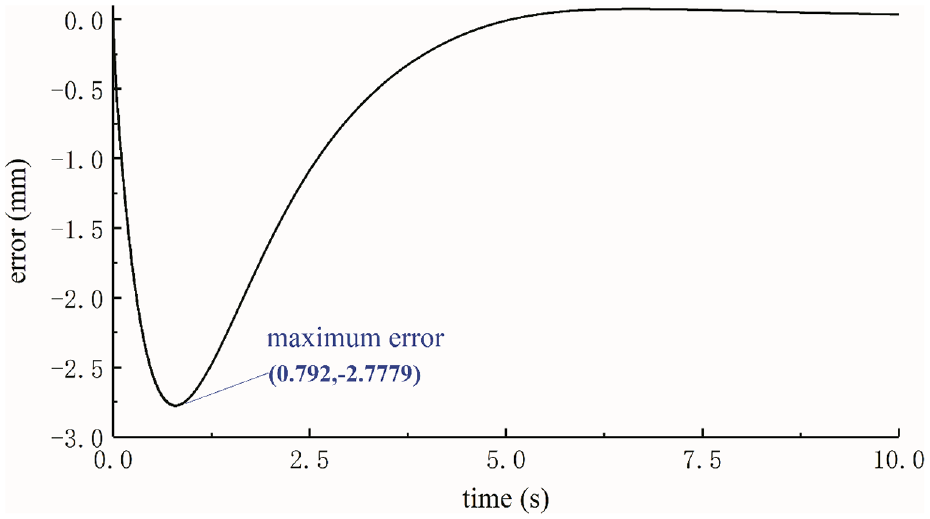
Displacement error of two different solution models.
It is apparent from these two figures that the displacement variation curves of the hydraulic cylinder solved by the two solution models are basically the same. In 0–0.792 s, the hydraulic cylinder displacement error gradually becomes larger, and the maximum error of −2.7779 mm appears in 0.792 s. After 0.792 s, the hydraulic cylinder displacement error gradually becomes smaller. After 6.0 s, the error can be negligible. The results show that the transfer function solved by the model identification method is accurate.
Fuzzy adaptive PID control algorithm
Controller design of fuzzy adaptive PID
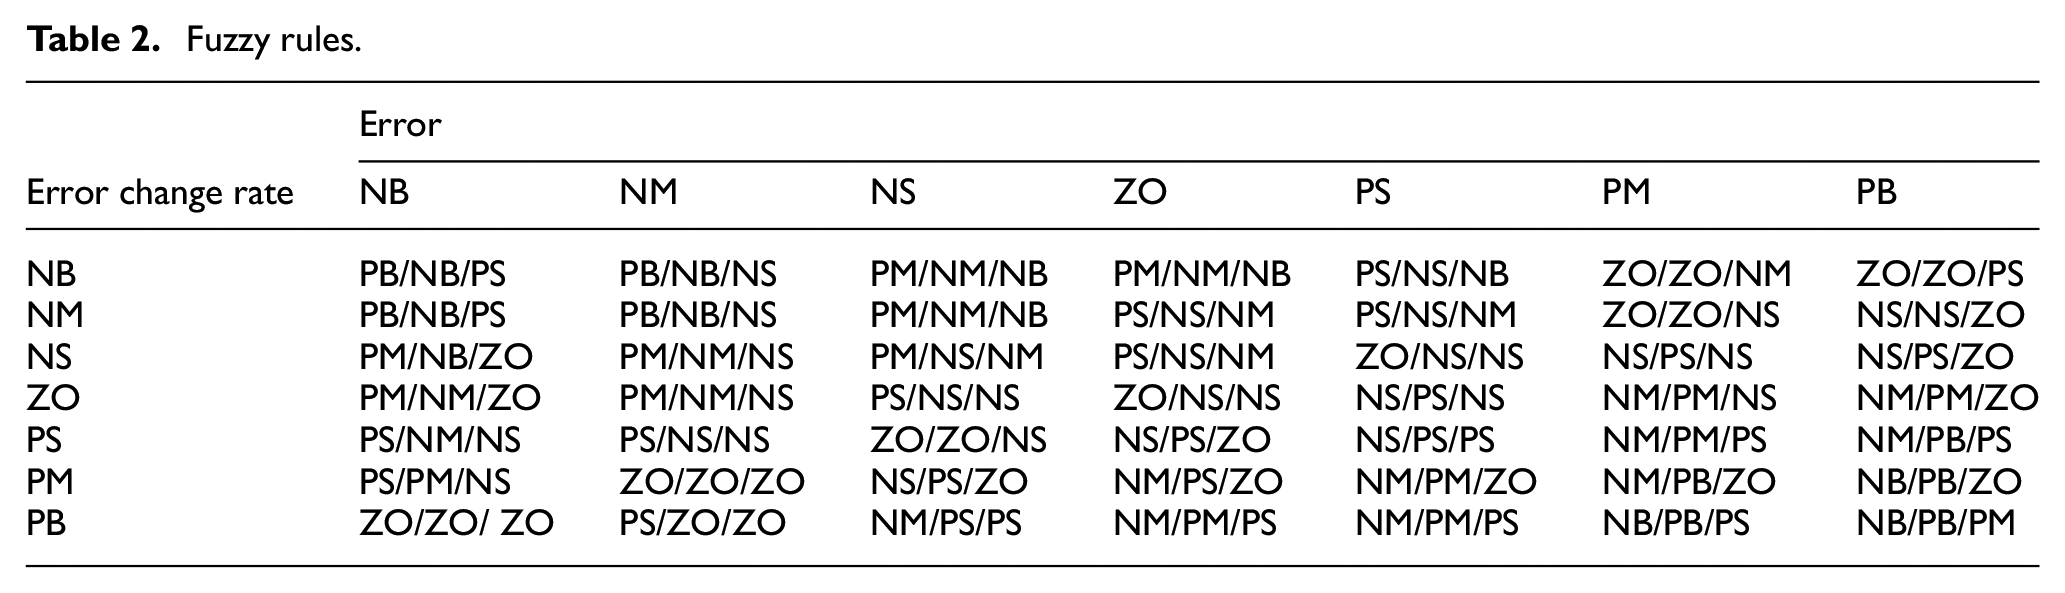
A FAPID algorithm is mainly composed of a fuzzy controller and a PID controller. The error and error change rate are used as the input parameters of the fuzzy controller, and the proportional, integral, and differential parameters of the PID controller are adaptively adjusted by using fuzzy rules.
In this study, 49 fuzzy control rules were developed. The trigonometric membership function was adopted and 7 fuzzification levels were set. They are NB (negative big), NM (negative middle), NS (negative small), ZO (zero), PS (positive small), PM (positive middle), and PB (positive big). The output characteristics of the designed fuzzy rules are shown in Table 2.
Fuzzy rules.
AMESim-SIMULINK co-simulation
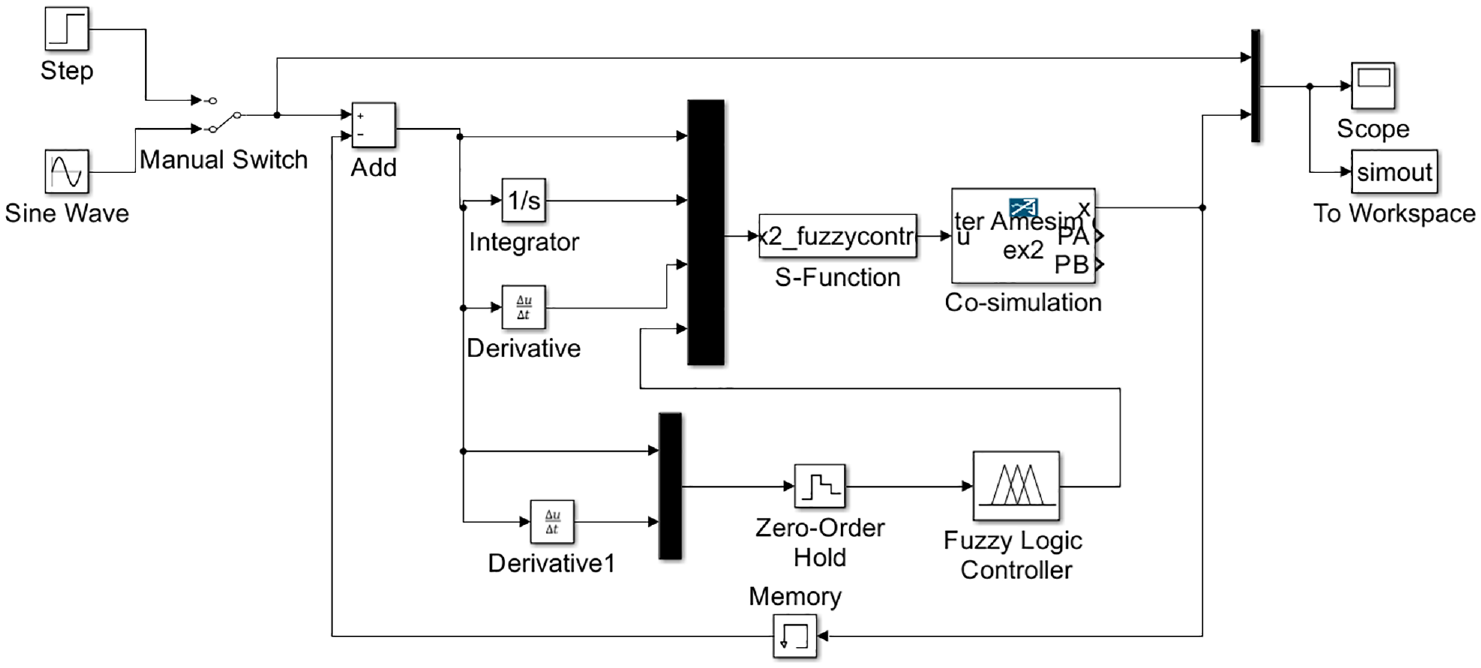
A electrohydraulic simulation model (Figure 11) was developed. The FAPID control model established in the SIMULINK is displayed in Figure 12. The designed control rates based on Table 2 were imported into the established system as a S-function for co-simulation.
AMESim-SIMULINK co-simulation model.
FAPID control model.
The step excitation and sinusoidal excitation were used as the target displacement respectively, the actual displacement curves of the hydraulic cylinder controlled by two different algorithms are shown in Figure 13, and the displacement error curves between the target and actual displacement are shown in Figure 14.
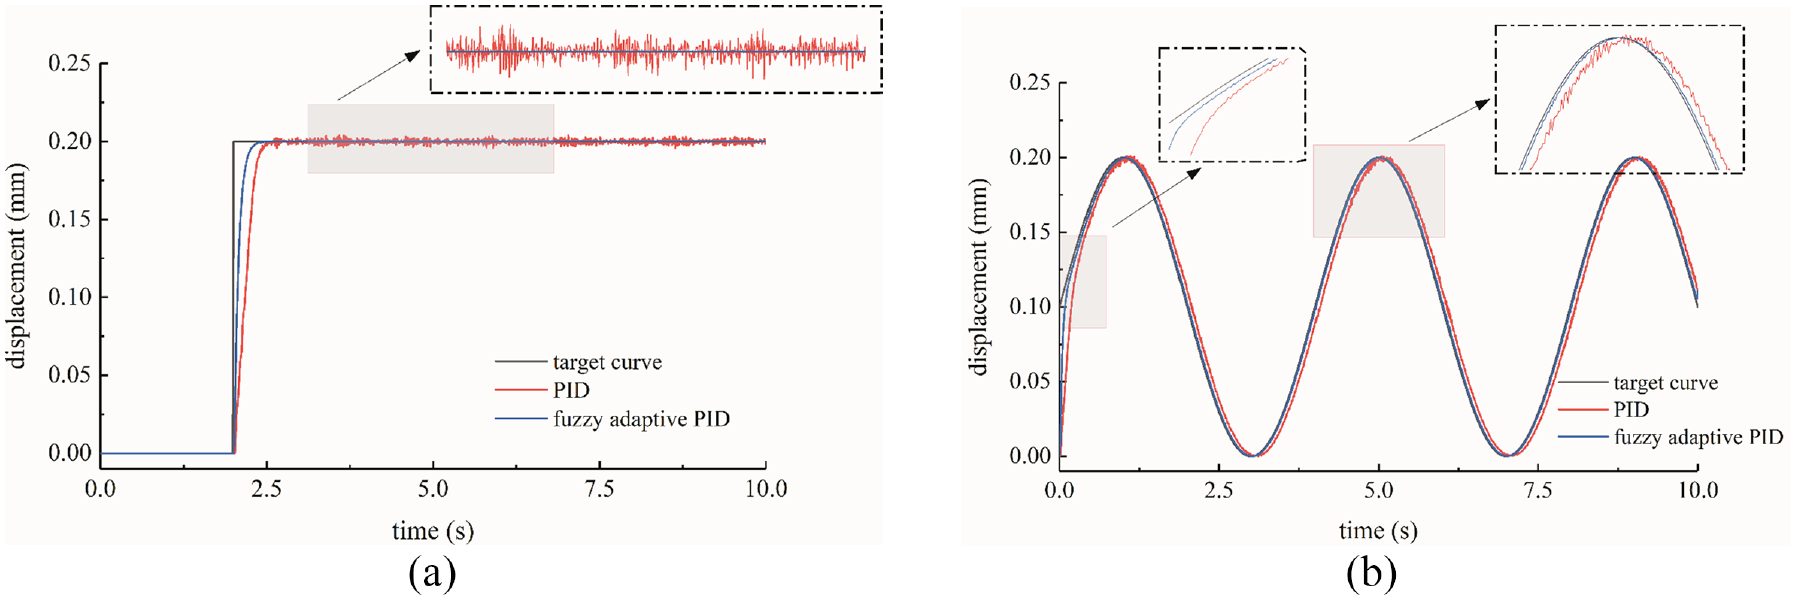
Hydraulic cylinder displacement controlled by two different algorithms: (a) step excitation and (b) sinusoidal excitation.
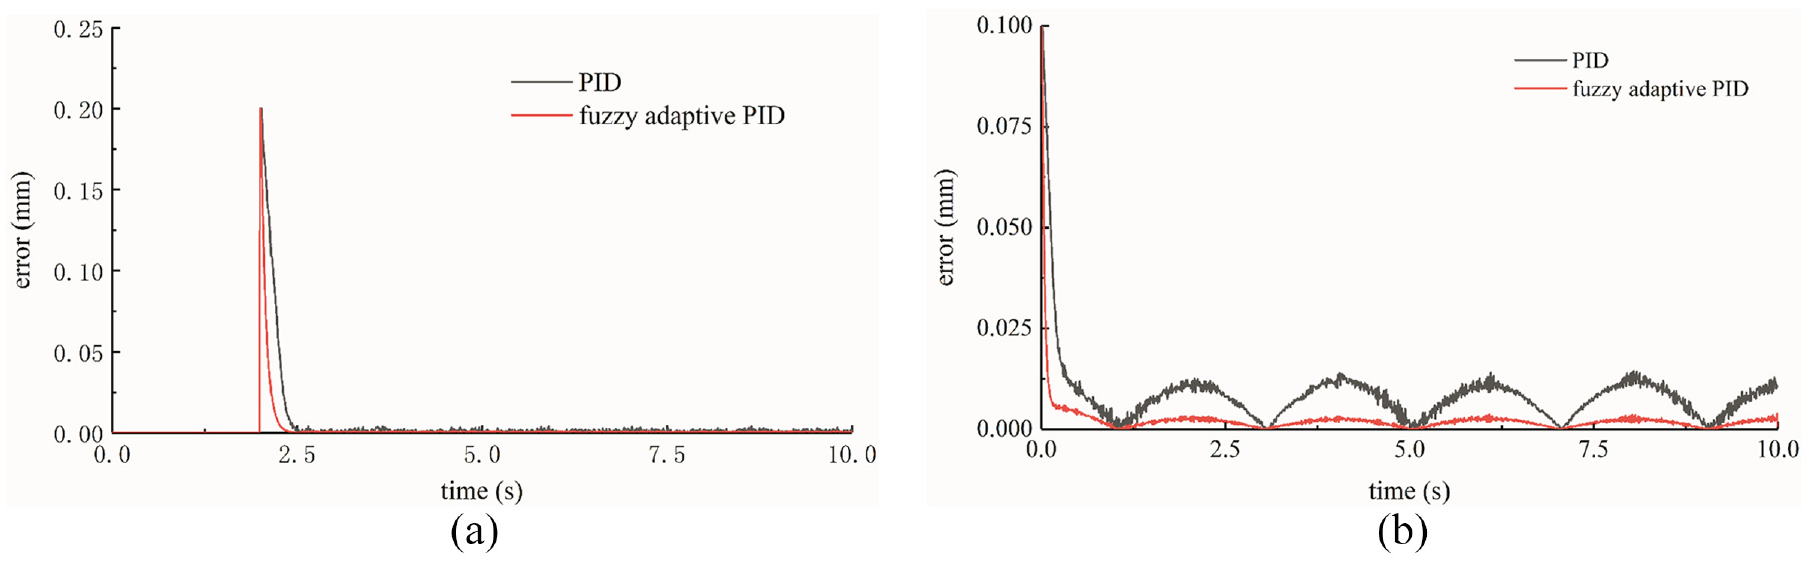
Hydraulic cylinder displacement error controlled by two different algorithms: (a) step excitation and (b) sinusoidal excitation.
What stands out in the figures is that the designed FAPID control provides faster response speed and higher control accuracy for both step and sinusoidal excitation. The rise time of the control system refers to the duration it takes for the response curve to reach 90% of the steady-state value for the first time. Under the step excitation, the rise times of PID and FAPID are 0.34 and 0.17 s, with average error values of 0.0046 and 0.0021 mm, respectively. Under the sinusoidal excitation, the rise times of PID and FAPID are 0.27 and 0.11 s, with average error values of 0.0086 and 0.0023 mm, respectively. The simulation data demonstrate that FAPID exhibits a reduction of over 50% in both rise time and positioning error.
Field measuring experiment of tillage depth
Experimental platform construction
The basic composition of the experimental platform is shown in Figure 15. The attitude sensor is adopted to measure the pitch angle of the tractor, and the displacement sensor is used to determine the stroke of the lifting hydraulic cylinder. The high-precision radar is used to determine tractor position information and walking speed. The industrial personal computer (IPC) has three functions. First, sensor data are dynamically collected into the IPC. Second, the constructed TD monitoring model and the FAPID control strategy are parameterized and stored in the IPC. Third, the IPC is used to dynamically output analog quantities for controlling the motion of the hydraulic cylinder. The hydraulic system mainly consists of a pump, a group of proportional valves, a hydraulic cylinder, and several pressure sensors, etc.
Experimental platform.
Field experiment and data analysis
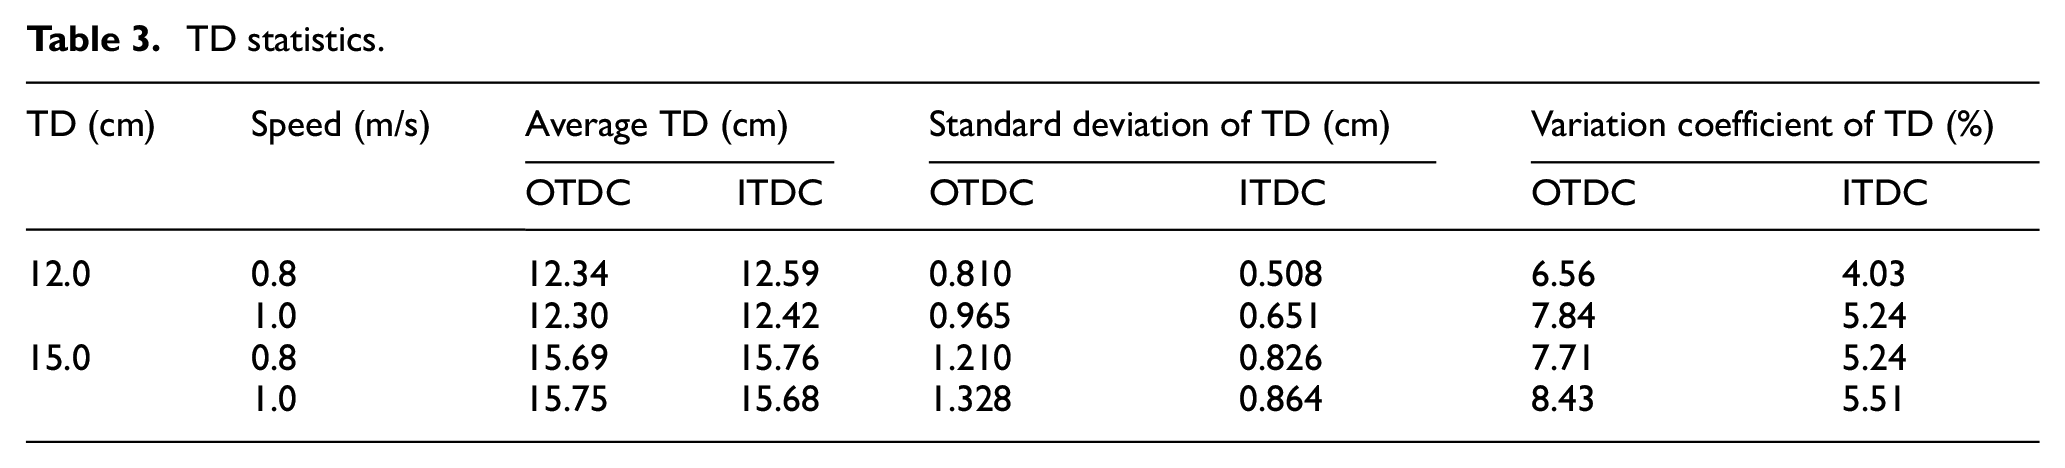
The field experiment was conducted to check the effectiveness of the TD stability control system. The photograph of the measuring experiment is shown in Figure 16. The tractor travel speed was set to two levels: 0.8 and 1.0 m/s, and the target TD was also set to two levels: 12 and 15 cm. The measurement of TD was conducted using a plowing depth ruler and the measurement point was randomly selected at intervals of 2.0 m along the tractor’s direction. The experimental data of the original tillage depth control (OTDC) and the designed innovative tillage depth control (ITDC) are shown in Figure 17, and the statistical analysis data are listed in Table 3.
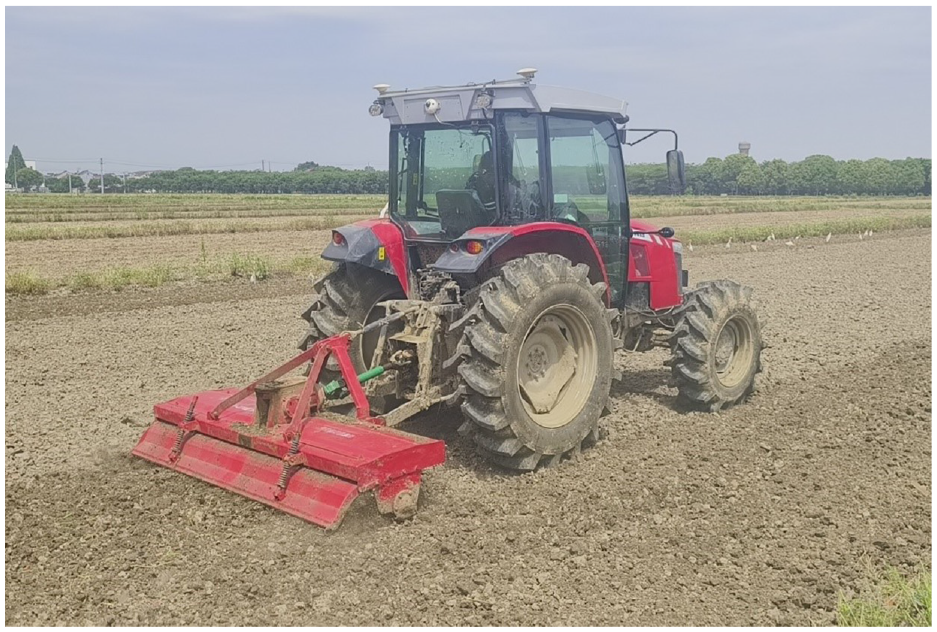
Field experiment of TD measurement.
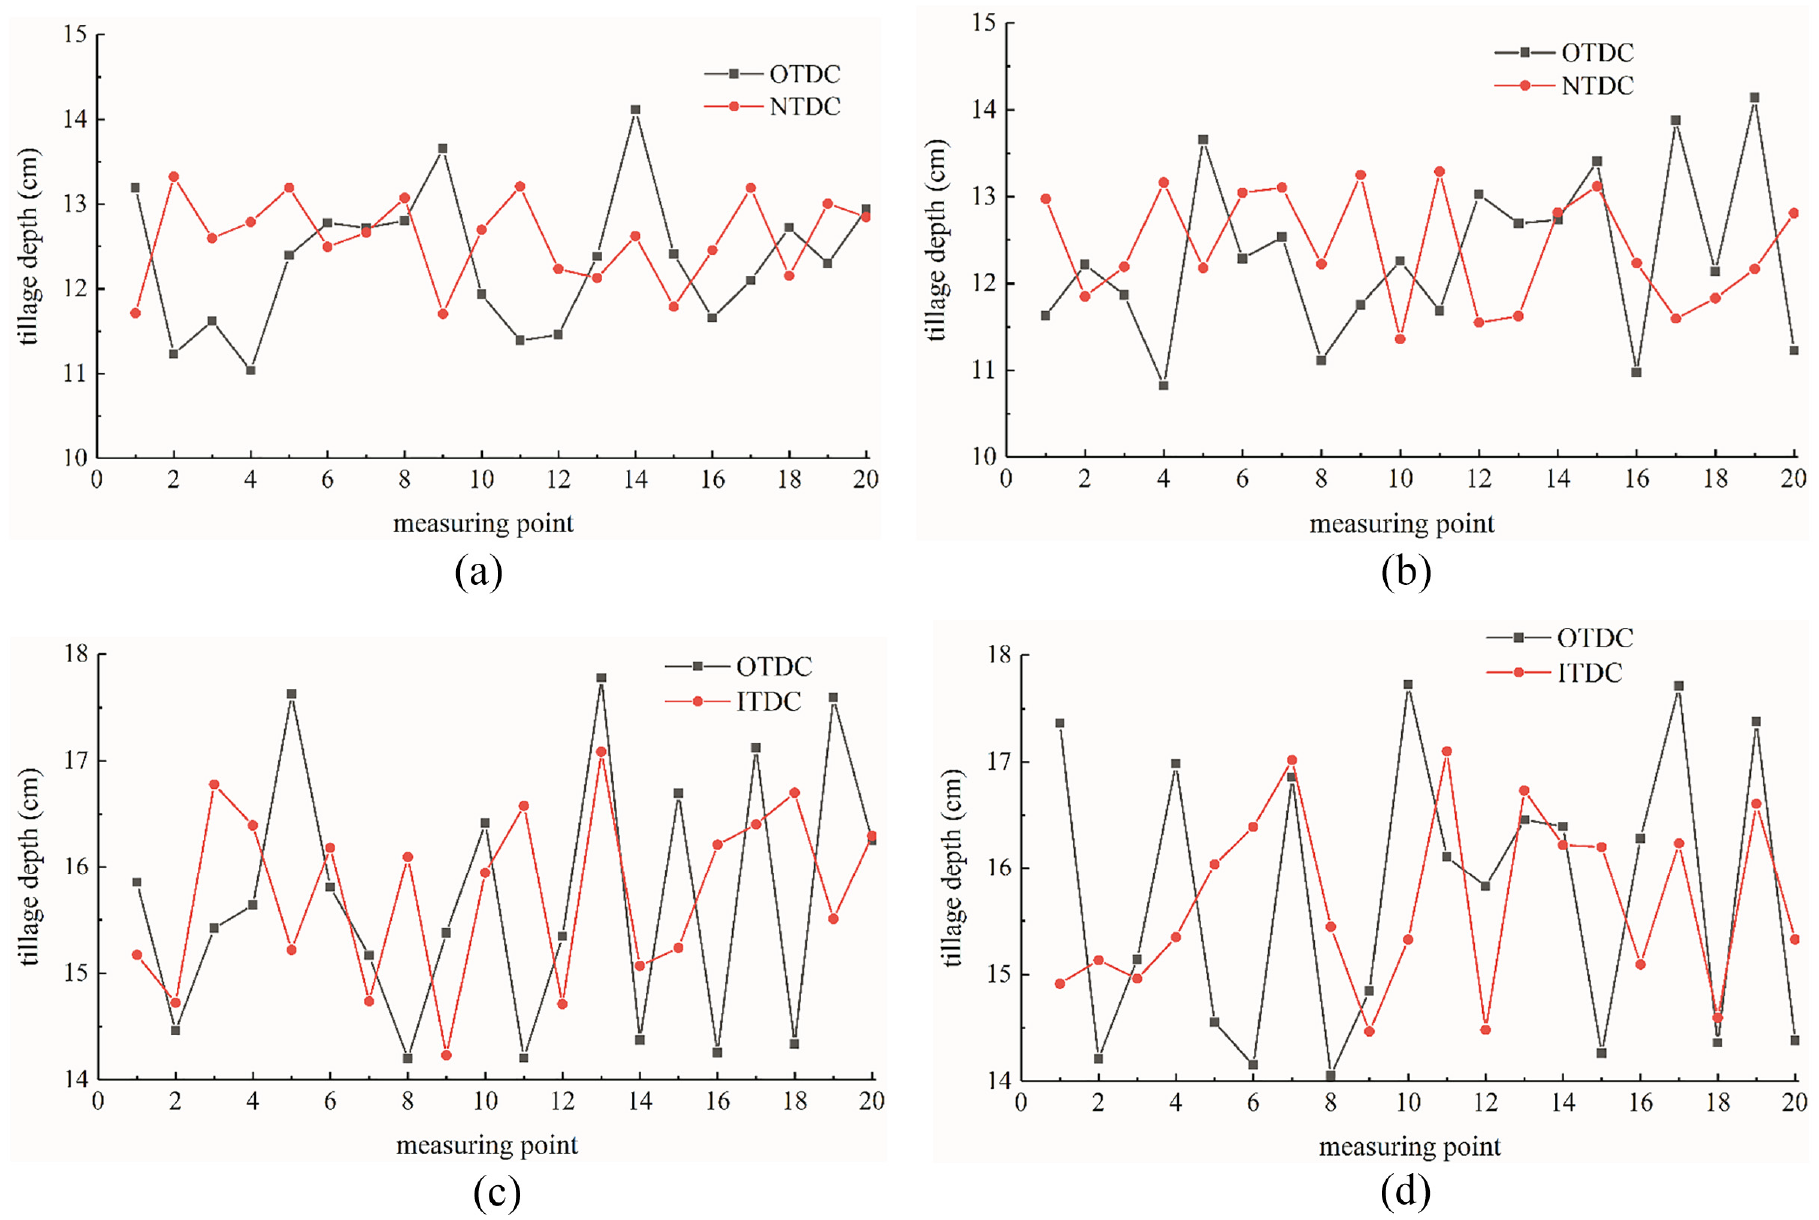
TD at different parameters: (a) speed = 0.8 m/s target TD = 12.0 cm, (b) speed = 1.0 m/s target TD = 12.0 cm, (c) speed = 0.8 m/s target TD = 15.0 cm, and (d) speed = 1.0 m/s target TD = 15.0 cm.
TD statistics.
The formula for calculating the variation coefficient of TD is as follows:
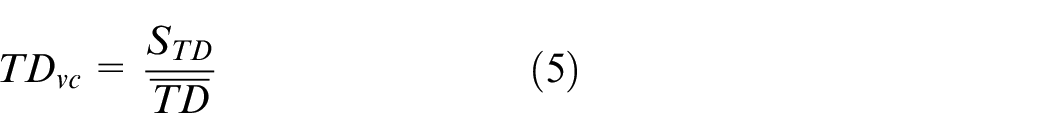
where
These figures and experimental data are quite revealing in several ways. (1) When the operating speed becomes larger, the average TD does not change much, but the standard deviation and variation coefficient increase significantly. (2) The average difference of TD between the two different TD stability control systems is not significant under different operating conditions. However, the standard deviation and variation coefficient of TD with the ITDC system are obviously reduced, which indicated that the fluctuation degree of the TD is weakened. (3) When the target TD is set at 12.0 cm and the operating speed is 0.8 and 1.0 m/s, the ITDC system reduce the standard deviation of TD by 0.302 and 0.314, resulting in a 2.52% and 2.60% reduction in the variation coefficient of TD. When the target TD is set at 15.0 cm and the operating speed is 0.8 and 1.0 m/s, the ITDC system reduce the standard deviation of TD by 0.384 and 0.464, resulting in a 2.47% and 2.92% reduction in the variation coefficient of TD. The improvement effect of the ITDC system on TD is more obvious when the operating speed is higher.
Discussion
Compared with previous research on TD monitoring and precision control, this paper has three innovative points. First, the TD monitoring model constructed in this paper takes into account the influence of tractor attitude on TD, and the influence rules of the hydraulic cylinder stroke and tilt angle of tractor attitude on TD were explored. This means the TD monitoring model constructed in this study has higher accuracy. Secondly, the solenoid valves are mostly used in tractors to control the hydraulic cylinder motion state, while the electro-hydraulic proportional system was employed in this study. In this way, the accuracy of the TD control system is effectively improved and the system impact is small. Last but not least, the FAPID algorithm was developed to resist the influence of load disturbance on the electro-hydraulic control system. The utilization of FAPID control offers a potential advantage over conventional PID control due to its enhanced response speed and superior anti-jamming capability. Compared to the TD control equipment in Hu and Zhang, 24 the present method exhibits a reduction in the variation coefficient of TD by more than 1.0%. Furthermore, when compared to the sliding mode variable structure controlling method proposed in Xia et al., 23 there is a decrease in the standard deviation of TD by over 15%. In future work, some new control algorithms such as sliding mode variable structure should be tried to further optimize the effect of the TD stability control system.
Conclusions
An innovative online monitoring and stability control device for TD was developed and tested in this study. The key findings are as follows. (1) A high-precision TD prediction model based on tractor attitude inclination and hydraulic cylinder stroke was constructed, and the TD variation rules under different parameter combinations were quantified. (2) The tractor attitude and hydraulic cylinder stroke parameters were measured in real-time by inclination and displacement sensors. Based on the constructed TD monitoring model, the TD parameters can be obtained. The controller dynamically adjusts the output signal to the proportional valve to control the motion of the hydraulic cylinder, so that the TD can be guaranteed. (3) The control function of the electro-hydraulic system was solved exactly by the model identification method. Further, a FAPID control algorithm was designed to reduce the disturbance to the electro-hydraulic control system caused by the reaction force of soil cutting and load inertia of the rotary tiller. The co-simulation results demonstrate that the FAPID control can effectively improve the response speed and control accuracy compared with the traditional PID control. (4) The experimental platform was constructed, and then field test trials of TD were conducted. The test results suggest that the standard deviation and variation coefficient of TD increase when the operating speed becomes larger. Under different operating conditions, the TD control device developed in this paper can make the standard deviation of TD reduced by 0.302–0.464 and the variation coefficient of TD reduced by 2.47%–2.92%.
Footnotes
Declaration of conflicting interests
The author(s) declared no potential conflicts of interest with respect to the research, authorship, and/or publication of this article.
Funding
The author(s) disclosed receipt of the following financial support for the research, authorship, and/or publication of this article: This work has been supported by the National Key Research and Development Program of China (Grant no.2021YFD2000401). And partly supported by the Primary Research & Development Plan of Jiangsu Province (Grant no. BE2021308), Innovation Program of Chinese Academy of Agricultural Sciences, and the Modern Agricultural Machinery Equipment and Technology Demonstration and Promotion Project of Jiangsu Province (Grant no. NJ2021-58).
Data availability statement
Data sharing not applicable to this article as no datasets were generated or analyzed during the current study.