
Abstract
A reasonable assessment of microgrid power quality (MGPQ) is essential for ensuring the safe and stable operation of the system. However, due to the complex and variable operating conditions of microgrid (MG), the results of power quality (PQ) assessments are often discrete. Therefore, further research is needed to determine how to accurately estimate the overall PQ of a MG based on these discrete evaluation results. To address this issue, a model for evaluating MGPQ based on confidence estimation using Chebyshev inequality is proposed in this paper. Firstly, Chebyshev inequality is utilized to describe the discreteness of PQ evaluation results in MG. Secondly, the multi-scale adaptive phase number selection CRITIC method and probabilistic statistics method are employed to evaluate the PQ index of the MG under multiple working conditions. Furthermore, sample standard deviation (SD) is used to quantify the dispersion of evaluation results, and a 90% confidence level is used to estimate the confidence interval of multiple evaluation results. Finally, the example presented in this paper demonstrates that at least 90% probability exists for an evaluation result to fall within ±3.16 SDs from its mean. Compared with traditional methods, this paper comprehensively reflects the overall PQ status of MG from three aspects by considering index data characteristics, different time scales, and confidence intervals—providing clear and practical guidance for MG users and managers to ensure safe and stable operation of the MG.
Introduction
In the 21st century, with the continuous development of new energy power generation technology, the distributed generation (DG) has been developed and utilized in more and more countries and regions. However, the direct connection of a large number of DG to the distribution network will put more pressure on the network, including the change of the power flow and the degradation of the level of PQ, which limits the development of DG to a certain extent. Based on the above issues, MG technology has been created. MG, as a kind of power network interconnected by DG, can operate independently as an autonomous system or be connected to the grid. It is a compact power generation and distribution system that incorporates energy storage, load, and other components. 1 It can fully perform the part of distributed power supply, which is beneficial to the improvement of DG grid-connected performance and consumption rate.
A series of PQ issues such as voltage fluctuation, voltage deviation, and harmonics may be induced by intermittent, random DGs and high-proportion power electronic devices in MG, thus affecting the safe and stable operation of MG. Meanwhile, when the MG is operated in parallel with the grid, the power flow direction of the system will also change. Further, the PQ problems in MG and distribution networks will interact and conduct each other.2–4 Therefore, the PQ needs to be evaluated reasonably and accurately in MG, which is one of the key technologies to control the PQ of the MG. In the existing PQ analysis, most of the indexes of PQ are evaluated according to the actual measurement of the system’s electrical operation parameters or the basic data obtained through modeling and simulation, and whether they meet the requirements of the specification is examined and inferred. 5
At present, the methods of PQ assessment for MG mainly focus on the following aspects: On the one hand, assessment techniques similar to those of traditional distribution networks,6–8 such as probabilistic statistics, clustering methods, and indicator weighting methods, are used. Probabilistic statistics is a method to specifically quantify the uncertainty of PQ assessment indicators. Chen et al. 9 used probabilistic statistics to characterize the power uncertainty of traction loads. The clustering methods are based on the idea of “clustering by class,” and the data on PQ assessment index characteristics are clustered and analyzed. Zhong et al. 10 proposed a comprehensive assessment method for steady-state PQ based on quantum clustering to account for the uneven characteristics of steady-state PQ monitoring data. The indicator weighting methods are based on the weighting characteristics of the PQ evaluation indicators, mainly including the subjective weighting method, objective weighting method, and combination weighting method. The subjective weighting approach mainly relies on expert experience to evaluate PQ indicators, which is greatly affected by subjective factors and less objective data are considered. Common methods include the analytic hierarchy process (AHP) method and its improvement methods. 11 Elbasuony et al. 12 adopted the AHP method to define the composite bus PQ indicators to represent the overall PQ performance of the bus in terms of voltage dips, harmonics, and voltage unbalance. The objective weighting method is an approach for determining weights on the basis of the empirical data. The common methods include the entropy measurement method (EMM), the CRITIC method, and the corresponding improvement methods. Zhao et al. 13 utilized the CRITIC approach to estimate the electric energy indicators, and the weights are determined according to the contrast strength of the evaluation indexes and the correlation between the indexes, and the evaluation results are more sensible. Literature14–16 used the combined weighting approach to carry out comprehensive evaluation of electric energy indicators from both subjective and objective aspects, which effectively makes up for the shortcomings brought by using only subjective methods or only objective methods, making the evaluation results are more objective and reasonable. On the other hand, due to the specificity of MG, their PQ has its own characteristics and changing rules. Therefore, MG also has its own assessment methods, utilizing methods such as inverter control and indicator weighting,17,18 Literature 19 made use of the logarithmic correction method to assess and analyze the MGPQ problems. Agundis-Tinajero et al. 20 utilized inverter control to assess harmonic problems in MG. In addition, some experts and scholars have conducted relevant studies on the PQ of single-phase MG and the PQ problems generated by the application of MG in construction and other processes.21–23 In Micallef, 24 an integrated tool that coordinates the generation and load operation of MG is proposed by optimizing energy scheduling and improving PQ, effectively alleviating PQ problems. Although the research on PQ in three-phase MGs is relatively mature, not all solutions are suitable for single-phase MG. Therefore, in Gerber et al., 25 a solution using electric spring technology is proposed to alleviate the PQ problem of single-phase MG through decentralized operation. At the same time, in Thomas et al., 26 the application of MGs is studied in buildings, and the PQ of AC and DC MGs in buildings is improved by measuring the PQ and defining a new voltage quality index. These studies are significant for improving the stability and PQ of MG systems.
The above methods evaluate the PQ of the MG from different aspects, and certain results are obtained. However, due to the randomness and fluctuation of DG output in MG, the change of load in MG also has a significant effect on the performance of network operation, that is, the operating conditions of MG are more numerous and change rapidly, there are certain differences in the PQ of the operating conditions in different time scales, which leads to the fact that the evaluation results may not reflect the whole picture of MGPQ when the same target MG is evaluated once; while when the assessment is conducted by multi-sampling, the difficulty of adopting time scales arises, as well as the fact that the multiple evaluation results may not be fixed parameters but present a strong discretization. The aforementioned issues have a significant impact on the ability to accurately assess the target MGPQ.
In summary, the sampling and evaluation of smaller time scales will bring about the discretization of the evaluation results, while a large amount of data calculation may be caused by the sampling and evaluation of larger time scales, and the characteristics of the different operating conditions are ignored in MG. It is one of the effective methods to reflect the global PQ of the MG by using multiple evaluations and conducting statistical confidence estimation based on multiple evaluation results. However, there are still some problems that have not been involved and solved. Few studies have probed into this aspect at present, and further research is needed.
To this end, this study is intended to explore the aforementioned issues, proposing a confidence assessment model for MGPQ based on Chebyshev inequality. By using Chebyshev inequality to effectively portray the degree of dispersion of the multiple assessment results of the MG and make interval estimation, this confidence interval is a comprehensive assessment of the multiple assessment results and is a confidence result, that is, each confidence interval is obtained according to the probability. It can well reflect the global characteristics of MGPQ.
Microgrid power quality analysis and evaluation process
The structure and principle of microgrid
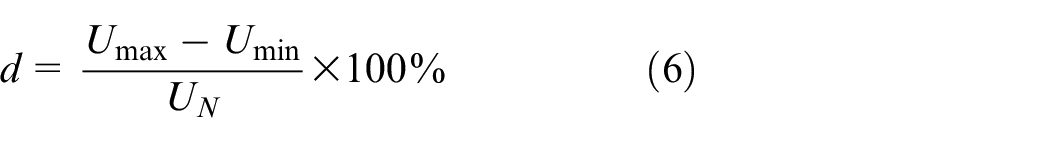
MG is composed of DG, load, power electronic converter, energy storage device, etc., and forms a small power supply and use system through reasonable control. 27 It can not only operate as a small power grid but also as an organic unit of a large power grid. With the continuous development of MG technology, its structure is diversified and classified as AC, DC, and AC/DC hybrid MGs. Compared with the other two types of MGs, the development of AC MGs is more mature,28–30 and its structure diagram is illustrated in Figure 1.
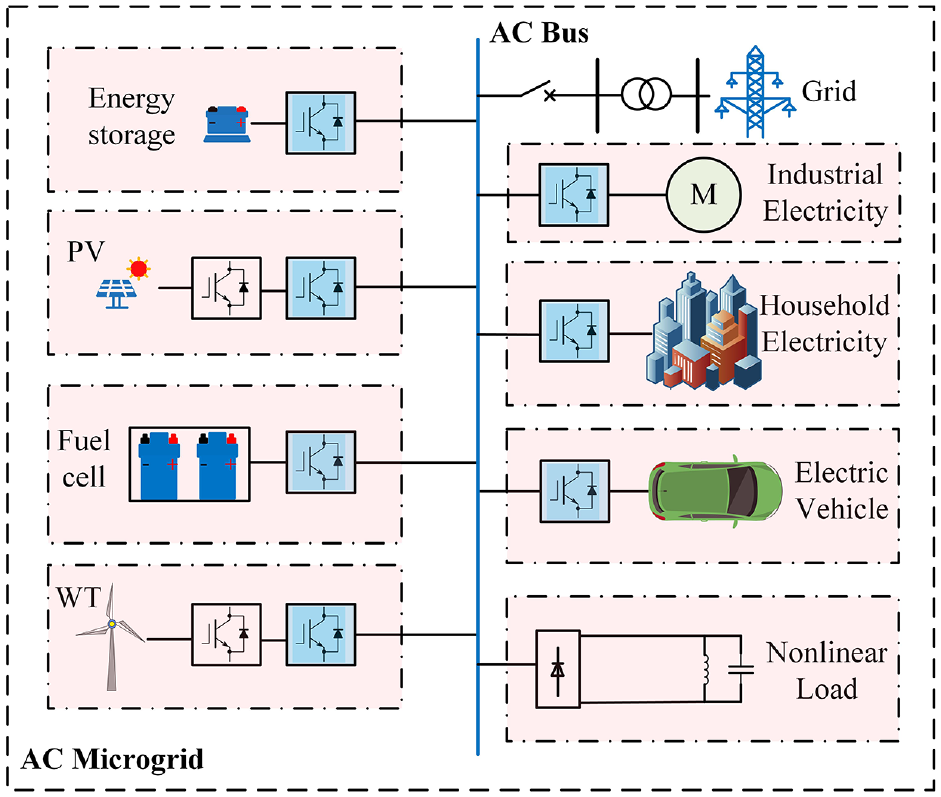
AC microgrid structure diagram.
As depicted in Figure 1, the MG contains a great deal of weak inertia and intermittent DGs, as well as various forms of loads are incorporated into the MG. These DGs and loads will bring significant challenges to MGPQ when they are cut into and cut out. They may result in issues including three-phase unbalance, voltage fluctuation, and voltage deviation. The randomness and volatility of the production of solar and wind energy might contribute to the output power fluctuation, which will give rise to voltage fluctuation and flicker in the MG system. In addition, the input and use of high-proportion power electronic equipment will bring harmonic problems to the MG system, as well as voltage unbalance and harmonic problems when unbalanced and nonlinear loads exist. Consequently, it is essential to analyze and control the PQ within the MG. An accurate and reasonable valuation of PQ is a vital reference for MGPQ governance.
Traditional power quality valuation process and system for microgrid
The traditional PQ valuation of MG is a process of evaluating the various indexes of PQ after analyzing the basic parameters such as system voltage and current. One of the crucial steps is the construction of a MGPQ evaluation index system, which is generally established by the typical PQ problems in MG, for instance, voltage deviation, three-phase imbalance, voltage fluctuation, etc. The analysis and definition of typical PQ indexes are as follows:
In the islanded MG, the inverter adopts droop control, or when the reactive power in the overall system is unbalanced, the voltage deviation problem will be caused. Here is the definition formula 31 :
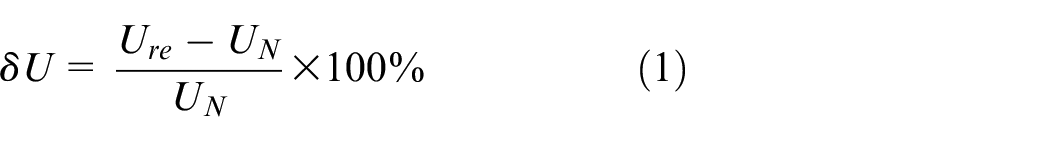
where
When the MG’s active power is out of balance, the system frequency might be caused to deviate, which can be defined by the following formula 32 :

where
When the three-phase load is unbalanced in the MG system, the three-phase imbalance phenomenon will be caused. The three-phase unbalance is usually described by the index three-phase voltage unbalance degree
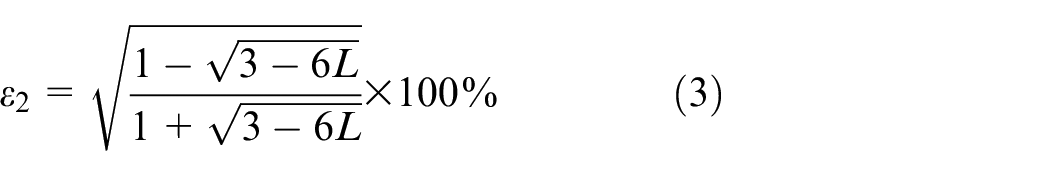
The formula for L in equation:
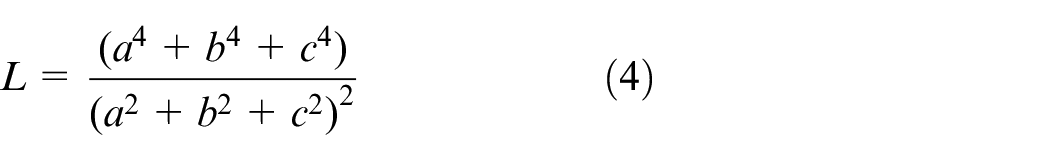
where a, b, and c stand phase number A, B, and C of the triphase voltage of the MG, respectively.
The harmonic currents or voltages will be caused by the power electronic converters and nonlinear loads in a MG. Generally, the harmonic distortion rate
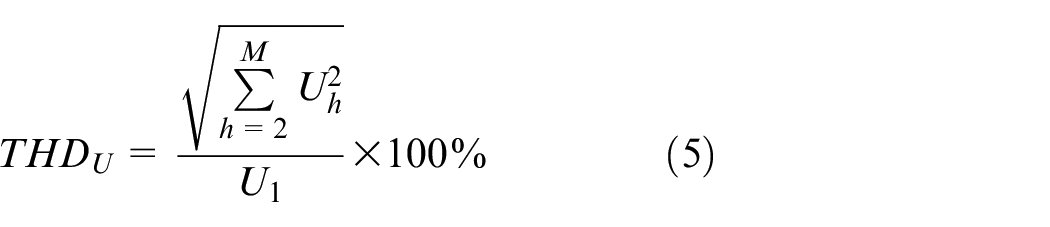
where
The cut-in and cut-out of distributed generation in a MG, or the rapid fluctuation of output power, will cause voltage fluctuation
where
Proposed confidence evaluation method of microgrid power quality based on Chebyshev inequality
It is evident from Figure 2 that the MG exhibits low inertia and weak anti-disturbance ability. When the MG system is subjected to intermittent and random micro-source output fluctuations and load impacts, its uncertainty is increased considerably. The working conditions of MG are varied and complicated relative to the traditional distribution network, and the PQ under different operating conditions is quite different. Therefore, a single sampling and evaluation is challenging to fully depict the overall PQ for MG, and the time scale of the sampling is difficult to determine, such as a week or a month. When the PQ in MG is estimated by multiple sampling, the evaluation result variables are no longer constant, but are discrete and randomly varying, and distributed in a certain range near the mean value.
Microgrid schematic diagram.
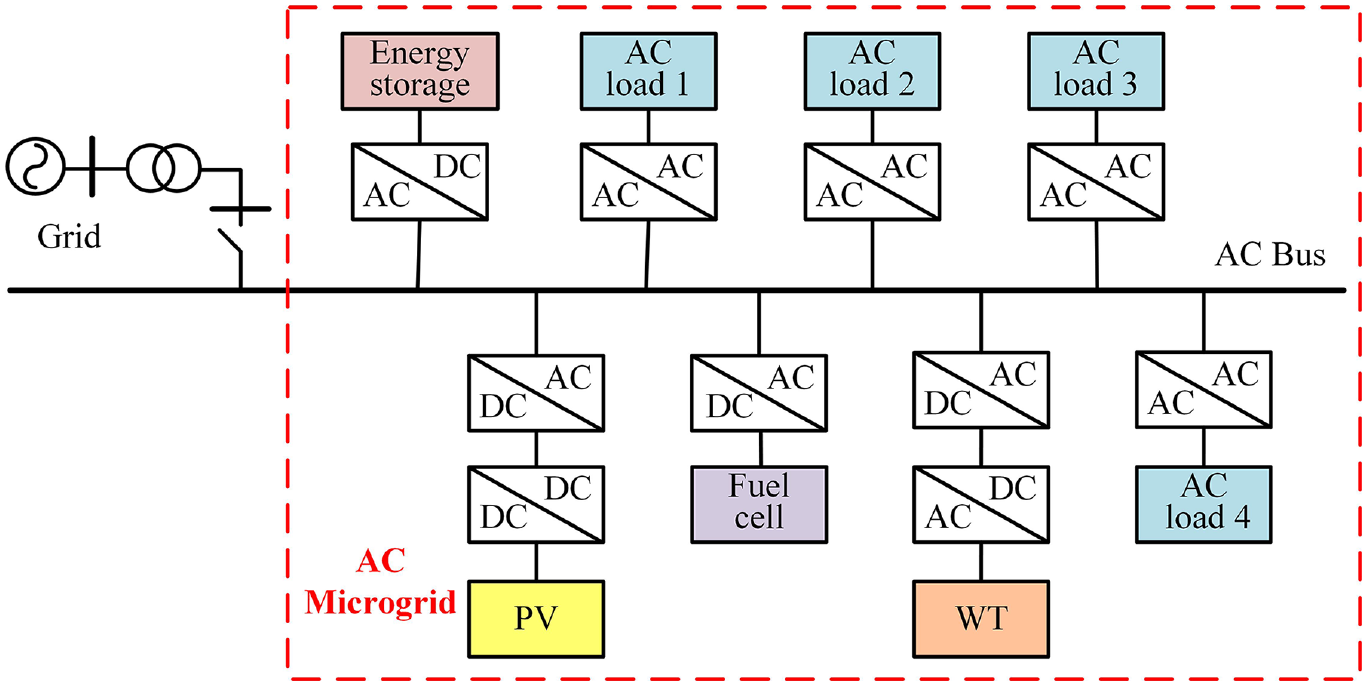
To reflect the global assessment results of the PQ in MG, the confidence assessment can be used to quantify the change in the power index assessment results caused by uncertainties in MG. In the commonly used confidence evaluation, Chebyshev inequality applies to the variable evaluation of any distribution, and the confidence interval of the mean value of the sample (N < 30) at a certain confidence level can be roughly estimated. 35 Therefore, this paper evaluates the confidence of PQ evaluation results for MG using Chebyshev inequality, solves the problem that the evaluation results are discrete, and realizes a reasonable global evaluation of MGPQ. The overall estimation process is depicted in Figure 3.
Microgrid power quality assessment flow chart.
As shown in Figure 3, firstly, the maximum severity of the PQ index in the three-phase system is reflected by quantifying the PQ index of different time scales and combining the phase number with the adaptive control idea. Then, the weights and grades are determined by the improved CRITIC method and probabilistic statistics, and the PQ evaluation results of MG are obtained. On this basis, multiple samples were collected and evaluated. Finally, the confidence interval reflecting the whole PQ of MG is obtained by using Chebyshev inequality to estimate the PQ of MG.
Weight calculation in confidence evaluation
In the paper, the improved CRITIC approach is utilized to estimate the weight of the PQ indicators in the confidence evaluation process of Chebyshev inequality. The conventional CRITIC approach is an objective weighting approach for studying the interaction of indexes. It determines the weight according to the conflict and the contrast strength among evaluation indexes. The conflict among indexes is described by the correlation coefficient, and the contrast strength is expressed by the SD. Although this method can well reflect the index information, it also has the following shortcomings:
The size of the correlation degree of the indicators is only reflected by the correlation coefficient and has nothing to do with its positive and negative signs. Therefore, it is more suitable to use the absolute value to reflect the conflict between the indicators than the traditional CRITIC method.
The SD is greatly affected by the extreme value when reflecting the degree of change of the index data, which will cause a large error in the PQ evaluation results, while the average difference is less affected by the extreme value, so the average difference is used to represent the contrast strength between the indexes.
The traditional CRITIC method mostly adopts the single-phase detection method when collecting the PQ index data, which fails to take full account of the influence of the PQ indicators of the three-phase system, and the most serious phase problem of the power index in the MG is easy to be ignored.
Although the traditional CRITIC method can effectively reflect the conflict and contrast strength between indexes, the discreteness of indicators is not sufficiently considered.
Therefore, the evaluation method proposed in this paper introduces the adaptive control idea in the initial weight determination part. This allows for the adaptive selection of the most severe phase of voltage deviation, harmonics, voltage fluctuation, and other indicators. 36 The goal is to accurately identify the most serious phase of PQ index in a three-phase system, reflecting its severity.
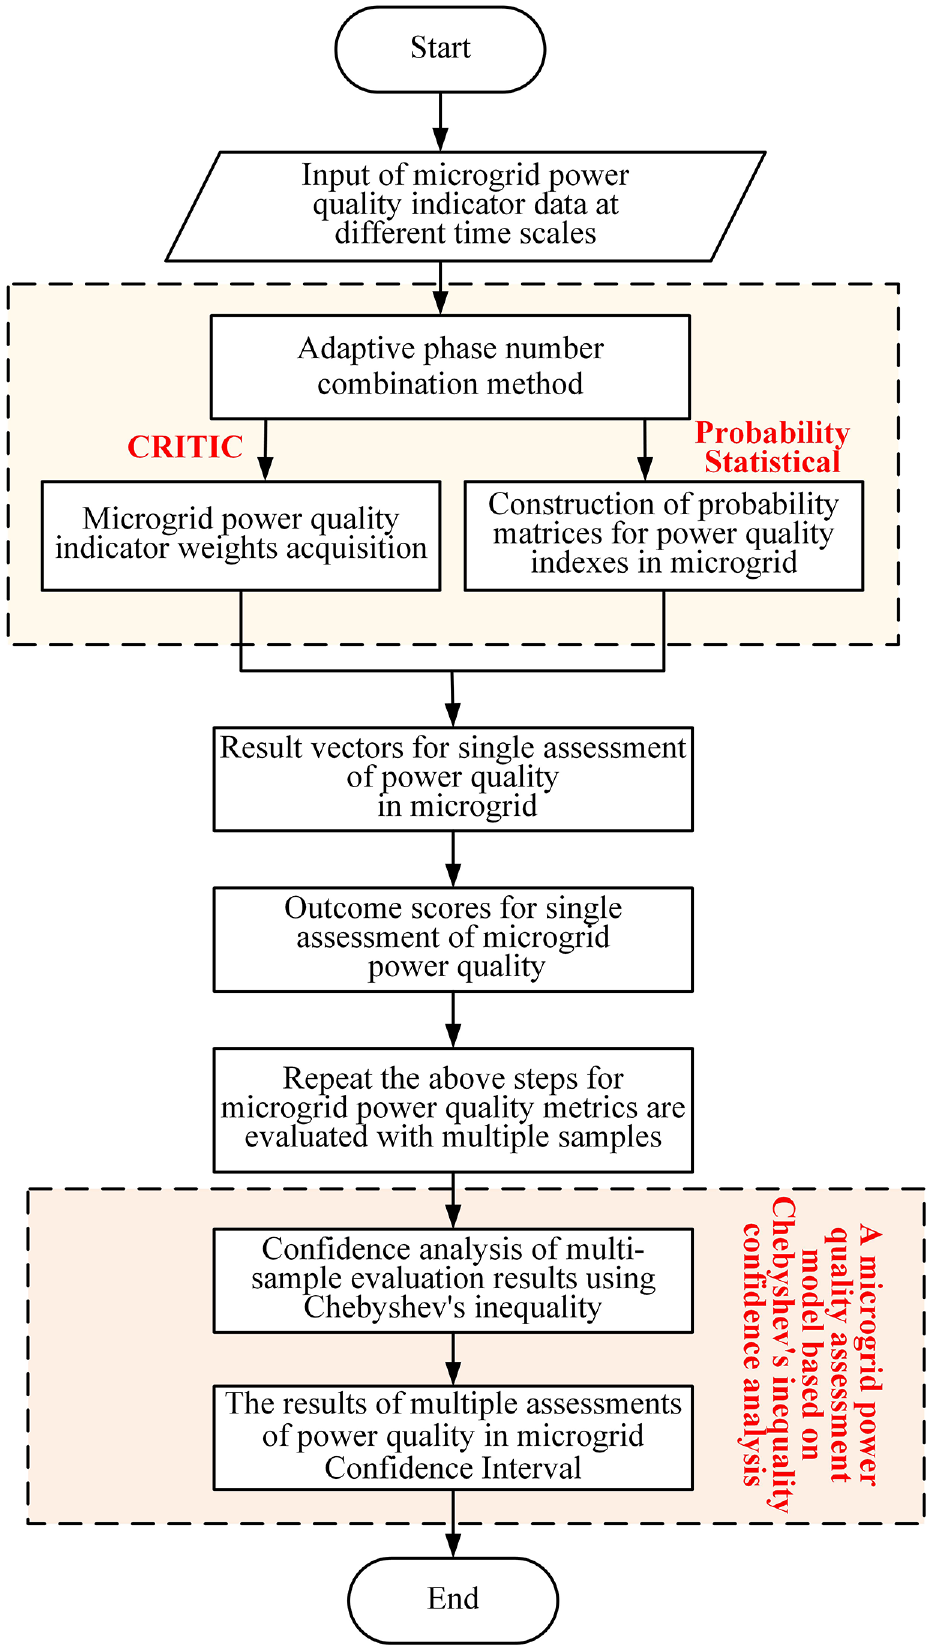
Additionally, the CRITIC method is integrated with the EMM to construct a combination algorithm to describe the dispersion degree of the indicators, and the weights of the MGPQ metrics are determined by the combination of the two methods. The flow chart of this method is demonstrated in Figure 4.
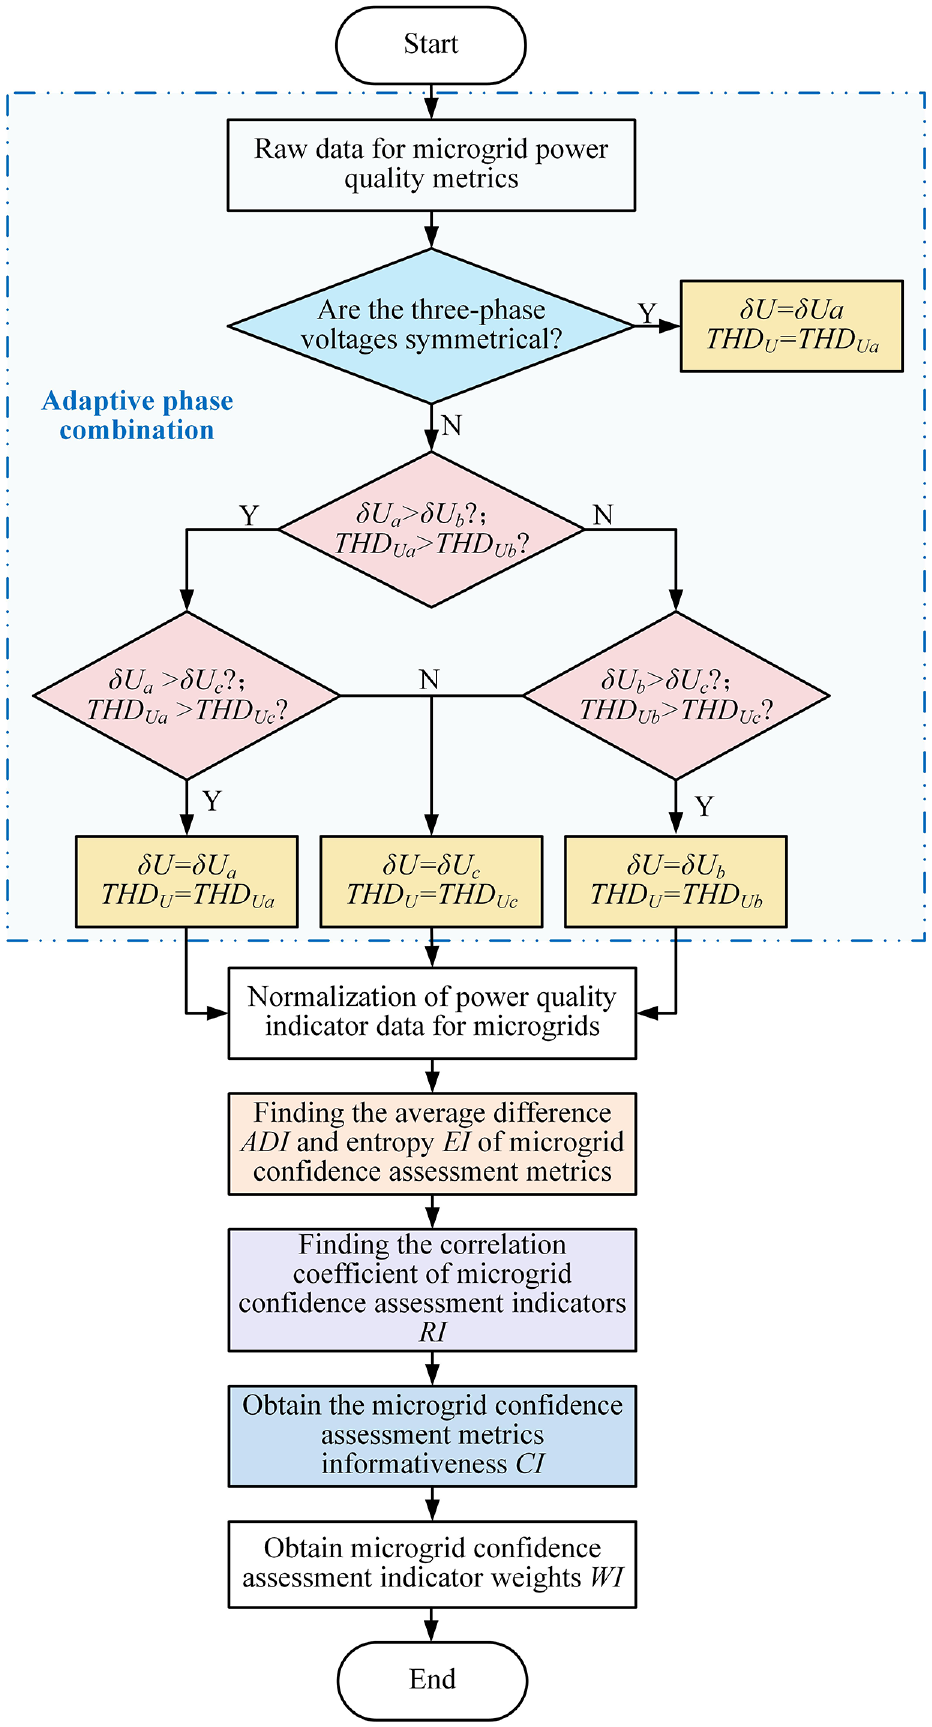
Microgrid power quality index evaluation weight flow chart.
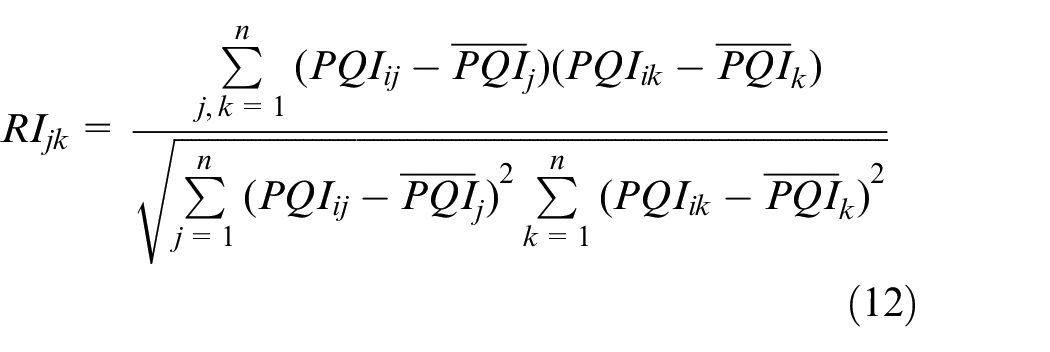
Figure 4 displays that, the original data of the MG power index is first combined by adaptive phase number, and the different dimensional data is normalized after combination. Further, the average difference ADI and indicator correlation coefficient RI of the MG power indicators are utilized to quantitatively describe the comparative strength of the PQ evaluation indicators and the conflict between the indicators. Finally, considering the discrete nature of the indicators, the EMM is introduced and combined with the CRITIC method to determine the weight value of the MG power indicators.
In summary, the conflict, variability, and discreteness of MG evaluation indexes are comprehensively considered in this paper, and the PQ index weight of MG under N sampling evaluation is calculated. The estimation results are more objective and reasonable. The specific process is as follows:
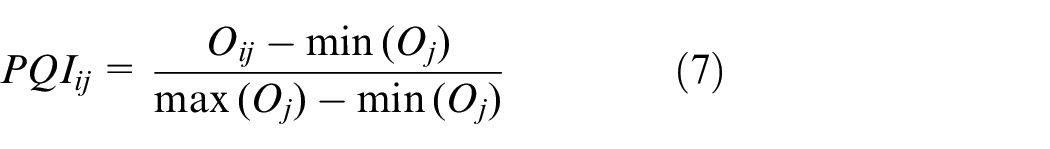
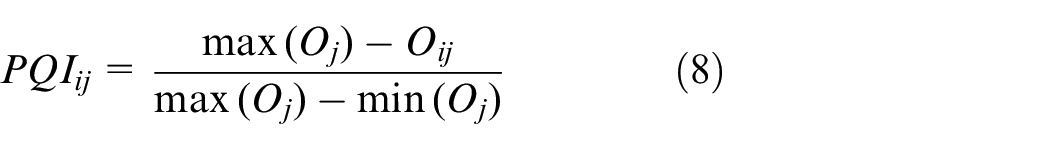
(1) Assuming that there are m sampling points and n indexes in PQ evaluation, the original evaluation matrix can be constructed based on the objective data of the indexes, and the evaluation results will be affected by different dimensions of each index. Each index data needs to be normalized before calculation.
For positive indicators:
For negative indicators:
where
In the PQ evaluation, in order to make the voltage deviation, frequency deviation, and other PQ indicators as small as possible, so all the indexes are taken as positive indicators in this paper.
(2) According to the entropy weight method, the information entropy
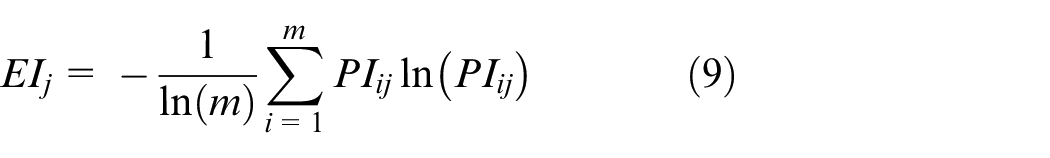
where
(3) Calculate the average difference of each index
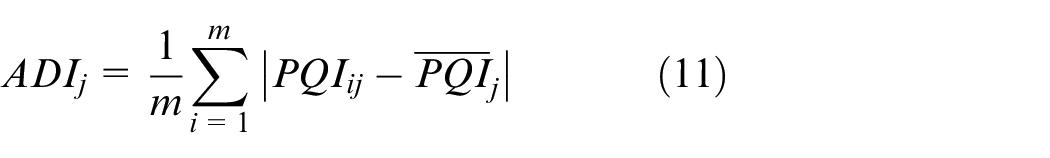
where
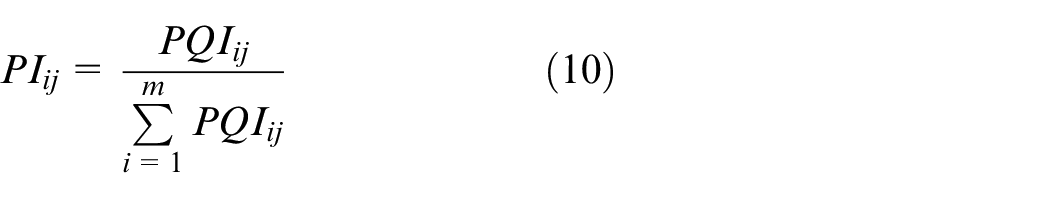
(4) The PQ index weight
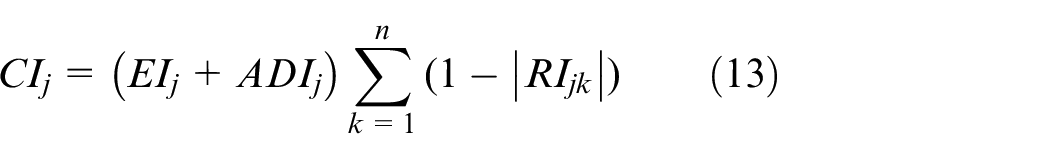
where
Quantification of power quality grade
Given that the value of PQ indicators will change over time, the probability of their appearance at each level is also changing. Therefore, the probability statistical method is used to quantify the level of PQ indicators to reflect the distribution characteristics of PQ indicators.
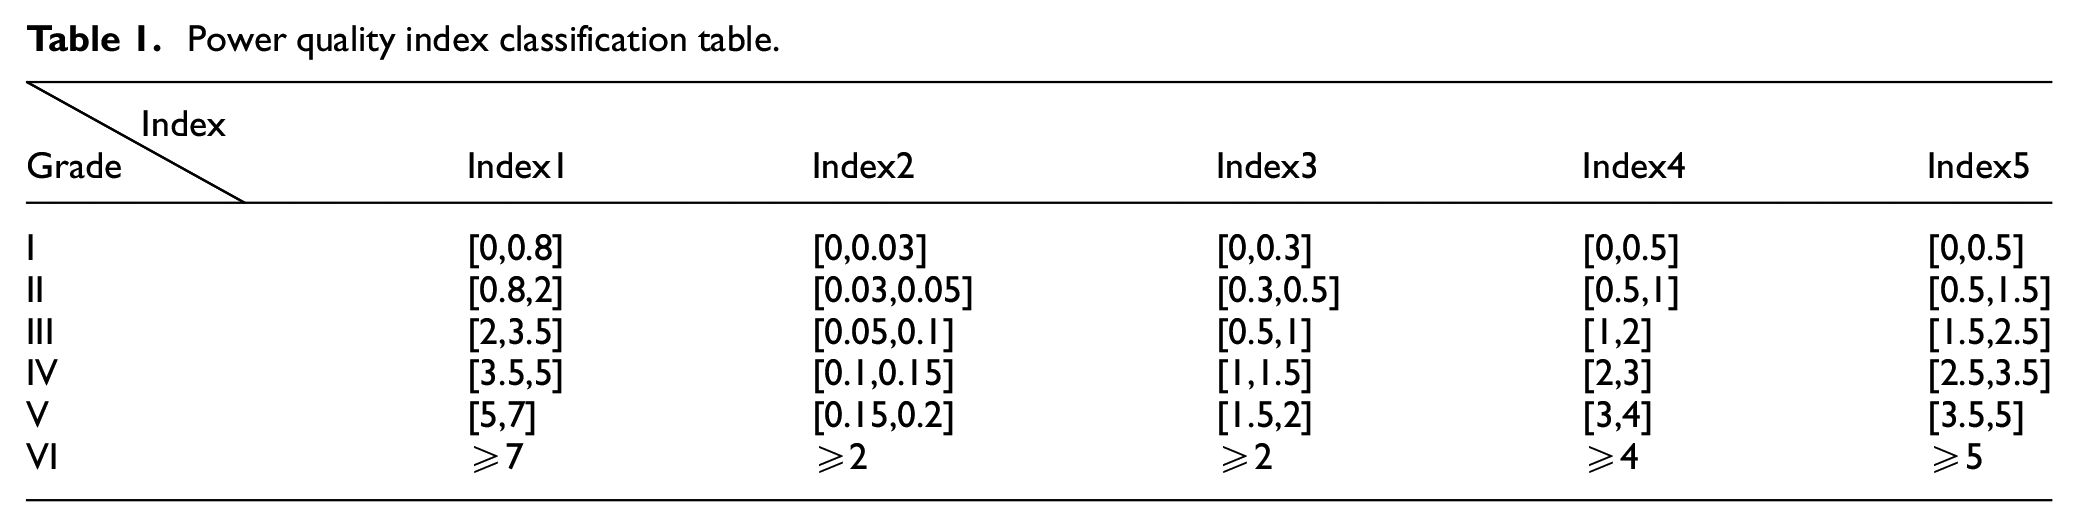
According to the qualified range of PQ stipulated by international regulations and the national standards of PQ issued by the State Bureau of Technical Supervision, 37 a detailed grading standard of PQ indexes with five indexes and six grades was established to quantify the probability distribution of each indicator under each level. The specific classification standards are shown in Table 1. Among the six grades divided in Table 1, I–III belong to the qualified range; specifically, grade I (90–100 points) is high quality, grade II-III (80–90 points) are good, and grade IV (70–80 points) is qualified. Below grade IV (below 70 points) belongs to the unqualified range, which needs attention. This division not only avoids the excessive deviation of the calculation results caused by too few classifications, thus affecting the evaluation results, but also avoids the complex calculation caused by too many classifications. The establishment of unqualified grades can provide a reference standard for PQ assessment. Among them, indexes 1–5 in the entire paper represent voltage deviation, frequency deviation, three-phase unbalance, harmonics, and voltage fluctuation, respectively.
Power quality index classification table.
The frequency of every indicator in the above level is determined by statistics, and the formula is expressed as follows:
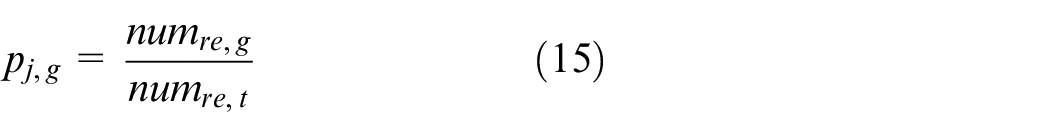
where,
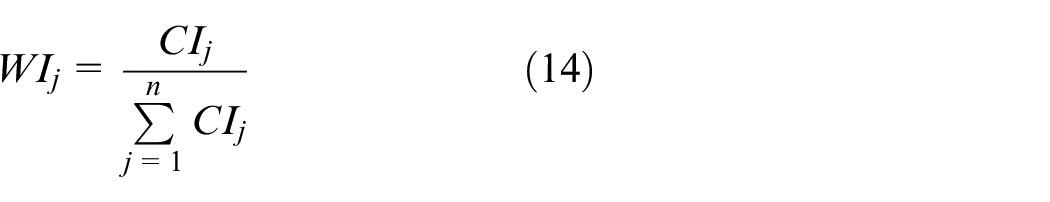
From the above equation, the probability of the j index at the g level can be calculated, thereby the probability matrix
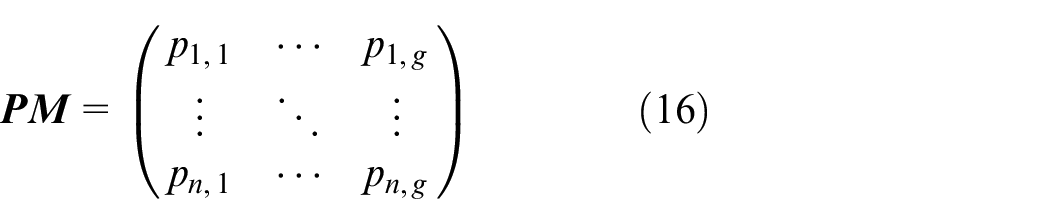
Based on equation (16), the PQ index probability matrix of each working condition can be calculated.
Proposed confidence estimation based on Chebyshev inequality
Chebyshev inequality is commonly used in probability statistics, which can estimate the probability of random variables with an arbitrary distribution. According to the characteristics of Chebyshev inequality, it is used in the evaluation of PQ in MG. The specific definition is as follows:
Suppose that the expectation and variance of random variables
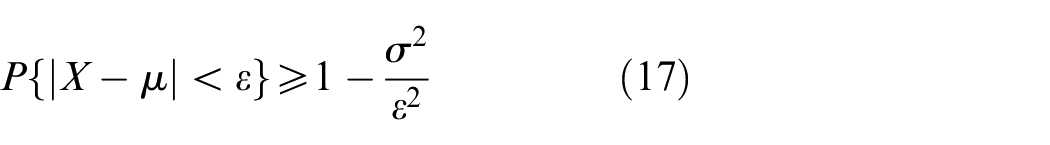
If we make
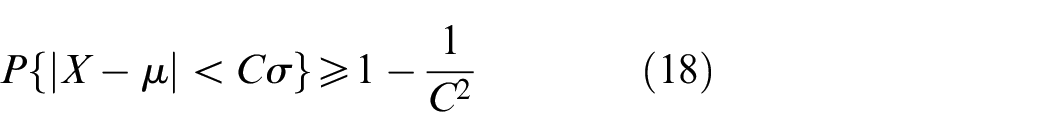
where,
From equation (18), for any distributed random variable, if the SD and mean are known, the confidence interval under a given confidence level can be constructed by using Chebyshev inequality.
Based on the point estimates obtained from traditional MG evaluation methods, this paper utilizes Chebyshev inequality to assess the PQ of the MG under various operating conditions and determines the 90% confidence interval for the PQ, and its width is used to reflect the uncertainty variation of the MG. According to Neyman’s principle, 39 when the sample size is certain, the width (accuracy) of the confidence interval and the confidence level are mutually constrained; if the confidence interval is too narrow, the confidence level will be reduced, and the assessment results of MG will tend to be AVG, which cannot manifest all the features of the PQ of the MG; if the confidence interval is too wide, the accuracy of the evaluation results will become worse. Therefore, in order to ensure its accuracy and confidence level, a 90% confidence interval is finally adopted. The process is as follows:
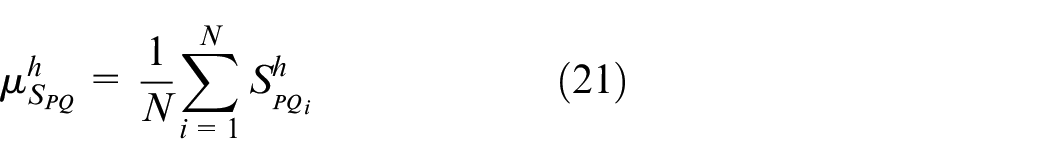
The vector
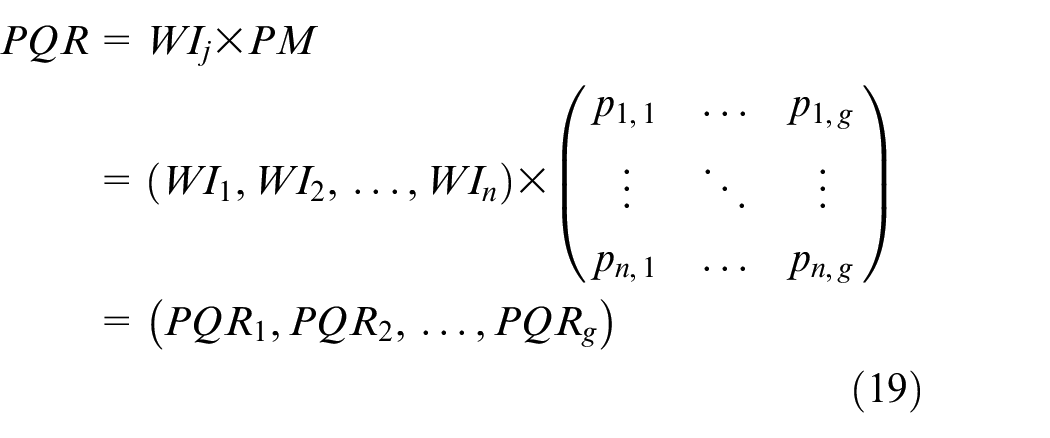
where
The evaluation result vector is weighted as an indicator of relative importance to acquire the ultimate score
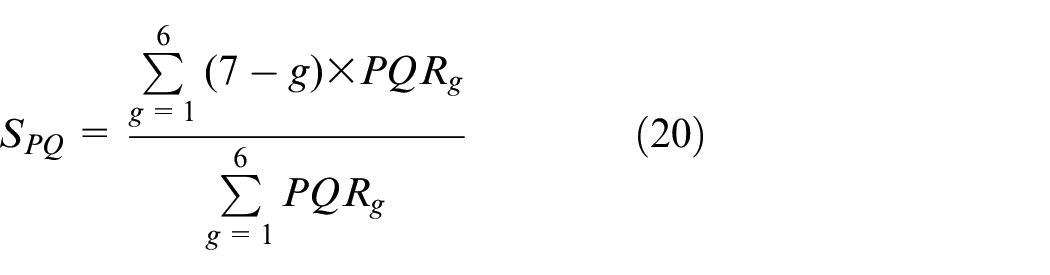
According to equation (20), the PQ score
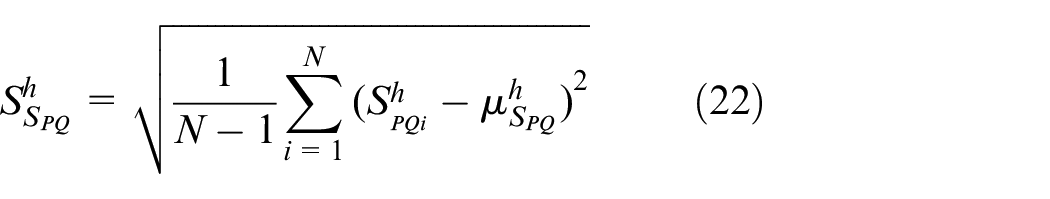
where
The confidence interval of MGPQ at a certain confidence level is obtained:
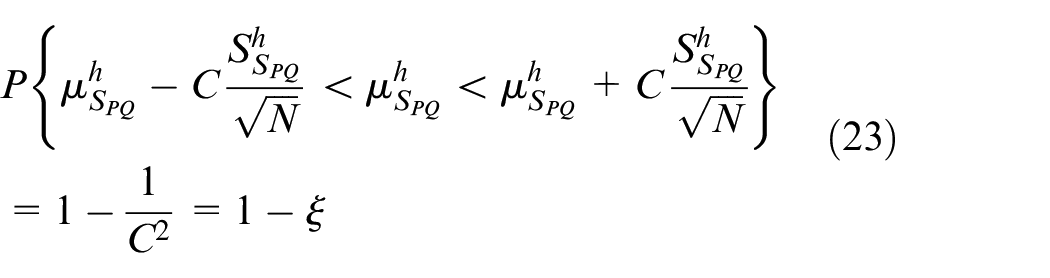
where,
Through the above confidence assessment of MGPQ indicators, a probabilistic confidence interval can be obtained, which is a comprehensive assessment of the results of a number of assessments, and can effectively reflect the overall trend of MGPQ, providing a more effective and intuitive reference for MG administrators to monitor and manage the quality of power. For example, based on the fluctuations in MGPQ indicators and the size of the confidence interval, corresponding management measures can be taken to make sure that the MG system can operate more safely and stably.
Example verification
Using examples to demonstrate the viability and efficacy of the presented approach in this study, in which the simulation platform of the MG is utilized to simulate a variety of simulation scenarios to react to the operating conditions of the actual MG, mainly combined with the time of electricity load and the characteristics of the distributed power generation to set up conditions, such as in the peak load period, which is generally 8:30–11:30 a.m., the night is 18:00–23:00, many loads will be cut in during this time, and only a few loads are cut in during the power consumption valley period and flat period. By simulating different power demands, the simulation operation is closer to the actual operating conditions, so that the collected data is more representative. The viability and validity of the PQ model for MG are validated on account of the confidence evaluation of Chebyshev inequality proposed in this paper.
Confidence evaluation analysis
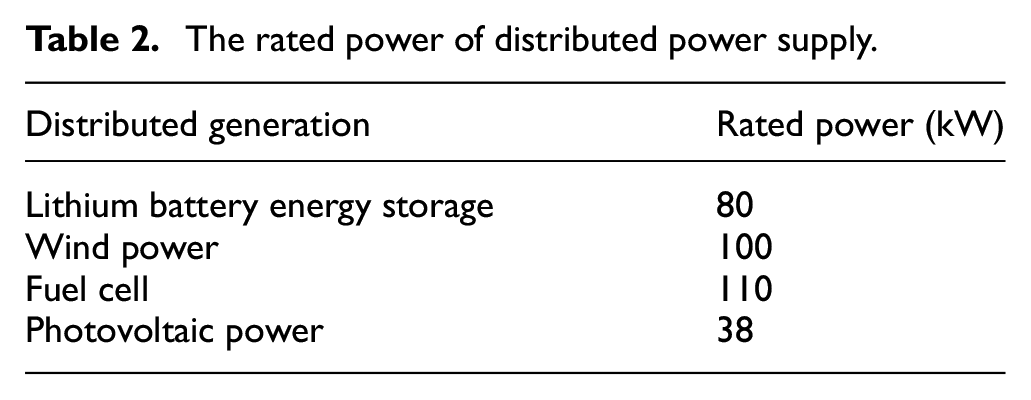
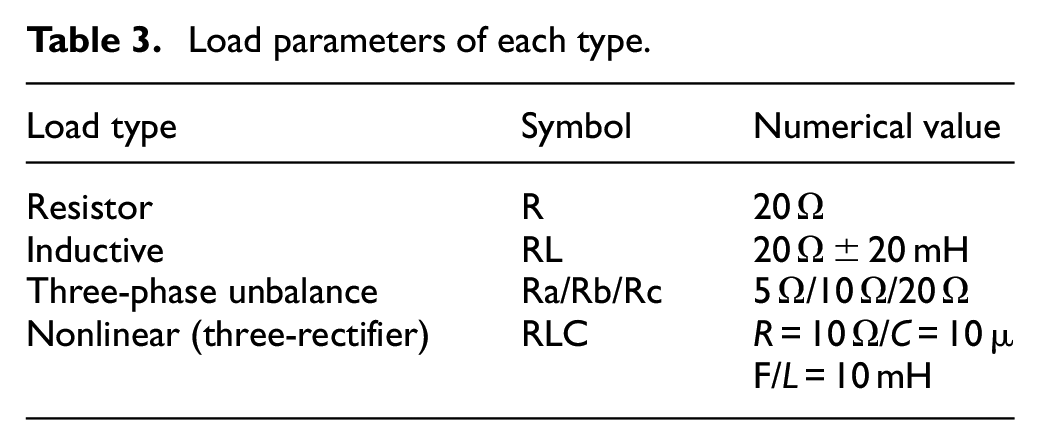
The MG is composed of various types of distributed power sources and loads, like energy storage, photovoltaic, etc., which are then connected to the 10 kV distribution networks through the point of common coupling (PCC), where the distributed power on the power generation side is connected to MG through power electronic equipment, and the load side is composed of multiple sets of diverse kinds of loads, such as nonlinear loads, unbalanced loads, and linear loads. The model can make the MG better simulate the actual operating conditions so as to evaluate the PQ of the MG more reasonably and objectively. The rated power and load parameters of the distributed power supply in the model are depicted in Tables 2 and 3.
The rated power of distributed power supply.
Load parameters of each type.
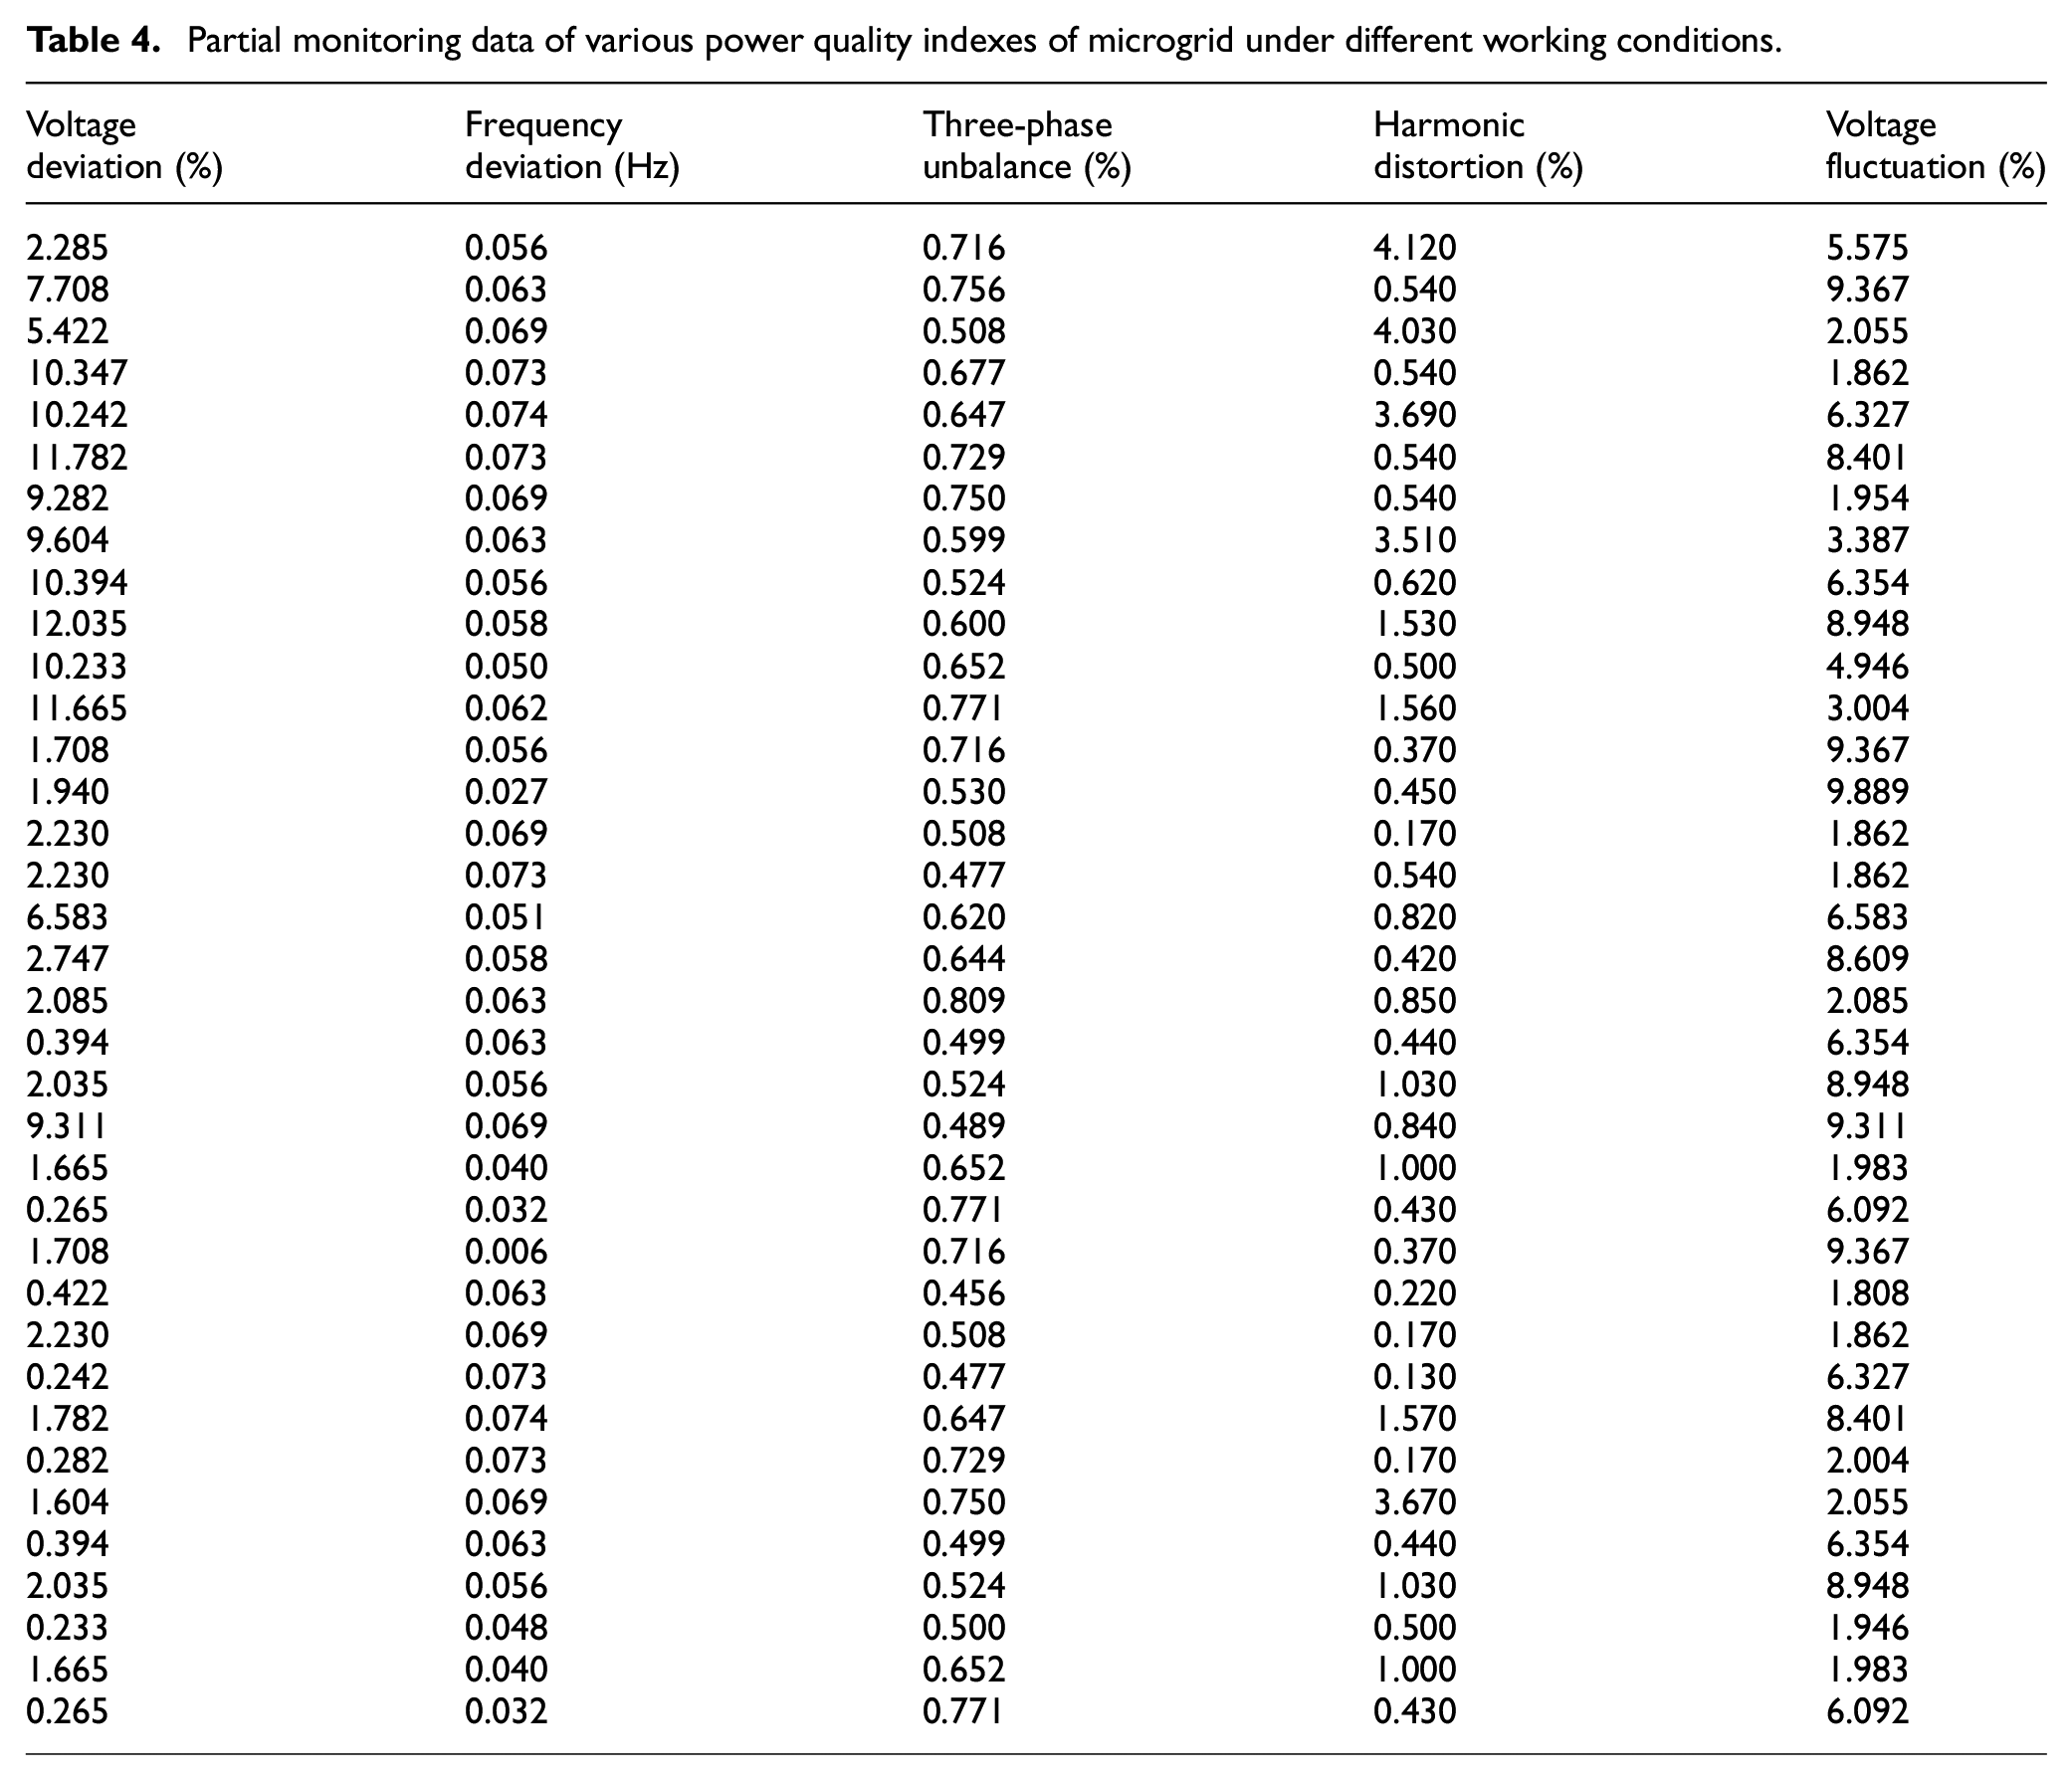
Considering the relevant standards of PQ, five PQ indicators, such as voltage deviation, frequency deviation, three-phase unbalance, harmonics, and voltage fluctuation, are selected as the evaluation system. Through the modeling and simulation of the AC MG, each time period’s PQ data are is obtained, which is regarded as the data values of the assessment indexes through statistics and processing. Then, 10 typical operation scenarios are set by observing the power index data of the MG, for example, a day in the morning when photovoltaic and wind power generation is weak and more nonlinear loads are cut in. In the afternoon, the photovoltaic power generation is strong, and several groups of nonlinear and unbalanced loads are cut into this stage. At night, when there is no wind, cut out part of the base load, part of the distributed power supply, and part of the nonlinear load. Simultaneously, each operation scenario is measured several times to better simulate the actual operating conditions of the MG, which not only avoids too few evaluation times to reflect the global characteristics of the MGPQ, but also avoids the increase of calculation amount caused by too many evaluation times, and ignores the characteristic changes of different working conditions of the MG. The following takes working condition 1 as an example for statistical analysis, and part of the collected data is displayed in Table 4.
Partial monitoring data of various power quality indexes of microgrid under different working conditions.
Quantitative results of confidence evaluation
In order to more directly reflect the distribution of every PQ index, the monitoring data of various PQ indexes of MG under different working conditions in Table 4 are represented by line graphs. The data sampling distribution of every PQ index of MG under working condition 1 are depicted in Figure 5(a) to (c).
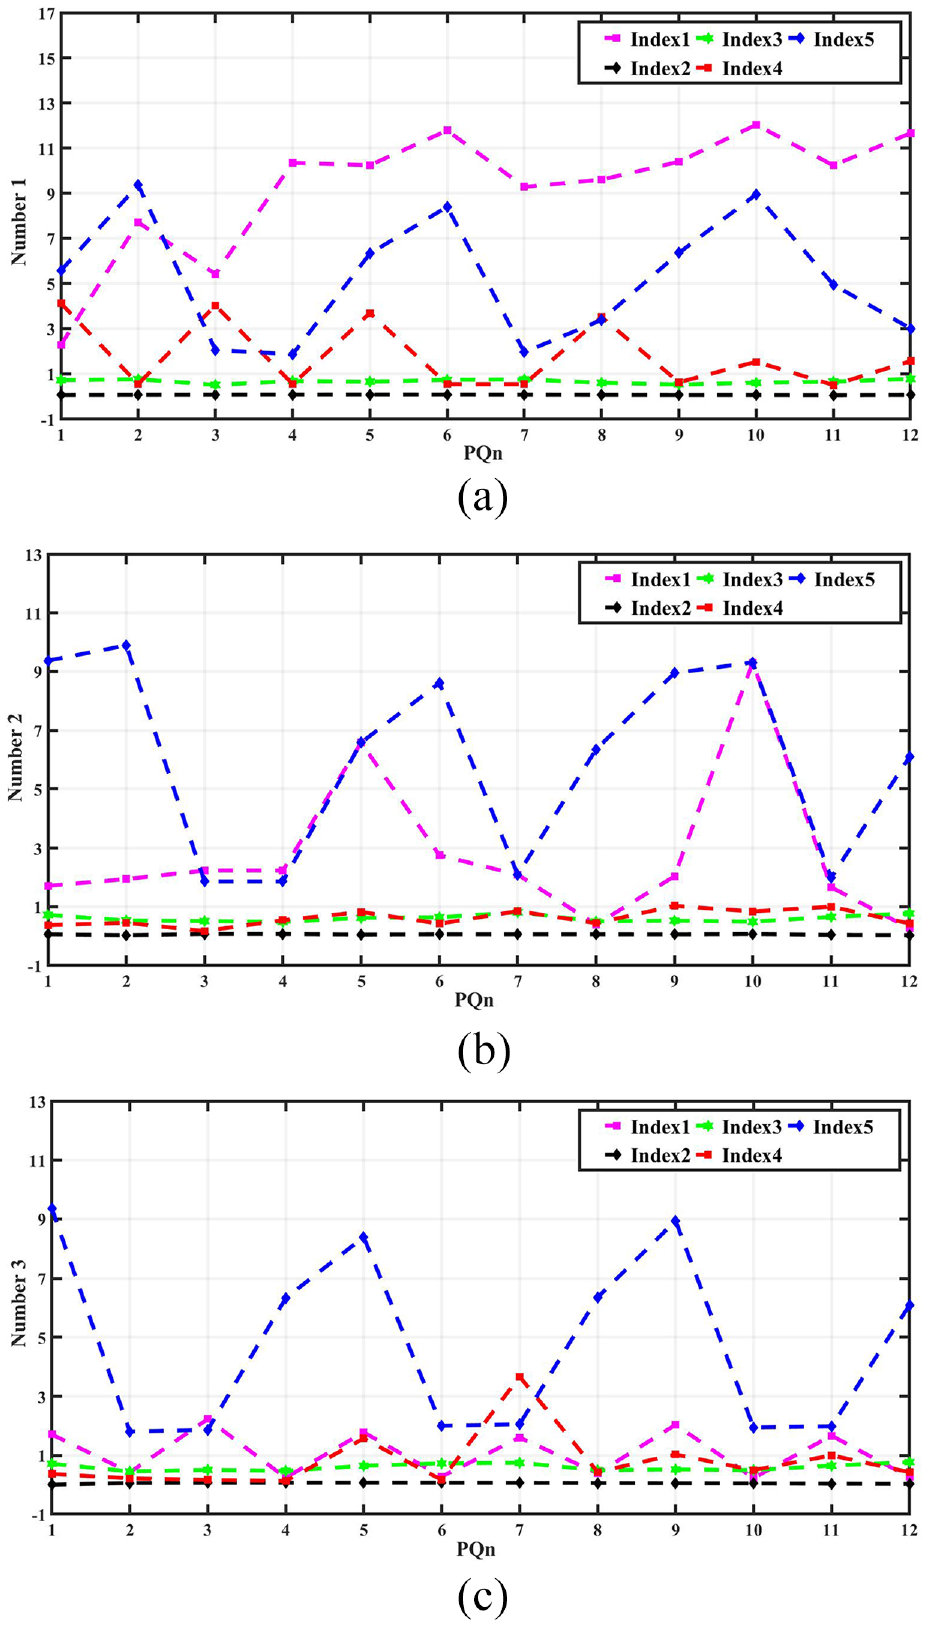
Data sampling distribution diagram of working condition 1: (a) the first data sampling distribution, (b) the second data sampling distribution and (c) the third data sampling distribution.
From the aforesaid charts, it can be found that under various operation conditions, the fluctuation degree of the MGPQ indexes is quite different, which reflects that the MG is a system with uncertainty, and its operating characteristics have different effects on PQ.
According to equations (7)–(14), the weight of the MGPQ evaluation index under working condition 1 can be obtained. The weight results are depicted in Table 5, and the intuitive reflection is observed in Figure 6.
Quantitative results of microgrid power quality indicator weights.
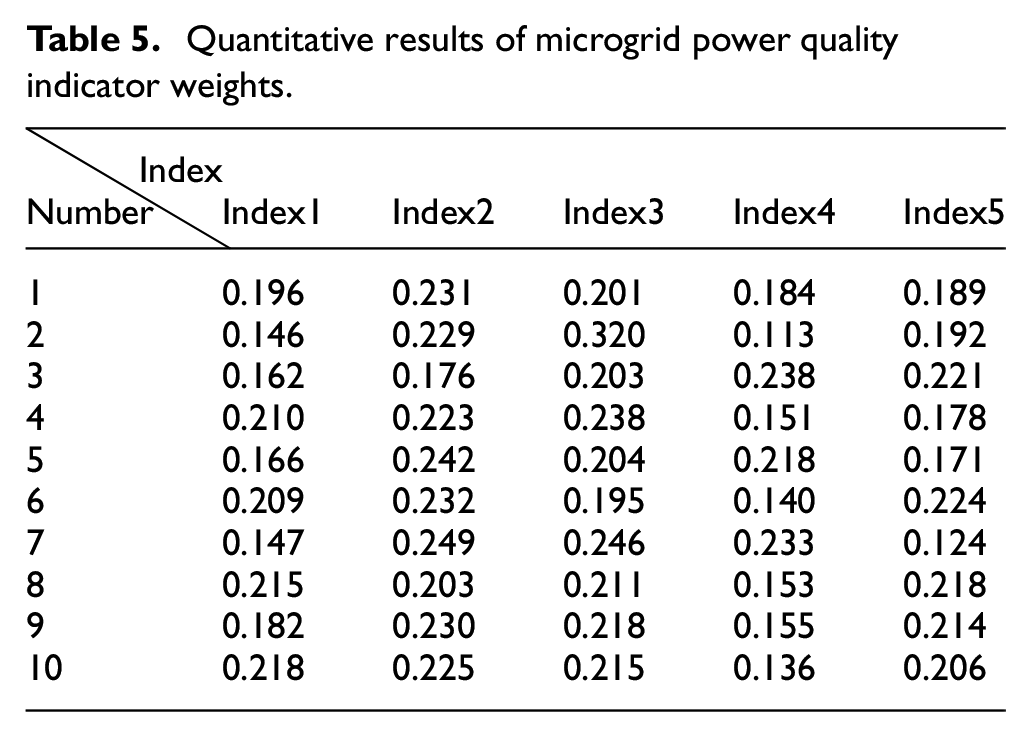
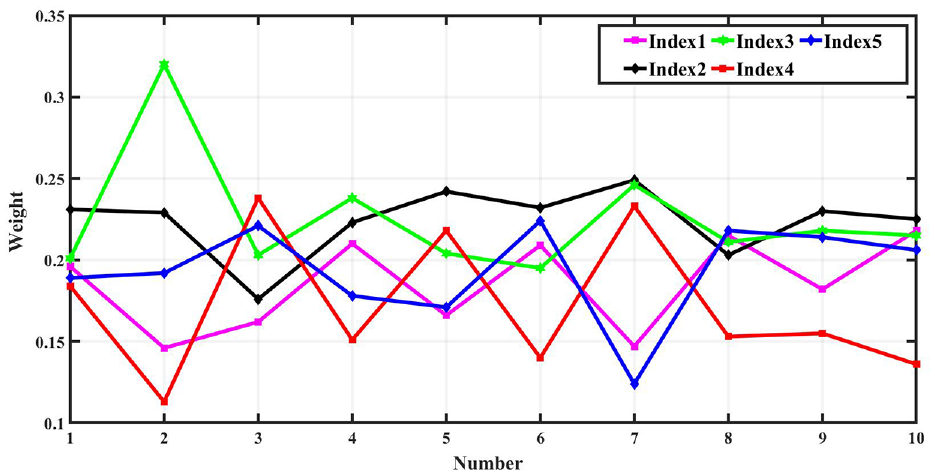
The distribution of weights for micro-grid power quality indicators.
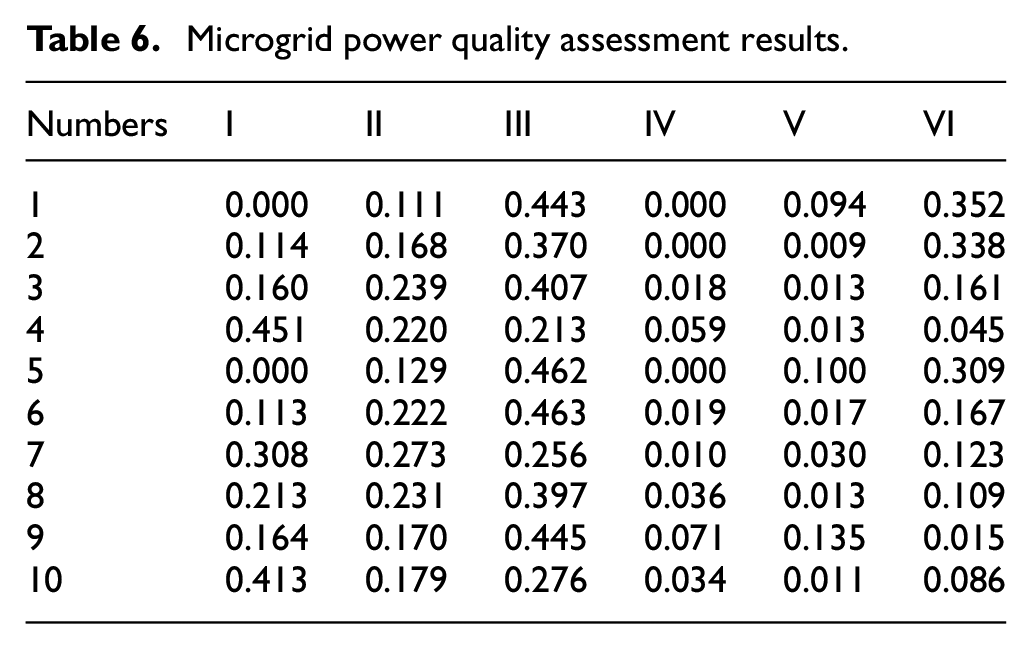
Based on equation (19), the PQ evaluation result vector
Microgrid power quality assessment results.
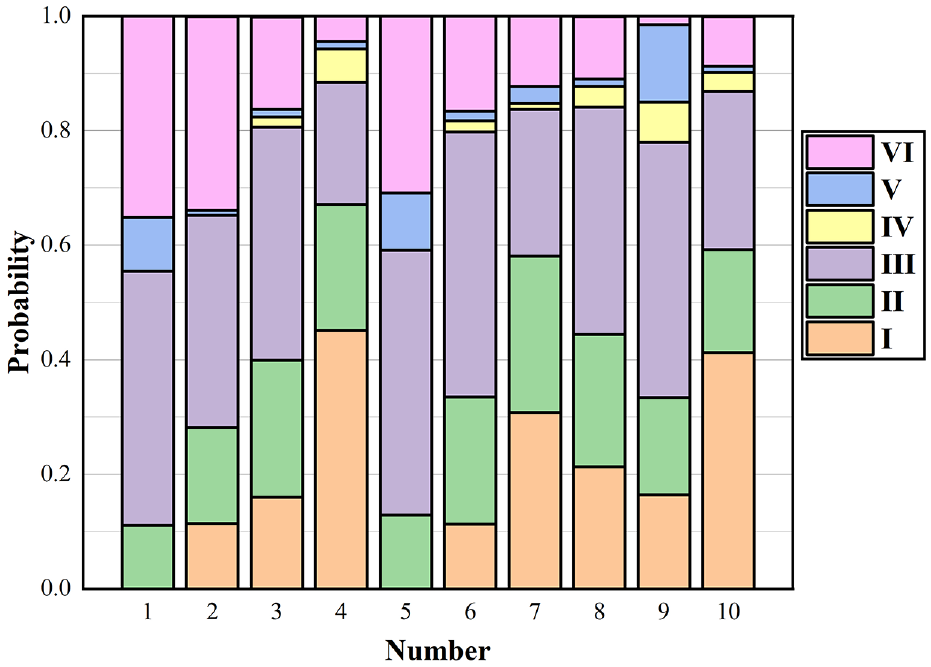
Microgrid power quality evaluation results.
As displayed in Figure 7, the ranking of the PQ evaluation results for MG under 10 sampling evaluations is as follows: first < fifth < second < sixth < third< ninth < eighth < seventh < tenth < fourth.
The MGPQ score of 10 sampling evaluations is obtained according to equation (20), and the traditional CRITIC method is contrasted with the method presented in this paper. The comparison results are revealed in Table 7, and the intuitive reflection is revealed in Figure 8.
Microgrid power quality comprehensive evaluation score comparison results.
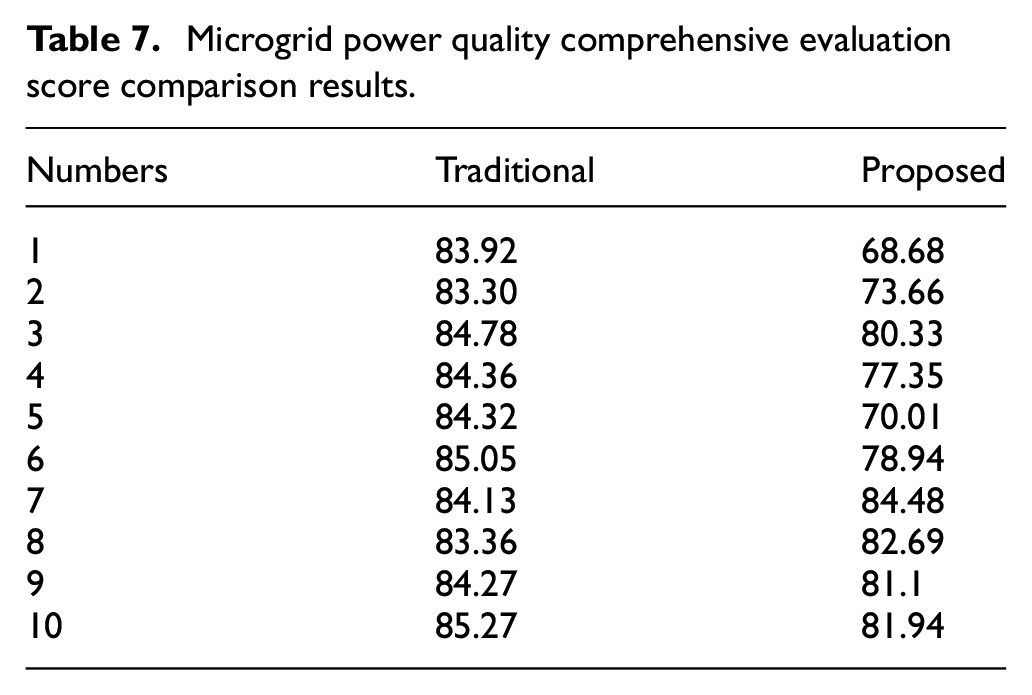
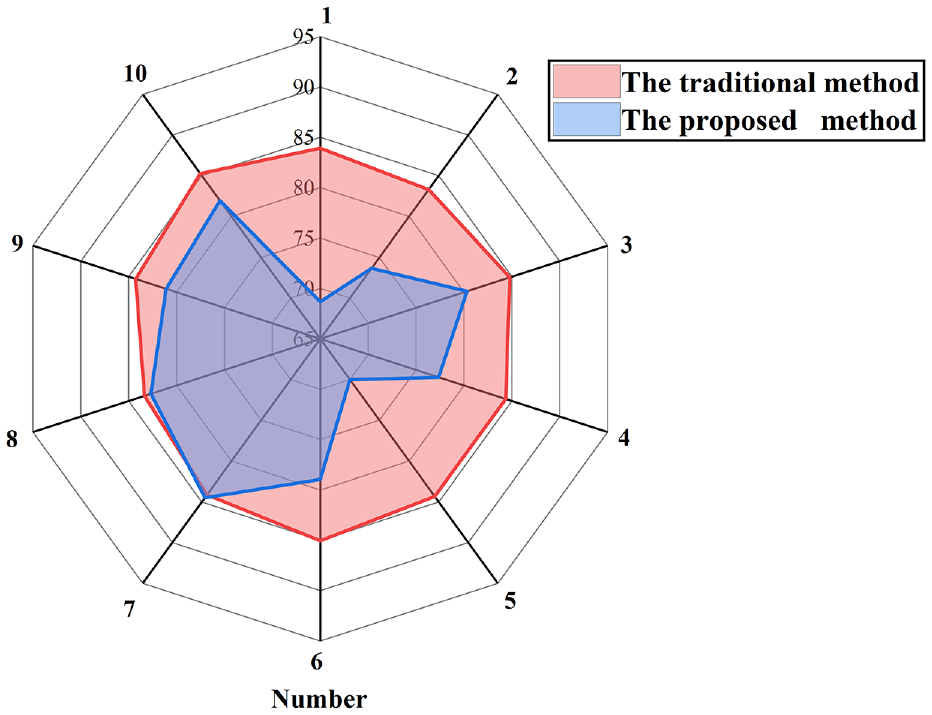
Comparison of power quality comprehensive evaluation scores of microgrid.
From Figure 8, it can be found that when the traditional CRITIC approach is utilized to assess the PQ of the MG under various working conditions, the assessment results incline to be AVG, whereas the actual MG has experienced multiple working conditions during the evaluation period. Hence, the traditional method has certain shortcomings in the uncertainty of MG operation. At the same time, combined with the comparison in Table 7, it can be more intuitively seen that the results of the evaluation of MGPQ are discrete, which side by side reflects that the method presented in this study is more suitable for the actual operation of the MG. However, as mentioned above, these point estimate values cannot reflect the total features of PQ in the MG. Therefore, a confidence assessment of the PQ estimation results for MG is needed.
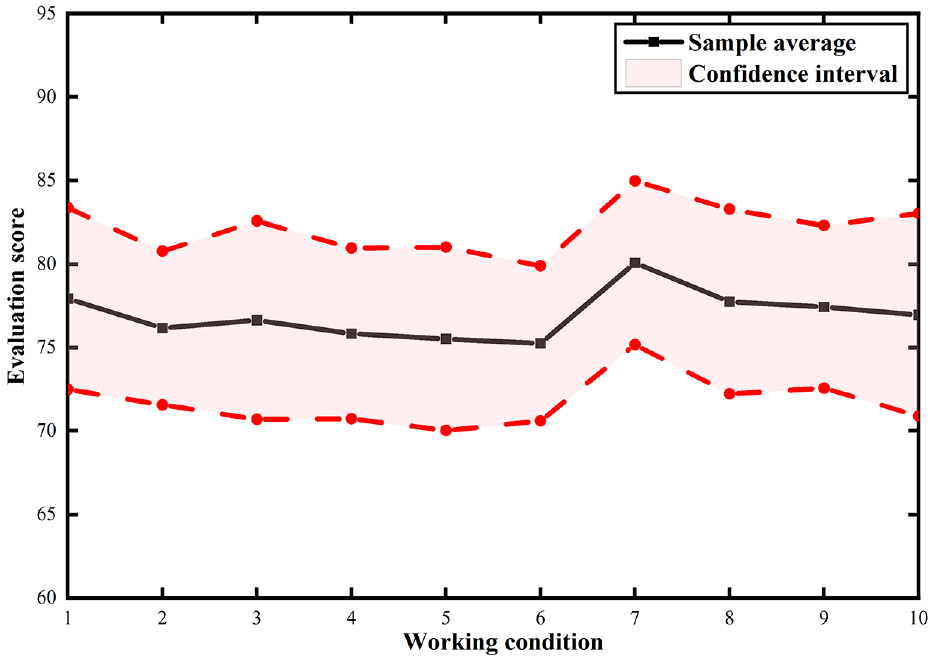
Based on the 10 sampling and evaluation results mentioned above, the mean value and SD are calculated to be 77.92 and 5.43, respectively. The confidence level is set at 90%, with a SD coefficient (Chebyshev constant) C of ±3.16. This indicates that there is a minimum 90% probability for the evaluation result to fall within ±3.16 SDs from its mean. Then, according to equation (23), the confidence interval of working condition 1 is obtained as [72.48, 83.36], and the above process is repeated to evaluate the power index data of 10 working conditions. The sample mean value and 90% confidence probability interval of the PQ evaluation findings of the MG are displayed in Table 8, and the direct reflection is depicted in Figure 9.
Results of a sample mean value and 90% confidence interval for the micro-grid power quality valuation.
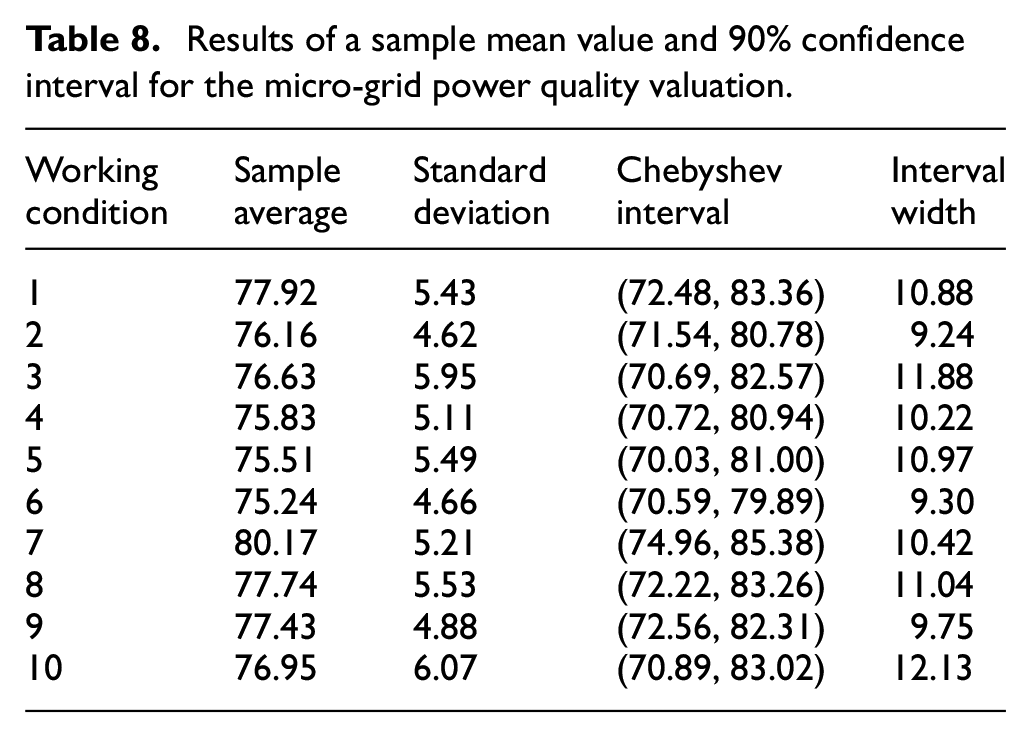
Results of a sample mean value and 90% confidence interval for the micro-grid power quality valuation.
In Figure 9, the black solid line stands for the sample mean value of the MGPQ evaluation results, and the red dashed line indicates the upper and lower boundaries of the 90% confidence interval (the shaded part in the figure) of the estimation results of PQ for MG; that is, the probability of the true mean value of the overall outcomes of the PQ evaluation of MG falling within this interval is 90%, and the estimation of this interval has a greater fault tolerance space than the point estimation. It can reflect the actual change in MGPQ affected by various uncertain factors. The wider the range, the greater the uncertainty of MG and the more serious the PQ. Meanwhile, as can be seen from Table 8, the highest score for each working condition is not more than 81 points, the lowest score is not more than 75 points, and the AVG score is about 70 points. As can be seen from the confidence interval, the highest score is 85.36 points and the lowest is 70.03 points. Each confidence interval is obtained according to probability, and the maximum probability will not exceed 90% of the probability interval during operation. That is, the 90% confidence interval can reflect the fluctuation of MGPQ under various complex working conditions, thus effectively reflecting the overall trend of PQ in MG. It provides a suitable reference for managers to accurately identify MGPQ problems.
To further analyze the causes of PQ changes, the confidence intervals of each indicator of the MG are analyzed in detail. The direct view diagram is shown in Figure 10, where the solid line denotes the sample mean of each indicator, and the dashed line of the same color represents the upper and lower boundaries of the 90% confidence intervals of each indicator.
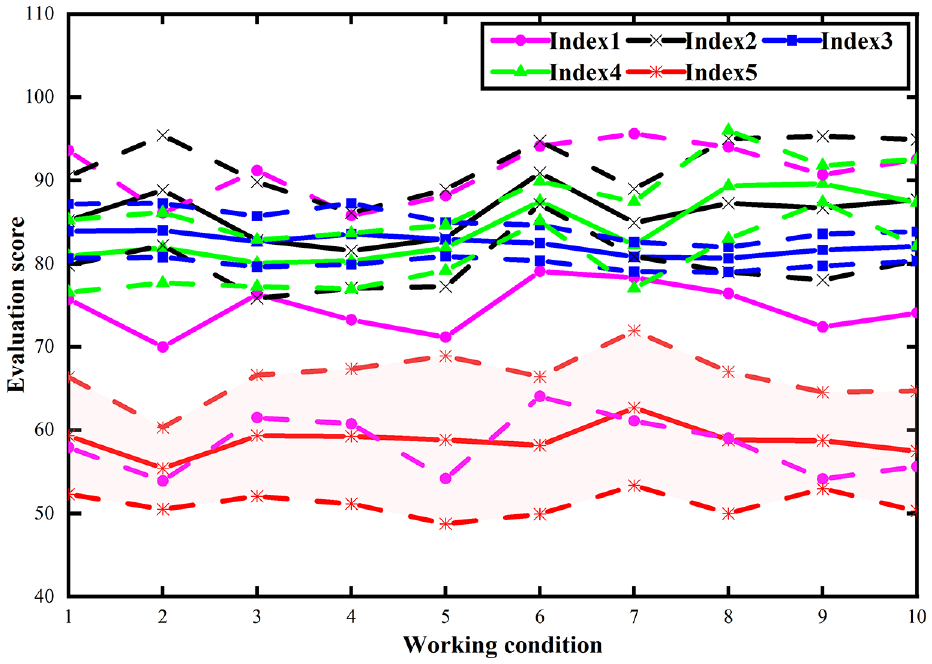
Sample mean and 90% confidence interval of each indicator of microgrid.
As shown in Figure 10, voltage fluctuation (shaded area in the figure) has the lowest assessment score in the MG power index, which generally varies in the fail range, and some values are in the pass range. The reason may be the power balance under this working condition. The overall trend of voltage fluctuation is similar to the MGPQ evaluation results illustrated in Figure 9. It can be found that voltage fluctuation is the main factor contributing to the deterioration of PQ for MG, making it more fluctuating and uncertain, and the voltage fluctuation is caused by the cut-in and cut-out of distributed power supply in MG, or the rapid fluctuation of output power. In other words, MG managers can first start from micro-sources to determine the causes of rapid power fluctuation, to improve the stability of the MG, and then its PQ problems are targeted solved.
Comparative analysis of confidence evaluation methods
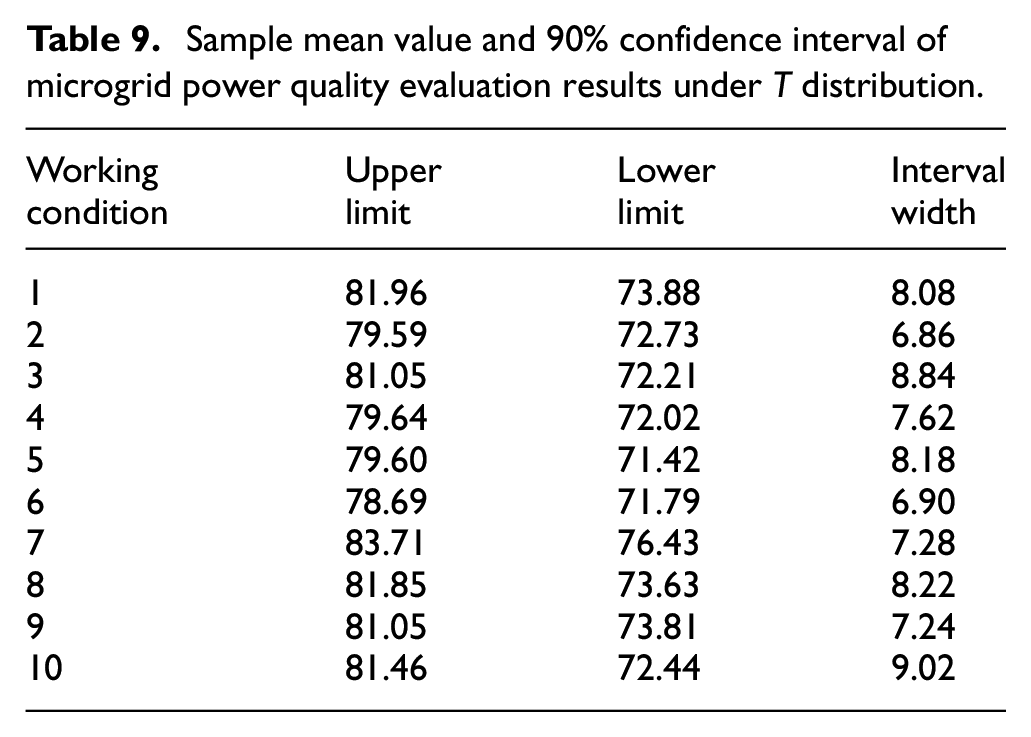
Due to the uncertainty of the MG environment, the sample data is no longer a normal distribution when the PQ is evaluated at different time scales. On the assumption that the PQ index of MG generally obeys the normal distribution, the T distribution (sample N < 30) can get used to count the 90% confidence interval for the mean value of the evaluation results. The comparison results with the Chebyshev inequality are demonstrated in Table 9, furthermore, Figure 11 can visually compare the difference between the Chebyshev inequality and the T distribution.
Sample mean value and 90% confidence interval of microgrid power quality evaluation results under T distribution.
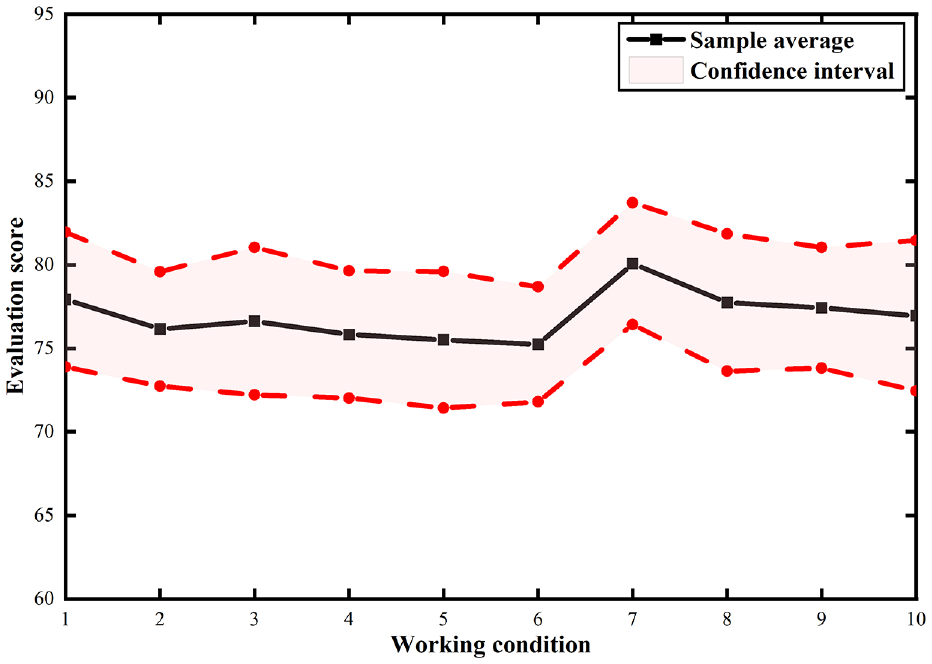
Sample mean value and 90% confidence interval of microgrid power quality evaluation results under T distribution.
As shown in Tables 8, 9, and Figure 11, Chebyshev’s inequality has a broader range of applications compared to the T distribution when estimating the population mean. It can more accurately reflect the actual PQ situation in MG at various time scales. Additionally, due to its applicability to all types of PQ data, Chebyshev’s inequality demonstrates greater flexibility and suitability in capturing uncertain changes in PQ within MG. Therefore, it is more appropriate than the T distribution for confidently evaluating MGPQ.
From equation (23) and Table 9, it can be found that the estimated confidence interval is correlated with the SD of the sample, which reflects the dispersion degree of the evaluation results of PQ for MG. Simultaneously, as can be seen from the above chart, there is a 90% possibility that the PQ estimating results of MG fall within the probability range. The data is more in line with the actual operation of MG, and also reflects the uncertainty in the MG to the impact of PQ, which shows the importance of this method for PQ estimation. Besides, it is conducive to the formulation of targeted and reasonable management programs for PQ in different working conditions.
Conclusion
A comprehensive MGPQ evaluation method based on Chebyshev inequality confidence estimation is proposed in this paper. The final evaluation result of the MG is determined using a 90% confidence interval. The discreteness of the evaluation result is quantified by the sample SD, and the uncertainty of the PQ is revealed by the interval width. Compared with traditional evaluation methods, this model shows the whole picture of MGPQ from three dimensions: index data characteristics, different time scales, and confidence intervals. The evaluation result is an interval with a 90% probability of being within the mean ±3.16 SDs, which offers an intuitive and effective basis for PQ monitoring and management for MG managers, and helps to ensure the safe and stable operation of MG.
Footnotes
Declaration of conflicting interests
The author(s) declared no potential conflicts of interest with respect to the research, authorship, and/or publication of this article.
Funding
The author(s) disclosed receipt of the following financial support for the research, authorship, and/or publication of this article: This work is supported by National Nature Science Foundation (52267013), Ningxia Nature Science Foundation (No. 2022AAC03281).
Permission to reproduce materials from other sources:
None
Data availability statement
The data that support the findings of this study are available from the corresponding author upon reasonable request.