
Abstract
The stochasticity of power flow of distributed generations (DGs) and load in the microgrid has great influence on power flow distribution and voltage quality of the distribution network. For improving the voltage quality of the distribution network, the questions need to be further studied, which include the description of the stochasticity of the power flow in the microgrid and the impact of the microgrid into the distribution network on the power flow. Therefore, a novel stochastic power flow calculation and optimal control method for the microgrid based on multivariate stochastic factors fusion-sensitivity (MSFF-sensitivity) is proposed in this paper. Firstly, the multivariate stochastic factors fusion (MSFF) function is developed by using the probability density function to extract the stochasticity and correlation of power flow among different stochastic factors in the microgrid, which are effectively unified. Furthermore, the fusion-sensitivity (F-sensitivity) of the power flow in the microgrid integrated into the distribution network is constructed to accurately characterize the influence degree of various stochastic factors in the microgrid on the power flow of the distribution network. Based on this, the output power of the stochastic factor is adjusted to optimally control the power flow of the distribution network. Finally, the algorithm verification suggests that, compared with the conventional power flow methods, the method proposed in this paper is more suitable for the microgrid. The influence of stochastic power flow on the distribution network can be effectively reduced and the voltage quality of the distribution network can be improved by optimizing control of the power flow in the microgrid integrated into the distribution network.
Keywords
Introduction
Microgrid can effectively improve the accommodation level of renewable energy and make the power supply of the distribution network more reliable, which have been extensively studied by many scholars from different countries and regions in the world. 1 As an important part in the research field of microgrid, power flow calculation is an important basis for the analysis of voltage distribution and network loss in the microgrid. Compared with the conventional distribution network, power flow calculation in the microgrid is more complex due to the stochasticity of DGs and load, the bi-directional mobility of power flow and the embedding of power electronic converters. 2 Therefore, the traditional power flow calculation method is no longer directly applicable to the system with the microgrid. It is necessary to classify the nodes reasonably as well as take the power electronic converters, the stochasticity of DGs and loads into account.
With regard to the problem of power flow calculation and controlling of microgrids, among the existing scholars, the relationship between microgrid control and power flow has been investigated in terms of the use of complex power compensation based on Wirtinger algorithm, reactive power limiting of distributed generating units, and droop-controlled distributed generating units to regulate active power and control frequency.3–5 In addition, in terms of the convergence of microgrid power flow, the iterative and convergent methods of power flow calculation can be used to solve the problems such as the coupling problem of frequency and DC voltage in microgrids, the influence of the droop control to the convergence of power flow and system stability, and convergence of power flow calculation for islanded hybrid microgrids.6–8 In summary, the power flow in the microgrid has achieved some achievements in the relation and convergence between microgrid control and power flow, but the stochasticity of power flow calculation needs to be further analyzed.
Since Borkowska introduced the concept of stochastic power flow in 1974, the stochasticity of power flow calculation has been studied by a large number of scholars. The solution methods mainly include simulation method, point estimation method and analytical method. 9 The simulation method generates a certain scale of samples according to the probability model of random variables, performs power flow calculation of each sample respectively, and then obtains the stochastic distribution law by statistics. For example, the stochastic power flow in the microgrid can be obtained by Monte Carlo Sampling Simulation method. With a sufficiently large sampling scale, high calculation accuracy can be achieved, however, the shortcoming of this method is that it needs to a large amount of calculation.10–12 In contrast, the Latin Hypercube Sampling method can effectively cut down the calculation amount, but it is difficult to obtain an analytical solution.13–15 The point estimation method is a probabilistic statistical method, which can accurately obtain the mean value and variance of random variables in a short time, simplify the calculation of stochastic power flow and receive relatively high accuracy according to the probability distribution of random variables. Despite that, it also has difficulties in obtaining analytical solutions.9,16,17 The analytical method, an approximation method based on the numerical characteristics of the random variables, can be used to obtain an approximate analytical expression of the stochastic power flow solution, but some assumptions might be inevitably made in the process.18–20
The optimal control methods used for the optimal control of microgrid currents are complicated and involve multiple technologies. The DGs layer of the microgrid is controlled in some methods. This type of control mainly balance the system power fluctuation in a small range in a short time and maintain the voltage and frequency of the system within the normal allowable range through the local control of the DGs output power. For example, hierarchical control layers of the microgrid are used to classify the control objectives and incorporate DGs level control into the hierarchical control. 21 The virtual negative impedance can also be introduced into the droop control to realize decoupling control of active and reactive power. 22 The microgrid layer is controlled in some methods. This kind of control system can smoothly switch between the isolated island mode and grid-connected mode. For instance, based on the hierarchical control structure of voltage source control, a complete microgrid control system is adopted to smoothly switch between the grid-connected mode and isolated mode for accurate power flow control. 23 Furthermore, an optimal control framework based on a linear secondary regulator can also be used to reduce voltage fluctuations and provide smooth transition. 24 The energy management aspects of the microgrid are controlled in some methods. This type of control optimizes the microgrid from the macroscopic point of view and solves a complex nonlinear optimization problem with multiple constraints. For example, a reconstructed particle swarm algorithm is used to solve the problem of optimal energy management in the microgrid operation and realize optimal control of power flow. 25 To sum up, the exploration of power flow optimization control technology of the microgrid could contribute to the future development of smart grid. However, the technology is still in the development stage, and the use of historical operation data for relevant analysis of power flow optimization control is insufficient.
The traditional stochastic power flow methods can obtain the distribution characteristics of DGs and load that take into account the amount of computation and computational accuracy. Its advantage is that it can directly analyze the DGs and load. However, further research is needed on how to characterize the stochastic characteristics of the system by considering the correlation between the stochastic factors, and how to optimally control the stochastic power flow in the microgrid system based on the analysis of historical operation data.
To solve the above problems, a stochastic power flow calculation and optimal control method for microgrid based on multivariate stochastic factors fusion-sensitivity (MSFF-sensitivity) is proposed by combining the traditional stochastic power flow method with the Newton-Raphson method. The method proposed in this paper has significant advantages over the traditional stochastic power flow calculation of microgrid. Firstly, MSFF function is used to extract the stochasticity of power flow in the microgrid, and the correlation between DGs and load in the microgrid is reflected and integrated. The problem of insufficient integration of distribution characteristics of multiple stochastic factors in the traditional stochastic power flow is solved. Further, the F-sensitivity function of power flow analysis of microgrid integrated into the distribution network is constructed to characterize the influence degree of stochastic factors in the microgrid on power flow of the distribution network. Finally, based on the above two points, the power flow of the distribution network is optimally controlled so as to improve the rationality of power flow and voltage quality of the distribution network after the microgrid is integrated into distribution network. Besides, the influence of a single random factor on the distribution network, which cannot be fully considered in traditional stochastic power flow method, has been solved.
Stochastic power flow and voltage quality analysis for grid-connected microgrid
Microgrid structure and stochasticity principle
Microgrid is a small-scale power generation and distribution system integrated by DGs, loads, energy storage and related power electronic conversion devices, and it is an autonomous system capable of self-protection, control and management. 26 As a whole, the microgrid can be connected to the distribution network through the public connection point (PCC), and can also be connected to the distribution network for network operation. In other conditions, such as the breakdown of the distribution network or according to the system operation requirements, the microgrid can be disconnected from the distribution network by separating the PCC and the distribution network to form an isolated island mode for independent operation. As shown in Figure 1:
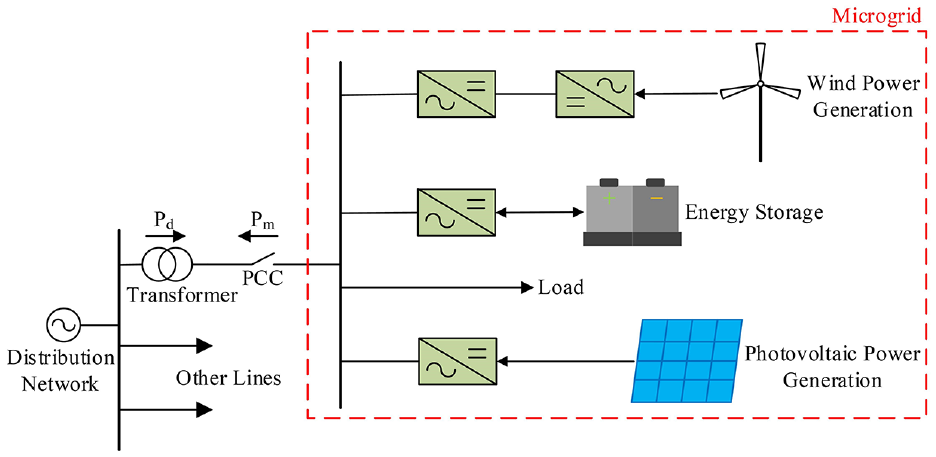
Schematic diagram of the microgrid structure.
As can be seen from Figure 1, when operating in grid-connected mode, the microgrid can not only serve as the load of the distribution network to obtain electricity from the network, but also act as a power source of the distribution network to supply energy to each other within the network. 27 However, the power supplied by the DGs can be greatly affected by the change of external weather conditions, which has great intermittency and stochasticity. In addition, the load fluctuates with the difference of time period, and also has a large stochasticity, which affects the reliable operation of the system to a certain extent. In summary, due to the uncertainty of the power flow inside the microgrid, when multiple or large-capacity microgrids are integrated into the distribution network, the power flow of the distribution network will be affected by these stochastic power flow. The reliability of the power supply and the voltage quality of the distribution network are further affected by them.
Power flow variation for grid-connected microgrid
The DGs and load in the microgrid will change the steady-state power flow distribution of the nearby regional grid, and then produce a series of influences on the power flow of the distribution network. A simplified model of microgrid grid-connected system is shown in Figure 2:
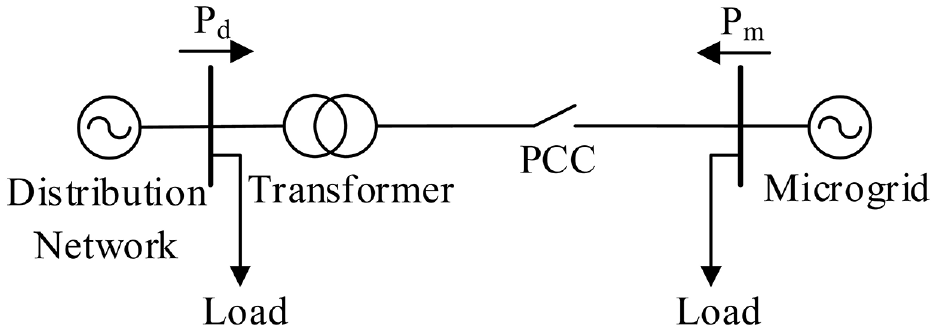
Simplified model of microgrid grid-connected system.
As can be seen from Figure 2, the traditional distribution network has a centralized conventional generator along the feeder line, and the active power flows from the centralized generation unit to the end users through the feeder. However, this situation is broken by the emergence of the microgrid. The microgrid is generally located at the end of the power system and the structure is relatively weak. The power of DGs and load varies with stochastic factors such as wind speed, light intensity and users’ electric appliance usage, resulting in real-time changes of permeability of the microgrid and voltage fluctuation of the distribution network. So, all things considered, the voltage quality of the distribution network needs to be evaluated systematically.
Analysis and evaluation method for the influence of stochastic power flow on the voltage quality of the distribution network
The evaluation indicators for the voltage quality of the distribution network are particularly important. Due to the stochastic fluctuation of DGs and load, the voltage V(t) at any monitoring point of the system at any moment is a random variable. And the voltage V(t1) and V(t2) of a monitoring point of the system at two different moments are two random variables, so theoretically the system voltage V(t) is a stochastic process. For a given set of voltages V(t1), V(t2), ⋯, V(tn) at a monitoring point, we can consider the voltage monitoring values V(t1), V(t2), ⋯, V(tn) at n different moments as n observations of repeated test with a random variable. On this basis, this paper analyzes the numerical characteristics of estimation node voltages, that is the various evaluation indicators of voltage quality, and applies this method to fit the probability density curve of voltage, thus forming an evaluation method system of voltage quality.
Mathematical expectation and variance of the voltage in the distribution network
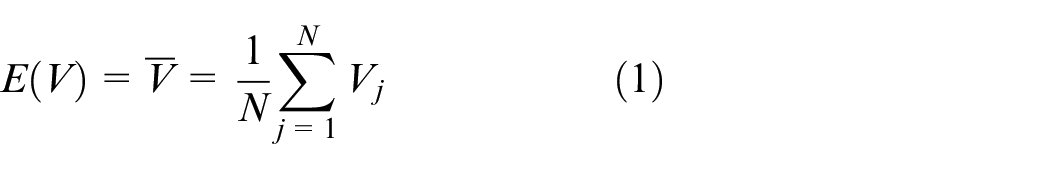
where
From the equation (1), it can be seen that the mathematical expectation of the voltage is the average voltage, which can reflect the voltage level of each node within the statistical date period. The variance reflects the deviation value between the actual voltage and the ideal voltage, which is generally given as the following estimated calculation equations (2) and (3) 29 :
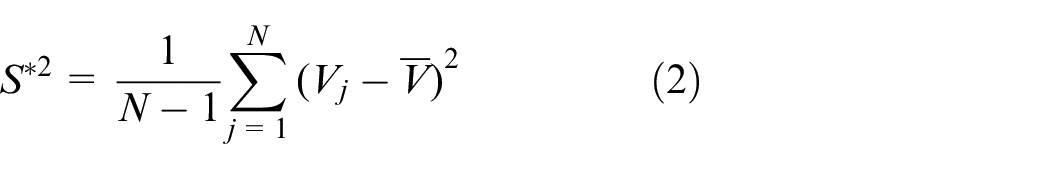
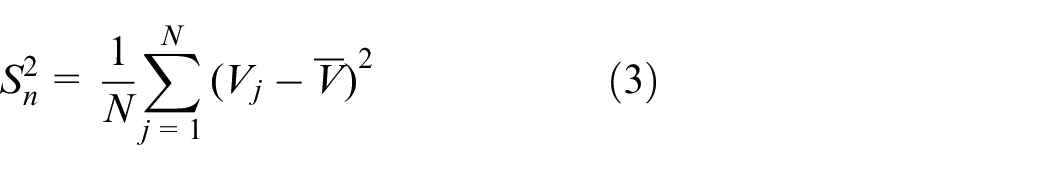
where
Because of
To sum up, by comparing the average voltage and variance of each node, the voltage distribution characteristics and differences of the system can be clearly mastered.
Probability distribution of voltage in the distribution network
When theoretically studying the system voltage variation law in mathematical statistics, voltage quality should be analyzed and evaluated comprehensively, and the probability distribution characteristics are considered, which can make the analysis and evaluation of system voltage quality more objective. 30 The voltage sampling values are adopted to construct the probability density function curve of the system voltage variation and the voltage exceeding the limit schedule.
Since the nodal voltage is a stochastic process, the N times sampled values can be regarded as N sampled observations of the same random variable. The probability density curve of the voltage can be depicted by using the curve fitting technique in mathematical statistics. The probability density curve can visually describe the density of the voltage distribution and its fluctuation can reflect the uniformity of voltage distribution in the system. The probability is the density function value of the voltage. The higher the probability, the more likely the voltage falls on this value. The probability distribution curve style of the voltage is shown in Figure 3:
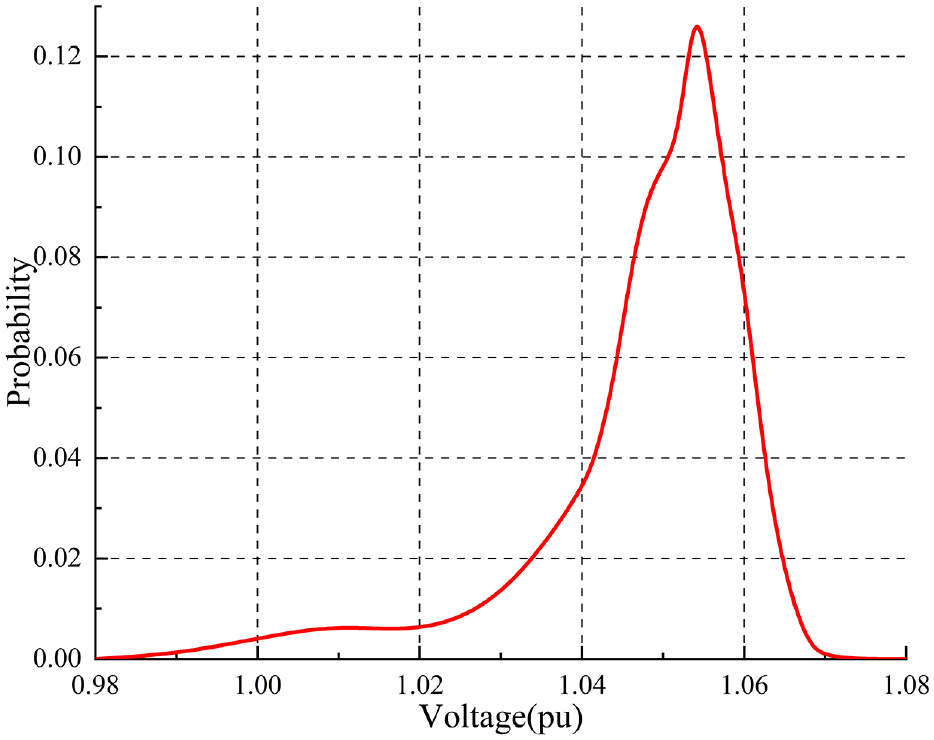
Probability distribution pattern diagram of voltage.
Voltage quality evaluation process of distribution network
The evaluation process of the voltage quality issues in the distribution network requires a specific study according to the topology of microgrids and the influence of various stochastic factors. Therefore, it is necessary to establish a rational voltage quality evaluation process for ensuring the scientific evaluation of the system voltage quality. As shown in Figure 4:
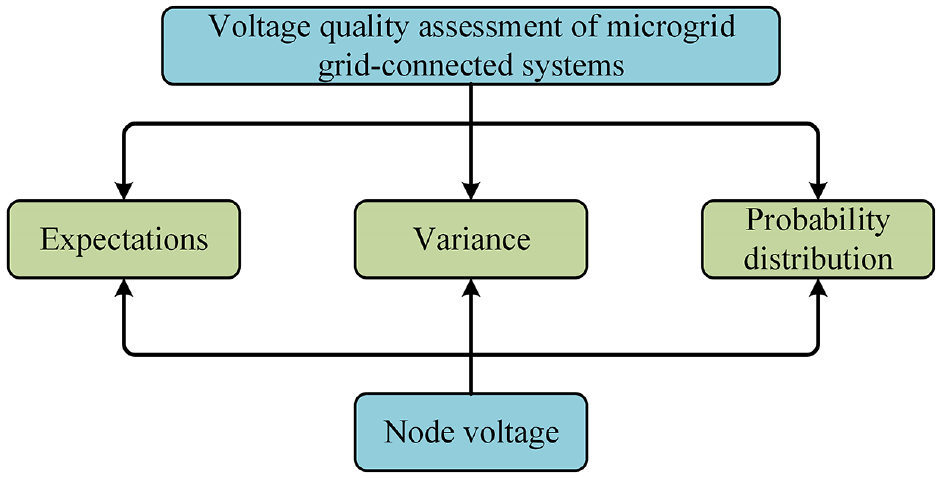
Diagram of the voltage quality evaluation process of a microgrid grid-connected system.
As can be seen from Figure 4, the voltage quality evaluation method of the grid-connected microgrid system is established, which consists of expectation, variance, and probability distribution. The voltage quality of the node is evaluated by processing the above indicators of the node voltage.
Probability distributions can be visualized to describe the density of the distribution of any voltage value. The expectation reflects the ideal voltage of the microgrid grid-connected system as shown in equation (4). From equation (4), it can be seen that the mathematical expectation of the voltage is the average voltage, so the voltage level of each node in the statistical time period can be grasped by the statistics of the average voltage. By comparing the average voltage of each node, the characteristics and differences of the voltage distribution of the grid-connected system of the microgrid can be clearly grasped.
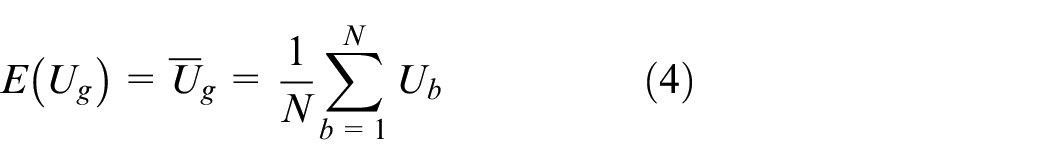
where E(Ug) is the mathematical expectation of the node voltage after the microgrid is connected to the grid, N is the number of voltage samples, Ub is the voltage at this node.
The variance reflects the deviation value between the actual voltage and the ideal voltage, as shown in the following equation (5):
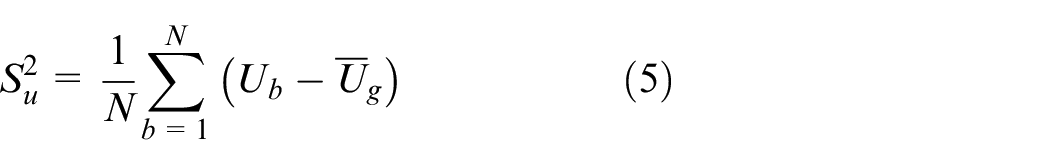
Where
Microgrid power flow calculation and optimal control method based on the MSFF-sensitivity
Power flow calculation plays an important role in the process of reliability evaluation and optimal voltage quality control of the system. The prerequisite is that the influence of stochastic factors on the types of system nodes should be considered and a reasonable probability function of stochastic factors should be established. In the process of the influence of different stochastic factors on the system nodes, they are treated respectively as different types of nodes in this paper. When the power consumed by the load is constant, it can be treated as a PQ node. When the power factor of the wind turbine remains constant by automatically switching the shunt capacitor, it can be treated as a PQ node. 31
The reactive power
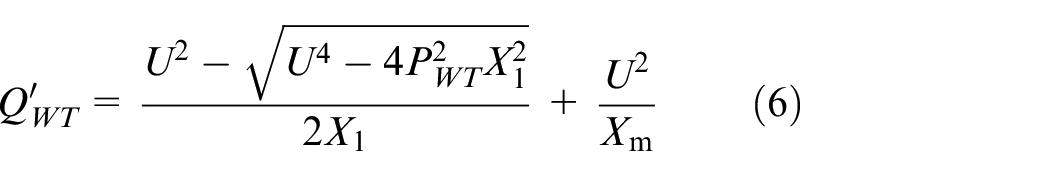
where
After reactive power compensation of shunt capacitor banks, the general power factor reaches above 0.9 and the power factor angle is less than 0. Then the reactive power

where
Therefore, the capacitor banks that need to be connected in parallel:
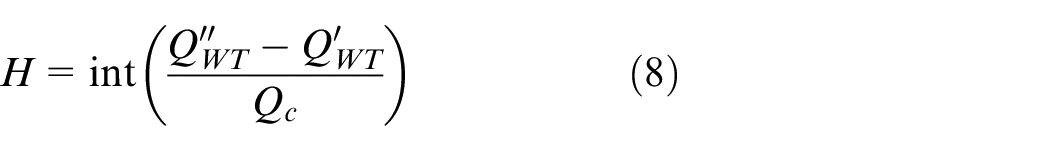
where
As the reactive power output of the shunt capacitor banks is related to the voltage amplitude, the actual reactive power
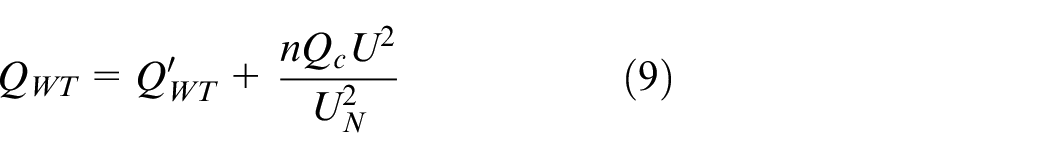
where
In PV systems, for the voltage-controlled type, it is a PV node with a constant active power and voltage output. When the injected current reaches the boundary value, it is converted to current control type to be processed. For current-controlled type, the output of active power and the current injected into the microgrid is constant. Then the injected reactive power
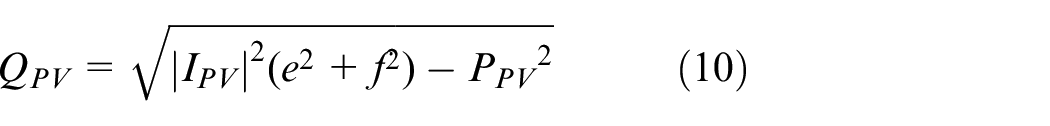
where
In power flow calculation, the injected reactive power is calculated by equation (10) according to the real and imaginary parts of the voltage obtained in each iteration, and then converted into PQ node in the next iteration.
In recent years, a variety of stochastic factor probability functions have appeared to simulate DGs, but they are all based on a certain amount of data, which makes their distributions close to the actual measured values and has certain limitations. However, weather factors such as wind speed and light intensity conform to normal distribution.32–34 In addition, the distribution of wind power, PV power and load power can be analyzed through the following Figures 5–7:
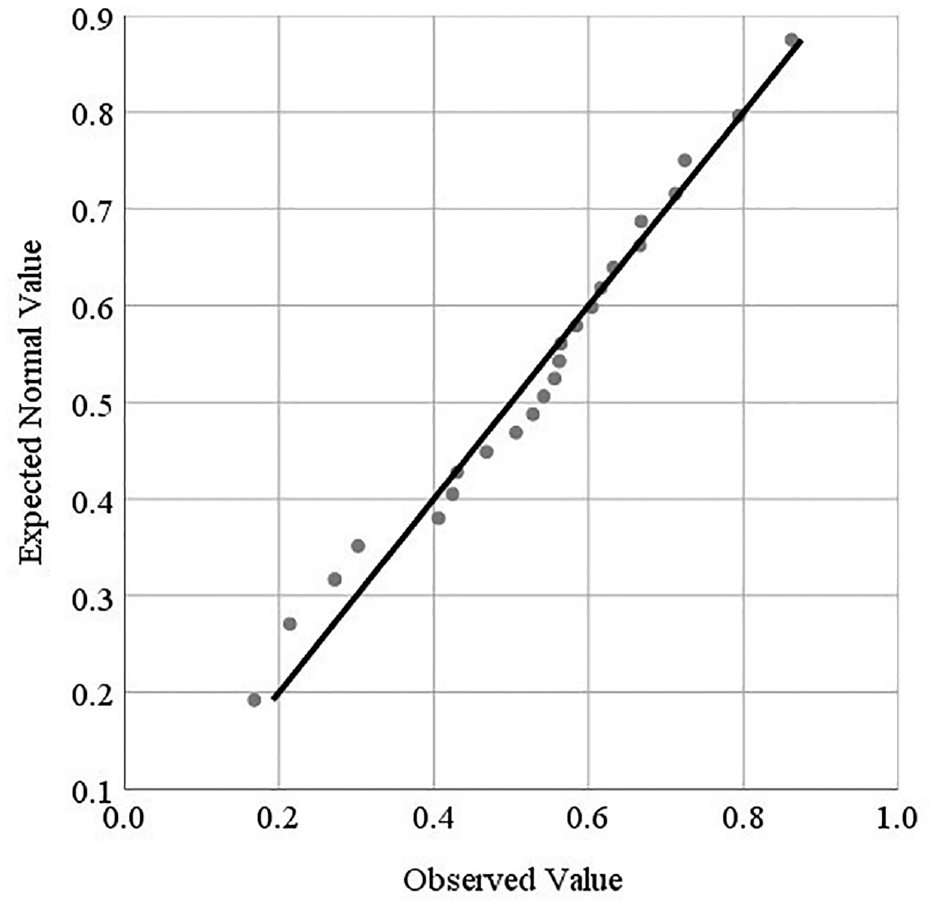
Normal quantile-quantile plot of wind power.
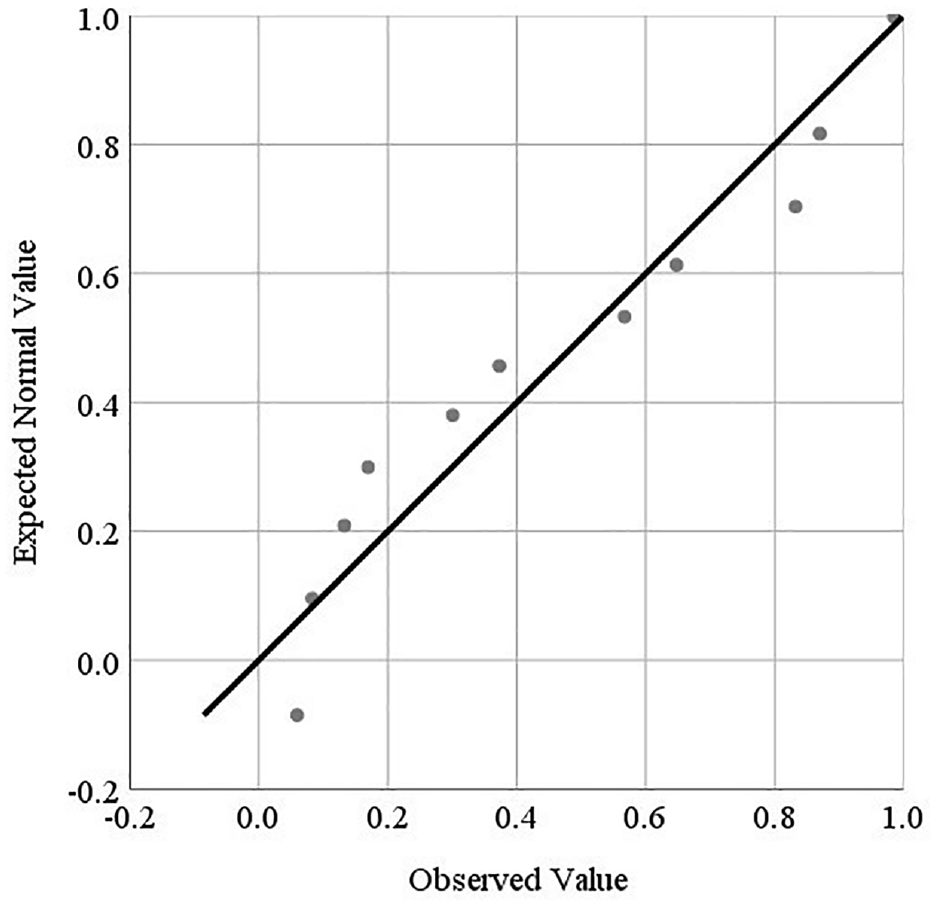
Normal quantile-quantile plot of PV power.
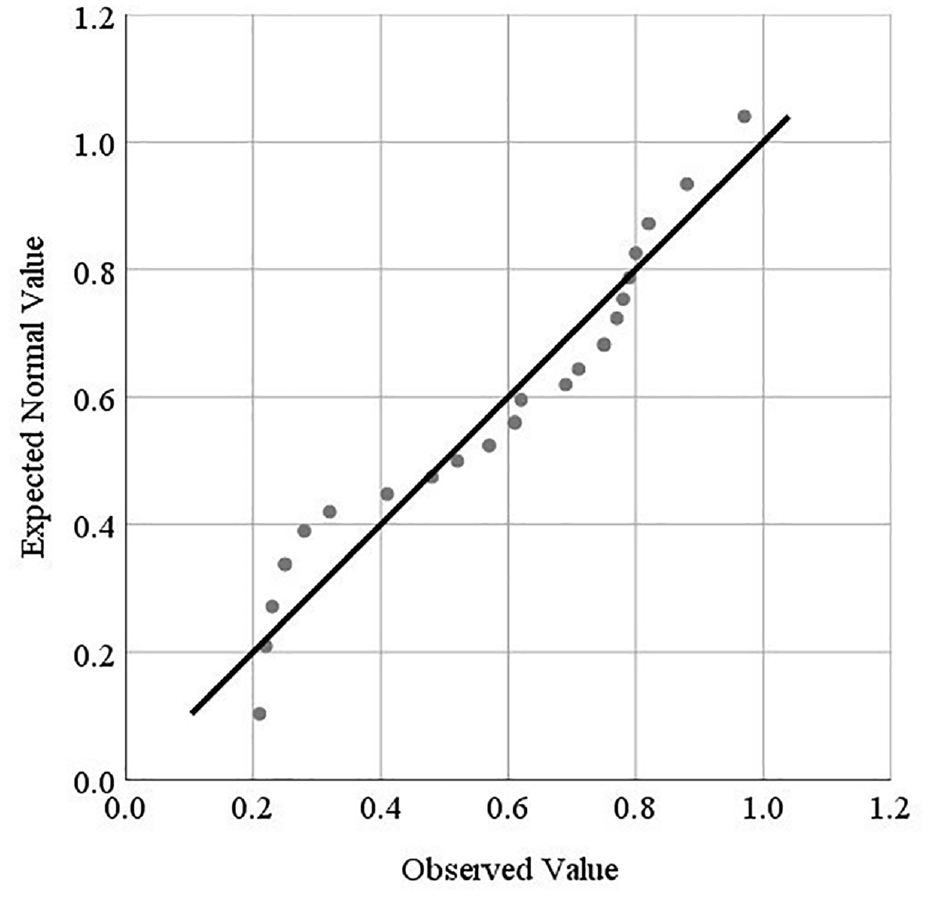
Normal quantile-quantile plot of load power.
It can be seen from Figures 5 to 7 that the scatter points are distributed around the 45° diagonal line. Therefore, the measured values of wind power, PV power, and load power are the expected normal values, but it can be observed from the figure that there is a certain deviation, so it is necessary to carry out standard normalization, so as to establish a more reasonable stochastic factor fusion function through the multivariate normal distribution. On this basis, considering the correlation between stochastic factors, the stochastic characteristics of the system are described, and the rationality of the system power flow should be taken into account.
Therefore, a stochastic power flow calculation and optimal control method for the microgrid based on MSFF-sensitivity is proposed in this paper. MSFF function is firstly developed by using the probability density function of multivariate normal distribution to describe the stochasticity of power flow in the microgrid, and the correlation between DGs and loads in the microgrid is reflected and integrated. Furthermore, F-sensitivity function of power flow analysis of the microgrid and distribution network is constructed to characterize the influence degree of stochastic factors in the microgrid on power flow of the distribution network. Based on this, power flow of the microgrid into the distribution network is optimally controlled, in order to improve the rationality of power flow and voltage quality of the microgrid integrated into distribution network.
The proposed MSFF function based on multivariate normal distribution with normalized transformation
The multivariate normal distribution is built on the basis of on the unary normal distribution, which has wide adaptability and the advantage of automatically capturing the correlation between variables in the analysis of the whole composed of multiple variables. The relationship between the research objects and the variables is described through the probability density function determined by the mean vector μ and the covariance matrix ∑.35,36 The covariance matrix in multivariate normal distribution measures the degree of correlations between variables through the degree of similarity and dissimilarity among variables, which reveals the distribution characteristics of the dynamic correlations of variables. 37
The MSFF function is based on the stochastic factors of DGs and load, so it is important to unify them. The covariance matrix reflects the correlation between the stochastic factors.
The power data set of DGs and load in the microgrid approximately conform to the characteristics of normal distribution. In other word, the power data set does not always follow the normal distribution. Therefore, the proposed method is suitable for a wide range of applications by normalized conversion and standard normalization without changing the distribution characteristics of data size. The established MSFF function can integrate the power data of DGs and load. The specific schematic diagram of the function construction is shown in Figure 8:
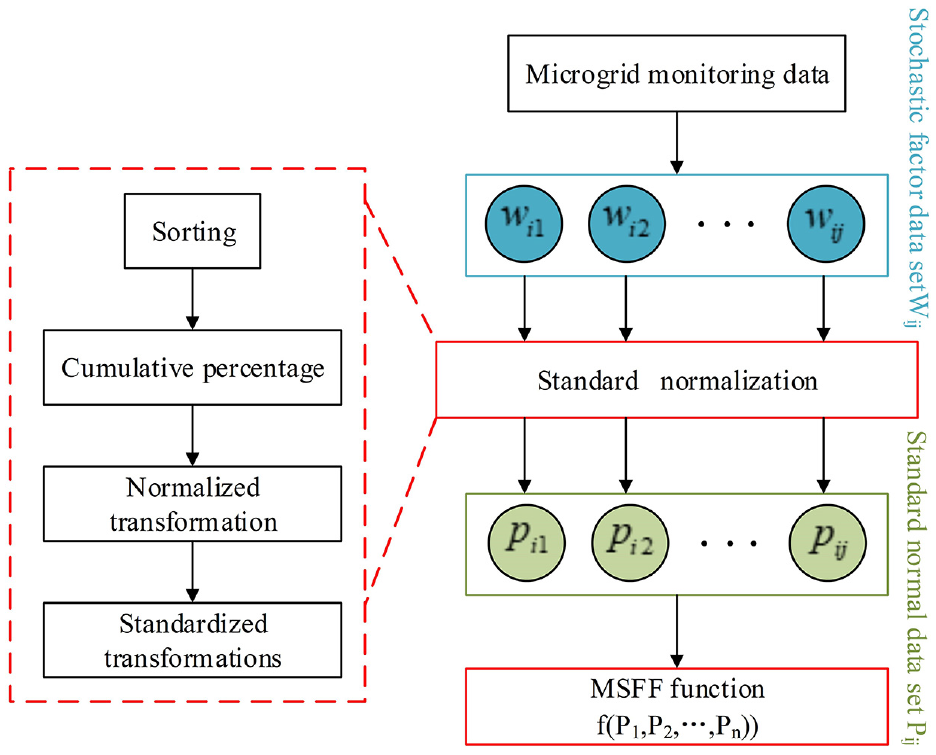
Principle diagram of MSFF function finding.
In Figure 8, wi1, wi2, …, wij are columns 1 to j of stochastic factor data matrix Wij. Similarly, pi1, pi2, …, pij are the number of columns corresponding to standard normal data set matrix; Pij, pi1, pi2, …, pij are random variables of MSFF function f(P1,P2, …, Pn).
It can be seen from Figure 8 that the construction of MSFF function based on multivariate normal distribution is divided into the following processes:
Firstly, the power of the microgrid is sampled for i times, and there are j stochastic factors affecting the power flow of the distribution network, and then the original stochastic factor data matrix Wij is obtained:
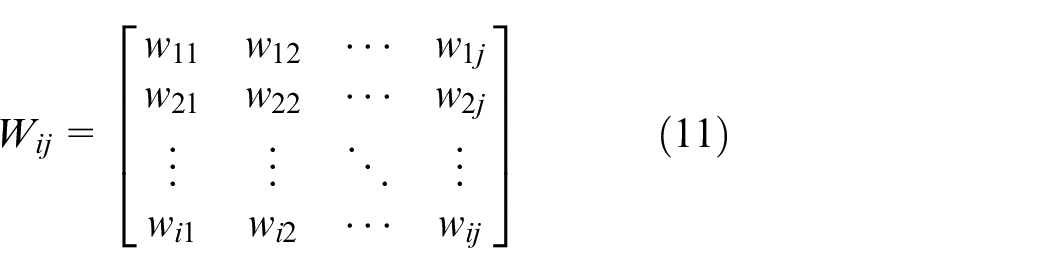
where i is the ith power sampling; j is the power of the jth stochastic factor.
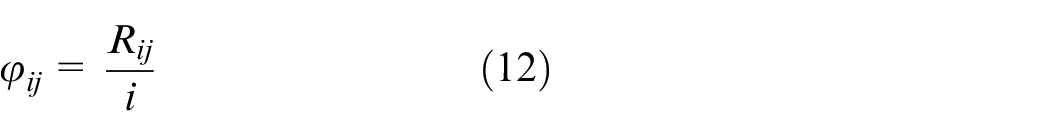
Then each column of the data matrix Wij is sorted in a ascending order respectively to obtain the rank order matrix Rij of each column of Wij. Next, the cumulative percentage matrix
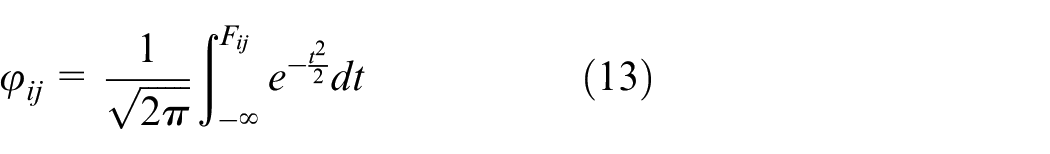
According to the cumulative percentage matrix
By calculating the mean and variance of the normalized value matrix Fij, and normalizing it to the following equation (14), it can be converted into a standard normal data matrix Pij:
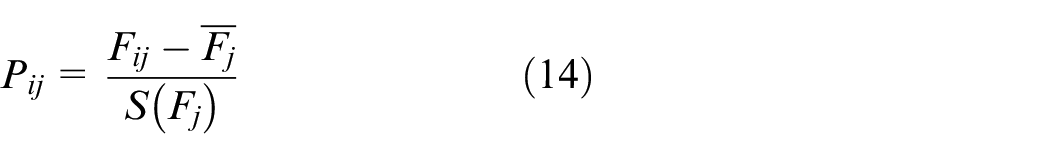
where
The mean vector
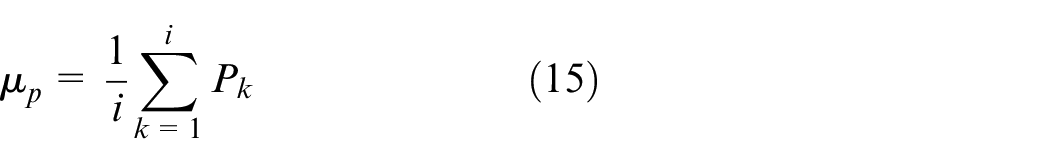
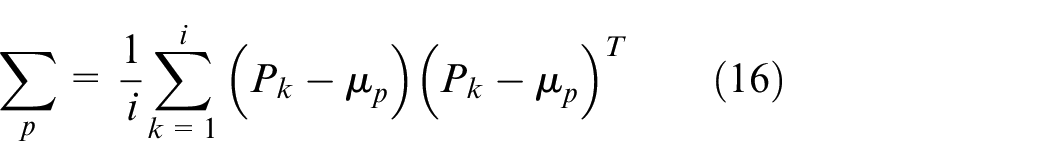
where Pk is the kth column stochastic factor power of matrix Pij.
Finally, the MSFF function f(P1,P2, …, Pn) with n stochastic factors can be obtained by equation (17):
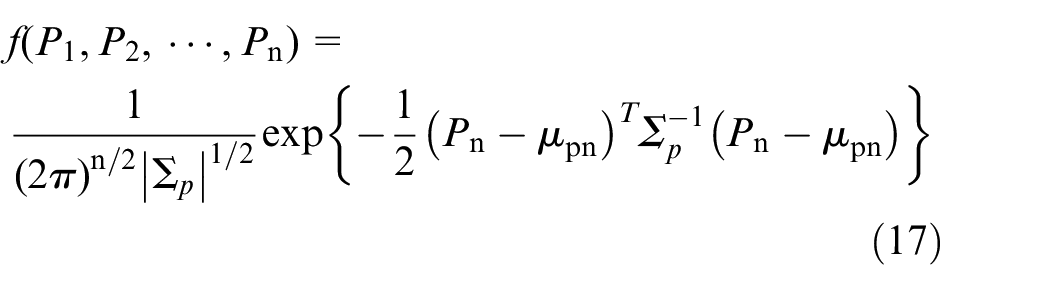
where P1, P2, …, Pn are the standard normal power data set of each stochastic factor of the microgrid,
Influence degree weights of stochastic factors based on the F-sensitivity function
Sensitivity analysis is a method to study and analyze the sensitivity of the output state of a system to the input variables of the system. The relationship between the uncertainty of the system state and the uncertainty of the input can be obtained through sensitivity analysis.39,40 The sensitivity analysis method is used to test the influence degree of a single parameter on the model results when the nominal value point changes, which is the partial derivative in the mathematical sense. It has high computational efficiency in analyzing the impact of single index change on the system.
The MSFF function unifies the power of each stochastic factor in the microgrid only in form, and beyond that, it cannot specifically quantify the power variation of the stochastic factors.
Therefore, the F-sensitivity function is constructed based on the MSFF function in this paper to present the influence degree of each stochastic factor in the microgrid on the power flow of the distribution network. The process of analyzing the sensitivity is analogized to the weights and the obtained power sensitivity is normalized. The influence degree of stochastic factors in the microgrid obtained in this paper provides the basis for the next power flow calculation. The specific principle of the model shown in Figure 9:
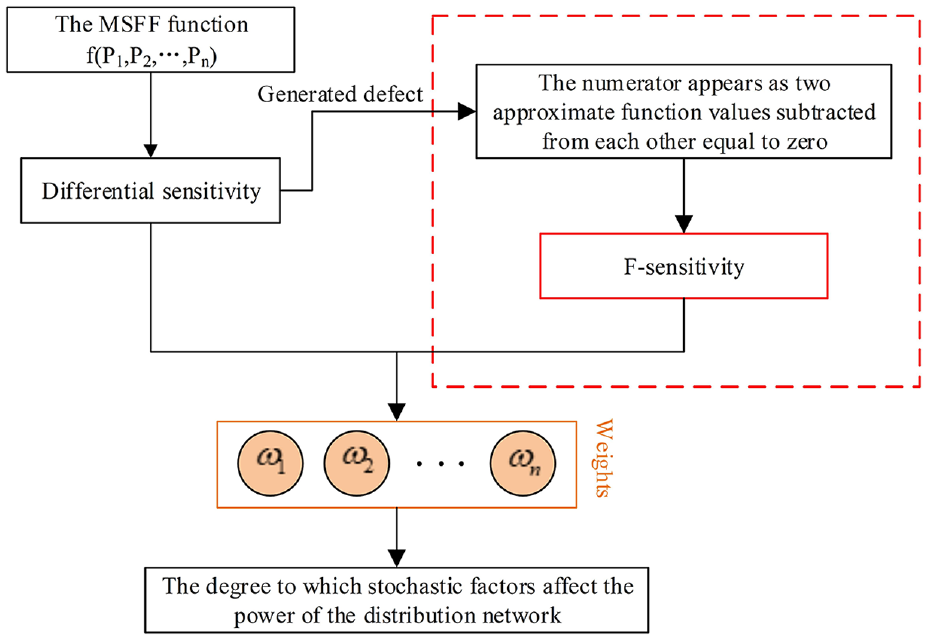
Principle diagram for finding the weight of the influence degree of stochastic factors in microgrid.
In Figure 9,
As can be seen from Figure 9, the MSFF function
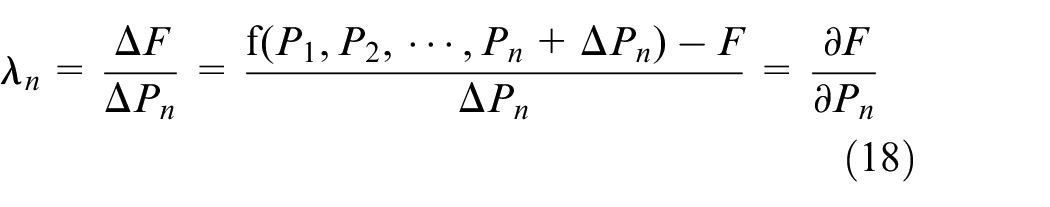
where
When applying differential sensitivity in practice, it often has the problem of selecting
Therefore, F-sensitivity function is established in this paper to solve this problem, which is based on the sensitivity of plural step. F-sensitivity is performed by Taylor expansion of function
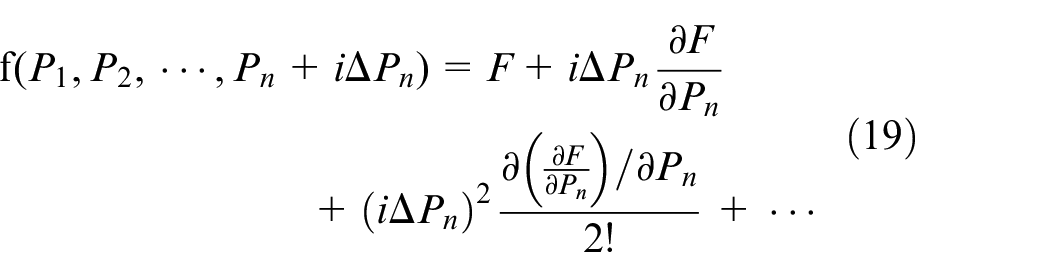
The imaginary parts from left and right ends of the equation (19) are simultaneously taken and the higher order terms are omitted. The following equation can be obtained:
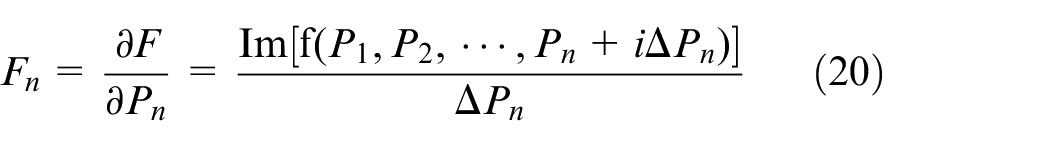
where
On this basis, the higher F-sensitivity, the greater the influence degree of this power on the power of distribution network. Conversely, the lower F-sensitivity, the less the influence degree of this power on the power of the distribution network. To some extent, it is similar to the concept of weights. Therefore, it is called as F-sensitivity weight of the influence degree of stochastic factors in the microgrid in this paper. The equation is as follows:
where
Optimal control algorithm for stochastic power flow in the microgrid based on MSFF-sensitivity
Based on the above MSFF-sensitivity, the stochastic characteristic of each factor in the microgrid are extracted, including DGs in the microgrid, such as wind power, PV power, and load. The MSFF function is used to integrate the stochastic characteristics of these independent factors together. Further, F-sensitivity function constructed by the stochastic factors in the microgrid and the voltage quality of the distribution network is adopted. In the form of sensitivity, the different weights of the factors affecting the voltage quality of the distribution network in the microgrid are characterized.
Based on the above research, a stochastic power flow optimization control algorithm is proposed in this section for the microgrid integrated into the distribution network. It is shown in Figure 10:
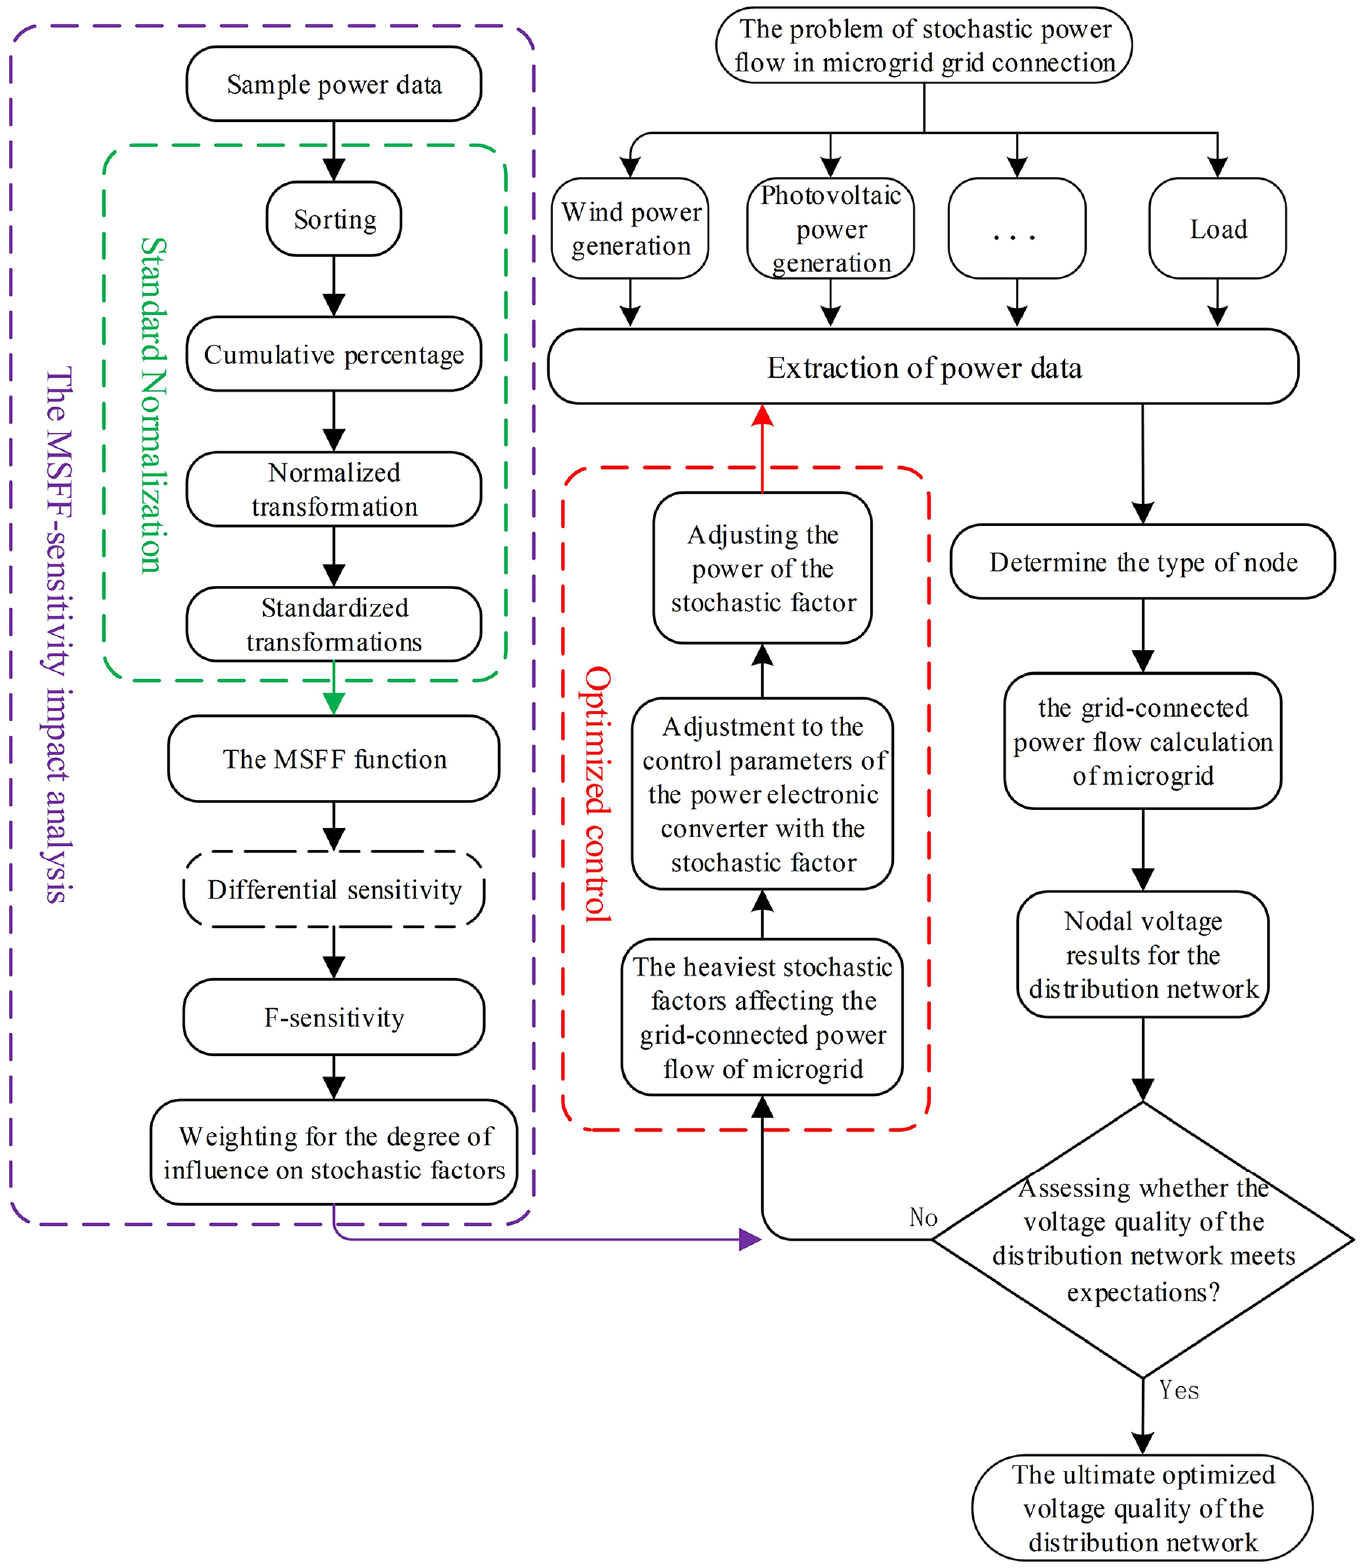
Process diagram of optimal control algorithm of the microgrid grid-connected stochastic power flow.
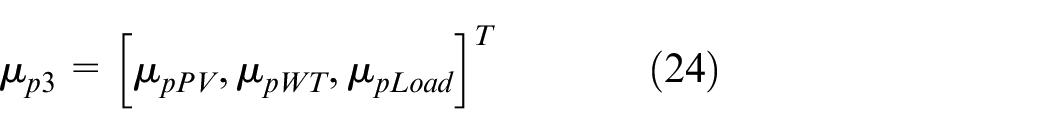
As can be seen from Figure 10, according to the fusion results of the multivariate normal distribution of the microgrid, the stochastic characteristics of DGs and load are fused into the function. The function equation is as follows:
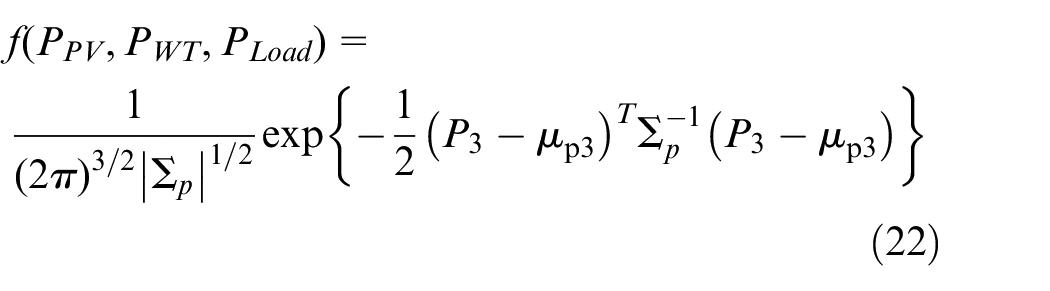
where P3 and µp3 are both in matrix form, as shown in equations (23) and (24):

Further, a sensitivity function is used to obtain the sensitivity weights of influence degree. Taking the weight of PV power generation as an example, the equations are as follows:
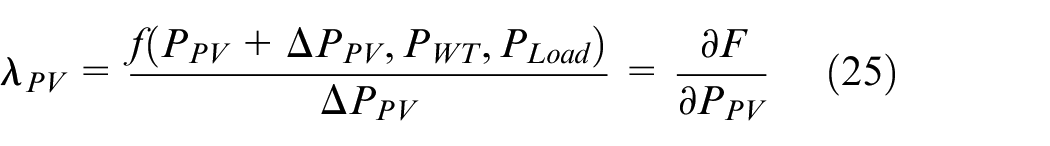
where ωPV in equation (26) is the influence of PV generation on stochastic power flow. Based on this, the weights of wind power and load are obtained.
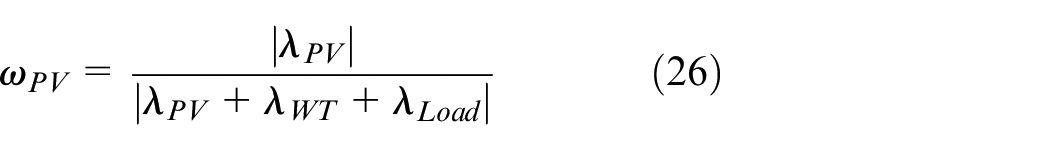
The characteristics of random factors of distributed power and load are mined from the data perspective to be applied in Microgrid power flow calculation. However, the stochastic factors affect each other and there is a correlation in the data, so the optimization control algorithm in this paper adopts the multivariate stochastic factor fusion function (MSFF function) and the fusion sensitivity (F-sensitivity) to excavate the information in the data to effectively unify the multivariate stochastic factor distribution characteristics, which solves the two problems mentioned above. The schematic diagram of the optimized control algorithm is shown in Figure 11:
Principle diagram of optimal control algorithm based on MSFF-sensitivity.
The optimal control algorithm starts with a preliminary voltage quality assessment, namely the expectation, variance, and probability distribution of the voltage. The mathematical expectation reflects the ideal voltage of the nodes, and the characteristics and differences of the voltage distribution at each node can be seen from the equation (4) in the text. The variance reflects the amount of deviation of the actual voltage from the ideal voltage, and the degree of deviation is measured by the equation (5) in the text. The probability distribution curve reflects the uniformity of the distribution network voltage distribution, which can be visualized as the distribution density of the distribution network voltage values. In Figure 3, it can be seen that a higher probability indicates a higher likelihood that the voltage will fall at this value. It is also combined with the sensitivity and weights in the sensitivity function equations (25) and (26) so as to analyze the stochastic factors that have a significant impact on the grid-connected power flow of the microgrid. Next, the optimization of the microgrid grid-connected power flow can be performed with flexible adjustment of the larger weighted PV power. In other words, the control parameters of the PV inverter are adjusted to change its output active power. And the correlation between stochastic factors is evaluated. Finally, a further voltage quality assessment of the power flow is performed. And the previous steps are iterated for optimization purposes.
Algorithm verification
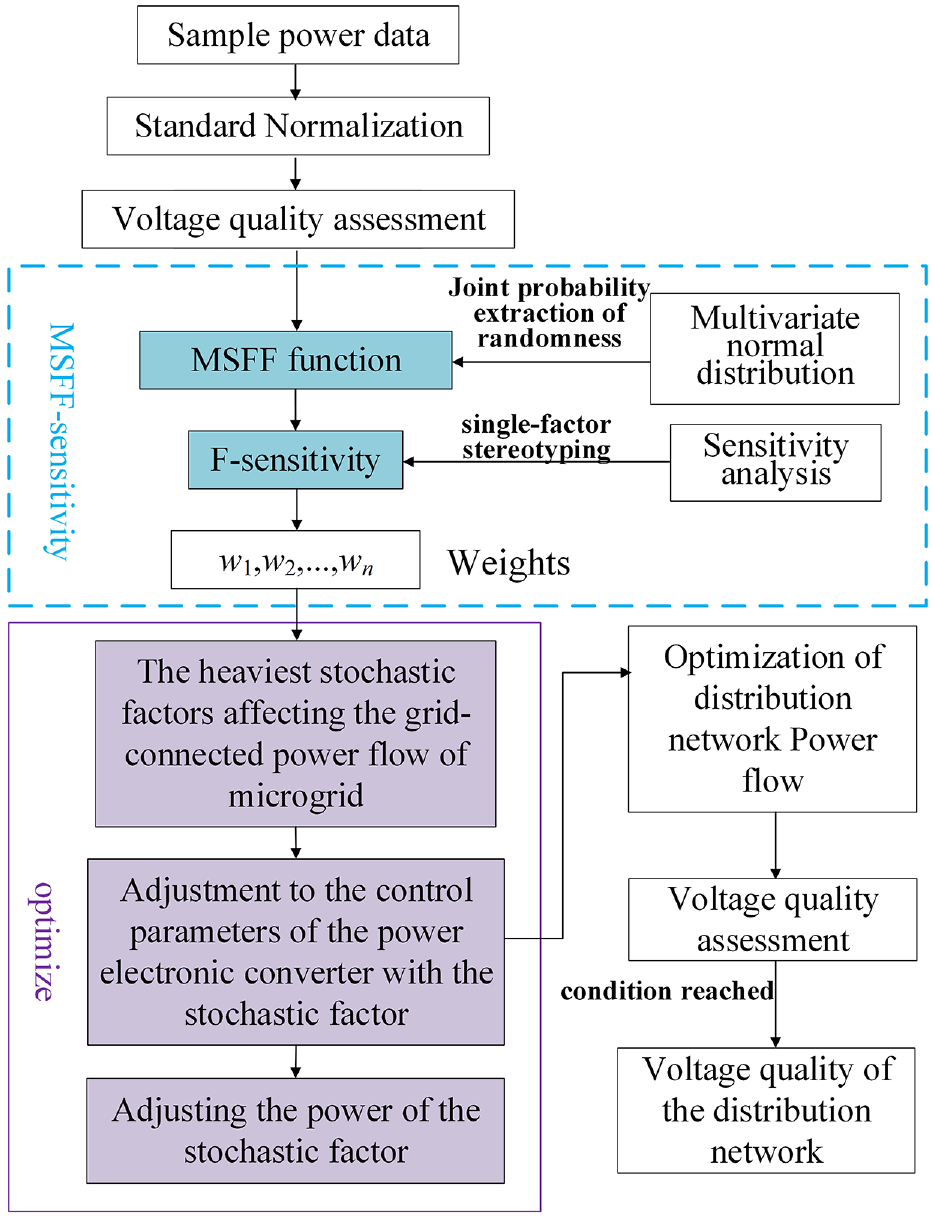
In order to verify the feasibility and effectiveness of the proposed novel stochastic power flow calculation method, IEEE33 node system is adopted to connect the microgrid by using feeder in this paper. The wiring is shown in Figure 12:
IEEE33 node and microgrid wiring diagram.
As can be seen from Figure 12, the microgrid is connected from node 18 and its interior is composed of wind generator, PV generator and load. The wind turbine is an asynchronous generator with a rated power of 50 kW. The PV generator is a generating set with a rated power of 50 kW.
Besides, the typical monitoring data of a microgrid field is extracted and used in this paper, as shown in Figure 13:
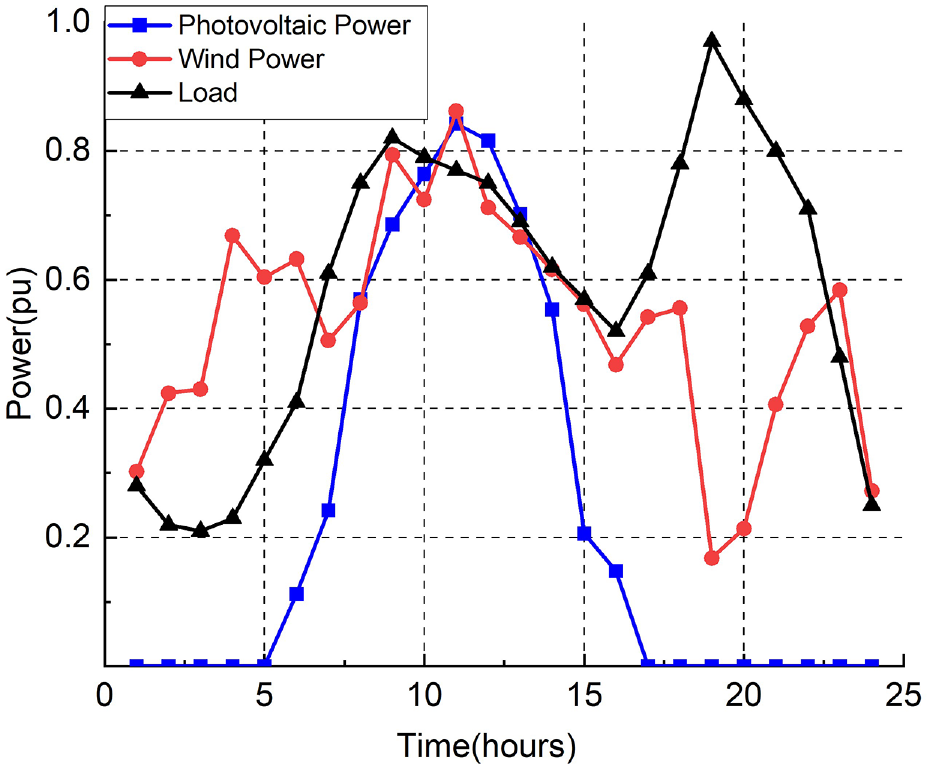
Graph of microgrid monitoring data.
As can be seen from Figure 13, there is a relatively large stochasticity in the PV power, wind power and load power. Therefore, it is impossible to judge the degree of dispersion. In addition, the influence of PV power, wind power and load power on the distribution network power flow needs to be further explored.
Weighting results of influence degree of stochastic factors in microgrid
Standardized normal data can be obtained based on the monitored data by equations (11)–(14), as shown in Figure 14:
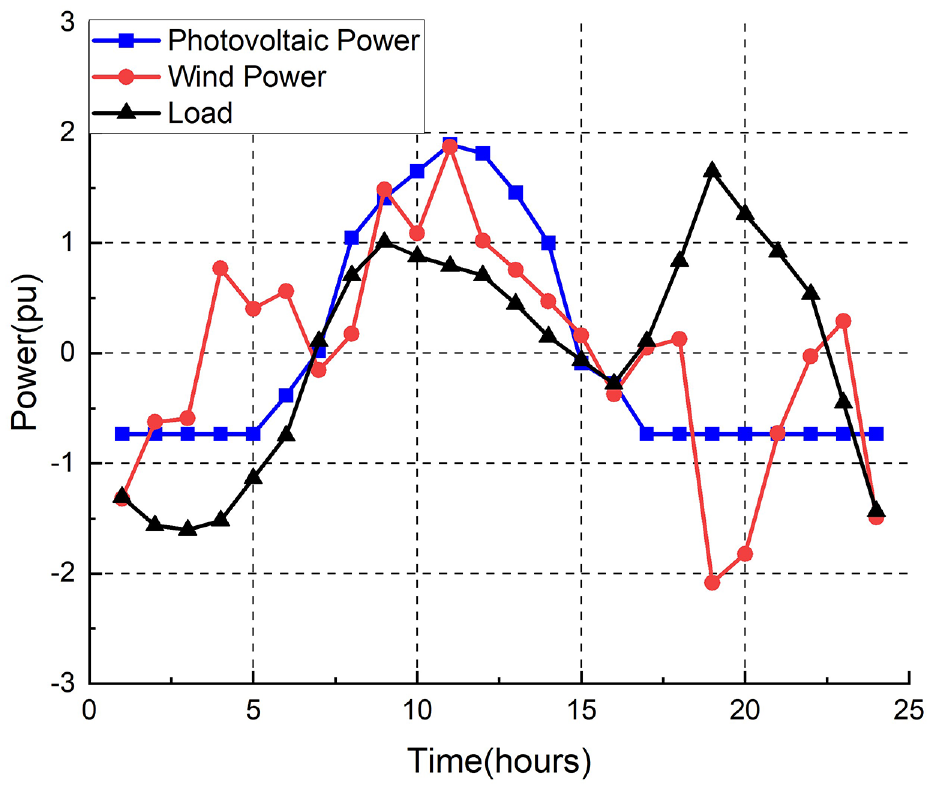
Standardized normal data plot.
The covariance matrix
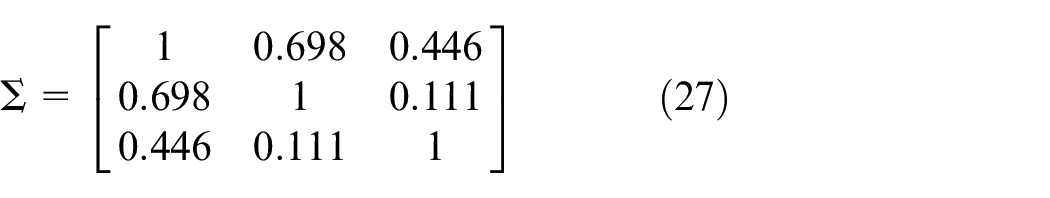
The mean vector and covariance matrix are substituted according to equation (17) to obtain MSFF function as follows:
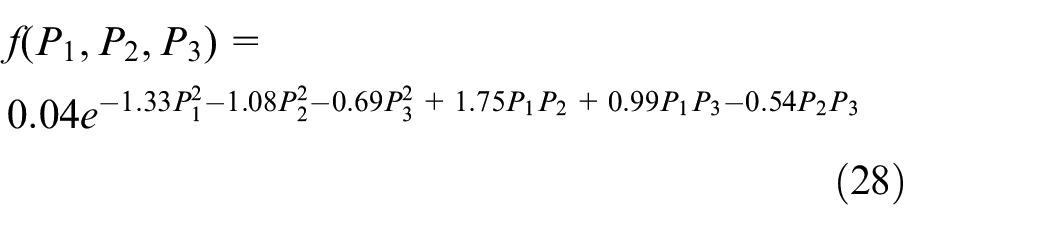
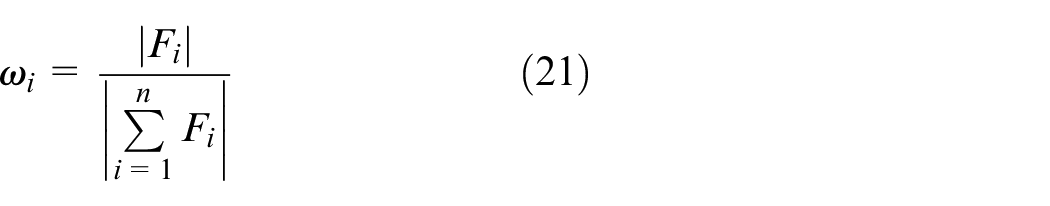
The power weights of each stochastic factor are obtained according to equations (20) and (21):

The above weights can be visually reflected as shown in Figure 15:
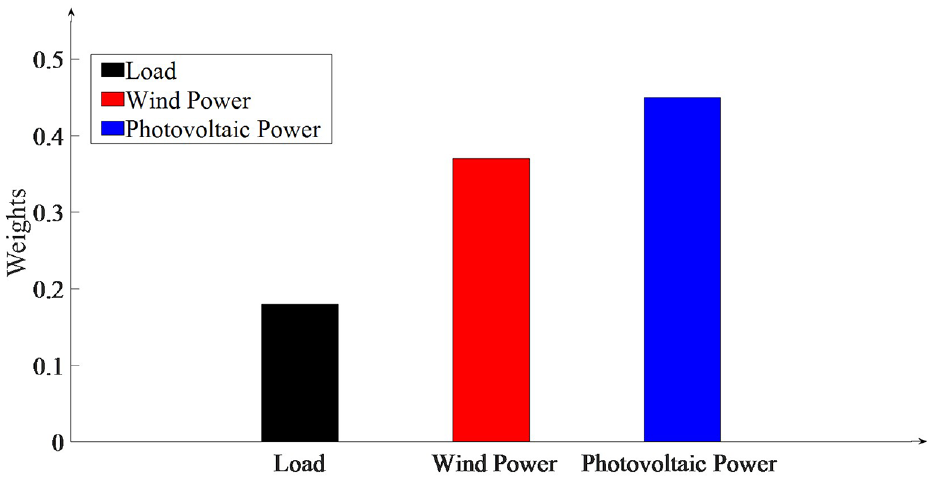
Microgrid stochastic factor power weights.
As can be seen from Figure 15, PV power generation accounts for the largest weight in the proposed microgrid power flow calculation method based on MSFF function by comparing the power weight results, indicating that the stochastic factor has the highest influence degree on the distribution network.
Comparison of methods for each indicator of voltage quality in distribution network
Compared the conventional Monte Carlo Simulation method (MCS) with the proposed method in this paper, it can be found that the conventional MCS incorporates probabilistic models of DGs and load, and generates its input and output data through Monte Carlo simulation. In addition, combined with the Newton Raphson method, the stochastic power flow calculation of the microgrid connection can be realized and the voltage quality of the distribution network is obtained. The conventional MCS can accurately verify microgrid grid-connected data, but it takes a long time to calculate and cannot optimally control the power flow of its system. In other words, it cannot improve the voltage quality of the distribution network. In comparison, in order to verify the advantages of the proposed method, the required sample in this paper is relatively small, and 400 simulated samples are selected. In this paper, MSFF method is proposed to calculate stochastic power flow in the microgrid based on MSFF function. MSFF function is used to describe the stochasticity of power flow in the microgrid, and the correlation between DGs and load in the microgrid is reflected and integrated, so as to calculate stochastic power flow. Furthermore, MSFF-sensitivity method that refers to the optimal control method for the microgrid power flow based on MSFF-sensitivity is proposed. On the basis of the MSFF function, F-sensitivity function of power flow analysis in the microgrid and the distribution network are constructed to characterize the influence degree of each stochastic factor in the microgrid on power flow in the distribution network. Based on this, the power flow of the microgrid integrated into the distribution network is optimally controlled to improve the rationality of the power flow and the voltage quality of the distribution network after the microgrid is integrated into the distribution network.
The maximum allowable voltage deviation of the power network selected in this paper is plus or minus 7%. In the grid-connected mode of microgrid, the average voltage at each node of the distribution network is shown in Figure 16:
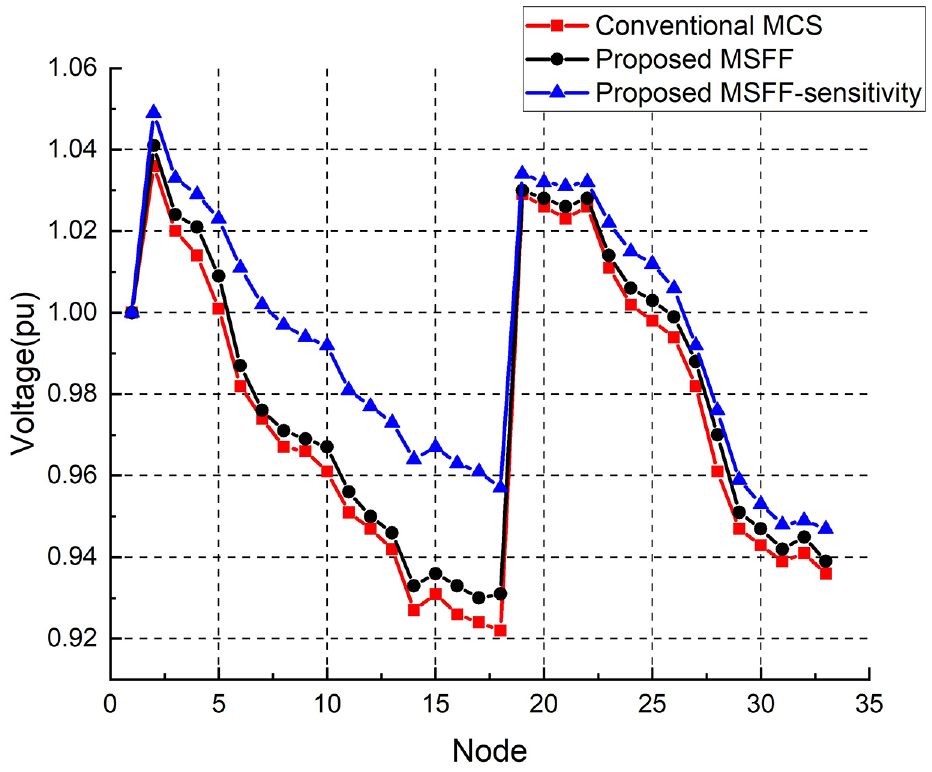
Average voltage curves at each node of the distribution network.
As can be seen from Figure 16, the node type of node 1 is a balanced node, and the voltage of this node is constant, so it cannot compare the voltage quality of different methods. However, according to the other nodes in the figure, it can be seen that the average voltage of MCS is small, which means that the overall voltage deviation of MCS is large. In the case of small samples, the stochasticity of the DGs and load in the MCS simulation microgrid has certain errors, resulting in a large voltage deviation of the average voltage of each node of the distribution network. In the case of the same samples, the MSFF method proposed in this paper can effectively present the stochasticity and correlation of power flow in the microgrid, improve the accuracy of stochastic power flow calculation and make the overall voltage deviation less than MCS. On this basis, MSFF-sensitivity proposed in this paper optimally controls the power flow, improve the average voltage at each node of the distribution network, and effectively reduce the overall voltage deviation.
After the statistical comparison of the power flow data, the voltage variance at each node of the distribution network is shown in Figure 17:
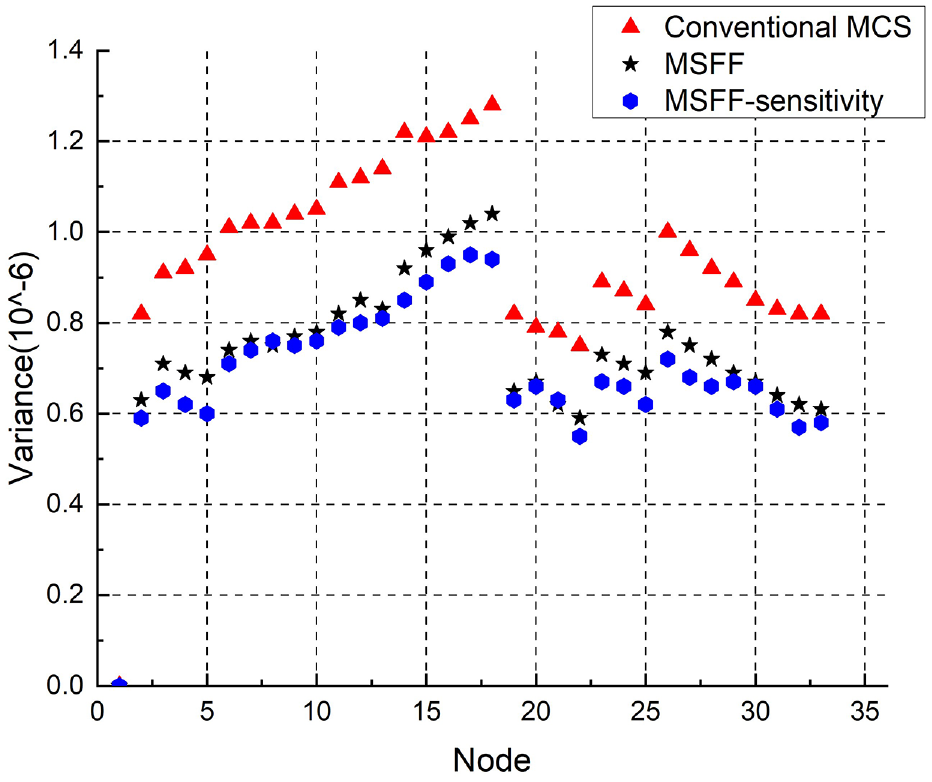
Voltage variance at each node of the distribution network.
As can be seen from Figure 17, the triangular symbols are generally above the star symbols, meaning that in the grid-connected mode of the microgrid, the variance of MCS is generally greater than that of MSFF. Thus, it is verified that there is a certain error in the stochasticity of DGs and load within the MCS simulation microgrid, resulting in a larger variance of voltage at each node of the distribution network. In the case of small samples, the MSFF method proposed in this paper can effectively characterize the stochasticity and correlation of power flow in the microgrid, improve the accuracy of stochastic power flow calculation and make the overall voltage variance smaller than MCS. On this basis, MSFF-sensitivity proposed in this paper optimally controls the power flow and further reduces the voltage variance of the distribution network. From the perspective of statistical significance, it indicates that the amplitude of voltage fluctuations is decreasing and the MSFF sensitivity method has a certain smoothing effect on the stochasticity of DGs and load.
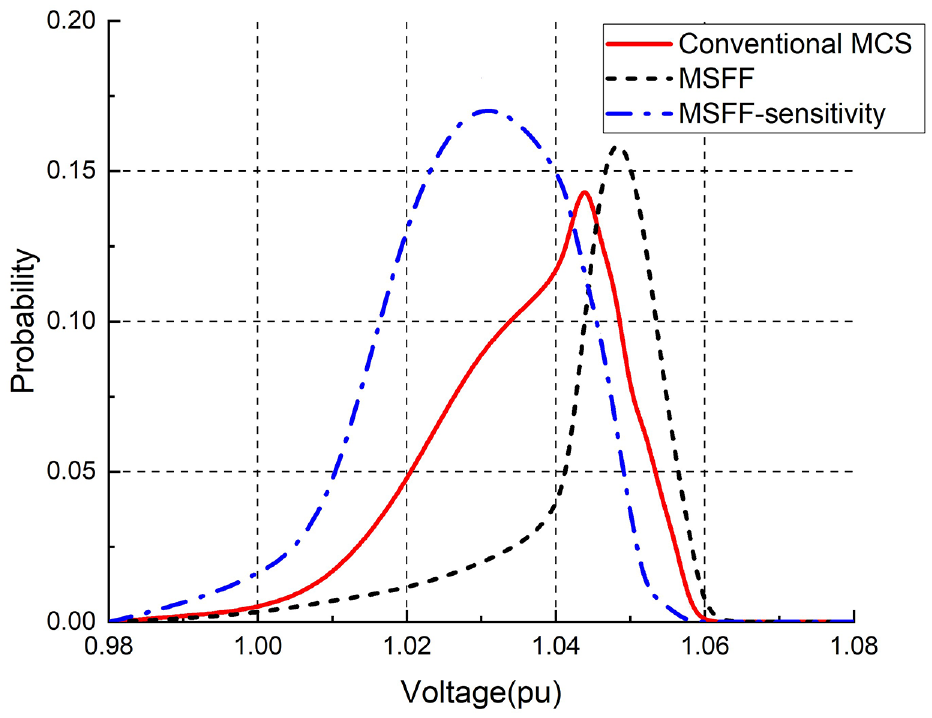
Further, since the PCC is located between the microgrid and the distribution network, it is important to study the PCC for the distribution network. In the grid-connected mode of the microgrid, the specific situation of the PCC voltage can be visualized in Figures 18 and 19:
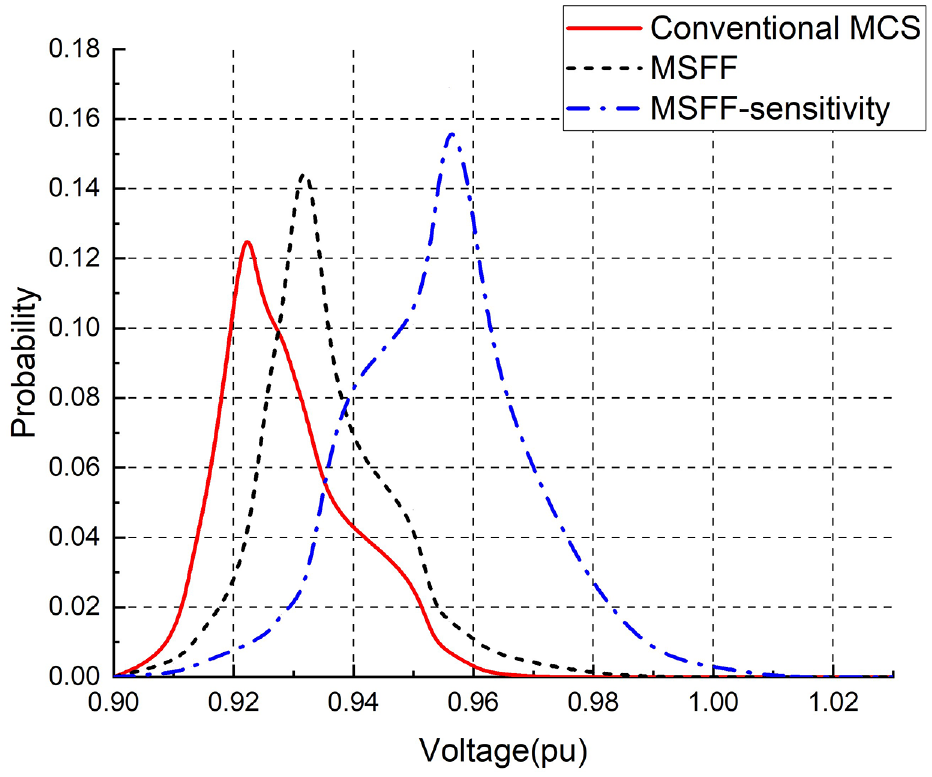
Probability density distribution of PCC voltage.
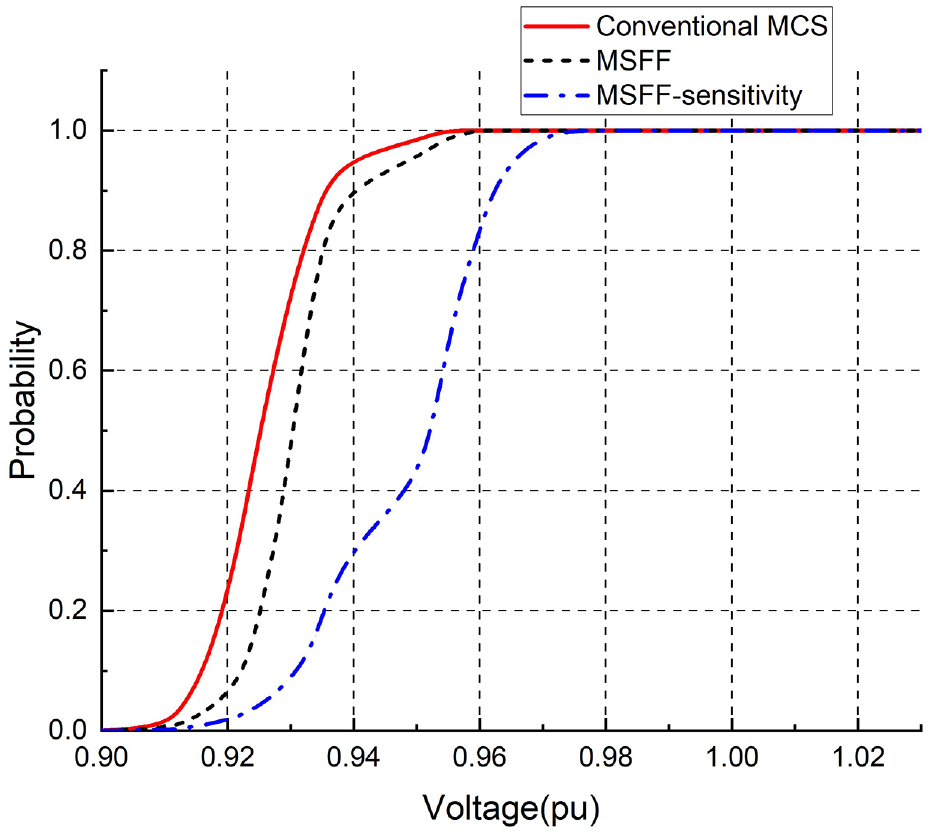
Cumulative distribution of PCC voltage.
From Figure 18, it can be seen that the voltage probabilities of MCS are mainly distributed around 0.921 pu. In the case of small samples, the stochasticity of DGs and load in the MCS simulated microgrid has a certain deficiency, resulting in a certain deviation in the accuracy of power flow calculation and a more dispersed voltage probability distribution. In contrast, the voltage probability of MSFF is mainly distributed around 0.931 pu. In the case of the same samples, the MSFF method proposed in this paper can effectively extract the stochasticity and correlation of power flow for different stochastic factors in the microgrid, improve the accuracy of stochastic power flow calculation, and make the overall voltage probability distribution more concentrated than MCS. In terms of probability, the overall voltage deviation of MSFF is smaller than that of MCS, but still large. On this basis, MSFF-sensitivity proposed in this paper optimizes the power flow control, which makes the voltage probability distribution of PCC more concentrated and can reduces the voltage deviation of PCC so as to effectively improve the voltage quality of PCC.
It can be seen from Figure 19 that the voltage deviation of MCS is relatively large. In terms of distribution, the PCC voltage distribution of MCS is smaller. In contrast, the MSFF proposed in this paper can effectively extract the stochasticity and correlation of power flow of different stochastic factors in the microgrid, improve the accuracy of stochastic power flow calculation, and make the PCC voltage distribution of MSFF become more concentrated than that of MCS. On this basis, the MSFF sensitivity proposed in this paper optimizes power flow control, so that the PCC voltage distribution can be increased more significantly to effectively improve the voltage quality of the PCC.
In the grid-connected mode of the microgrid, PCC is between the microgrid and the distribution network, so it is important to study this system. In contrast, in the isolated island mode of the microgrid, it is node 34. The algorithm is verified by the specific situation of the voltage at this point, which is directly reflected in Figures 20 and 21:
Probability density distribution of node 34 voltage.
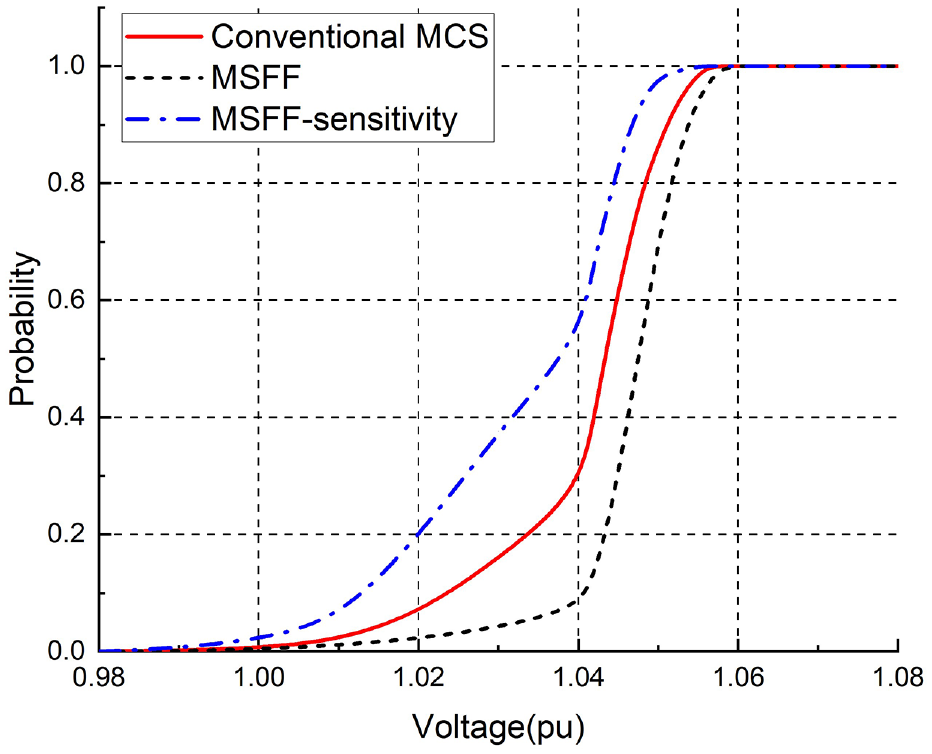
Cumulative distribution of node 34 voltage.
From Figure 20, it can be seen that the voltage probability of MCS is mainly distributed around 1.045 pu in the isolated island mode of the microgrid. In the case of small samples, the stochasticity of DGs and load in the MCS simulated microgrid has certain insufficiency, resulting in a certain deviation in the accuracy of power flow calculation, thus causing a more dispersed voltage probability distribution. In contrast, the voltage probability of MSFF is mainly distributed around 1.051 pu. With the same samples, the MSFF method proposed in this paper has advantages in extracting the stochasticity and correlation of power flow from different stochastic factors in the microgrid. The higher accuracy of stochastic power flow calculation makes the overall voltage probability distribution more concentrated than that of MCS. In terms of probability, the overall voltage deviation of MSFF is greater than that of MCS. On this basis, the MSFF-sensitivity proposed in this paper optimizes the power flow control, which can reduce the voltage deviation of node 34 and effectively improve the voltage quality of PCC.
From Figure 21, it can be seen that the voltage probability distribution of MCS is more dispersed than that of MSFF, while the MSFF proposed in this paper proves an effective way to extract the stochasticity and correlation of power flow of different stochastic factors in the microgrid, improves the accuracy of stochastic power flow calculation, and makes the node 34 voltage distribution of MSFF more concentrated than that of MCS. On this basis, the MSFF-sensitivity proposed in this paper optimizes the control of the power flow, and obviously reduces the voltage deviation of node 34, which can effectively improve the voltage quality of PCC.
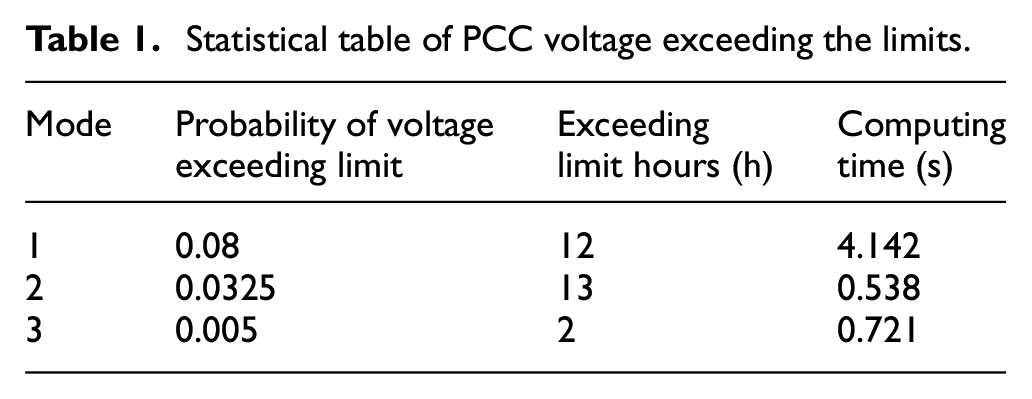
Table 1 shows the statistical data of PCC voltage exceeding the limit. In the grid-connected mode of the microgrid, mode 1 represents MCS, mode 2 represents the MSFF method, and mode 3 represents the MSFF-sensitivity method. Due to the relatively long feeder of the IEEE33 node system and the lack of DGs, the voltage exceeding the limit situation is relatively serious when it operates alone. However, the integration of the microgrid into the IEEE33 node system will increase the voltage at each node and reduce the probability of voltage exceeding the limit. When the sample size is small, the probability of voltage exceeding the limit in mode 1 is higher than that in mode 2, which is due to the fact that mode 1 has less advantage in stochastic power flow calculation than mode 2. Based on this condition, after optimizing the power flow control in mode 3, the probability of PCC voltage exceeding the limit is significantly reduced. Therefore, the strategy proposed in this paper can effectively avoid the problem of PCC voltage exceeding the limit.
Statistical table of PCC voltage exceeding the limits.
The results of the algorithm show that the MSFF function integrates the information between the stochastic factors themselves and the stochastic factors in the form of a function. The F-sensitivity reflects the significant influence degree of single stochastic factor of the microgrid on the voltage variation relationship of the distribution network. The power flow calculation quantifies the voltage quality of the distribution network in detail. Compared with the conventional MCS, the probabilistic power flow calculation and optimal control method based on MSFF- sensitivity shows that the strategy can effectively extract the randomness and correlation of power flow of different stochastic factors in the microgrid, and improve the voltage quality of the distribution network. Therefore, this method is scientific and reasonable.
Conclusion
A novel stochastic power flow calculation and optimal control method for the microgrid based on the MSFF-sensitivity is proposed in this paper. Compared with the traditional stochastic power flow method, MSFF function is firstly developed to extract the power flow correlation of multiple stochastic factors in the microgrid. The problem of insufficient integration of distribution characteristics of multiple stochastic factors in the traditional stochastic power flow is solved. Meanwhile, F-sensitivity function is used to correctly reflect the influence degree of each stochastic factor in the microgrid on the power flow of the distribution network, so as to optimally control the power flow of the distribution network, which solves the problem that the influence of single stochastic factor on the distribution network cannot be fully considered in the traditional stochastic power flow. The algorithm verification shows that the proposed method in this paper can effectively optimize the power flow of the distribution network and improve the voltage quality of the distribution network.
Footnotes
Declaration of conflicting interests
The author(s) declared no potential conflicts of interest with respect to the research, authorship, and/or publication of this article.
Funding
The author(s) disclosed receipt of the following financial support for the research, authorship, and/or publication of this article: This work is supported by Natural Science Foundation of Ningxia Province (No. 2022AAC03281), National Natural Science Foundation of China (52267013).
Permission to reproduce materials from other sources
None.
Ethics approval
We declare that this manuscript has complied with all the ethical requirements of the journal.
Consent to participate
All authors of this manuscript have agreed to participate in the writing of the manuscript.
Consent for publication
All the authors of this manuscript consented to its publication.
Data availability statement
The data that support the findings of this study are available from the corresponding author upon reasonable request.