
Abstract
Concrete is indispensable in contemporary industry, and the weighing of aggregates directly determines the quality of concrete preparation. In response to the difficulty of traditional methods in meeting the industrial requirements for accuracy, efficiency, and cost of measurement, this paper proposes a non-contact bone pile weight measurement method based on binocular vision. Firstly, the on-site image is obtained through a binocular camera, and the camera parameters are used to improve the image edge information and preprocess the image. Then, the improved semi global matching (SGM) algorithm is used to improve computational efficiency, obtaining three-dimensional information of the aggregate pile for volume calculation. Based on the watershed algorithm and T-S inference, the aggregate clearance rate is calculated, and the initial volume is corrected. Finally, a linear relationship is established between the density of the aggregate pile and the clearance rate, and the weight of the aggregate pile can be obtained by the density formula. The experimental results on different sizes of aggregate piles shows that the average error of the experiment is less than 4%. Efficiency of improved SGM matching algorithm has increased several times compared to the original algorithm, providing a low-cost and efficient measurement method for industrial aggregate weighing.
Introduction
Concrete is one of the important materials for infrastructure construction, and the aggregate is one of the core components of concrete. During the preparation process of concrete, the accurate measurement of aggregate weight is essential for achieving the desired concrete properties and performance. 1 Improper weighing of aggregates can lead to variations in the mix proportions and result in inconsistencies in the concrete’s strength, workability, and durability, which directly impacts the concrete’s compressive strength, flexural strength, and the overall quality and properties. Therefore, precise weighing of aggregates is crucial in concrete mix design to produce a well-balanced and high-quality concrete mixture.
The traditional measurement methods are the contact measurements, such as direct measurement and sensor measurement.2,3 At present, the common aggregate weighing instruments in the market have problems such as unstable drop values, large volume, high prices, and poor real-time performance.
The new measurement methods have emerged with the application of computer vision technology in image detection, such as laser diffraction method 4 and image processing technology.5,6 Qiu and Wang 7 designed a system that uses non-contact optoelectronic methods to measure the volume of objects and uses laser to locate the center position. Pal et al. 8 proposed an optical weight measurement system using Fiber Bragg Grating (FBG) sensors combined with machine learning, which greatly improves measurement speed and accuracy of the system. However, such methods have highly cost requirements, complex processes, and poor universality. Fauzi et al. 9 conducted non-contact evaluation of the volume and weight of the target object using width and height based on captured 2D images. Some scholars10,11 used tire image recognition markers to obtain tire deformation parameters and achieve dynamic weighing of vehicles. The non-contact methods to detect target objects without the need to install sensors for direct measurement, and it is easy to overcome many shortcomings of traditional methods.
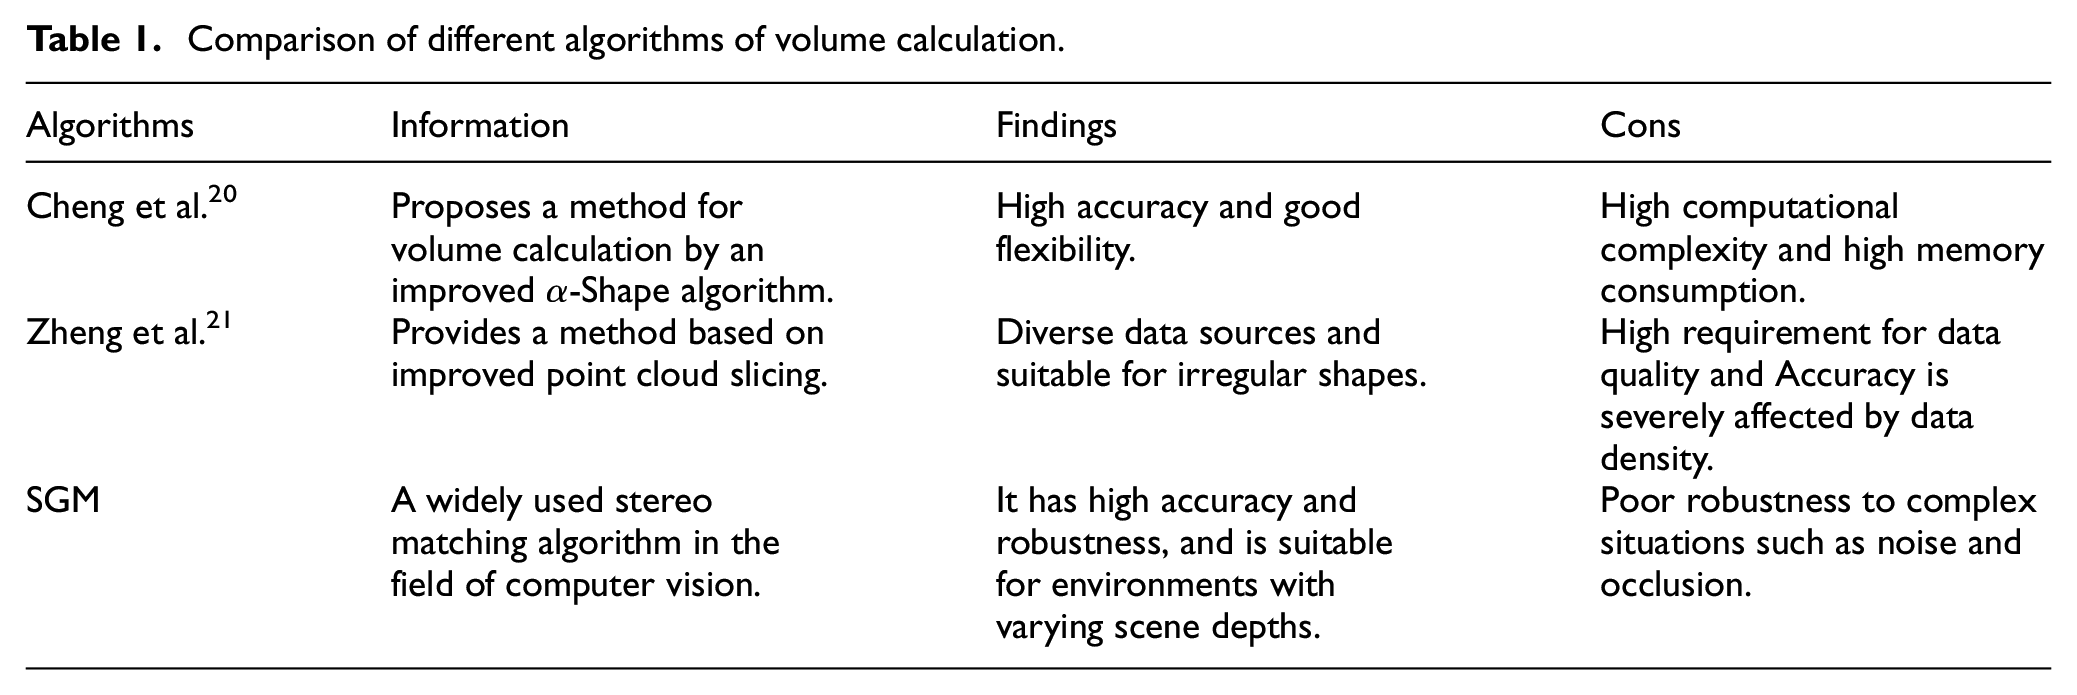
In recent years, obtaining 3D information of target images based on binocular vision for 3D reconstruction and subsequent processing has become popular in the field of computer vision. Chen et al. 12 designed a new measurement method based on binocular vision, which achieved accurate 3D reconstruction and size measurement of rectangular workpieces. Liu et al. 13 proposed a method to detect feed volume based on binocular stereo vision. Some scholars14–16 combined binocular vision and Semi-global stereo matching (SGM) algorithm to estimate the weight of industrial coal and aggregate piles, which avoids excessive error caused by tedious human operations. In addition to its application in industrial products, it is also widely used in volume detection of agricultural products.17–19 Table 1 provides a comparison of different algorithms of volume calculation.
Comparison of different algorithms of volume calculation.
In response to the many shortcomings of traditional measurement methods and the current research on volume measurement based on binocular vision, the research on weight measurement is almost blank. Considering the huge advantages of machine vision in measurement, this article used binocular vision to study the weight measurement of aggregate piles, which intended to focus on improving efficiency and reducing costs. The contribution of this article is reflected in the following aspects:
(1) A volume measurement method based on SGM is proposed. The improved Census transform has greatly improved the computational speed of high-resolution images.
(2) Proposing a volume correction method. The initial volume is further corrected by the clearance rate, which is obtained by combining watershed algorithm and T-S inference.
(3) Introducing a simple and efficient method for measuring the weight of aggregate pile. The weight of aggregate pile can be calculated by a linear relationship between the porosity and aggregate density. It reduces the errors caused by complex transformations and makes the experimental results more convincing.
The remaining organizational arrangements of this article are as follows:
The second section mainly introduces the relevant work of this article. The third section specifically describes the new method proposed in this article and the specific steps of the method. The fourth section verifies the authenticity and effectiveness of the methods and assumptions proposed in this article through experiments. The research conclusion is presented in Section 5.
Binocular camera
Binocular camera model
The origin of binocular vision technology is related to the human visual system, which utilizes the disparity between left and right images and the principle of similar triangles to obtain three-dimensional information of the target object for analysis and utilization. 22
Figure 1 is a schematic diagram of binocular camera imaging.
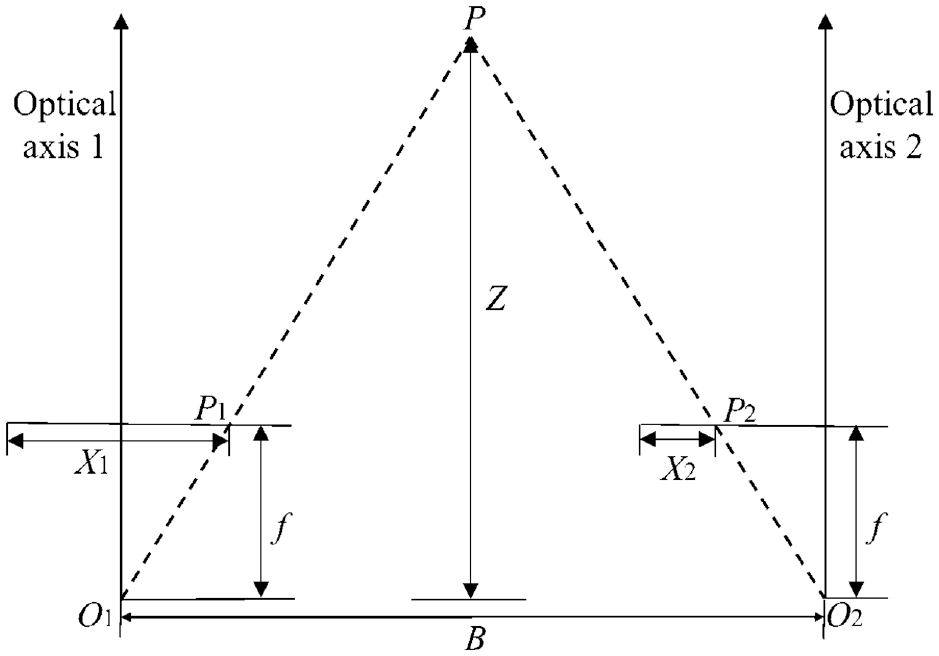
Binocular camera imaging.
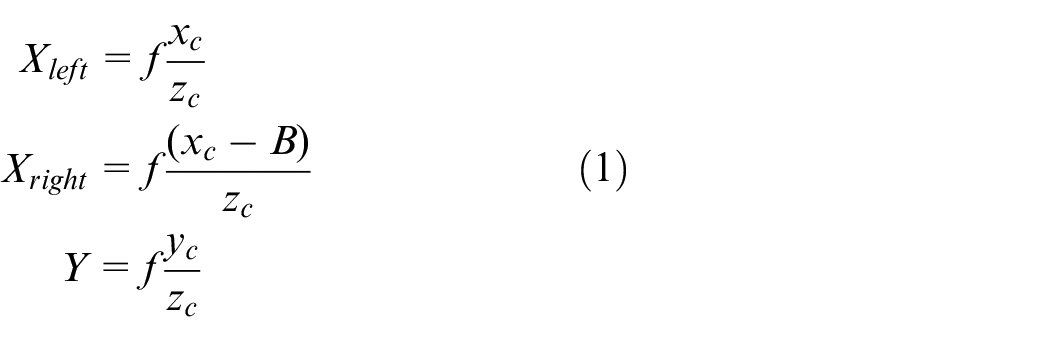
The disparity of point P on the left and right cameras is:

Thus, the coordinates of the feature point
The distance
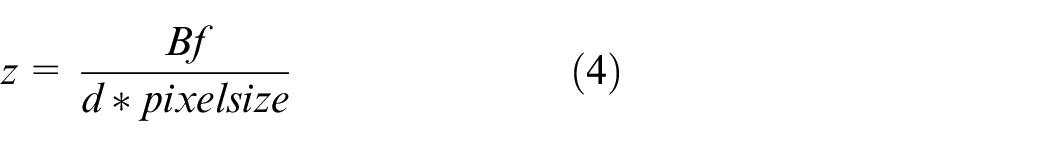
From the equation (4), it can be seen that depth distance is inversely proportional to parallax, and is proportional to focal distance. The closer the object is from the camera, the greater the parallax is, and vice versa. Therefore, the distance of the camera is proportional to the focal distance
Camera calibration
Calibration is crucial for 3D imaging, as its purpose is to determine the internal and external parameters of the camera. This article adopts the Zhang zhengyou’s calibration method, 24 and the object of reference with calibration is checkboard, with a single grid size of 26 mm × 26 mm, in total of 7 × 10 grids. The collected calibration board images are shown in Figure 2.
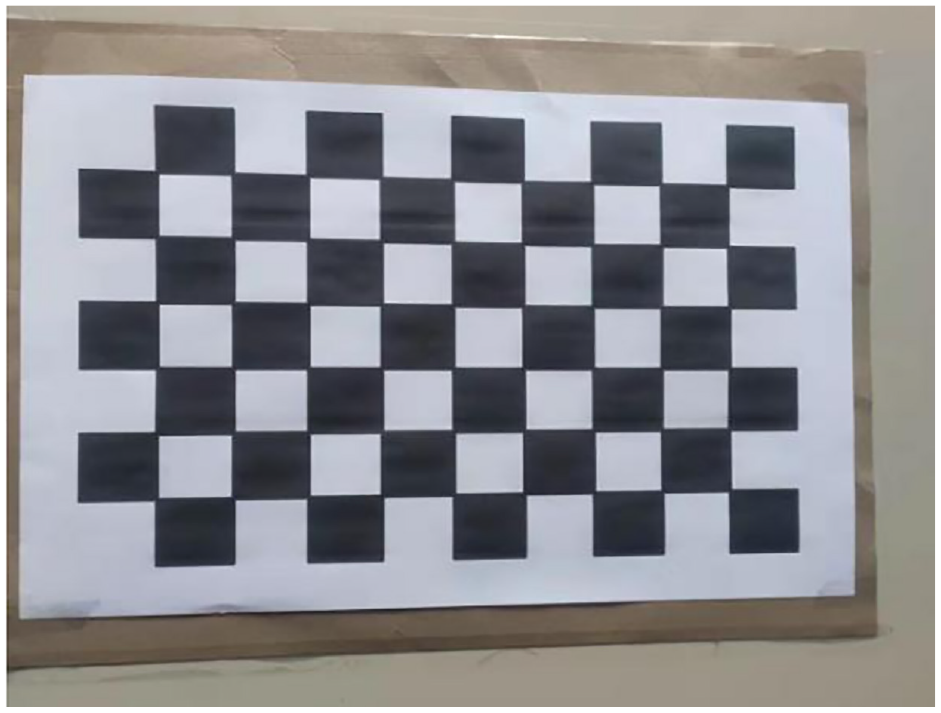
Diagram of calibration board.
External parameters include rotation matrix
Process and results of camera calibration:
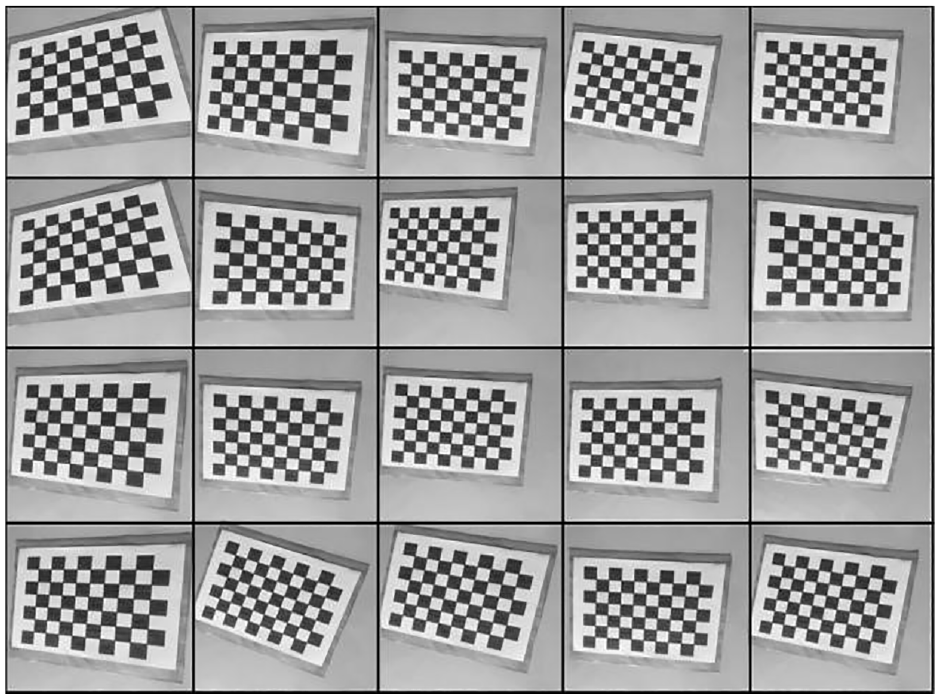
(1) Using MATLAB to calibrate the camera. Selecting the tool of image calibration in the app’s column of MATLAB and adding 20 calibration board images with different angles as shown in Figure 3, and MATLAB will automatically remove some unqualified images.
(2) Using MATLAB to perform corner extraction on input images. The coordinate unit in the image is 0.1 mm, and the corner extraction process is shown in Figure 4.
(3) The input size of the block is 26 mm. As shown in Figure 5, after extracting the corner points, the reprojection error and the binocular camera model are calculated by MATLAB.
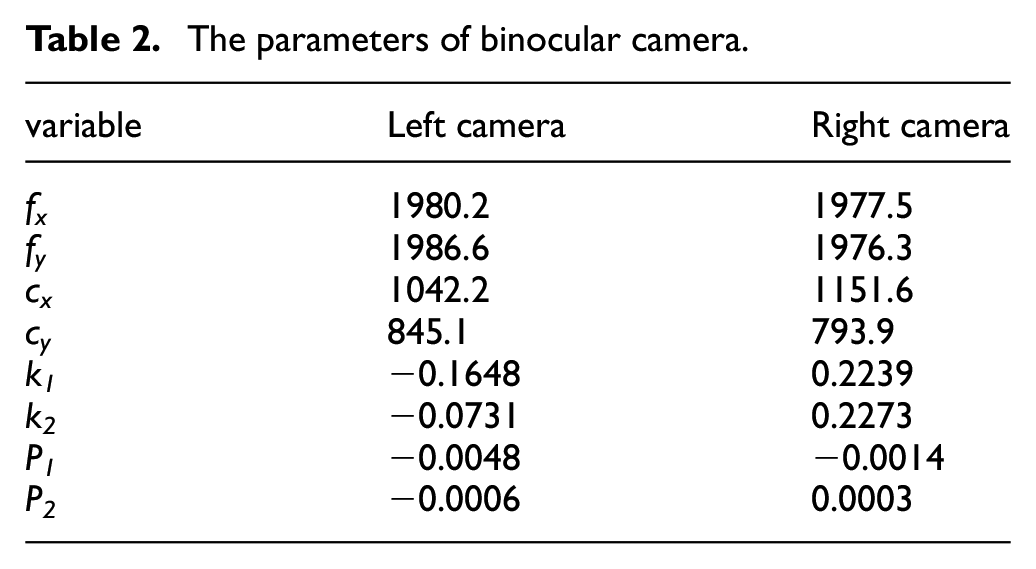
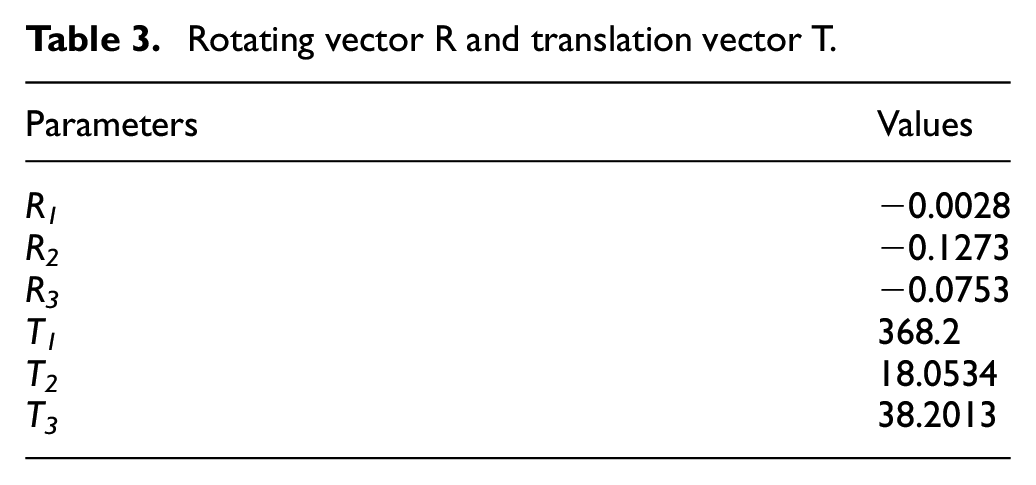
(4) Using MATLAB to calculate and display data of internal and external camera parameters. The parameters of the binocular camera can be obtained as shown in Tables 2 and 3 after repeated calculations and removing edge points.
Add the image.
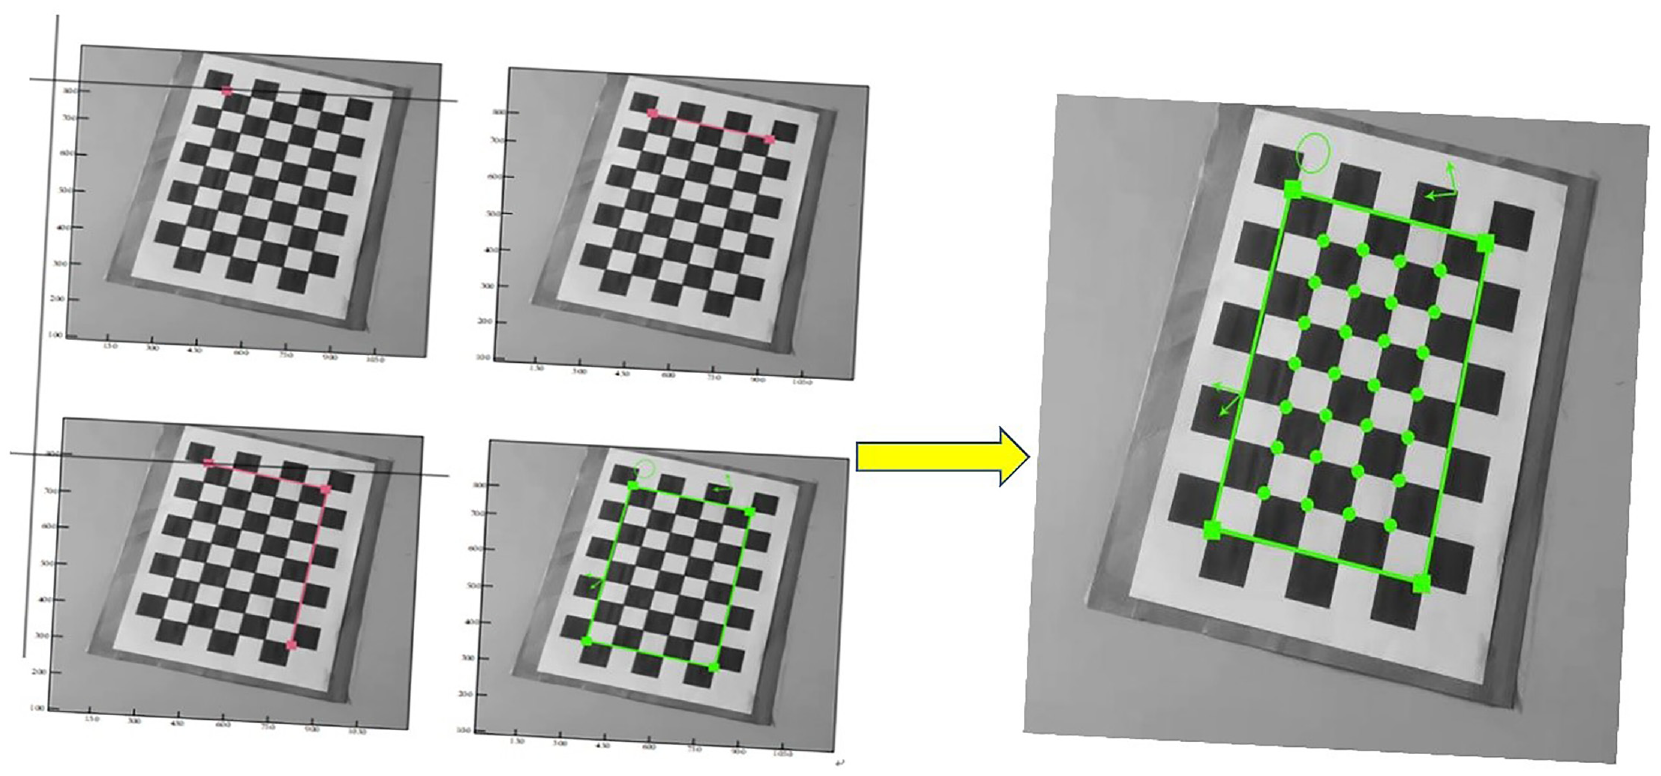
Corner selection order and Corners display.
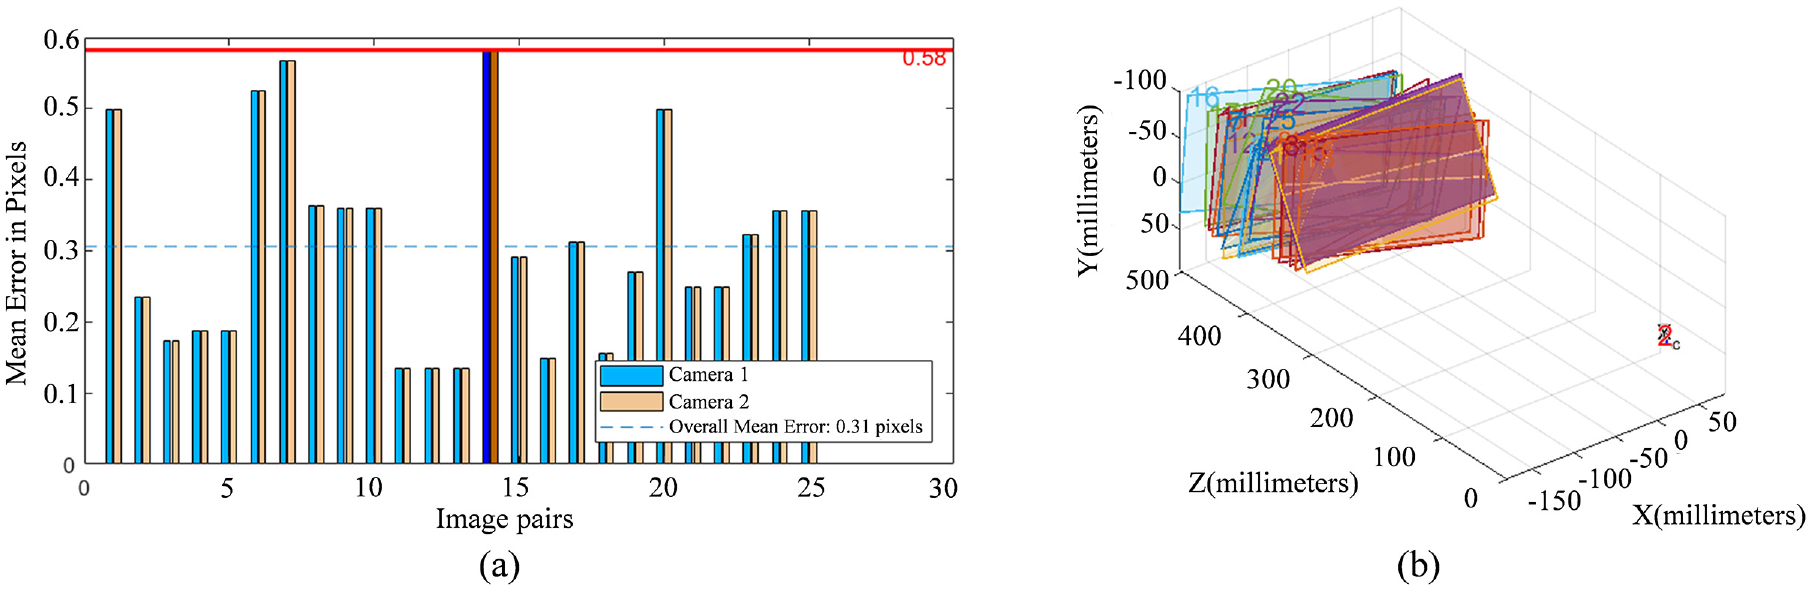
The result of calculation: (a) reprojection error and (b) binocular camera model.
The parameters of binocular camera.
Rotating vector R and translation vector T.
All parameters of the two cameras are basically the same. The correction coefficients and error ranges of the four types of distortion, as well as the correction results, indicate the existence of a certain camera angle. The experimental results indicates that the distortion coefficient is small, and the visible and tangential distortions are not significant.
Proposed methods
The flow chart is as shown in Figure 6:
(1) Image preprocessing. The binocular camera is used to collect the image After the camera is calibrated with Zhang Zhengyou’s calibration method. In view of the noise in the image, Gaussian filter is used to increase the image clarity and Laplace operator is used to detect the edge.
(2) Initial volume calculation. The improved SGM matching algorithm is used to obtain the disparity map, and the three-dimensional information of the obtained image is used as input information, and the initial volume is calculated using the differential element method.
(3) Volume correction and weight calculation. Use the improved PSO-GA algorithm and watershed algorithm to calculate the porosity and correct the initial volume, and establish the relationship between the internal and external gaps and density to obtain the corresponding weight of the aggregate.
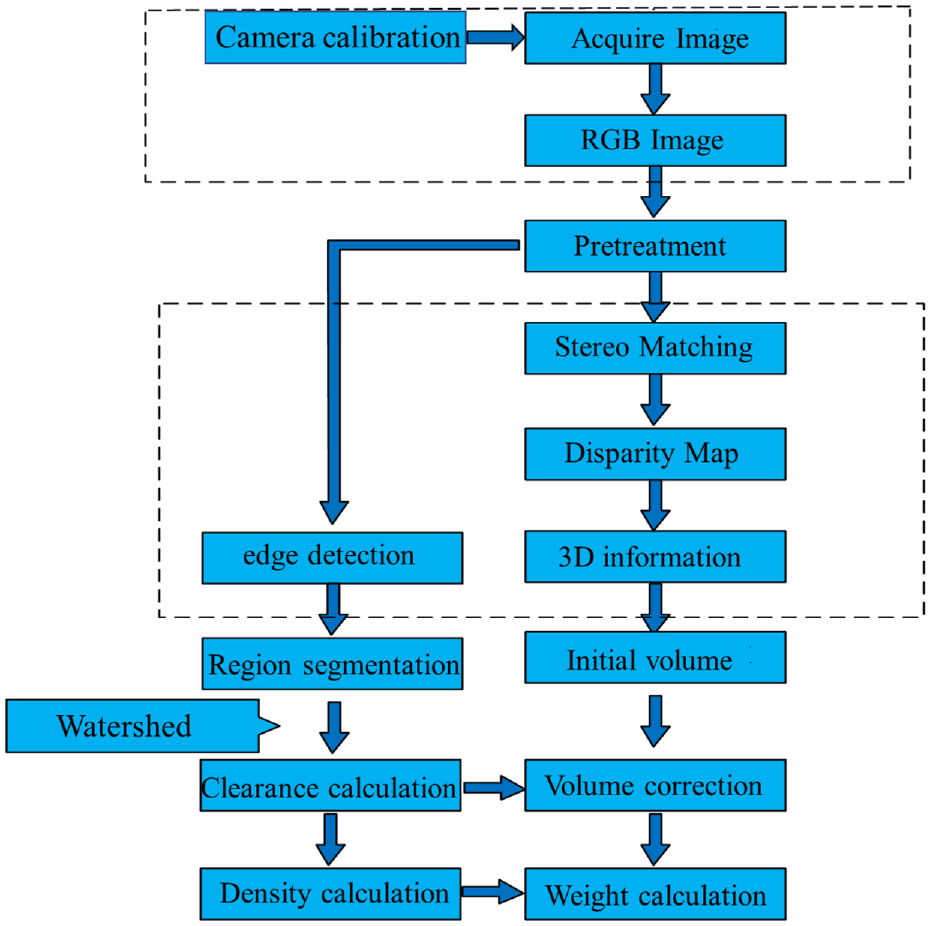
Flow chart of aggregate pile weight measurement method.
Image processing
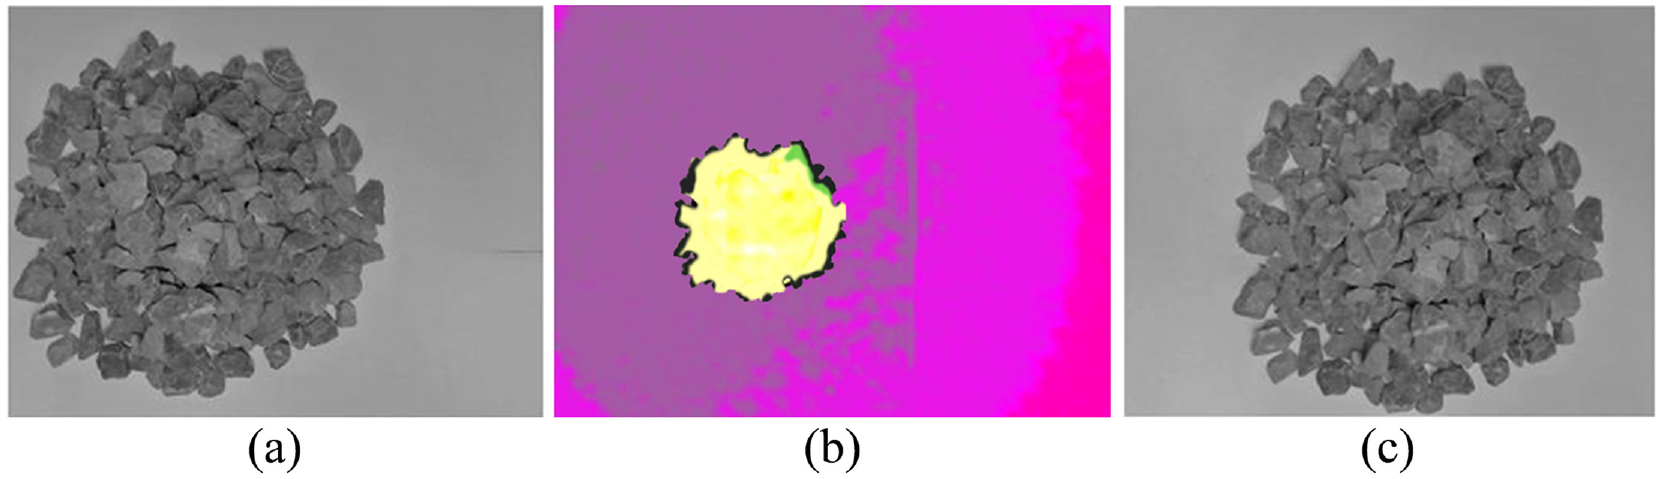
Most useful information is obtained from the initial image. However, the noise is inevitable during the process of image acquisition. In order to increasing the reliability of the experiment and minimizing the interference of noise on the image, this paper selects Gaussian filter to process it. The filtering effect diagram is shown in Figure 7.
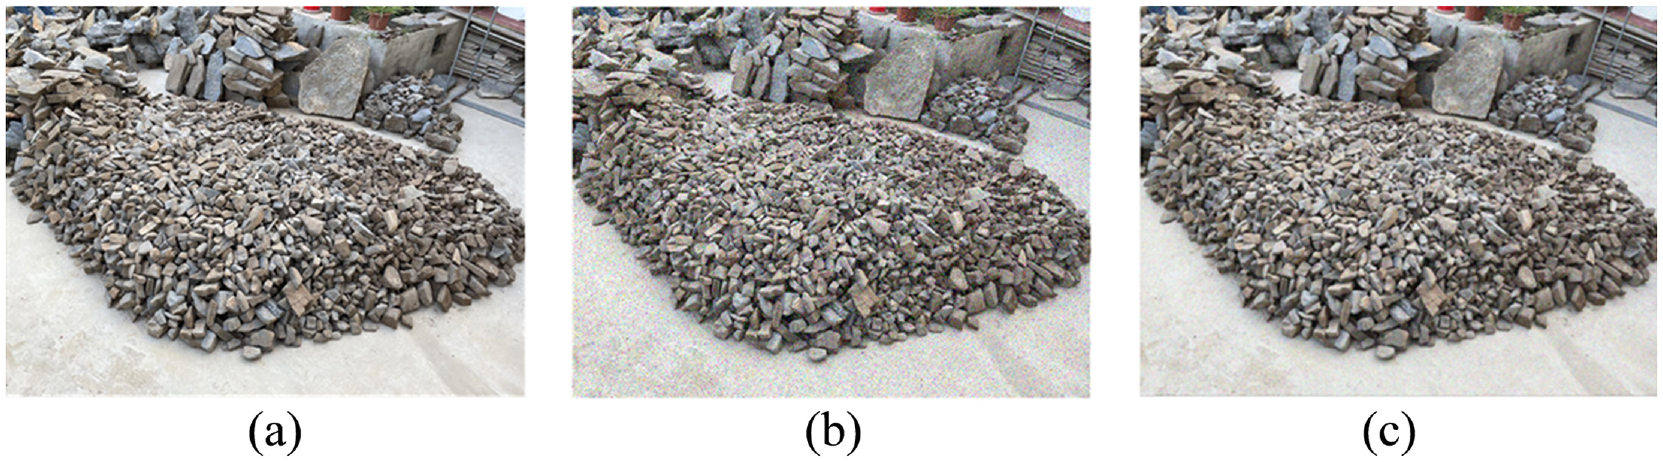
Gaussian filter: (a) original image, (b) add salt and pepper noise with a noise density of 0.1, and (c) result image.
As shown in the figure, adding the salt and pepper noise with density of 0.1 to the original image. Gaussian filter can effectively remove the noise, and then using the Laplace operator to detect the edge of the image. For image f(x, y), the Laplace operator can be defined as:
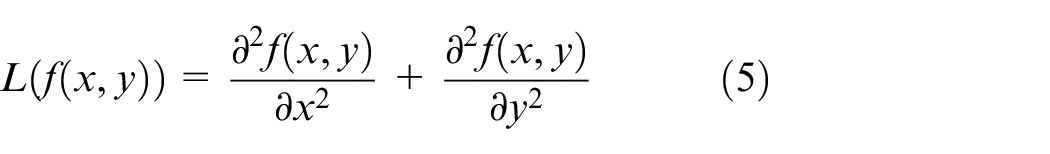
Firstly, extracting the RGB components from the target image and performing edge detection on each RGB component, and then synthesizing the above three scenarios. The effect of Laplace operator is shown in Figure 8.
The flow chart of Laplace operator.
Initial volume calculation based on improved SGM
The traditional SMG algorithm has the following four steps: cost calculation, cost aggregation, disparity calculation, and disparity optimization.
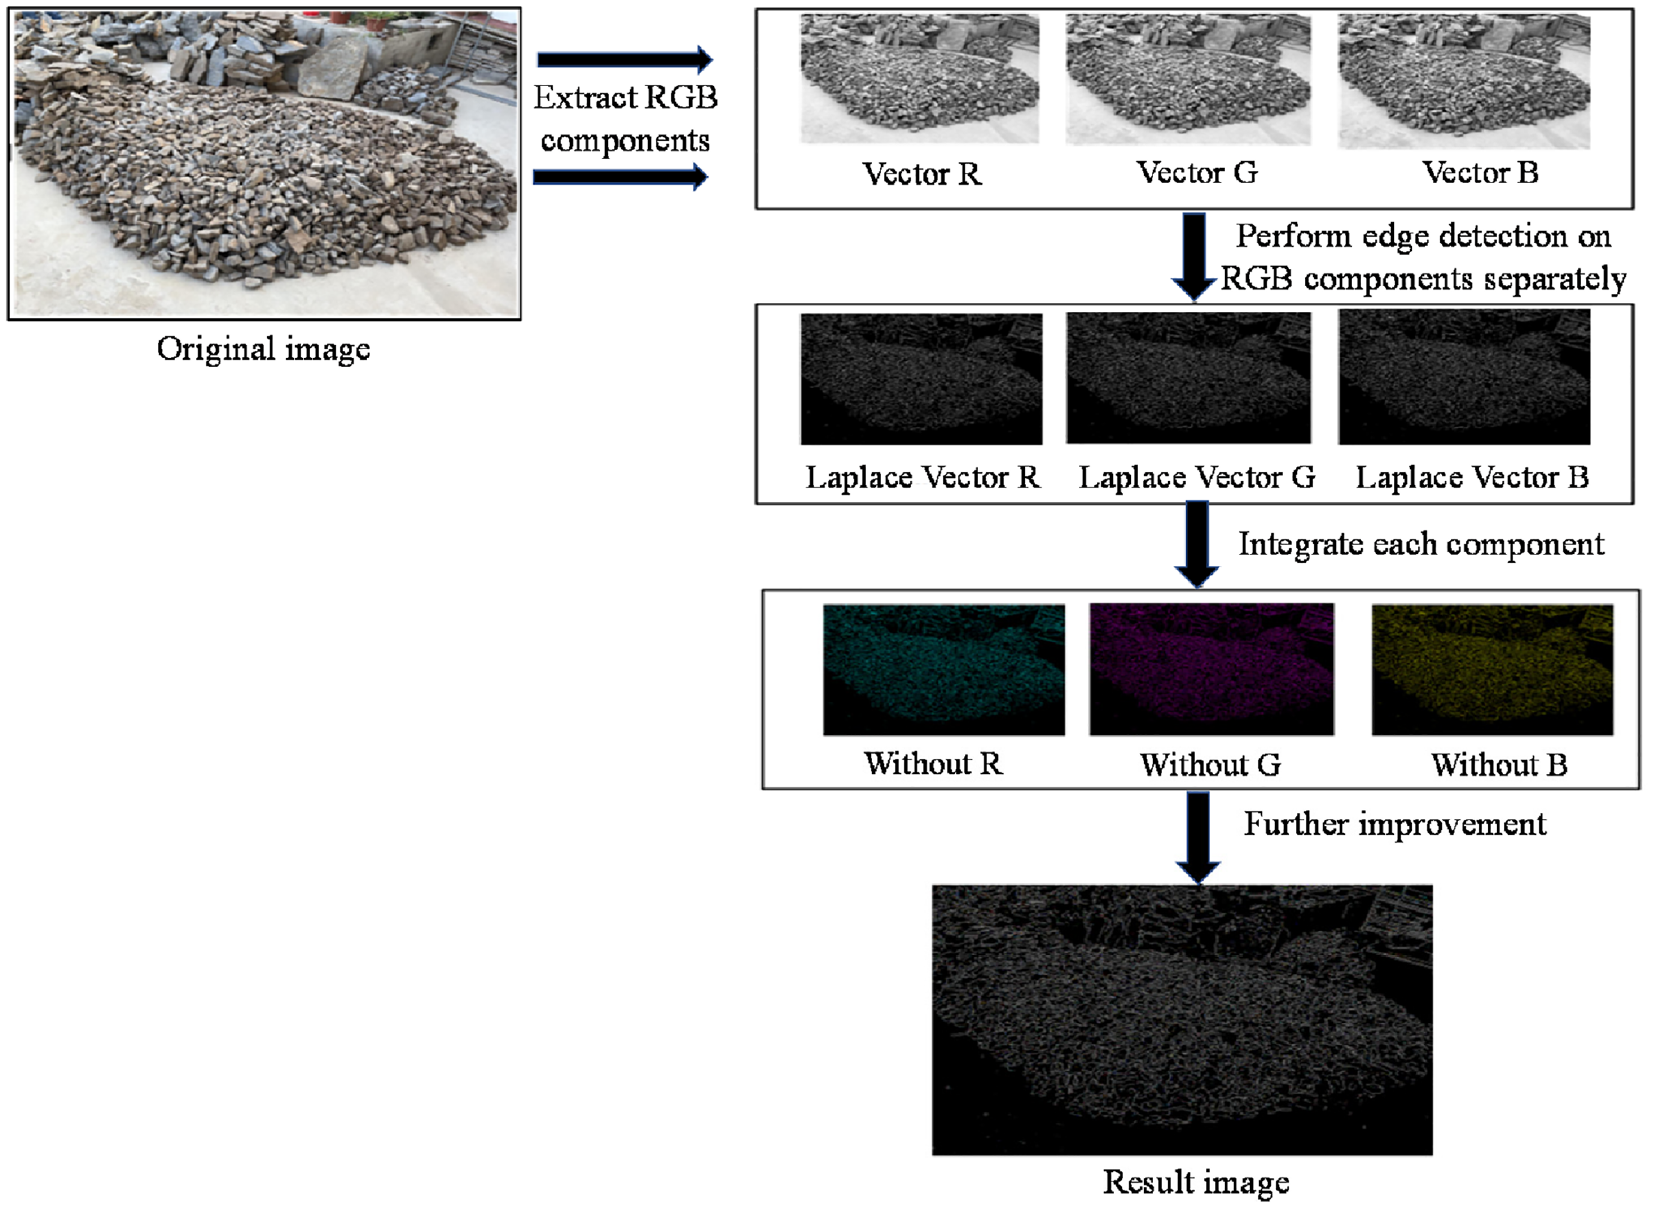
(1) Matching Cost calculation. The cost calculation is based on the grayscale difference between the target pixel and its neighboring pixels, which is converted into a bit string through the census transform. The main idea is to calculate the matching cost by taking the Hamming distance between the bit strings as the input of the transform. Figure 9 illustrates the principle of census transform.
Schematic diagram of census transform.
The expression for calculating the Hamming distance is as follows:
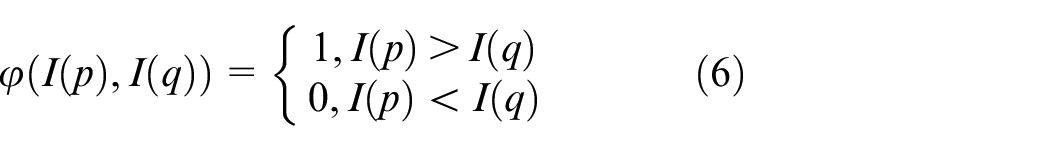
Where I(p) represents the value of the window center point; I(q) represents the value of each point in the set except for the center point.
(2) Cost aggregation. The concept of the SGM algorithm is to transform the process of solving two-dimensional (2D) energy minimization into equal cost aggregation on multiple one-dimensional (1D) paths in multiple directions. The basic flow as shown in Figure 10:
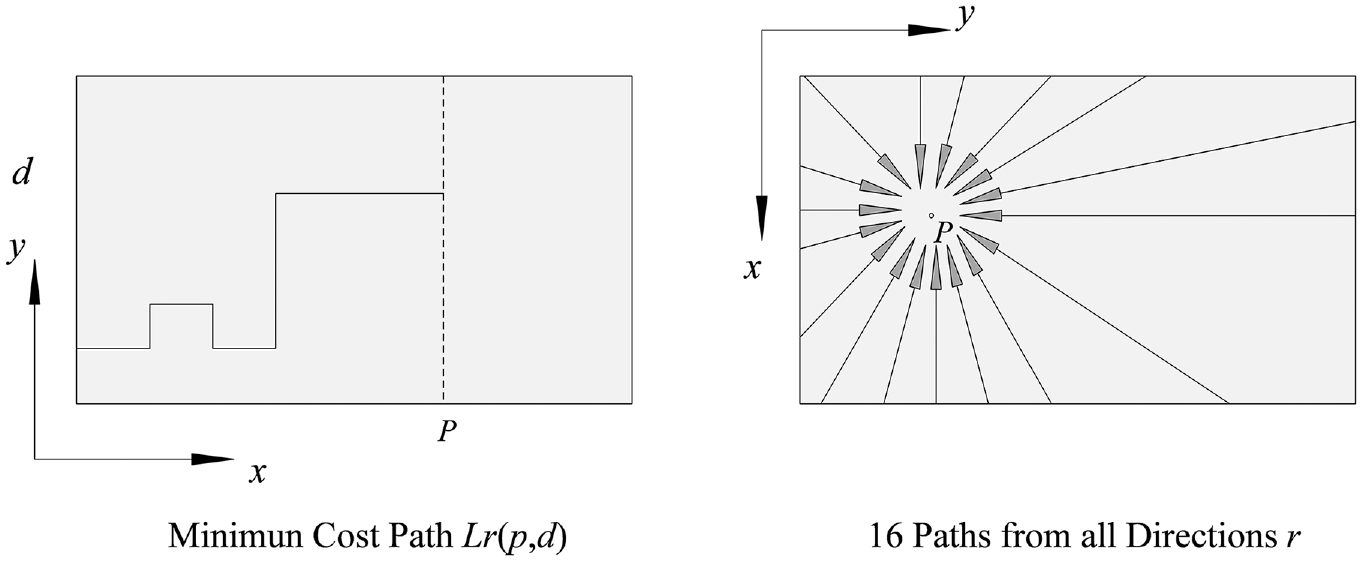
The schematic diagram of SGM algorithm.
The cost aggregation calculation formula is as follows:
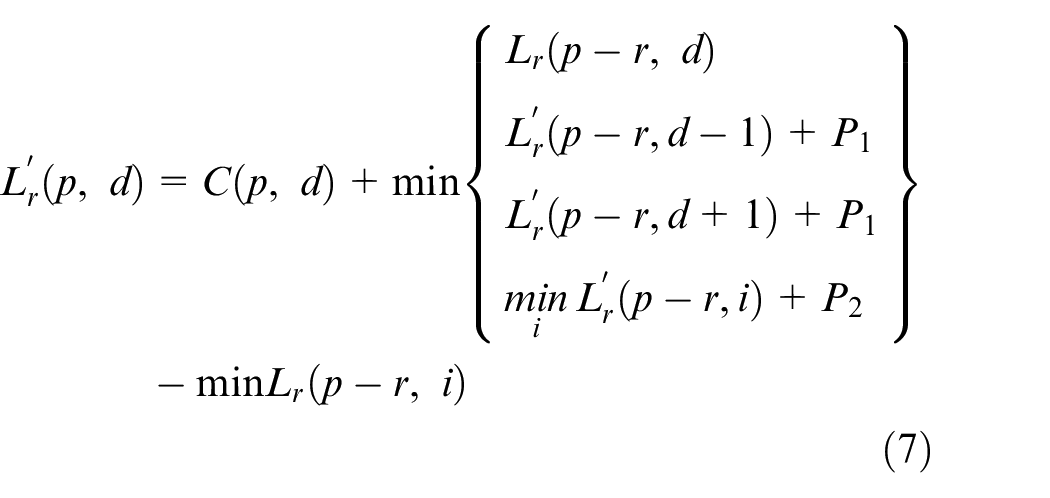
where
(3) Disparity calculation. In the SGM algorithm, disparity calculation adopts the same winner takes all algorithm strategy as the local algorithm, and the final disparity is determined by the minimum aggregate value selected from all pixel values. The calculation formula is as follows:

(4) Disparity optimization. This article adopts the left and right consistency method to eliminate incorrect matches. The obtained disparity map is shown in Figure 11:
Disparity map: (a) left view, (b) disparity map, and (c) right view.
In order to quickly measure the volume of aggregate piles, this article proposes an improved SGM algorithm with hierarchical strategy which establishes P image layers with different resolutions for the original images and each layer has a resolution of one quarter of the upper layer, and a parallel optimization algorithm is adopted to address the efficiency issue of cost aggregation in multi-path aggregation process. By enhancing the existing SGM algorithm, the proposed algorithm enables real-time pixel-by-pixel stereo matching of images in a fraction of the time taken by traditional methods. The flowchart of the improved SGM is shown in Figure 12.
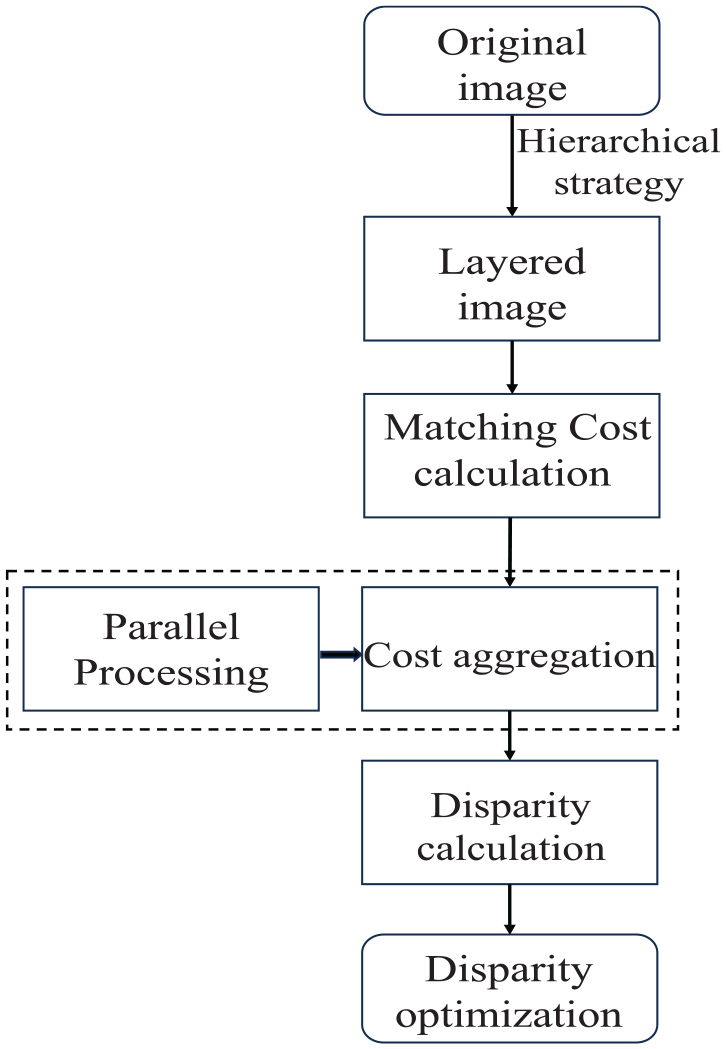
The flow chart of the improved SGM algorithm.
The algorithm can be classified into three categories based on the level of optimization achieved. The first is the unoptimized version of the SGM algorithm, followed by the parallel optimization P-SGM algorithm. Finally, the PH-SGM optimization algorithm is developed, which includes both parallel optimization and hierarchical strategy to further improve the performance. The experimental objects are image pairs obtained from a binocular camera with a resolution of 1000 × 800, and the search range of parallax are set to 128, 256, and 512. Regarding the parameter settings for this process, specifically the SGM algorithm, there are 8 cost aggregation paths, 5 matching layers, and a window size of
Three algorithms consume time.
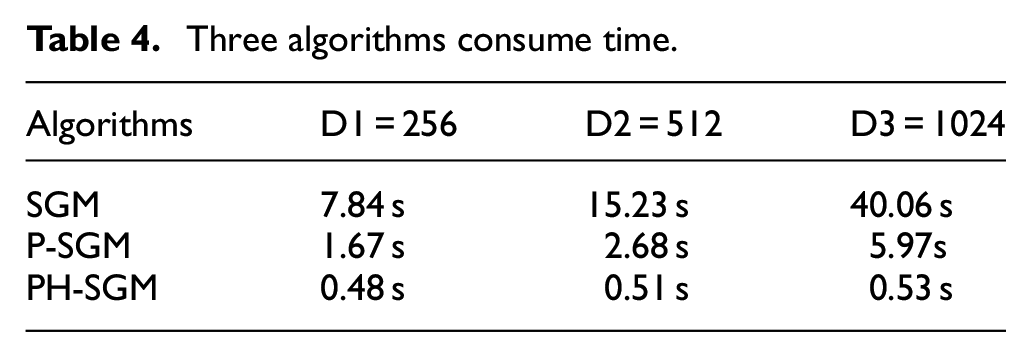
From Table 4, it can be seen that the SGM+P algorithm with parallel optimization has a 4–6 times improvement in efficiency compared to the unoptimized SGM algorithm, but it did not meet expectations. The SGM+P+H algorithm, which adopts parallel optimization and hierarchical matching strategies, has an efficiency improvement of 3–11 times compared to the SGM+P algorithm that only uses parallel optimization.
SGM features can be extracted from the left and right views of aggregate pile. Then, by comparing these features, point pairs that correspond to the same object in the left and right images can be identified, enabling the calculation of their three-dimensional coordinates. 25 The distance Z from a specific point to the camera plane can be computed using equation (4). By iterating through every pixel on the disparity map in a sequential order, the Z coordinates of each pixel in the global coordinate system can be determined, followed by the computation of complete three-dimensional coordinates for all pixels. As shown in Figure 13, importing coordinate data into MATLAB software can obtain a depth map of the aggregate pile.
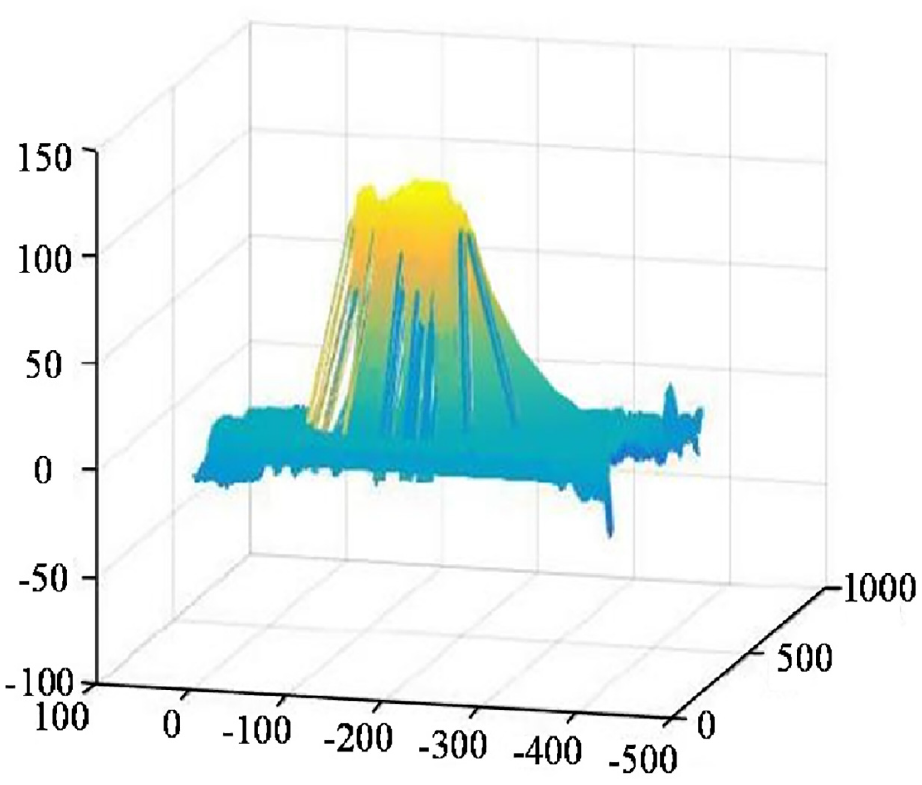
Depth map.
In this process, a binocular camera is used to capture depth information from the top of the aggregate pile by generating a depth map. As illustrated in Figure 13, the total volume of the pile is calculated by finding the cumulative sum of the volume of corresponding blocks per unit area. Furthermore, the average depth of each pixel in the pile corresponds to the overall average depth of the aggregate.
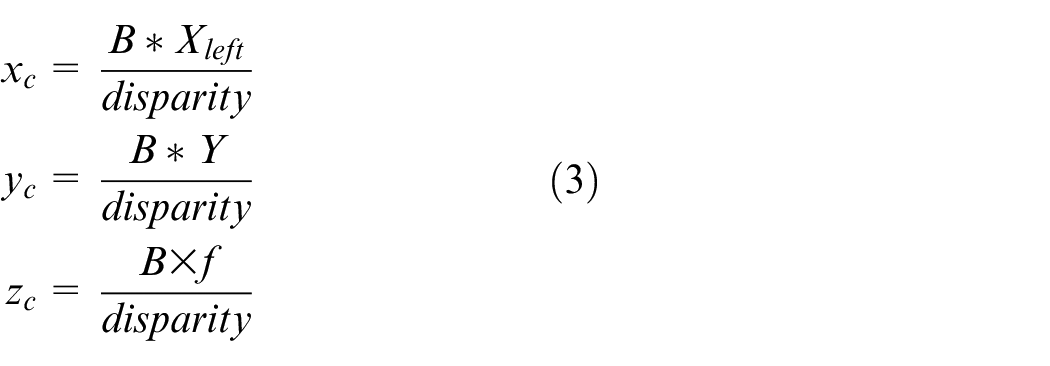
The three-dimensional coordinates of the two-dimensional point can be calculated by the disparity d corresponding to the coordinates (x, y) of a point in the disparity map.
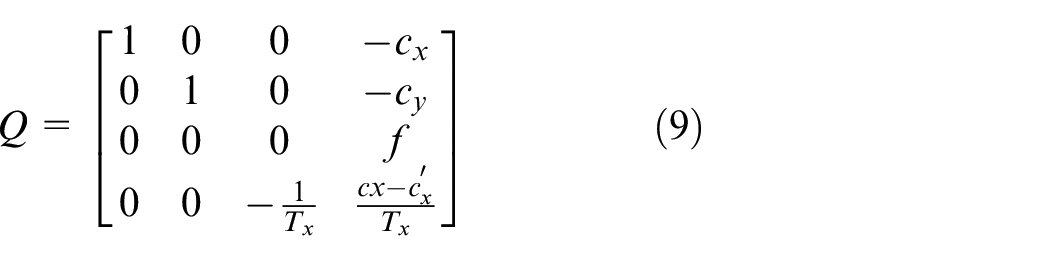
Where, cx and cy are the abscissa of the principal point of the left image, xc is the horizontal coordinate of the center point f of the right image, and T x is a parameter in the translation vector T that represents the offset in the horizontal direction.
The method of 3D scene reconstruction is an approach to estimate initial volume. An irregular quadrilateral prism can be constructed by using 4 pixels in the image coordinates to obtain eight 3D points. The shape of the irregular quadrilateral is shown in Figure 14.
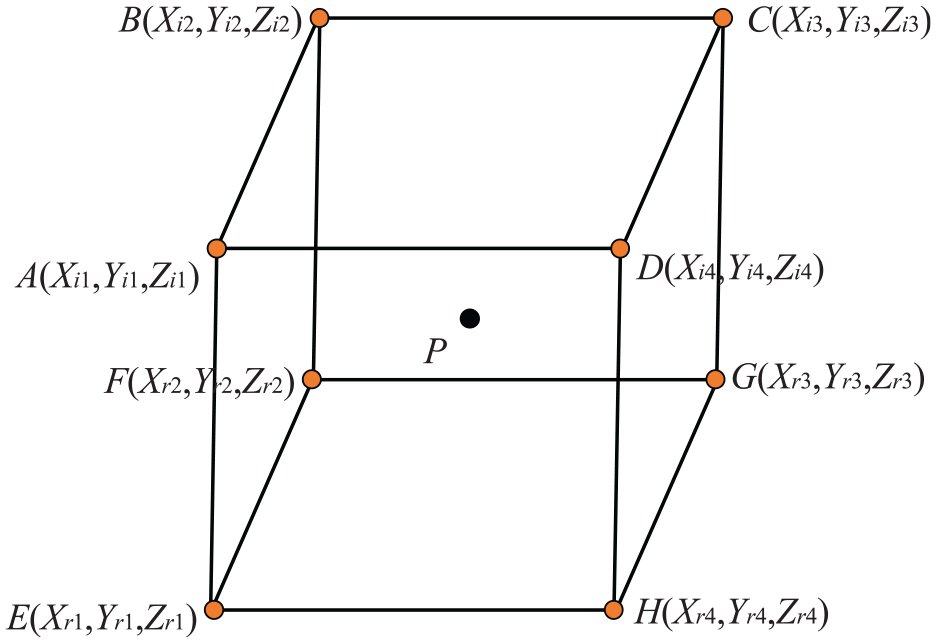
Initial volume calculation.
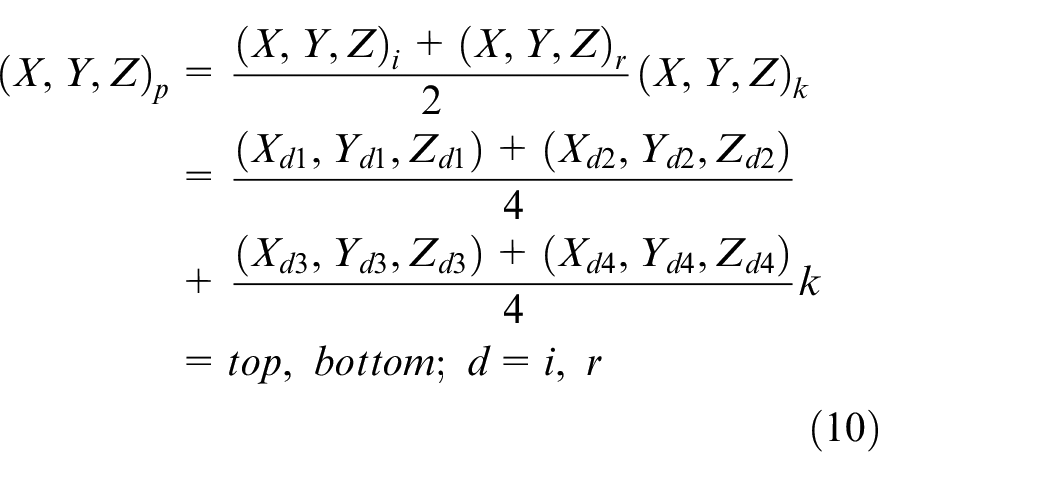
The center point P can be obtained by calculating the center points at the top and bottom of an irregular hexahedron:
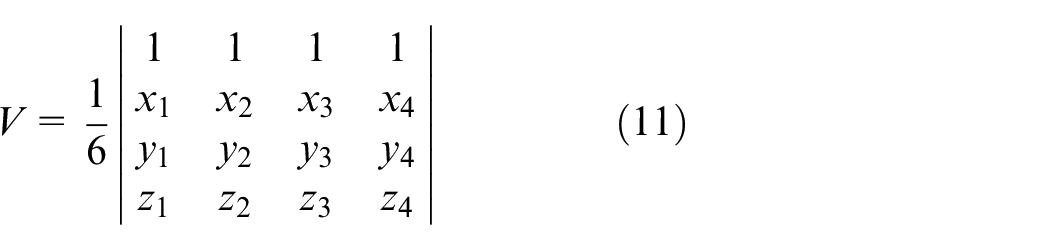
The volume of a single irregular quadrilateral can be calculated by dividing it into 12 irregular tetrahedrons: P-ABC, P-ADC, and P-ABE…, and then summing the volumes of each tetrahedron, and then the initial volume of the aggregate is calculated by summing the volumes of each irregular quadrilateral. Each irregular tetrahedron’s volume can be calculated using the Euler formula in the equation (11):
Volume correction
This section uses an improved genetic algorithm to segment the target image, and calculates the perimeter and area of the aggregate based on the watershed algorithm. Then, combined with T-S inference, the porosity of the aggregate pile is calculated to correct the volume.
Previous work26–28 has demonstrated that genetic algorithm (GA) has excellent performance in the field of image segmentation. The workflow of learning frequent contour segments (FCS) using GA is shown in Figure 15.
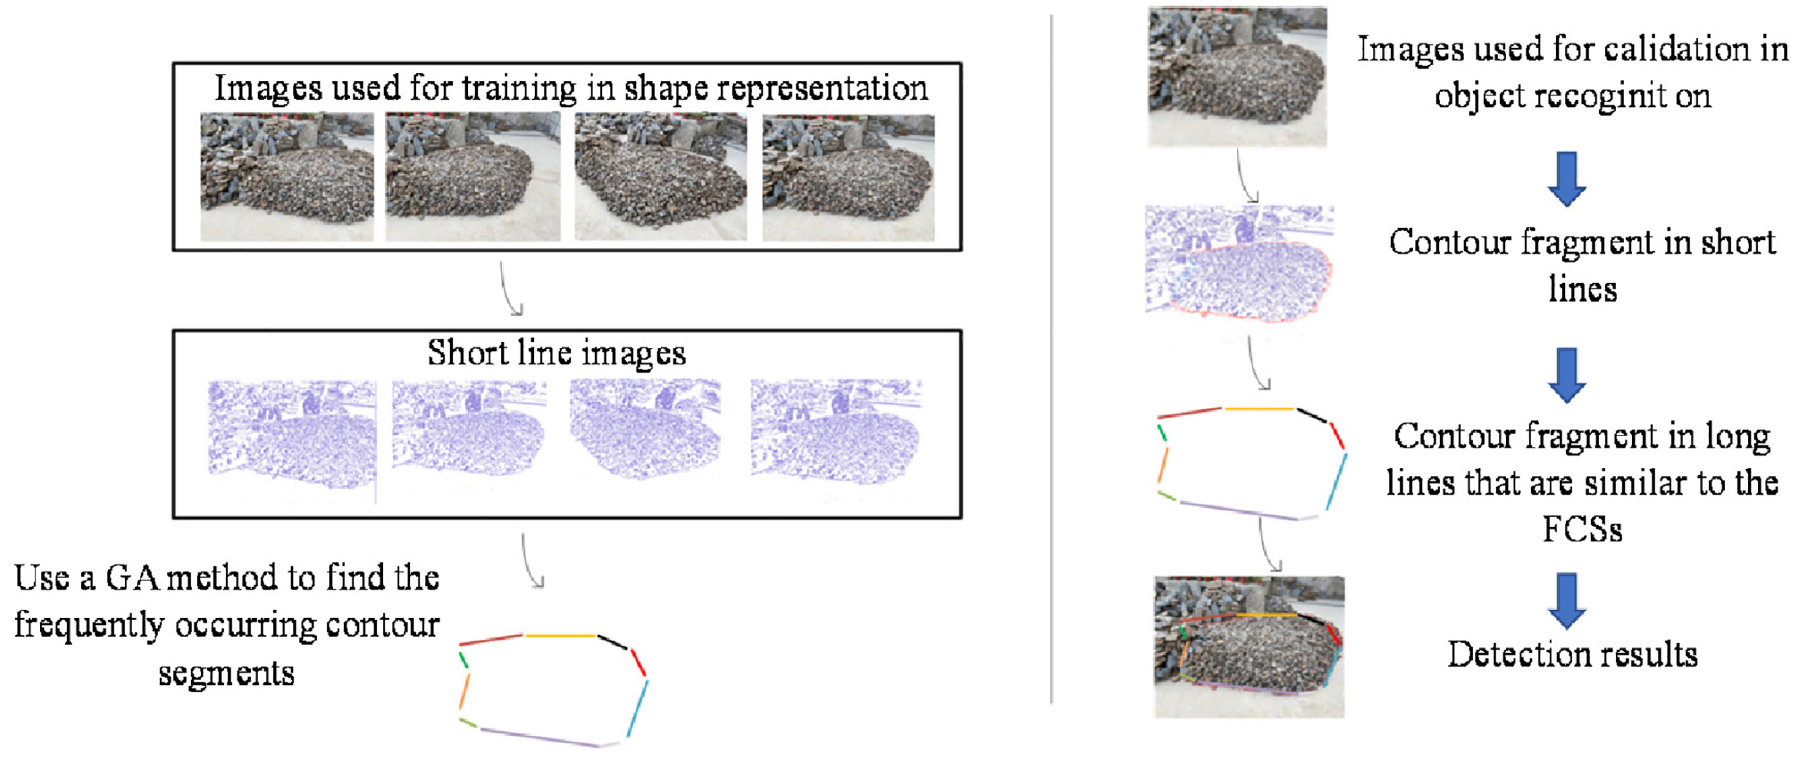
Genetic algorithm (GA) learns the workflow of FCS.
This article proposes a new hybrid PSO-GA algorithm that incorporates the steps of splitting and merging into the original iterative algorithm,26,29 avoiding the ineffective evolution process of small genes while selecting suitable genes for effective contour recognition.
This section uses the MPEG-7 core experiment, the CE-Shape-1 dataset,30,31 as the test data set. Figure 16 shows FCS obtained from the training images using proposed method.
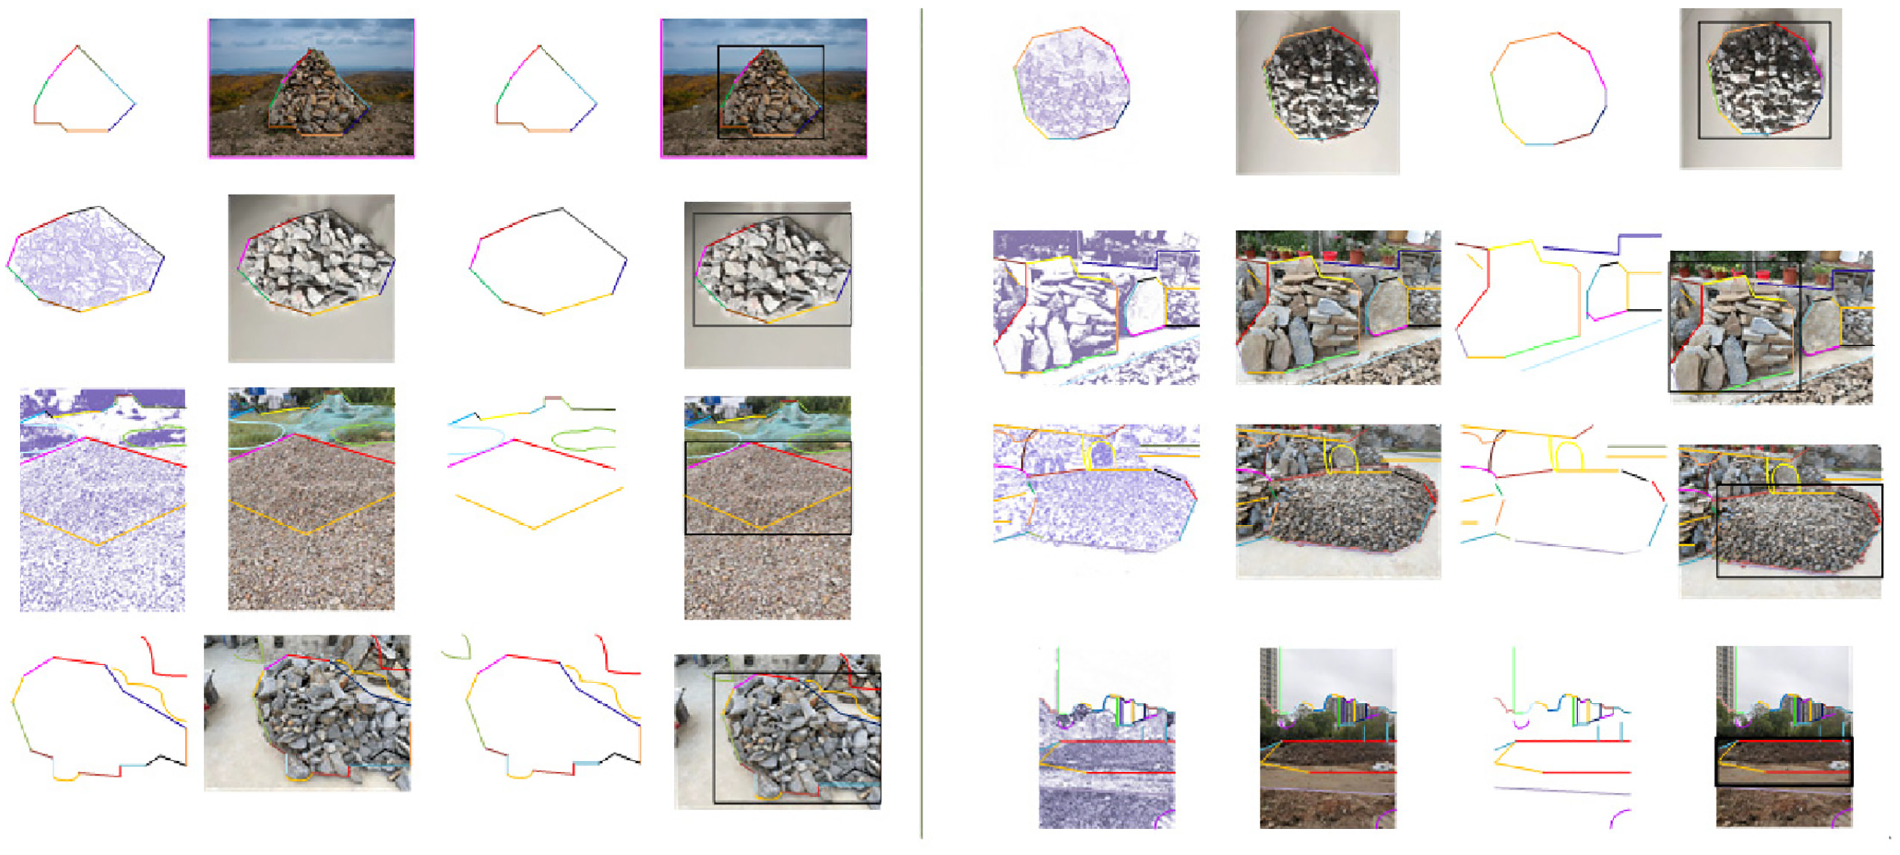
Examples of positive detection using FCS learned from training images.
In this study, the intersection-union ratio (IOU) is established as 0.4 in order to assess the coverage of the results. Compared to previous works, 32 the coverage results are evaluated and compared accordingly.
The coverage is the percentage of ground-truth boundary points recovered by this method, and the accuracy is the percentage of output points located on the ground-truth boundary. 16 As shown in Table 5, while the current method’s coverage results may be slightly lower than those of previous studies, its accuracy results demonstrate a significant improvement than previous reports. The findings indicate that the current method enables accurate identification of object boundaries in test images, while excluding the boundary box.
Coverage results.
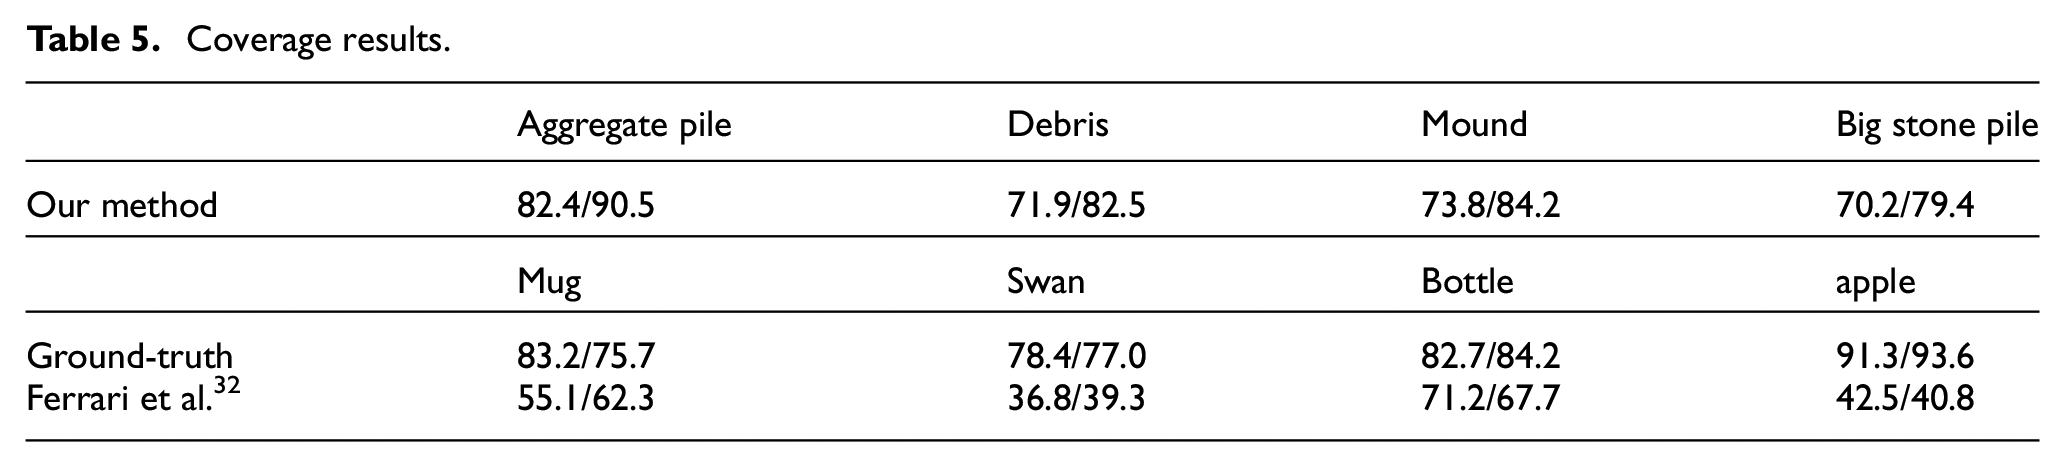
Figure 16 compares route optimality and convergence speed of the different algorithm.
The path optimality of all proposed algorithms is compared and analyzed in Figure 17. The results illustrate that the proposed hybrid PSO-GA algorithm significantly outperforms the other two algorithms in terms of routing success rate. This observation is supported by the clear difference in the success rates of the algorithms shown in the figure. Notably, the proposed hybrid algorithm achieves a routing success rate of almost 98% with 25 nodes, which is considerably higher than that of the other two algorithms. As the network size increases, the success rate slightly decreases, but it still outperforms the other two algorithms, with the hybrid PSO-GA algorithm exhibiting better performance than PSO and GA algorithms by 6% and 3%, respectively, in an ultra-dense network of 150 nodes. All experiments are conducted by keeping the mutation probability parameter at 0.05.
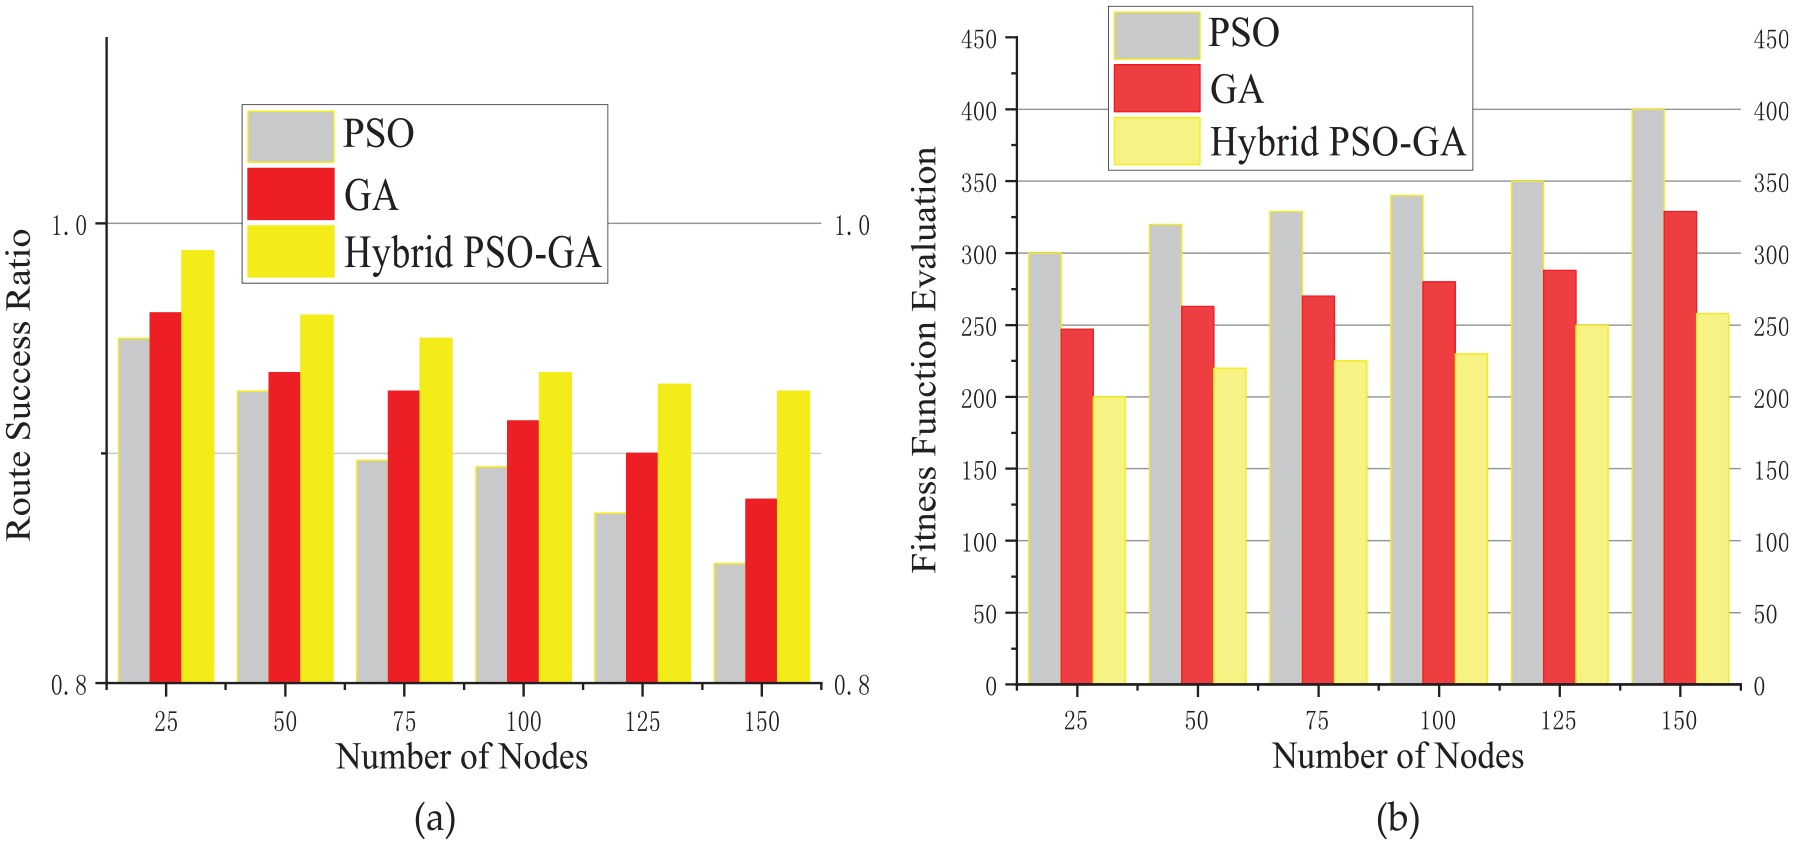
Comparison of three algorithms: (a) comparison of path optimality for each algorithm and (b) results of convergence speed of each algorithm.
In the process of image segmentation, it is difficult to effectively distinguish local pixel values due to interconnectivity and illumination. Therefore, when using the improved PSO-GA algorithm for image segmentation, and this article proposes a watershed algorithm33,34 to calculate the clearance rate of aggregates. Due to the difficulty in visually calculating the internal gap of the aggregate pile, and this article estimates the internal clearance rate of the aggregate by calculating the clearance rate of two-dimensional planar aggregates.
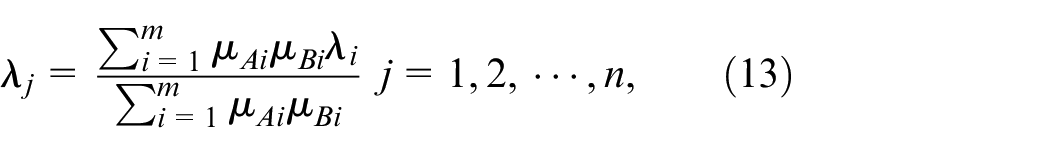
Based on the watershed algorithm, the area S1 and perimeter l of each aggregate can be calculated from the segmented image to obtain a clearance rate
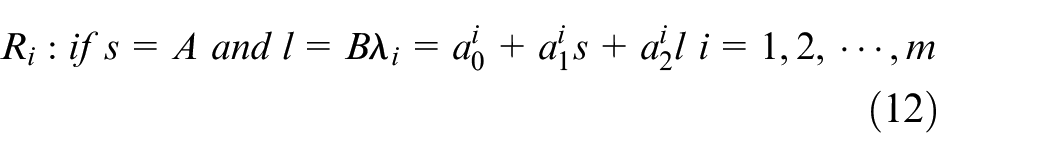
Where, M is the T-S theorem number for aggregate piles.
Among them,
The flowchart is shown in Figure 18, from which it can be seen that the improved watershed algorithm performs well in image segmentation of the aggregate pile surface.
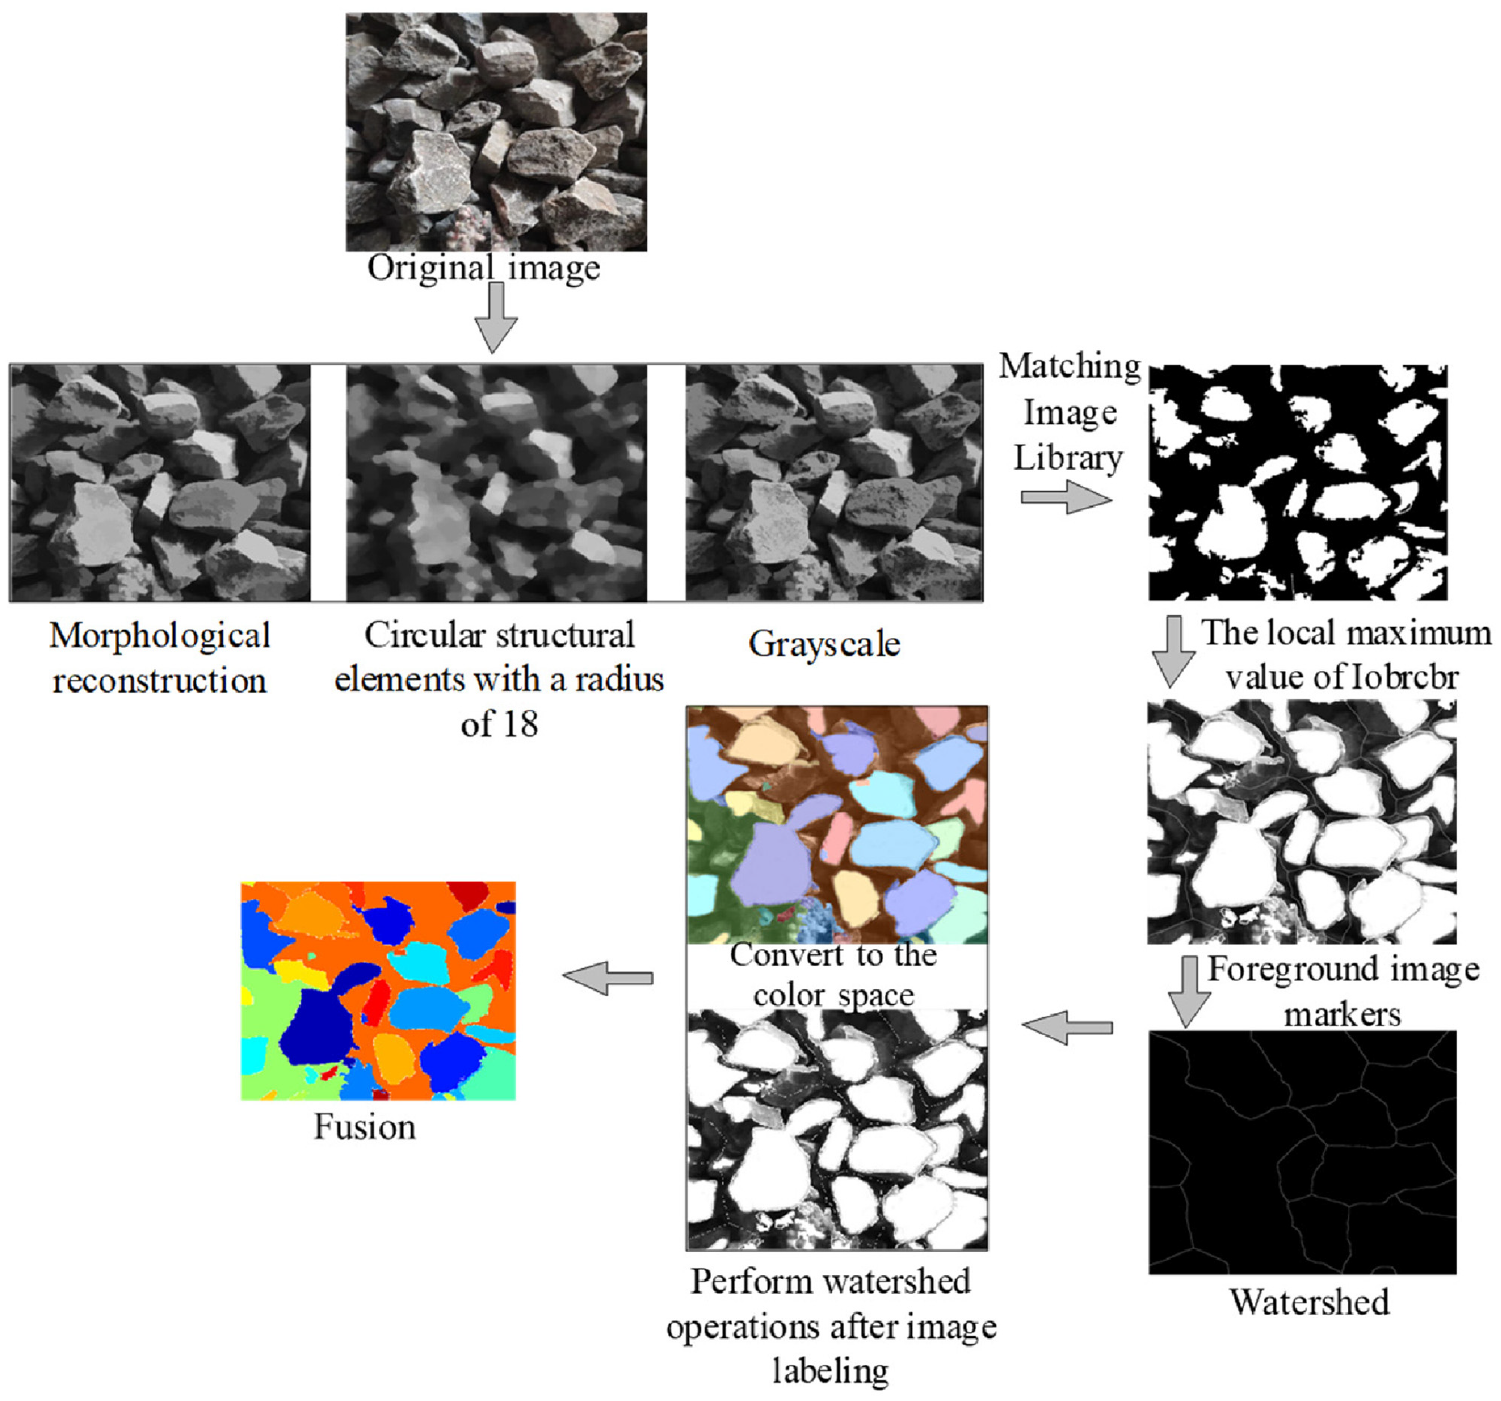
Aggregate pile surface segmentation treatment.
The initial calculation of volume ignores the existence of clearance rate in the aggregate pile, and the errors are inevitable. Therefore, the T-S inference 35 is used to correct the volume of the aggregate. The area and perimeter of the aggregate are used as input for inference to obtain the clearance rate, and is used as a correction factor.
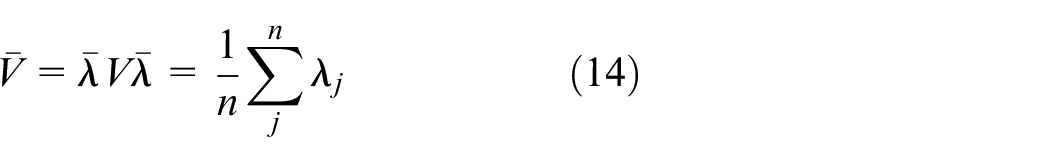
The clearance rate of the aggregate can be obtained from equation (4), and then the volume of the aggregate can be corrected according to equation (14).
Weight calculation
This section establishes a database of the clearance rate corresponding to the density of different aggregate piles. Within a controllable error range, which confirms that there is a certain relationship between the clearance rate and density of the aggregate. The relationship is shown in Figure 19:
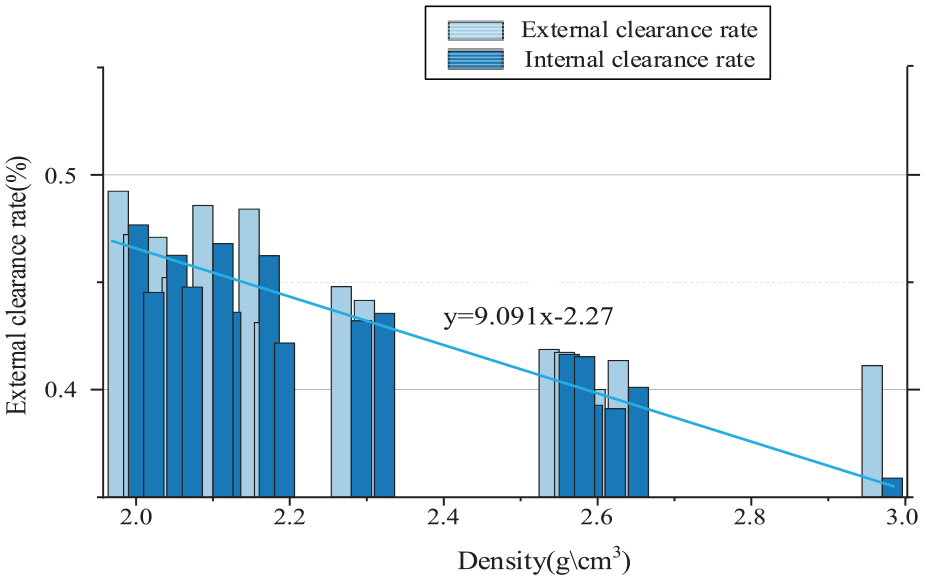
The linear relationship between aggregate internal clearance and density.
As shown in Figure 19, there is a linear relationship between the internal clearance rate and density. If the density is set to y and the clearance rate is set to x, their relationship can be approximatively expressed by the function y = 9.091x-2.27, with 0.3589 < x < 0.4767.
The weight of the aggregate pile can be obtained by combining equation (14) and the relationship between density and clearance rate.
Experimental results
Verification of the feasibility of the clearance rate
This section confirms that the relationship between the internal and external clearance rate of the aggregate pile. Firstly, putting the aggregate pile into a bag and soaking the aggregate using the water intrusion method, and then measuring the volume of water and aggregate to obtain the internal porosity of the aggregate. However, due to the internal pressure of the actual aggregate pile is too high, so a large amount of aggregate should be loaded as much as possible during loading, and the heavy objects should be placed and compacted to simulate the high-pressure environment inside the aggregate pile. The weight of the heavy object should be 79.1 kg. The same method is used to calculate the external clearance rate, but the step of placing heavy objects is omitted. A total of 16 groups of aggregates with different densities were divided, and the corresponding clearance rate was measured 20 times for each group by replacing aggregates with different shapes, and the average value was taken as the final result.
The specific data is shown in Table 6.
Measurement parameters of aggregate heap.
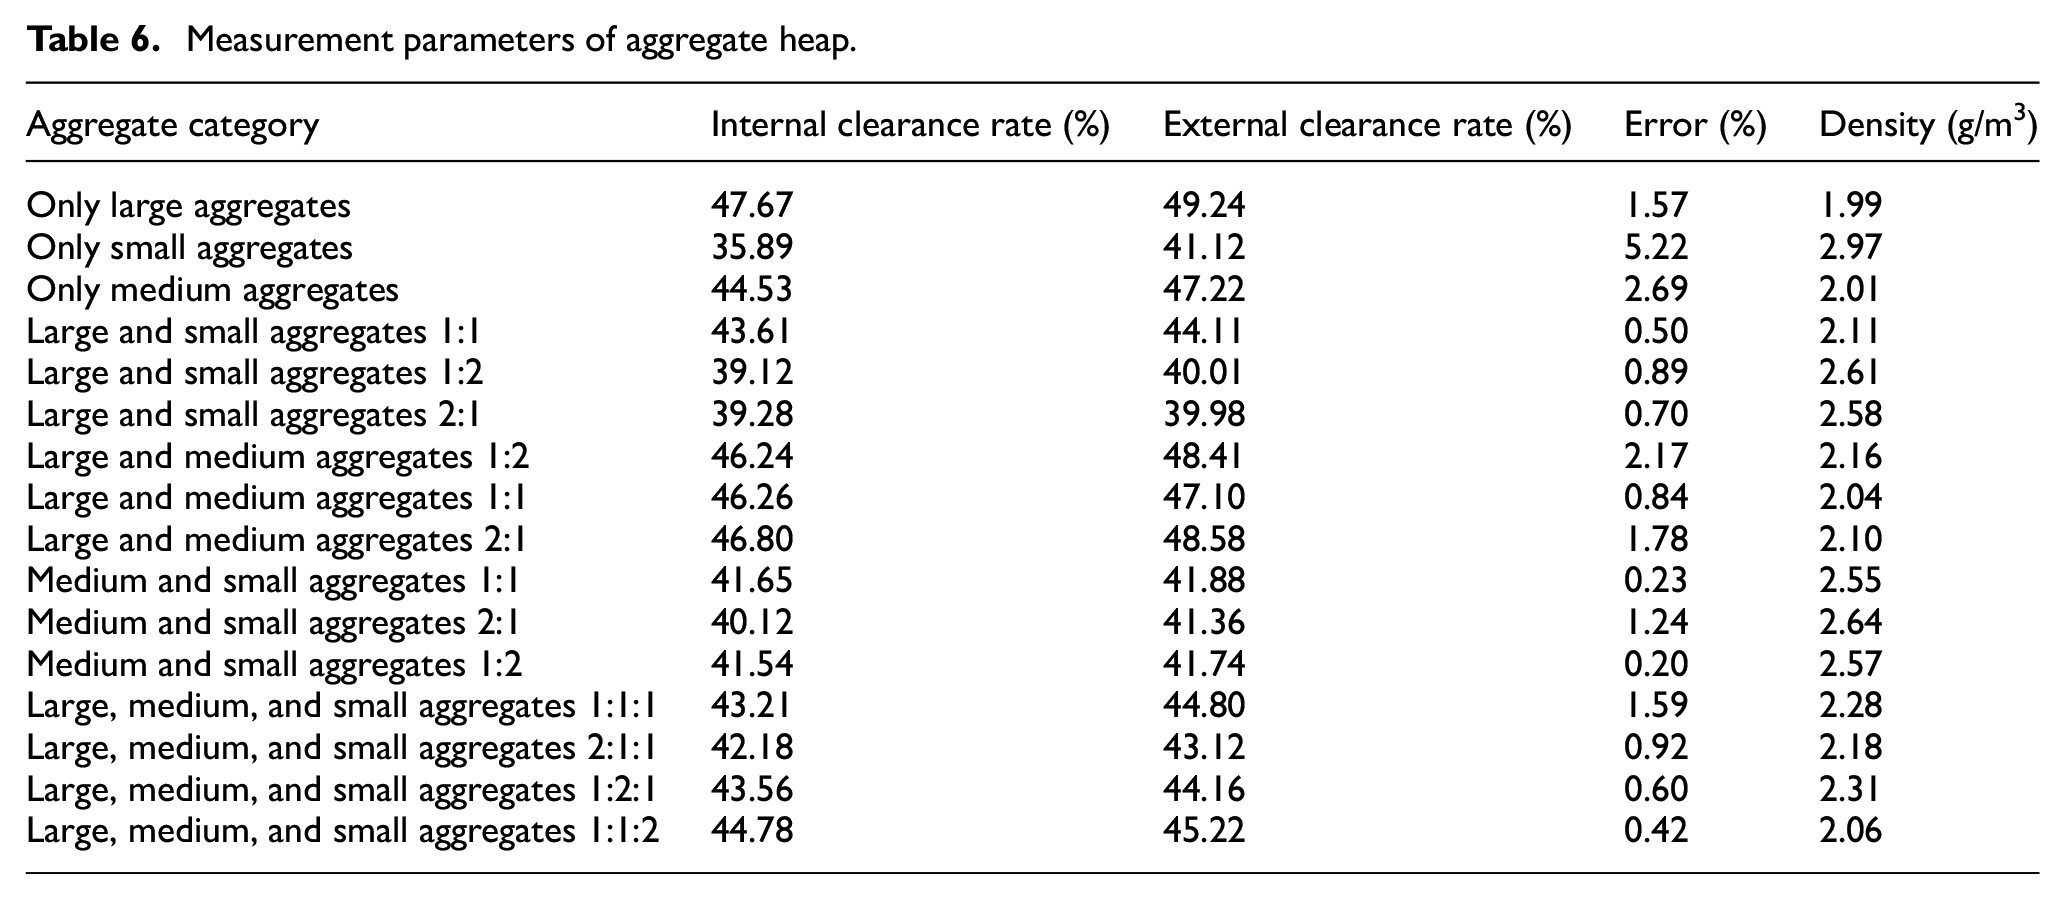
As shown in Table 6, the aggregates are divided into different categories based on their size. The final data is obtained by measuring each group multiple times, then removing the extreme values and taking the average value. From the Table 6, it can be seen that the internal clearance rate is roughly the same value with external clearance rate. Among them, the pure small aggregates having the largest difference in clearance rate, with the error of 5.22%. This indicates that under high-pressure conditions, the clearance rate of small aggregates will become lower. In addition, the error in clearance rate of mixed aggregates is generally lower than 2.17%. Therefore, it is feasible to estimate the internal clearance rate of the aggregate pile based on the external clearance rate of the aggregate pile.
Experiment on weighing aggregates
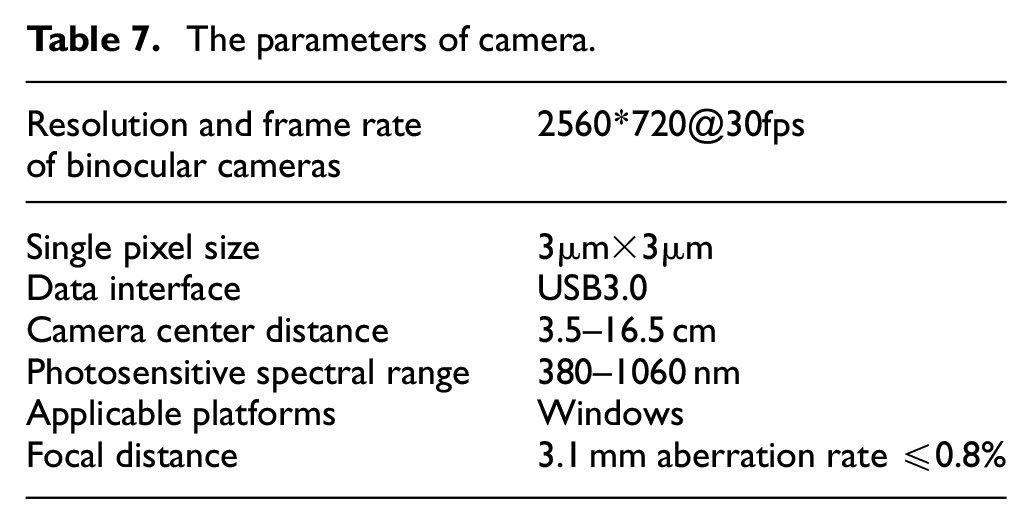
This paper mainly uses a USB3.0 interface binocular camera as shown in Figure 20, with an output frame rate of 30 per second and a focal distance of 3.1 mm, as well as an AMD ® The experimental platform consists of a R5 7520U laptop and a device that can be used to fix a binocular camera. The output frame rate of the camera is 30 frames per second, with a focal distance of 3.1 mm. The adjustable range of center distance between the two cameras is 3.5–16.5 cm. In this article, a center distance of 3.5 cm is used. Using software AMcap for image collection under Windows system, and using MATLAB R2017A for image processing and subsequent volume calculation. The basic camera parameters are shown in Table 7:
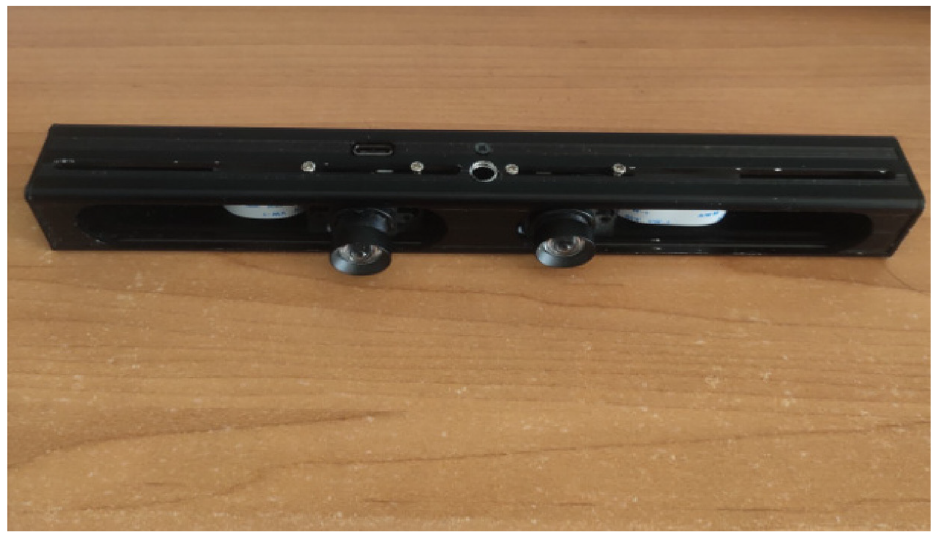
Binocular camera.
The parameters of camera.
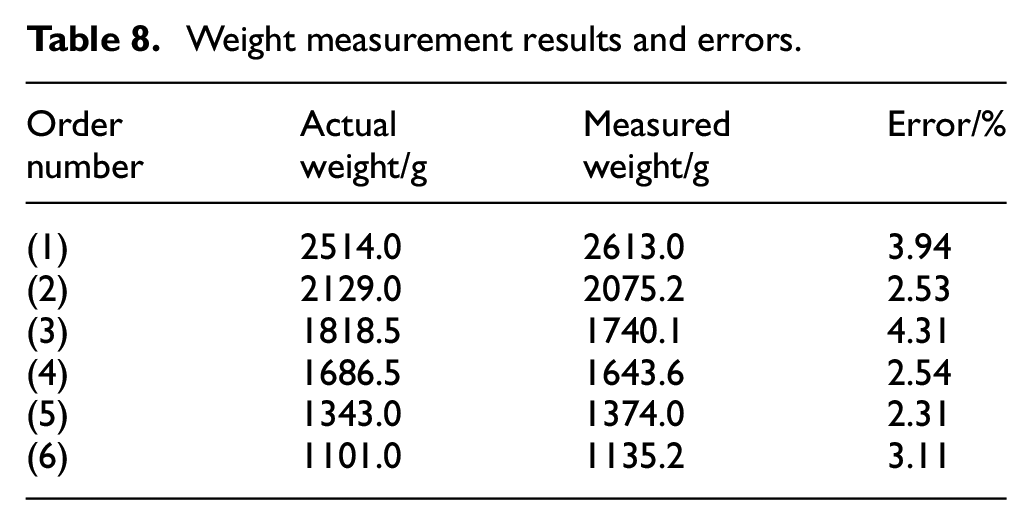
Using the method presented in this article to capture initial images using a binocular camera and calculate the weight of six different sized aggregate piles in Figure 21. The weight measurement results of the aggregate pile are shown in Table 8. The results of the further comparative experiments are shown in Table 9.
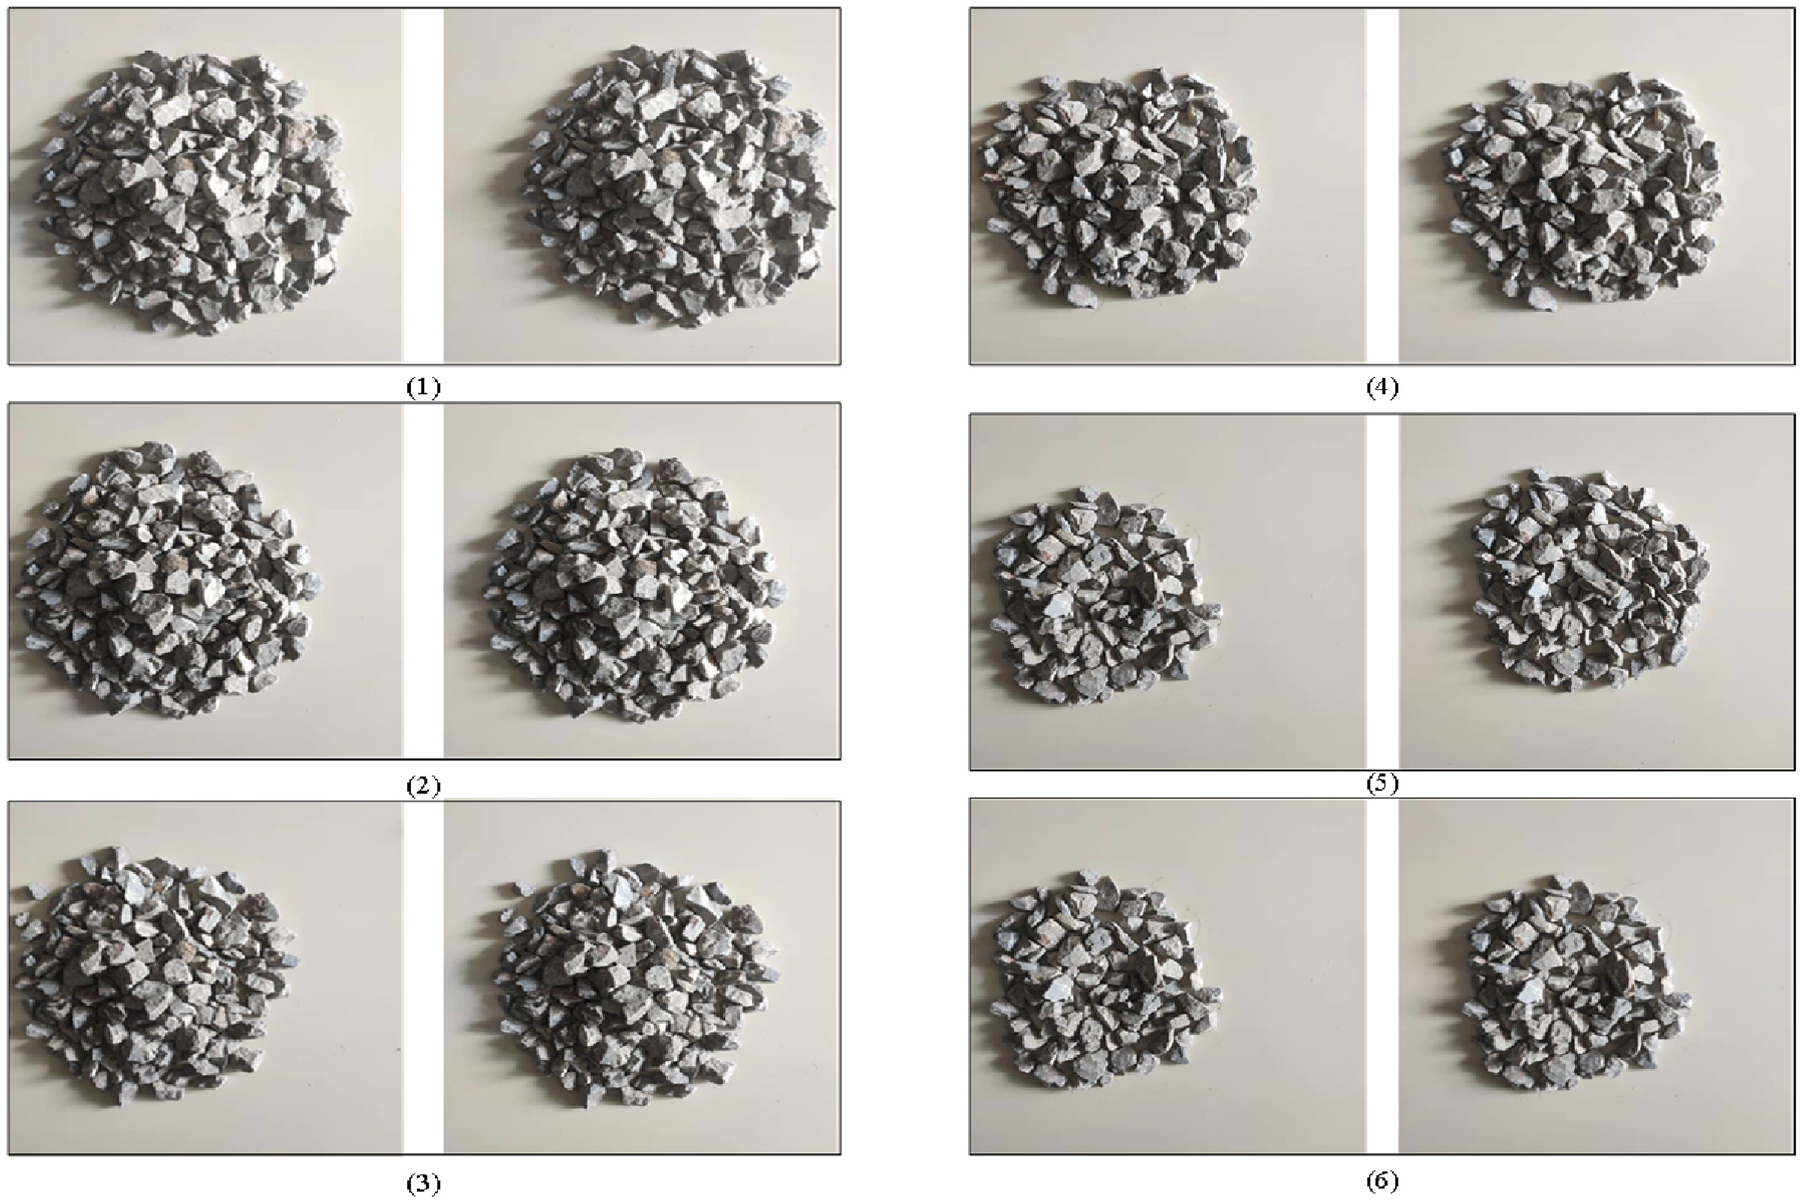
Binocular view of aggregate piles of different sizes.
Weight measurement results and errors.
Experimental results of large-sized aggregate piles.
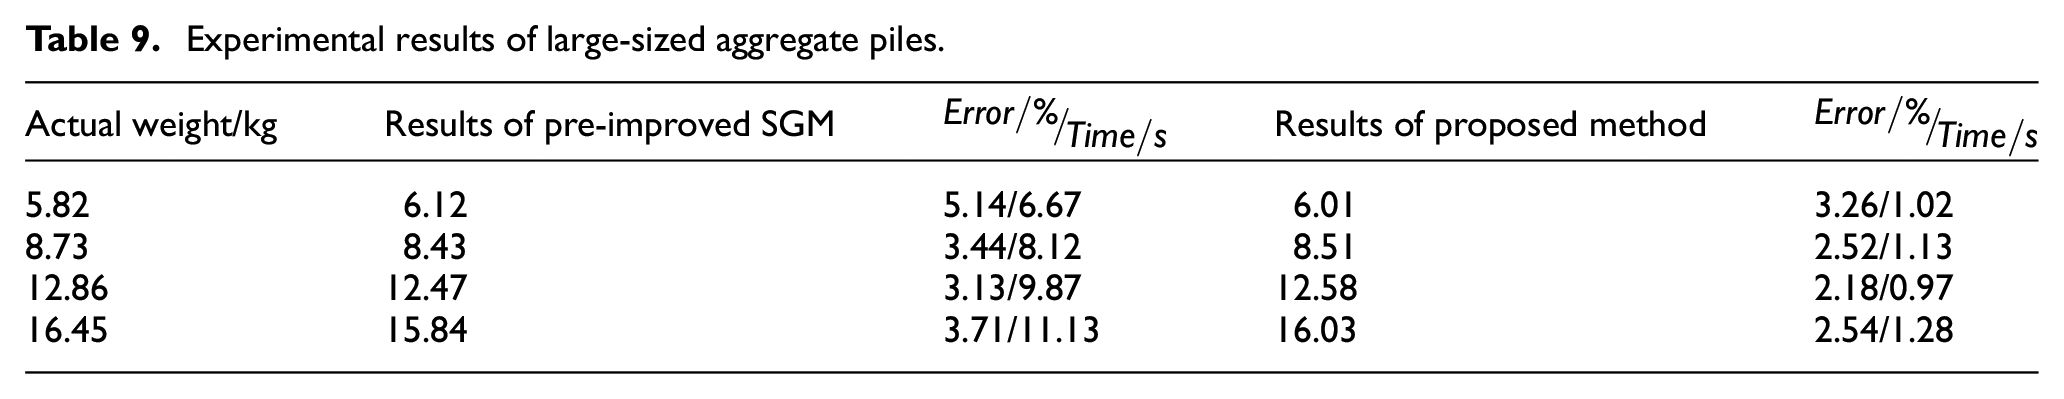
According to the weight data of the aggregate pile measured in Table 7, the average error can be calculated to be approximately 3.12%, and can be found that the maximum error is 4.31%. Although the SGM algorithm still has some flaws in matching accuracy, the main source of error for aggregate piles is that the surface colors of the pile are too similar, which makes the watershed algorithm difficult to segment and the accuracy of clearance rate measurement is low. There is a significant error in the relationship between aggregate density and clearance rate given. Table 8 demonstrates that when the measured weight of the aggregate pile reaches a large value, the method proposed in this paper is far superior to the pre-improved SGM algorithm in terms of both error control and efficiency, and the error value will not increase with the size of aggregate pile.
In industrial production, it has always been difficult to accurately measure the weight of aggregate piles through direct measurement. This article uses non-contact method to measure the weight of aggregate piles, and the results indicated that the proposed method can effectively measure the weight of aggregate piles, although there are certain errors, it also has certain reference value.
Conclusion
This article proposes a non-contact method for measuring the weight of aggregate piles based on binocular vision. Firstly, an improved SGM algorithm is used to calculate the initial volume of the aggregate pile, compared to the original SGM algorithm, it has huge advantages when facing high-resolution images. Furthermore, because of the special stacking space of the aggregate pile, watershed algorithm, improved PSO-GA method, and T-S inference are combined to calculate the clearance rate between the aggregates. The initial volume is corrected to reduce system errors, and a linear relationship between density and clearance rate is established to obtain the weight of the aggregate pile. The experimental results proved the feasibility of this scheme. The method in this article can quickly measure the weight of the target aggregate pile. The non-contact weighing method proposed in this article has advantages over previous contact weighing methods in terms of low cost, fast measurement, simple deployment, and applicability in narrow real-time scenarios.
There are still some remaining issues worth investigating in future work. This includes how to improve the accuracy of stereo matching, as well as combine image processing technology to enhance the applicability of the system for different environments and establish a more complete weight measurement system.
Footnotes
Declaration of conflicting interests
The author(s) declared no potential conflicts of interest with respect to the research, authorship, and/or publication of this article.
Funding
The author(s) disclosed receipt of the following financial support for the research, authorship, and/or publication of this article: This research was funded by the Independent Research Fund of the State Key Laboratory of Mining Response and Disaster Prevention and Control in Deep Coal Mines (No. SKLMRDPC20ZZ06) and the program in the Youth Elite Support Plan in Universities of Anhui Province (No. gxyq2020013) and Innovation fund of Anhui University of Science and Technology (2021CX2054).
Data availability statement
Data sharing not applicable to this article as no datasets were generated or analyzed during the current study.