
Abstract
Hall thrusters are electric propulsion devices that are widely used in modern spaceflight. To obtain the critical corrosion data effectively and accurately during long-life tests of Hall thrusters, this paper proposes an automated corrosion measurement method based on three-dimensional point cloud technology. This method uses binocular structured light scanning method to obtain surface point cloud data. The point cloud topology relationship of these disordered data is also established by KD-tree and radius filtering. The base plane is determined according to the average of the outer circle plane in the discharge chamber, and the original point cloud data is sliced transversely and longitudinally. The point cloud of section data is extracted and the corrosion width data is obtained according to the round hole feature extraction and center of circle calculation. The corrosion angle is calculated according to the angle between the straight line and the normal of the section. The proposed method has been verified and the results show that the overall error accuracy is within 60 μm, which meets the requirements for automatic measurement of Hall thruster corrosion. It is a real and effective method to obtain the critical corrosion data during long-life tests of Hall thrusters.
Keywords
Introduction
The Hall thrusters are widely applied in space propulsion control filed because of their superiorities such as straightforward design, high specific impulse, and efficiency. 1 As satellite platforms and deep space exploration projects continue to progress, spacecrafts demand increasingly higher longevity requirements. Serving as the pivotal components for spacecraft propulsion and attitude control in space, the lifespan of Hall thrusters impacts the longevity of spacecrafts crucially. If ions are released during the operation of the Hall thruster, the discharge channel walls will corrode. As a result, electrodes buried inside the channel walls may be exposed and the effective life of the Hall thruster may come to an end.
The examination of corrosion issues in the discharge channel of Hall thrusters is crucial for enhancing the design, establishing corrosion regulations, and assessing remaining lifespan. In their research, Han et al. 2 investigated the impact of distinct wall erosion on low-frequency oscillation characteristics. Hargus and Strafaccia 3 used a laser-induced fluorescence technology to monitor the wall erosion status of Hall thrusters. Absalamov et al. 4 conducted thousands of hours of ground-life experiments on the SPT-100 thruster to obtain the variation rule of discharge channel morphology with time, focusing on the analysis of ions at the microscopic level, and lacking in-depth exploration of the measurement system and methodology. Mason et al. 5 conducted life experiments on the T-220 thruster using a laser to detect wall losses without describing in detail the calibration method of the measurement system, making it difficult to assess the accuracy of the data. Cho et al. 6 discussed a new method to measure the Hall thruster channel erosion rate using a multilayer coating chip. Multiple metals (e.g. Aluminum and titanium with varying thicknesses were layered and affixed onto the accelerator channel surface of the thruster. After an extended period, the layers were removed in accordance with the corrosion depth order, with the remaining thickness of each layer measured, and the overall motion distance calculated. By monitoring the thickness reduction of each metal layer, the average corrosion rate of the accelerator channel wall during different time periods was accurately determined. However, the measurement technique depends on manual sampling and observation of the change in thickness. It is deficient in automated monitoring. Celik et al. 7 performed real-time emission spectroscopy to assess the relative wall erosion rate of the BHT-200 Hall thruster under different operating conditions.
Ground full life testing 8 is a crucial evaluation method for assessing the design and longevity of Hall thrusters. It also serves as a vital test before Hall thruster mass production. Ground-based full-life tests of Hall thrusters9,10 are typically carried out in vacuum chambers with a pressure of 10−4 Pa. However, the test apparatus described in the literature is bulky, less maneuverable and portable, and necessitates a larger vacuum experimental setting. Ground full-life test times typically range from thousands to tens of thousands of hours.11,12 During the testing, the vacuum chamber should not be opened. If the vacuum chamber is opened, the test environment will be destroyed, and the test results will be affected. 13 The time, manpower and financial resources consumed during the whole process are enormous. This presents significant obstacles to collecting corrosion data, measuring corrosion, and researching the corrosion law of Hall thrusters. In this paper, we proposed a compact, non-invasive, structured light-based technique for automated measurement of corrosion in Hall thrusters. The main superiority of this proposed method is addressing the challenges of data acquisition and corrosion measurement during full life cycle testing, while maintaining a small device footprint. The study also demonstrates the effectiveness of this approach in minimizing subjective evaluations and promoting objectivity in the experimental measurements. The surface image and point cloud data of the Hall thruster are obtained through binocular structured light. Subsequently, a 3D model is created, sliced and the corrosion width and angle are then extracted leading to the automatic measurement of thruster corrosion.
Basic structure and corrosion parameters of thruster
Basic structure of Hall thruster
The most common used Hall thruster is the Stationary Plasma Thruster (SPT), and the component and physical object of this type of Hall thruster is shown in Figure 1. A plasma is created and sustained within a circle ceramic discharge chamber of the Hall thruster, through the interaction of crossed electromagnetic fields. The propellant 14 (typically Xe) is injected into the annular space through the anode. Some of the electrons emitted from the anode enter the discharge chamber and drift toward the anode under the combined action of the orthogonal radial magnetic field and the transverse electric field. During drift, collisions take place between Xe atoms and neutral propellant atoms that are ejected from the anode, leading to the ionization of Xe atoms. Electrons emitted from the hollow cathode enter the discharge chamber, while others neutralize the axially ejected ions, thus ensuring the macroscopic electroneutrality of the thruster plume.
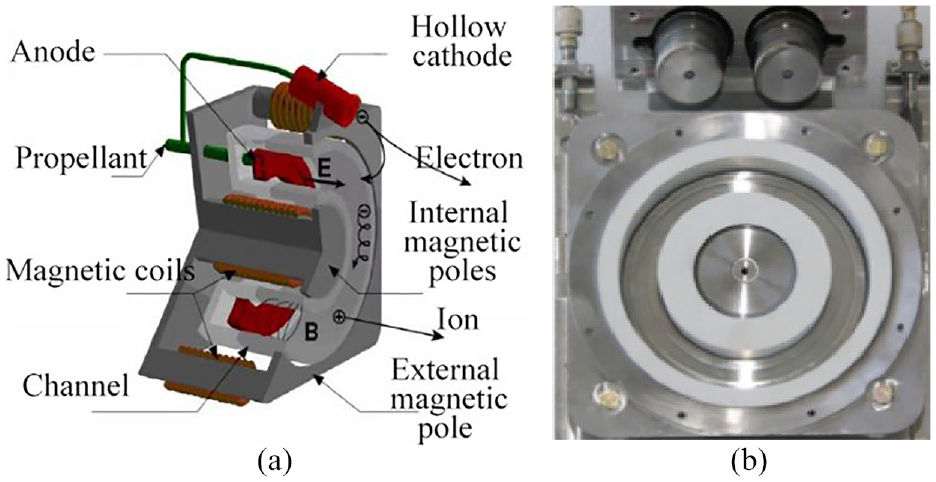
Hall thruster structure and physical diagram: (a) Hall thruster cutaway and (b) Hall thruster physical drawing.
During this process, a significant number of ions and electrons are expelled onto the walls of the discharge chamber. This results in the impact of the ceramic coating layer on the discharge chamber walls, which gradually corrodes the ceramic protective layer. Once the ceramic layer is entirely removed, the magnetic circuit elements become exposed to the plasma, and the thruster’s useful life comes to an end.
Definition of corrosion width and angle
Figure 2(a) displays a schematic diagram detailing the Hall thruster jet plume, while Figure 2(b) presents a bird’s-eye view of the Hall thruster. This thruster comprises of concentric cylinders and annular bodies coated with a layer of white ceramic of specific thickness. The ceramic encapsulates the magnetic poles, with the centers of the cylindrical and annular bodies forming the discharge chamber. The plasma plume emanates from the discharge chamber and erodes the annular wall. The white ceramic layer subsequently diminishes until the magnetic poles enclosed inside are exposed, rendering the thruster inoperable.
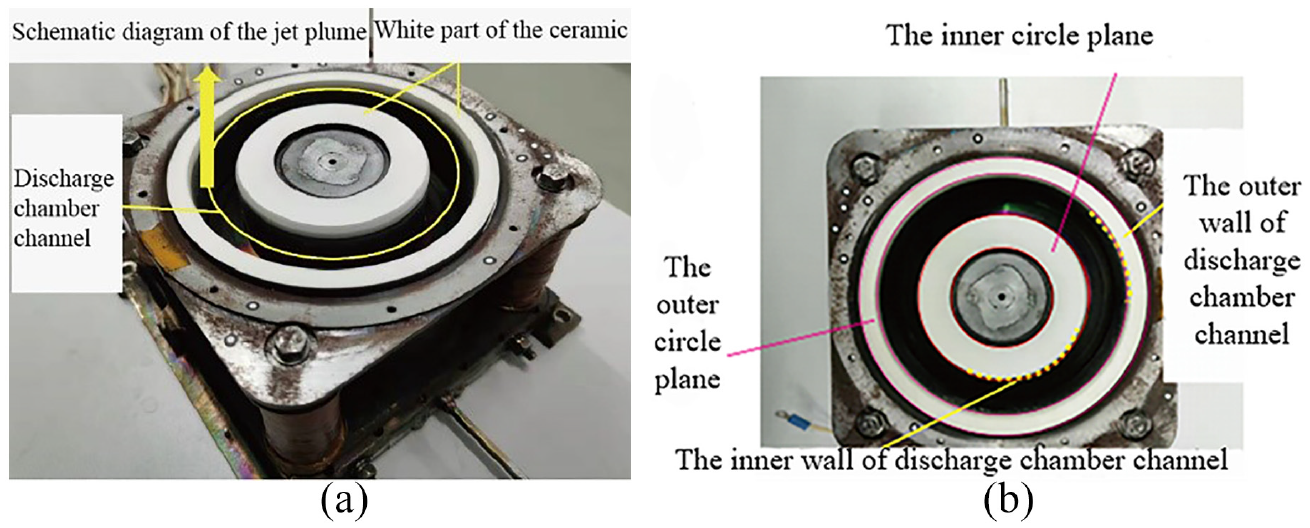
Hall thruster physical drawing: (a) depicts a schematic of the Hall Thruster jet plume, while and (b) displays a top view of the Hall Thruster.
When the ion plume travels through the discharge chamber channel and expels perpendicularly outward, a small fraction of sputtering occurs within a 45° angle at the discharge chamber exit. With continued operation, the initial right-angled configuration of the Hall thruster’s discharge channel outlet undergoes a shift toward an oblique state, with a distinct tilt angle as depicted in Figure 3.
Schematic diagram of the corrosion angle of the Hall thruster.
A cross-sectional view taken along the N-N diameter direction of the Hall thruster is presented in Figure 4, with annotations of the inner and outer wall profiles of the discharge chamber channel, and the separation between the two annular walls referred to as the corrosion width d of the Hall thruster. A cross-sectional view, taken along the N-N diameter direction of the Hall thruster, is presented in Figure 5. Here, markers A and D indicate the outlets of the outer wall of the discharge chamber channel, while markers B and C denote the outlets of the inner wall of the discharge chamber channel. It can be seen from the figure that the corrosion width varies with the depth from the upper surface. Under real-world conditions, the inner and outer walls of the Hall thruster’s discharge chamber channel outlets are eroded to different extents. Angles
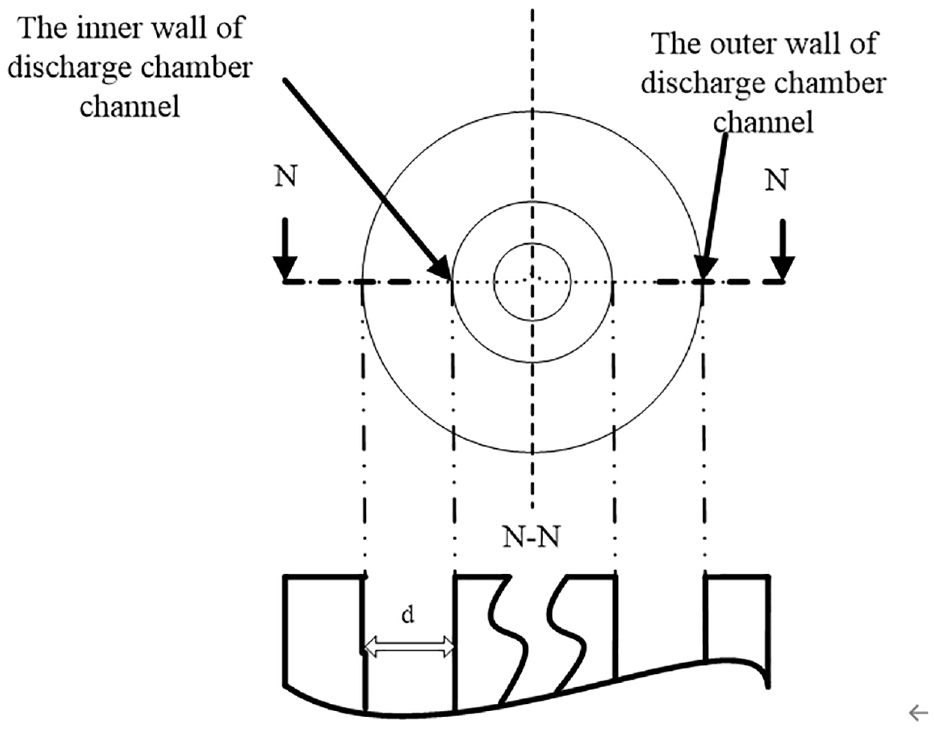
Schematic diagram of the Hall thruster profile.
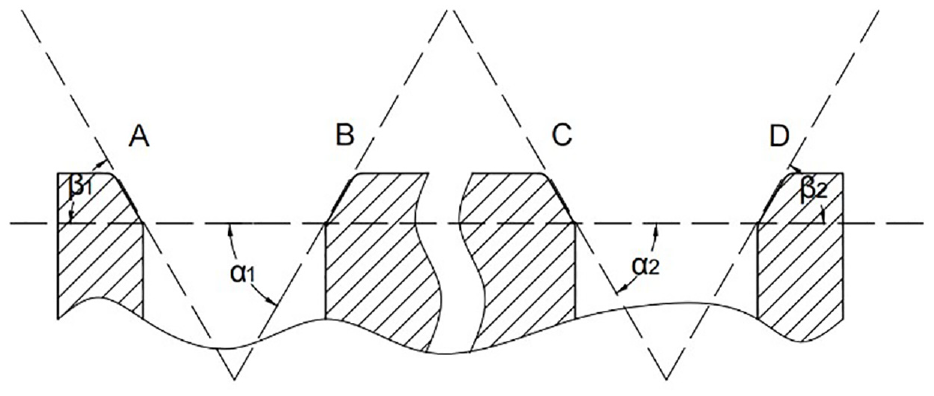
Schematic diagram of internal and external corrosion angle definition.
The proposed method
Erosion width and angle are important metrics in quantifying Hall thruster erosion. To isolate the sectional point cloud data that needs the measurement from the thruster’s point cloud model, we use the cross-section splitting approach based on the previously defined erosion width and angles. Subsequently, we perform feature extraction to calculate and measure the erosion data. Angle position is also conducted during this process. The point cloud model is first collected by the binocular structured light and then processed. Afterward, the erosion width and erosion angle measurement methods are developed.
Processing methods for point cloud model
Phase Measurement Deflectometer (PMD) 15 and Phase Measuring Profilometry (PMP) 16 are two types of classical structured light measurement techniques. They are employed to achieve precise surface shape detections and measurements. PMD is primarily utilized to detect objects with a specular reflection, such as the paint on a vehicle’s body or the flatness of glass. PMP is predominantly used to measure surfaces with diffused reflection. In this paper, the Hall thruster’s surface exhibits diffused reflection, hence implementing the phase measuring profilometry (PMP) method to gage the Hall thruster and procure the primary point cloud data.
The processing of the point cloud model is bifurcated into two fundamental stages, namely, point cloud noise reduction processing and point cloud model establishment. Due to the specific nature of the test environment, some extraneous background information may arise. Figure 6(a) illustrates the axes viewable in the original point cloud image, with the axes situated at the bottom of the Hall thruster and the Z-axis representing the vertical direction. Firstly, a preliminary filtering is carried out based on the depth information in the Z-axis and the amplitude range in the X and Y axes. Next, the original point cloud data is subject to radius filtering using a neighborhood radius of 0.16 mm and a data neighbor threshold of five to remove non-critical target noise. The spatial data points are filtered down to 103,043 from 155,622, wherein 52,572 noise points are eliminated as irrelevant for Figure 6(b)’s generation. However, there are some invalid data points still present in Figure 6(b) that require processing since they might disrupt the triangulation model’s precision. Taking into account the physical characteristics of the Hall Thruster, we apply secondary filtering based on the X and Y offsets. The radius filtering processing of the original Hall Thruster 3D point cloud is then evaluated and visualized in Figure 6(c). As a result, the total number of spatial 3D data points reduces from 103,043 to 101,721 after filtering out 1322 extraneous noise points. As illustrated in Figure 6(a) displays the obtained initial point cloud data of the Hall thruster. Figure 6(b) presents Hall thruster point cloud data, which was filtered to remove irrelevant backgrounds based on radius. Figure 6(c) displays the same data after secondary noise reduction was applied.
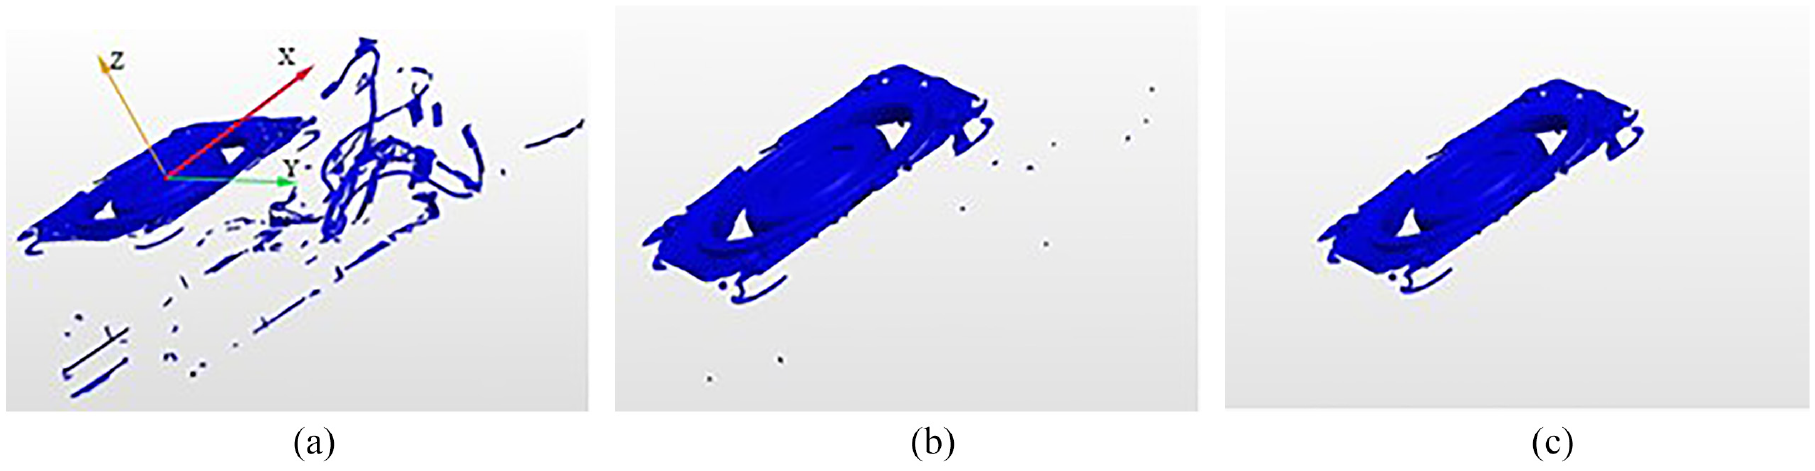
Hall thruster point cloud processing: (a) shows the original point cloud image of the acquired Hall thrusters, (b) displays the Hall thruster point cloud data obtained by radius filtering to exclude irrelevant backgrounds and (c) shows the Hall thruster point cloud data after noise reduction.
The enlarged point cloud data of the Hall thruster is extracted locally, as illustrated in Figure 7. The denoised point cloud retains its original features clearly. The point cloud at the inner wall edge of the discharge chamber (in the red box area) remains preserved, offering benefits for future measurements of the erosion angle. The processed point cloud is transformed into a mesh surface by triangulating the data points in space along their normal vectors onto corresponding spatial planes to acquire the topological configuration between the original data points in space. The diagram in Figure 8 displays the ultimate triangular model, with the highlighted red area revealing a magnified localized illustration. It is evident that the model has effectively conserved the distinct features of the curves present on the interior and exterior walls of the discharge chamber. This outcome establishes a foundation for gaging the erosion angle in forthcoming evaluations.
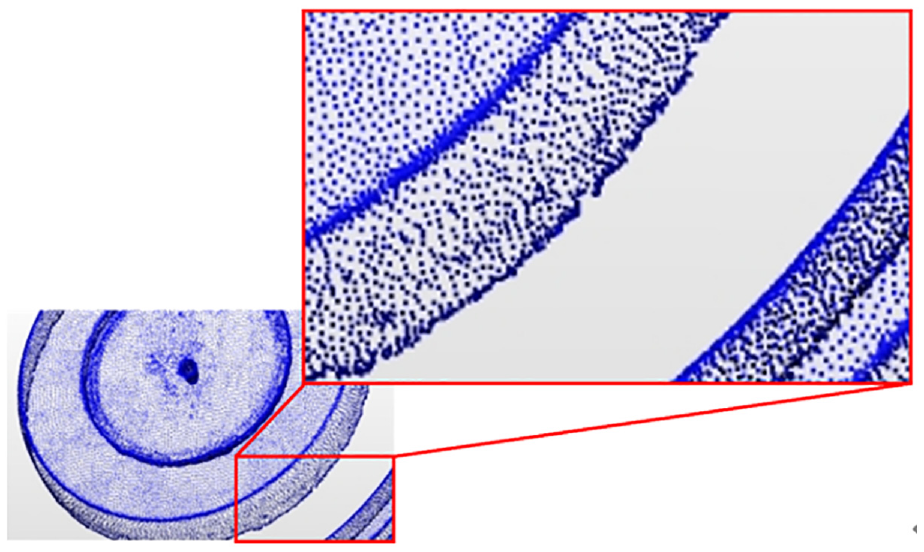
Local enlarged view of the point cloud after filtering.
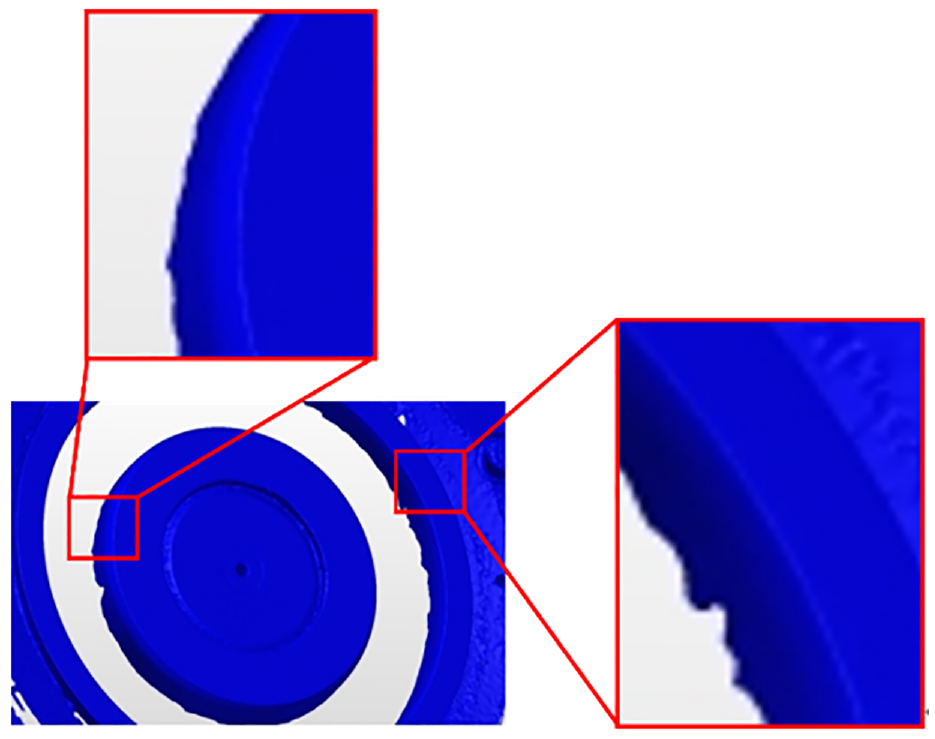
Partial enlargement of the triangular faceted flake.
Corrosion width measurement
Measurement methods
The process for measuring the corrosion width of the Hall Thruster is depicted in Figure 9, comprising the subsequent key stages.
Generate the inner circle plane W1. The inner circle data point cloud of the upper surface of the Hall thruster was selected and labeled
Generate the outer circle plane W2. The outer circle data point cloud of the upper surface of the Hall thruster was selected and labeled
Base plane fitting. The plane is averaged and the new plane W3 is generated as the base plane according to the inner circle plane W1 and the outer circle plane W2;
Base plane offset. Offset the base plane W3 downward in the direction of its normal vector, the offset is extremely DX;
Generate cross section D1. The new plane W4, formed after the base plane has been moved downwards, forms a section with the original Hall thruster point cloud dataset
Filter non-target noise. The intersection of cross section D1 and the original data set
Fit the wall circles O1 and O2 inside the discharge chamber. The data points of the inner wall of the discharge chamber channel were collected and the inner wall circle O1 was fitted. The data points of the inner wall of the discharge chamber channel were collected and the outer wall circle O2 was fitted;
Calculate the corrosion width d. The corrosion width of the Hall thruster is calculated according to the radius r1 of the inner wall circle O1 and the radius r2 of the outer wall circle O2, and the reduction of the white ceramic layer ãd is analyzed.
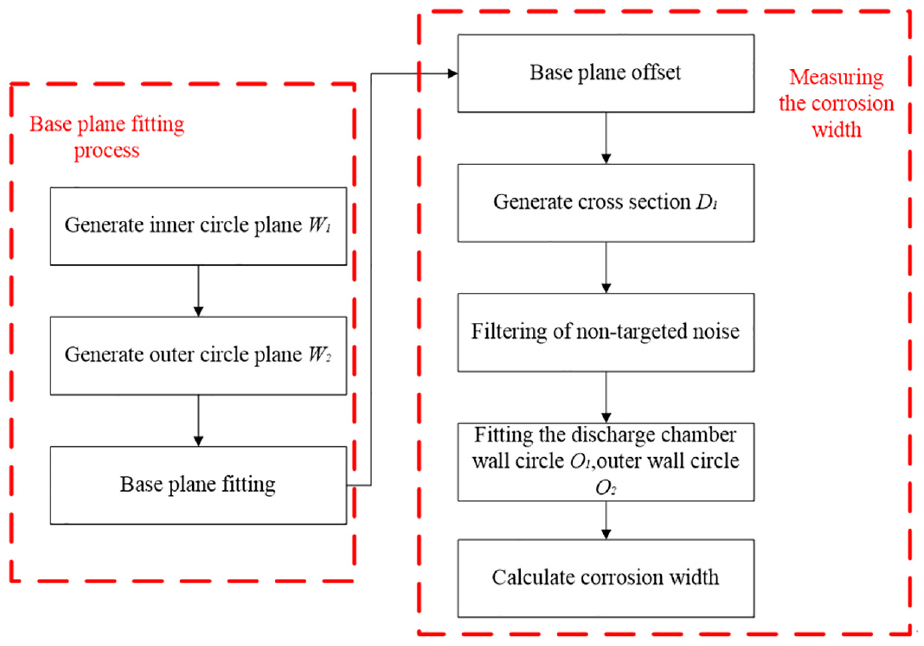
Flow chart of corrosion width measurement method.
The corrosion width measurement method mentioned earlier utilizes the least squares method as the circle fitting algorithm, which follows these steps:
Fitting the circular boundary, express it as the circular equation: (x − a)2 + (y − b)2 = r2, where (a, b) are the center coordinates of the circle and r is the radius.
Bringing each point cloud data point (xi, yi) into the above circular equation, the minimization error function is:
By solving the partial derivatives of the error function F with respect to a, b, and r, and making them equal to 0, three equations can be obtained:
By solving the three equations aforementioned, the parameters of the circle center (a, b) and radius r can be determined, which is the fundamental concept of circle fitting through the least squares approach.
By inputting the acquired parameters into the circular equation, it is possible to obtain the least-squares circle that fits the perimeter of the inner ring point cloud.
Select the base plane for measuring the corrosion width
As depicted in Figure 2(b), the discharge chamber channel of the Hall thruster divides its upper surface into two planes, specifically the inner circle plane and the outer circle plane. Due to the height differential between the two planes and noise interference during the collection of surface point cloud data, using the point cloud data directly from the upper surface to calculate corrosion width may result in errors. Combining Figures 4 and 5, the Hall thruster’s corrosion width is shown to vary with depth from its upper surface. Measuring various corrosion widths at different depths is reasonable during Hall thruster life tests. Different corrosion widths reflect varying depths of corrosion, providing value for improving Hall thruster process technology.
To obtain corrosion widths at various depths, it is necessary to determine a base plane to serve as the datum plane. The discharge chamber channel divides the upper surface of the Hall thruster into two planes of differing heights, making it more reasonable to use their average as the datum plane instead of either one individually. The Hall thruster must be sliced laterally at various depths to obtain corrosion widths at diverse locations. The discharge chamber channel of the Hall thruster naturally separates the white ceramic part into two annular planes, as illustrated in Figure 2(b). Choosing a single plane for downward slicing may cause errors; therefore, selecting and fitting measurements of split planes are essential. Since the plasma does not significantly corrode the upper surface data of the Hall thruster, the two fitted planes can be averaged and utilized as the lateral downward slicing reference plane.
The point cloud dataset

The above formula can be written in matrix form:
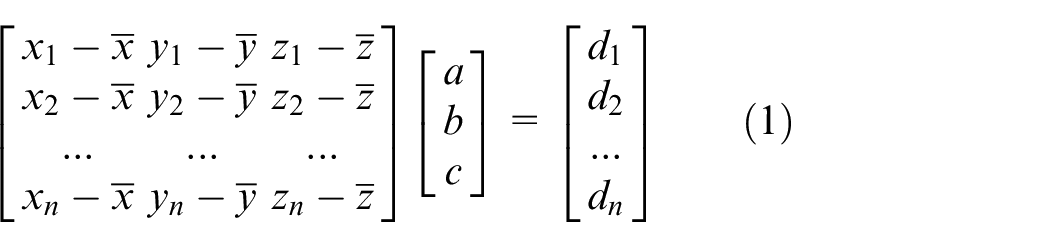
Suppose the left matrix is as follows:
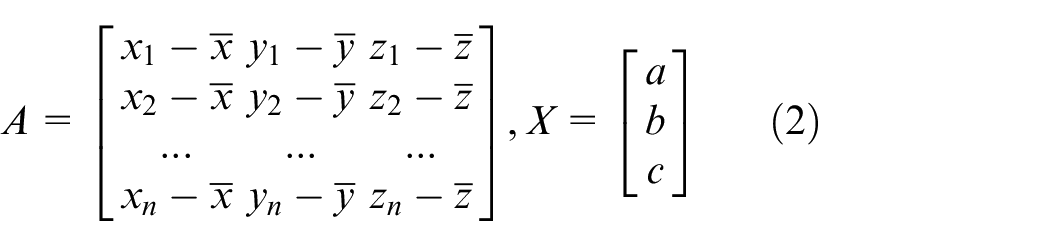
To make more surface point cloud data fall on the plane to be fitted, it is necessary to reduce the sum of the distances from each point cloud to the plane to be fitted, and transform the plane fitting into a least-squares solution of the overdetermined equation so that
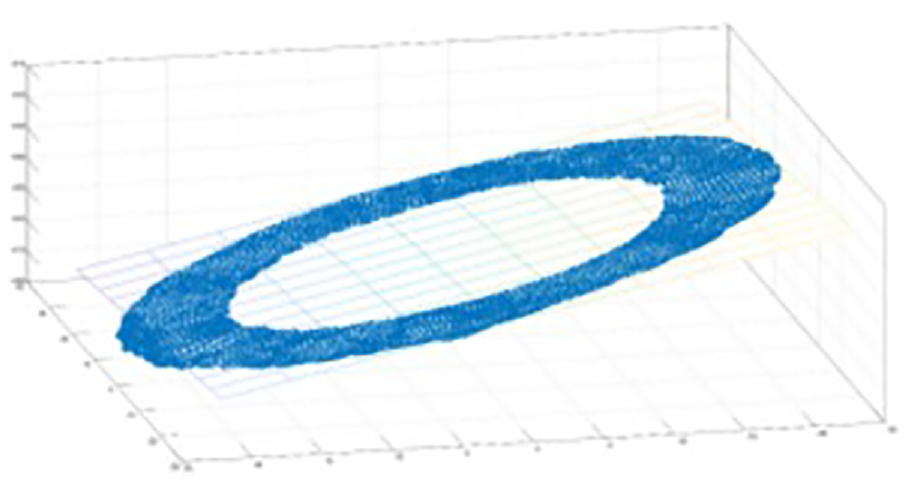
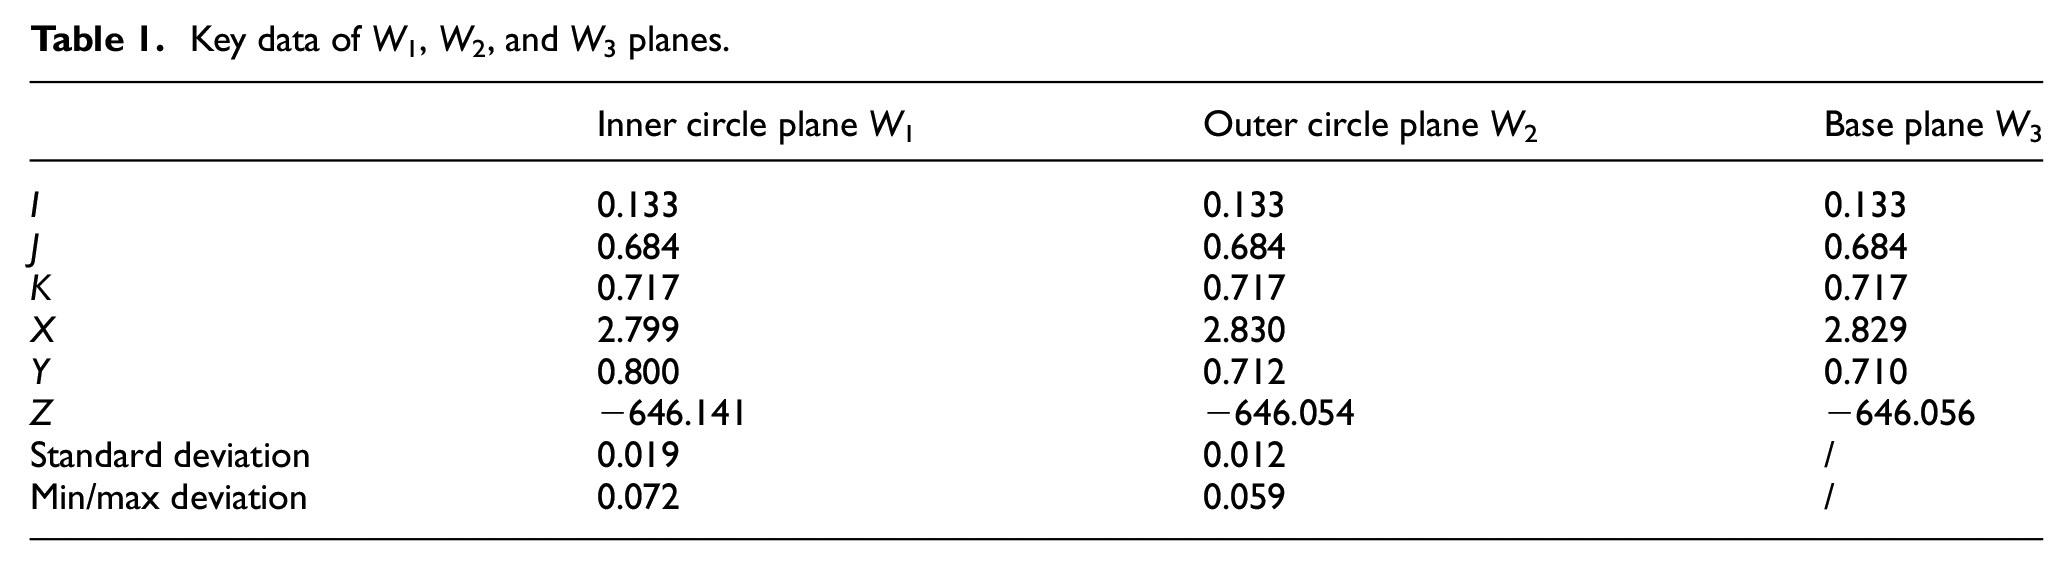
The point cloud of the Hall thruster fits the inner circle plane W1.
Key data of W1, W2, and W3 planes.
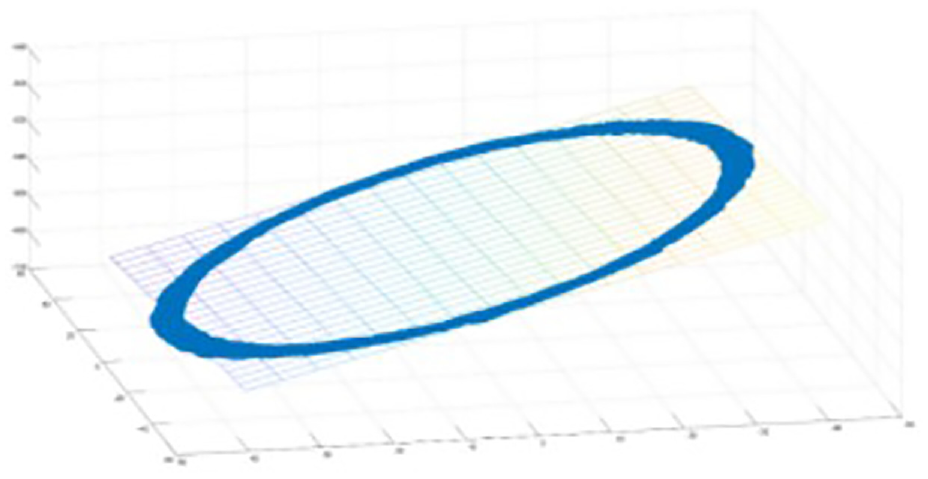
The point cloud of the Hall thruster fits the outer circle plane W2.
Table 1 displays crucial values for the inner circle plane W1, outer circle plane W2 and base plane W3, which convert the plane into a point-oriented equation representation. Here, X, Y, and Z represent the point’s coordinates, while I, J, and K denote normal vectors. Finally, the deviation values of the plane fit for the inner circle plane W1 and the outer circle plane W2 have been obtained.
Cross-sectional circle extraction and corrosion width measurement
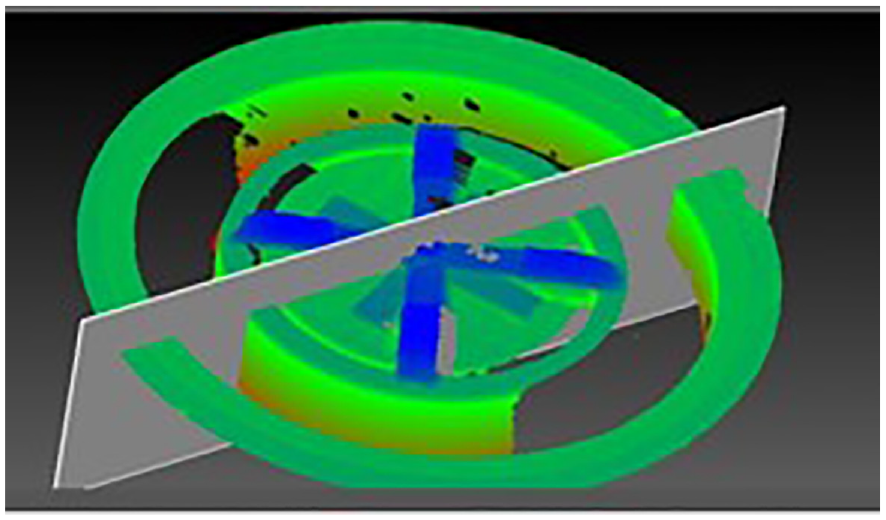
By applying a downward bias to the base plane W3 along its normal vector direction within the range of [0,7.36] mm, the corrosion width of the Hall thruster at the present depth can be gaged. To provide an example of a bias threshold of 4 mm, W3 is shifted by 4 mm perpendicular to the lower edge of the Hall thruster, creating a new plane labeled W4. Subsequently, W4 intersects the original data point cloud, generating cross section D1. The point cloud data and offset plane W4 are intersected to create a cross-section, as illustrated in Figure 12.
Cross-section diagram.
The corrosion width of a Hall thruster can be measured by determining the radius difference between the inner and outer concentric circles. Therefore, it is necessary to segment the inner two section concentric circle portion from the rest of the point cloud. In this paper, a clustering segmentation algorithm based on distance distribution thresholding is proposed. The algorithm is as follows:
Let the point cloud dataset on the section be
If the length value of the line segment
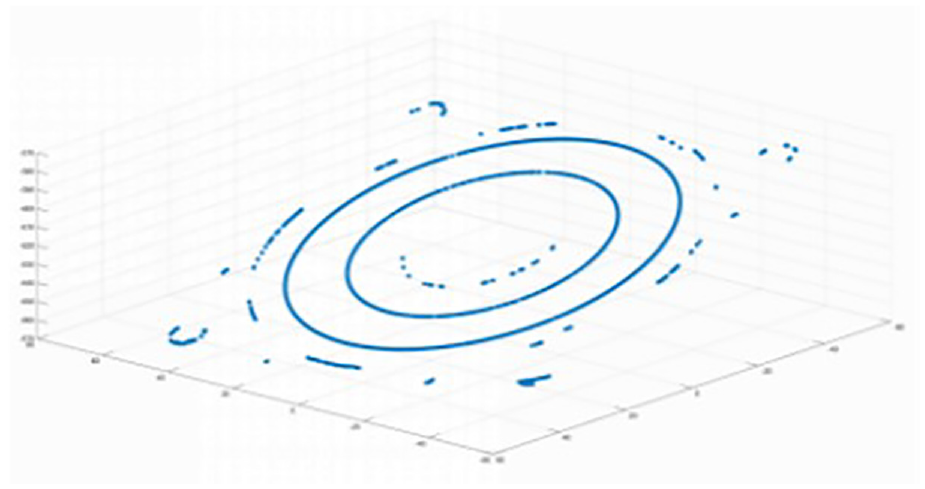
Here, according to the physical characteristics and test results, g is 0.05 mm and Thres is set to [0,60]. To ensure the extraction effect, the clustered concentric circles are verified twice, combined with the physical actual size characteristics, the point cloud data within the radius of [30, 60] mm are selected, and finally two concentric circles are extracted as shown in Figure 13, where the circle with the smaller radius of the inner circle is denoted as inner circle O1, and the radius of the larger outer circle is recorded as outer circle O2.
Inner and outer wall circles of the Hall thruster.
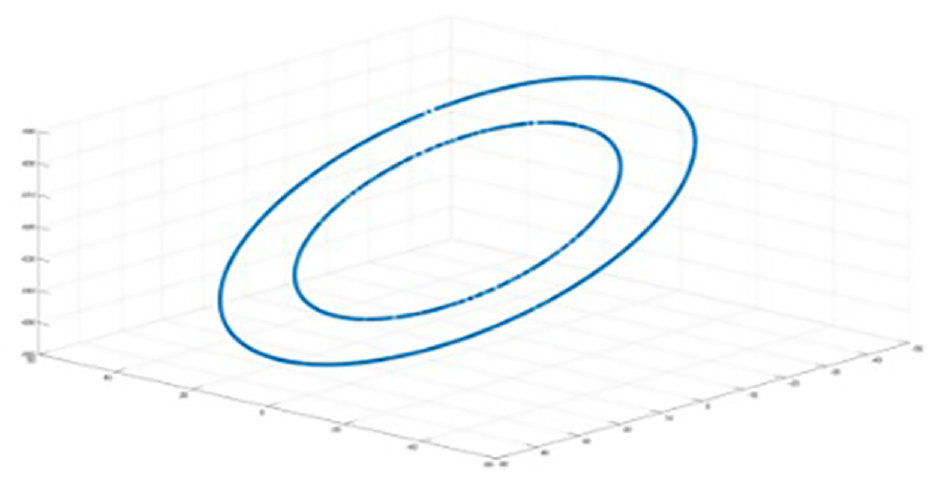
The circular alignment of O1 and O2 is illustrated in Figure 14. Figure 14(a) exhibits the circular alignment circle of the inner wall of the discharge chamber channel, while Figure 14(b) displays the circular alignment circle of the outer wall of the same channel. Furthermore, the red box indicates the local magnification of the alignment effect.
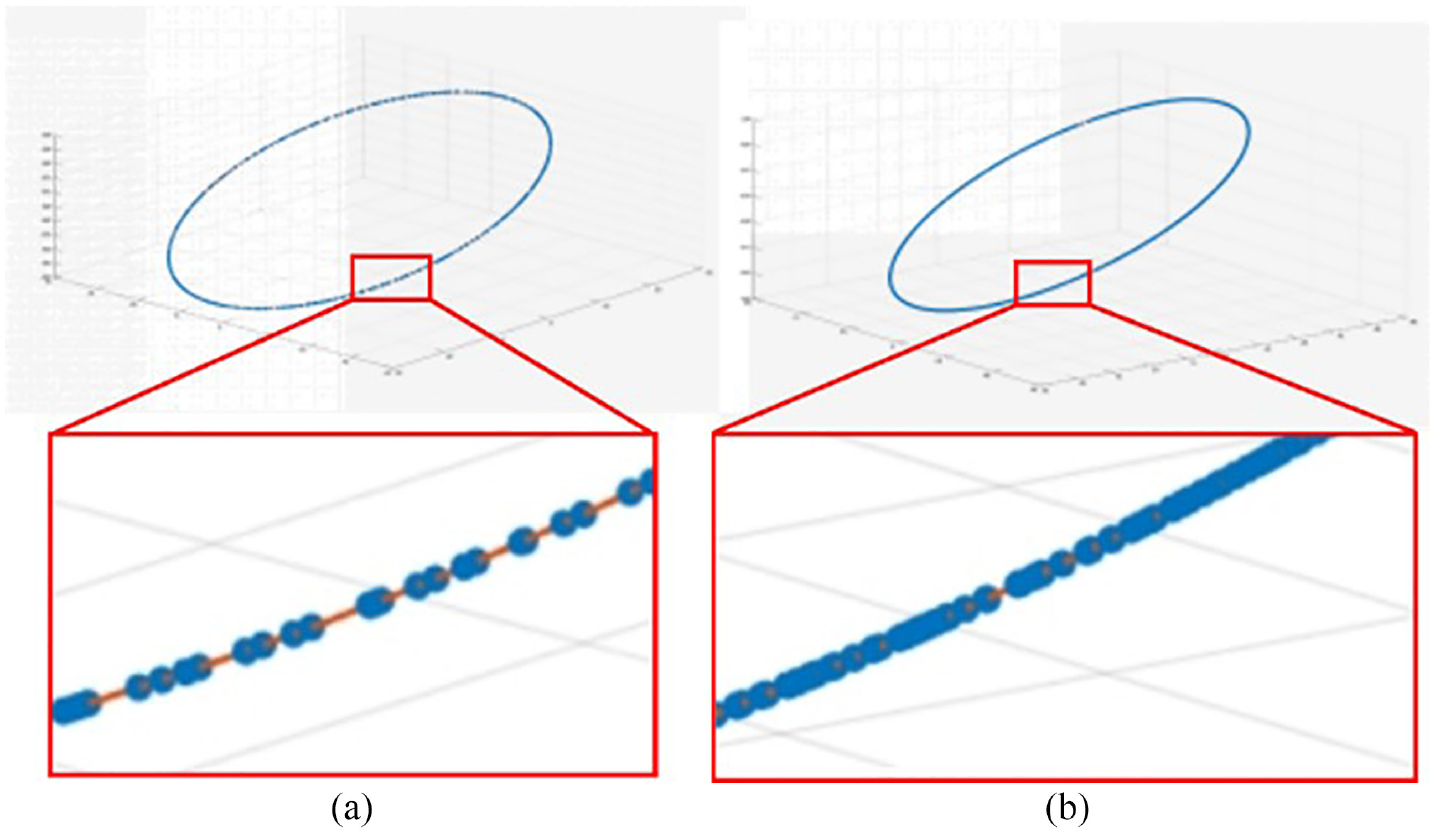
Results of the circular fitting of the inner and outer walls: (a) displays the outcome of circular-circular fitting on the inner wall surface and (b) shows the outcome of circular-circular fitting on the outer wall surface.
Suppose the corrosion width is
There into:
The corrosion width d of the Hall thruster is:

The Hall thruster discharge chamber channel corrosion width transformation

Corrosion angle measurement
Measurement method
The corrosion angle is measured as follows:
Create a vertical section
Obtain the data set
Generates a line
Calculate the corrosion angle
Angle measurement
If a point is chosen as the reference origin for drawing a plane section, its location and direction relative to the three-dimensional model are determined. When the reference origin is not properly selected, non-orthogonality to the cross-section plane and the direction of the cross-section can cause distortion. In this paper, the reference point will be designated as the center of the concentric circle formed by the inner and outer wall surfaces of the discharge chamber channel of the Hall thruster. Selecting the center of the circle as the point of reference can heighten the precision and clarity of related analyses and calculations, whilst also minimizing errors attributed to human factors.
To determine the Hall thruster’s corrosion angle, it is imperative to divide it longitudinally and obtain the vertical section point cloud data. Figure 15 depicts the longitudinal slicing. The Hall thruster’s point cloud data is sliced longitudinally based on the normal vector of the cross-section, as illustrated in Figure 16 depicting a four-slice section schematic. The number of slices may be increased as required without restriction.
Longitudinal split schematic diagram of the Hall thruster.
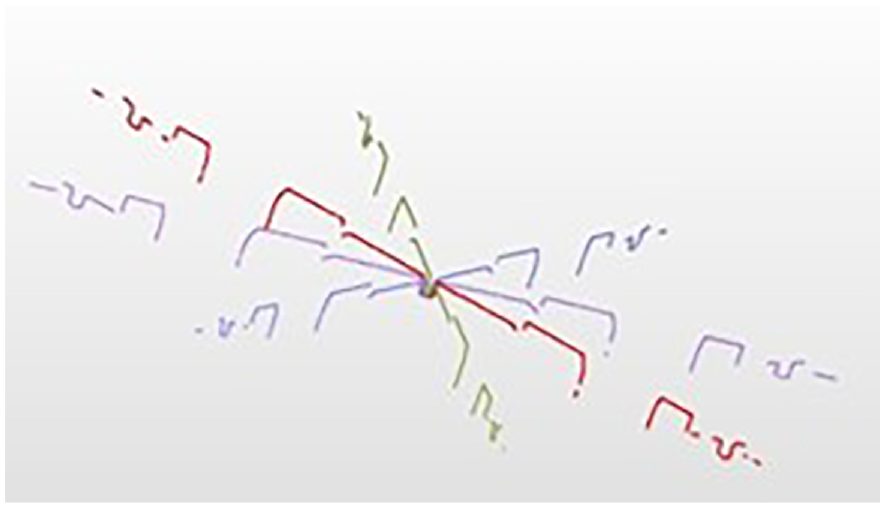
Diagram of four equal-section Hall thrusters.
Taking one of the cross-sectional data sets
Z1 diagram of the vertical section.
The corrosion points cloud dataset,
Schematic diagram of corrosion chamfering fitting.
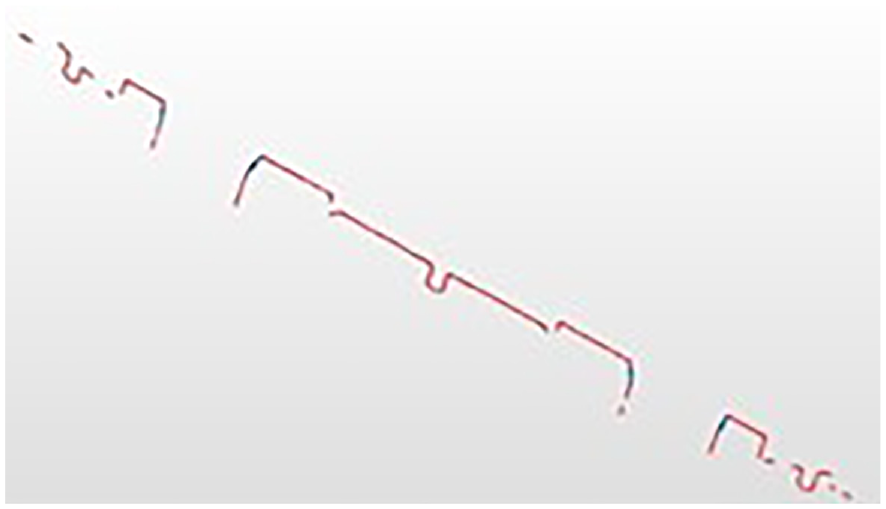
The point cloud located at the uppermost part of vertical section Z1 will be subject to linear least squares fitting. The straight line that has been fitted will form a number of angles with cross section D1, as displayed in Figure 19. In compliance with the diagonal principle, ∠1 = ∠2, ∠3 = ∠4, ∠5 = ∠6, and ∠7 = ∠8.
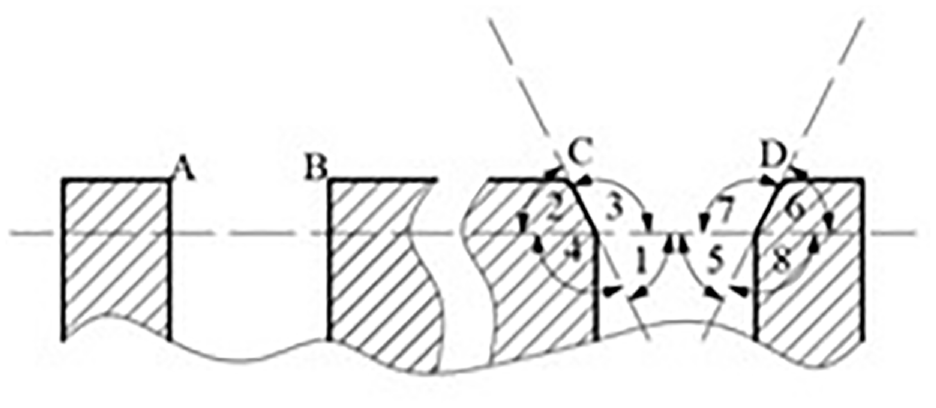
Schematic diagram of internal and external corrosion angle.
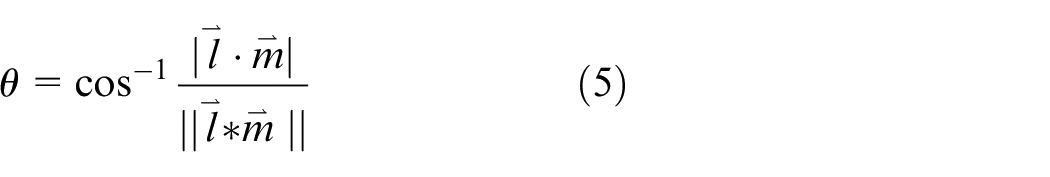
Using the corrosion angle at the outlet of the corrosion discharge chamber wall in the Hall thruster as a case study, only the correlation between ∠1 and ∠3 needs to be examined, which fulfils the following requirements: (1) ∠1 + ∠3 = π; (2) ∠1 is not equal to ∠3. Based on the above two relations, we can deduce that ∠1 and ∠3 are required to be acute and obtuse angles, respectively. Consequently, to comply with the actual measurement requirements, the inner wall corrosion angle (defined as the inner angle) at the outlet of the Hall thruster discharge chamber is determined as the minimum value between ∠1 and ∠3. Similarly, the corrosion angle of the outer wall of the discharge chamber in the Hall thruster, also called the outer angle, is determined as the minimum of ∠6 and ∠7. The corrosion angle can be acquired by utilizing the direction vector,
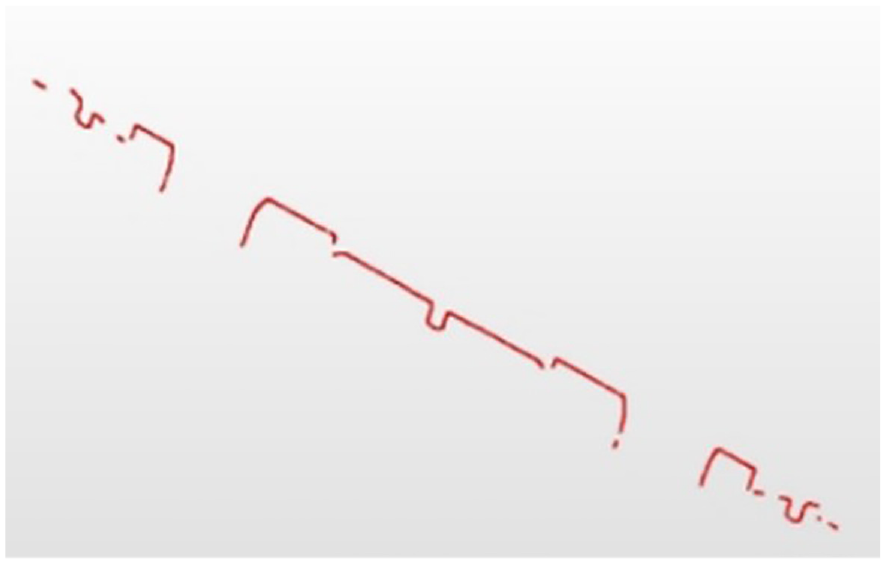
The profile formed by the longitudinal section
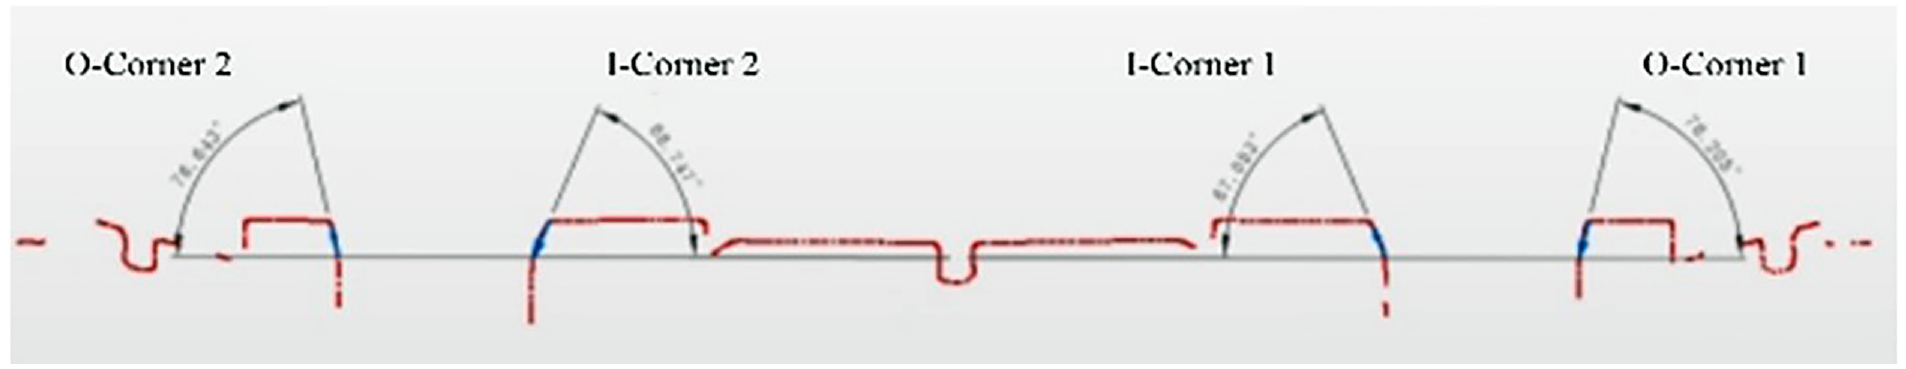
A set of corrosion angle diagrams.
Experimental testing
Experimental platform
The diagram in Figure 21 displays the entire Hall thruster erosion measurement system. this structure diagram consists of a vacuum mechanical unit (with front and rear moving mechanisms, a lifting moving mechanism, and a rotating probe mechanism), a visual measurement unit (containing a projector and a binocular camera), and a cabinet (an industrial computer and various tool interfaces). The visual measuring unit is mounted onto the vacuum mechanical unit, which will be inserted into the experimental vacuum chamber to link to the external cabinet through cables. The Hall thruster is secured at a designated experimental location within the vacuum chamber. Upon cessation of its operation, the probe is advanced and angled downwardly to the measurement position for capturing photos and collecting relevant data. After data collection, the system returns to its initial position along the original path, ready for the next measurement.
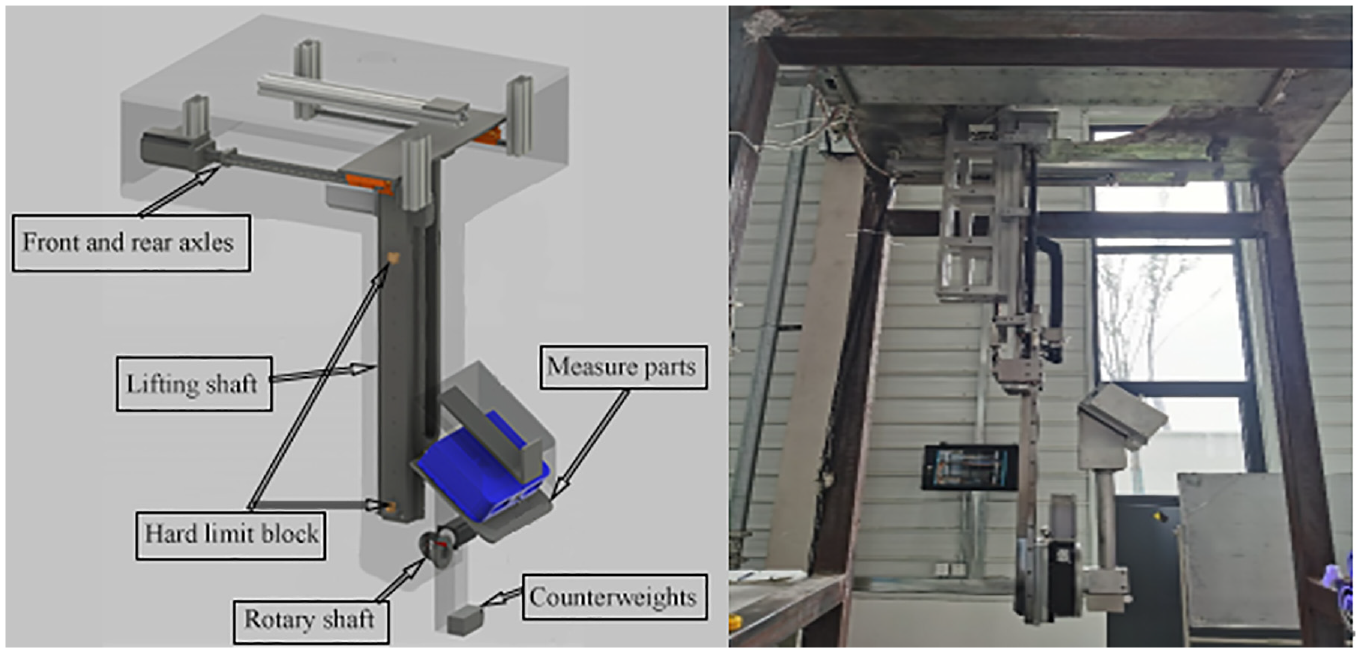
Measurement models and physical structure diagrams.
System calibration
The calibration sphere bar is an internationally recognized standard instrument for assessing the performance of coordinate measuring machines (CMMs). Because of Its high precision, ease to use, and comprehensive capabilities, it superior to many other methods, such as gage blocks, in evaluating the accuracy and efficiency of CMMs.
In this paper, German standard VDI/VDE 2634 Part 2 is selected as the calibration sphere bar to verify the measurement accuracy, as shown in Figure 22. The left sphere has a diameter of 24.993 mm, while the right sphere has a diameter of 24.992 mm and the center distance is 199.975 mm.
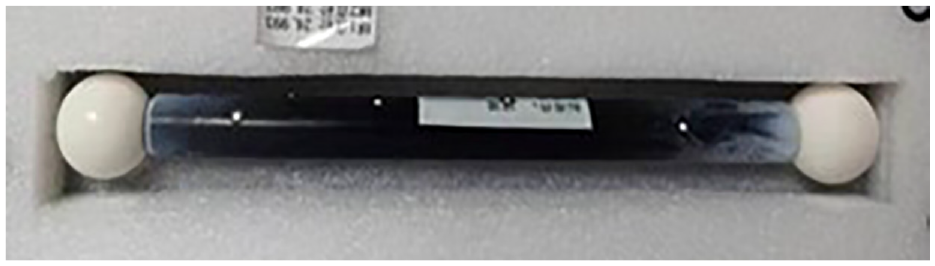
Actual drawing of a ceramic bat.
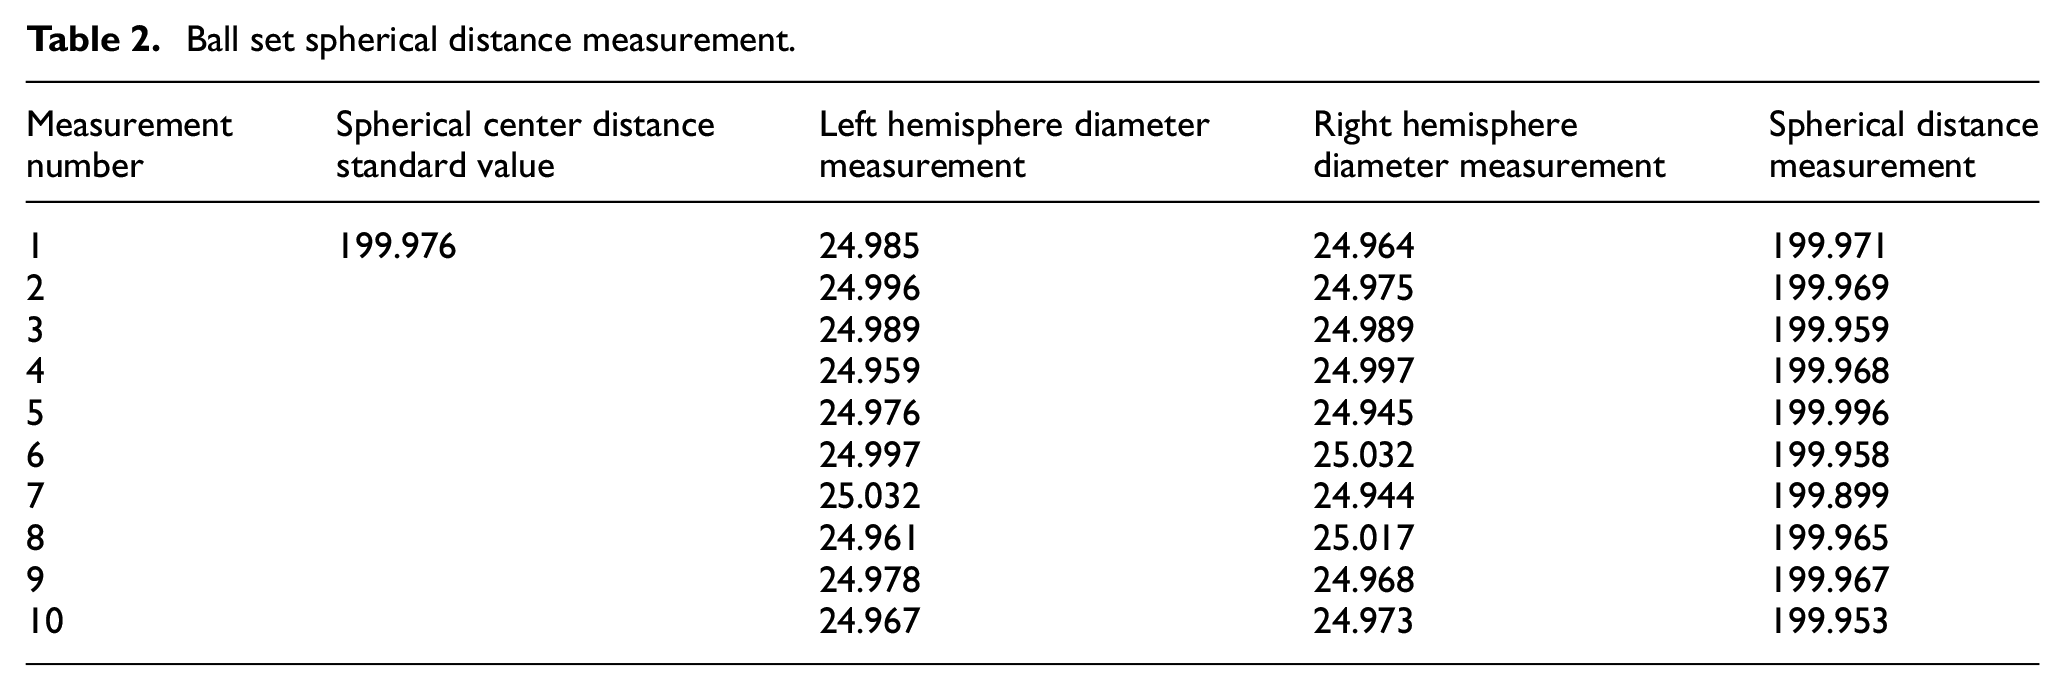
Based on the measurement system in Figure 22, the resulting data was obtained, as illustrated in Table 2. The maximum error for the left ceramic sphere’s measured diameter is 0.039 mm, whereas it is 0.048 mm for the right sphere. Additionally, the center distance of the ceramic sphere base has a maximum error of 0.02 mm. This satisfies the criteria for a 0.06 mm maximum error in measuring Hall thrusters, thus signifying that the system is capable of measuring thruster erosion.
Ball set spherical distance measurement.
Experimental artifacts
Because it is impracticable to open the vacuum chamber during the lifetime test of the Hall thruster to collect actual data, this paper proposes a validation method through simulation experiments. Three workpieces, with structures resembling that of the Hall thruster, were designed and machined for this purpose. The results of these experiments are demonstrated in Figure 23 and serve to confirm the efficacy of the methods outlined in this paper. From left to right, the workpieces are identified as (a), (b), and (c) respectively. Workpiece (a) was machined with no chamfer on the inner and outer circles, representing the initial state of the Hall thruster. Workpiece (b), with chamfers on the inner and outer circles, represents the first intermediate erosion state of the thruster. Lastly, workpiece (c), which has larger chamfers on the inner and outer circles, represents the second intermediate erosion state of the thruster.
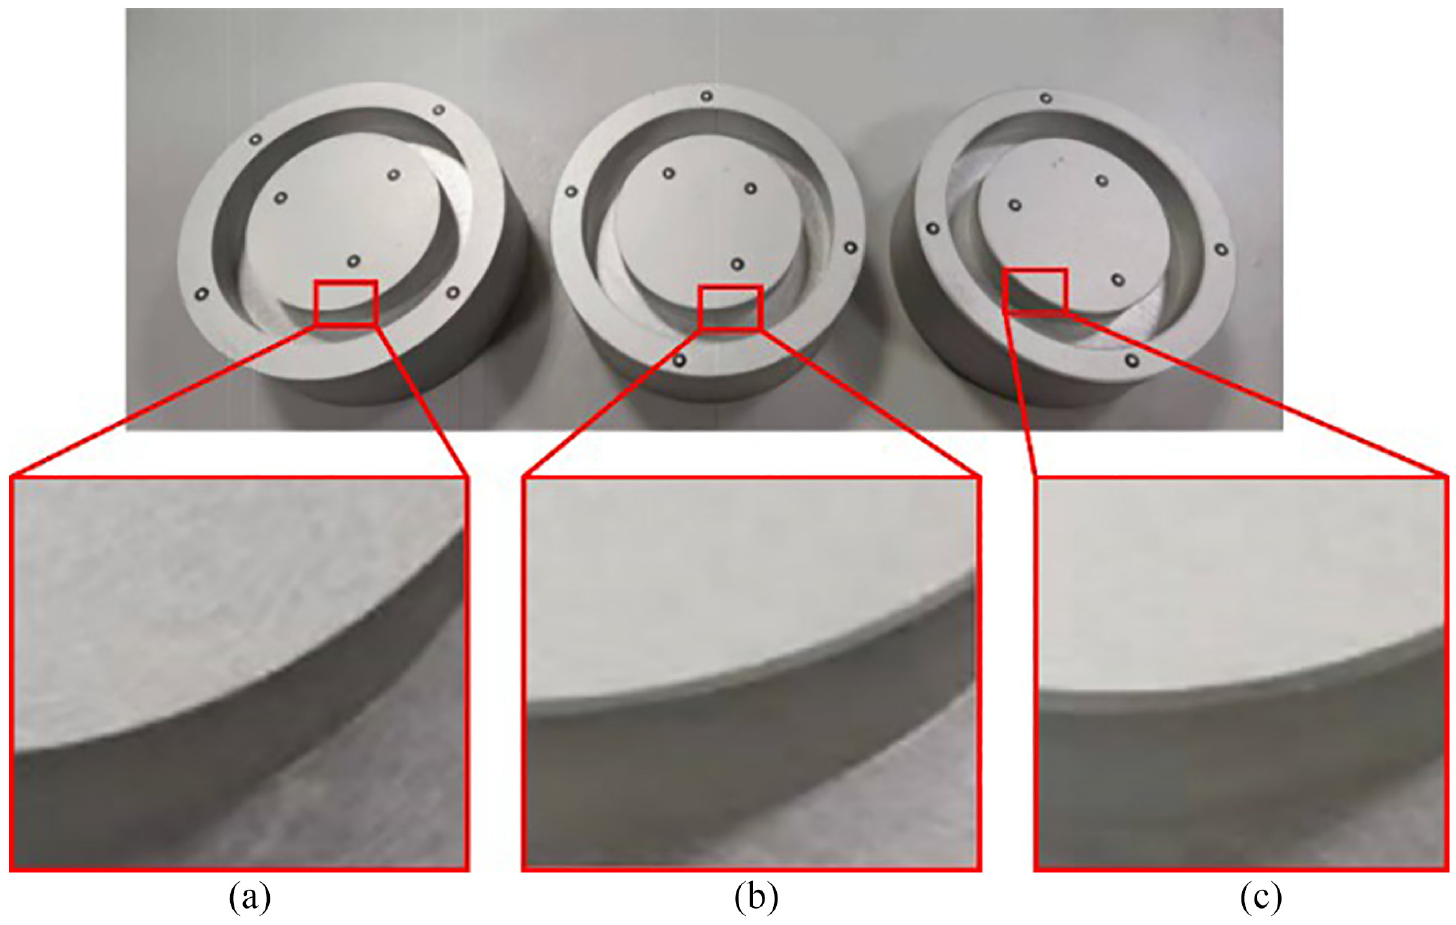
Experimental artifacts: (a) represents the initial state of the Hall thruster, (b) represents the first intermediate erosion state of the thruster, and (c) represents the second intermediate erosion state of the thruster.
Corrosion measurement
Using workpiece (b) as an example for erosion width measurement, Figure 24 depicts a schematic diagram of the measurement process. To obtain the point cloud of the workpiece body, preprocessing operations such as point cloud denoising and filtering are conducted. Additionally, triangulation is performed to retrieve the spatial triangle mesh data of the workpiece. Finally, the point cloud dataset undergoes lateral splitting to acquire the lateral cross-section dataset. The erosion width of the workpiece is ultimately calculated by utilizing clustering analysis and density extraction to preserve the information of both the inner and outer side walls of the discharge chamber channel for circle fitting.
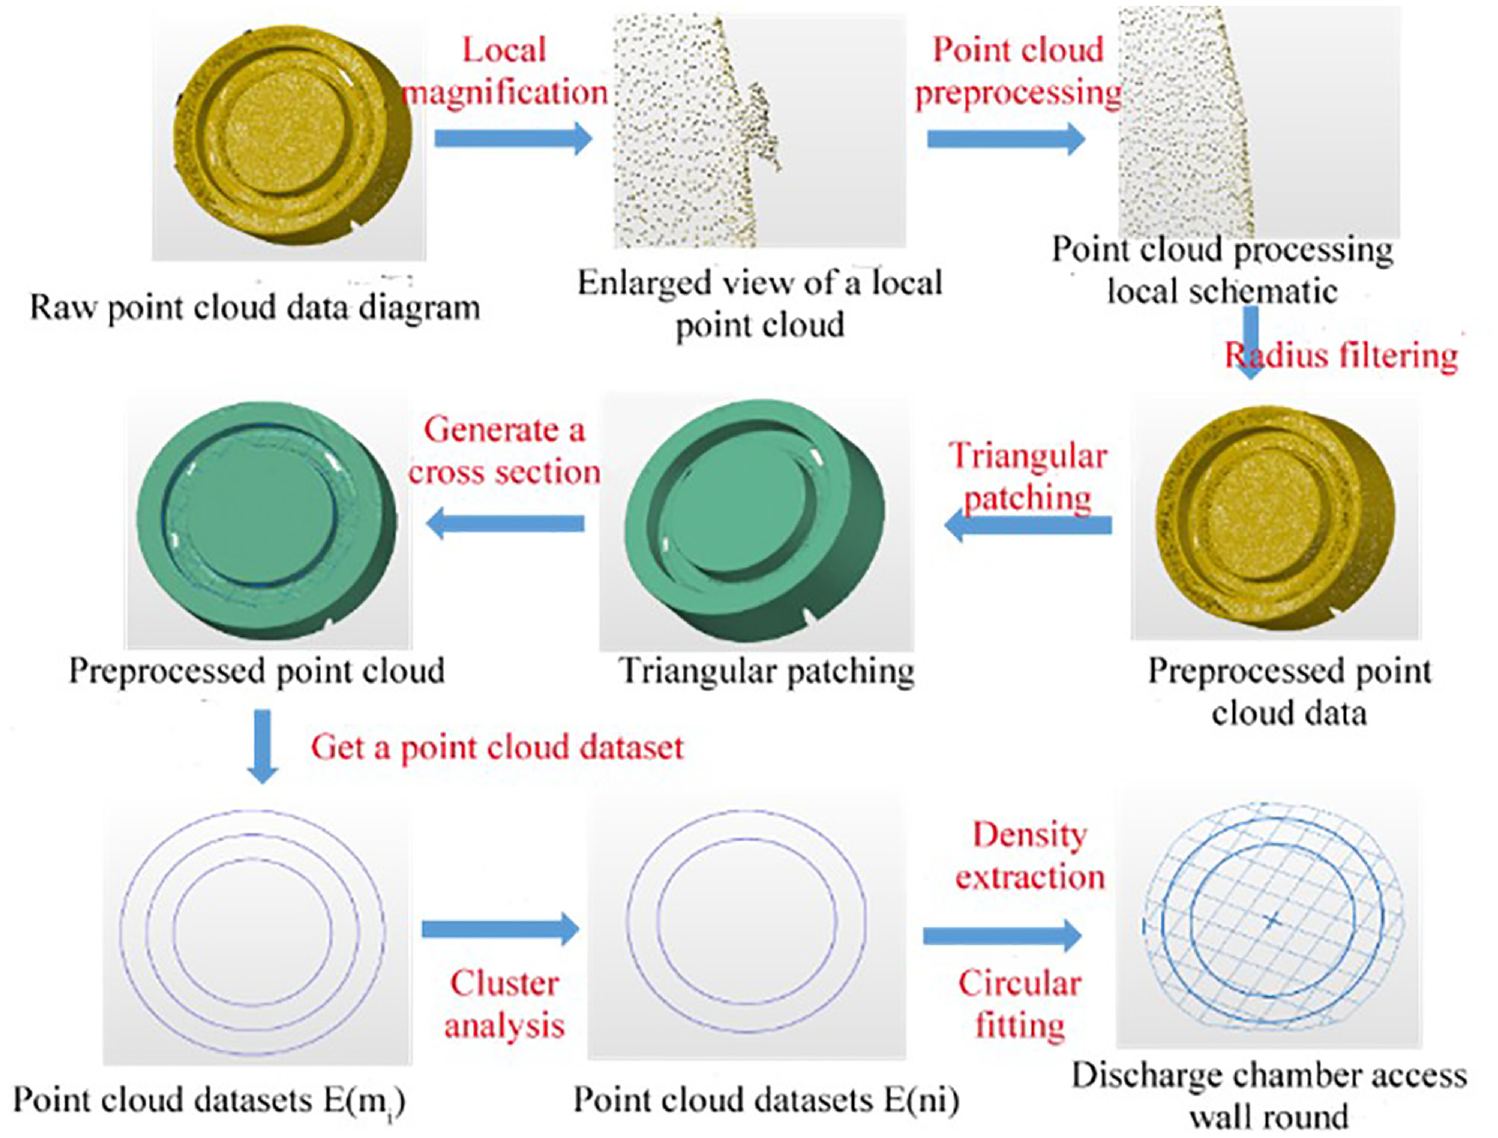
Erosion width treatment process diagram.
Since the distance between the inner and outer walls remains consistent from top to bottom in the design of the workpiece, the corrosion angle of the same workpiece remains constant. As such, to obtain the necessary key data values for analysis, only a single cross-sectional and longitudinal segmentation can be performed on the same workpiece. The process for measuring corrosion angles is illustrated in Figure 25.
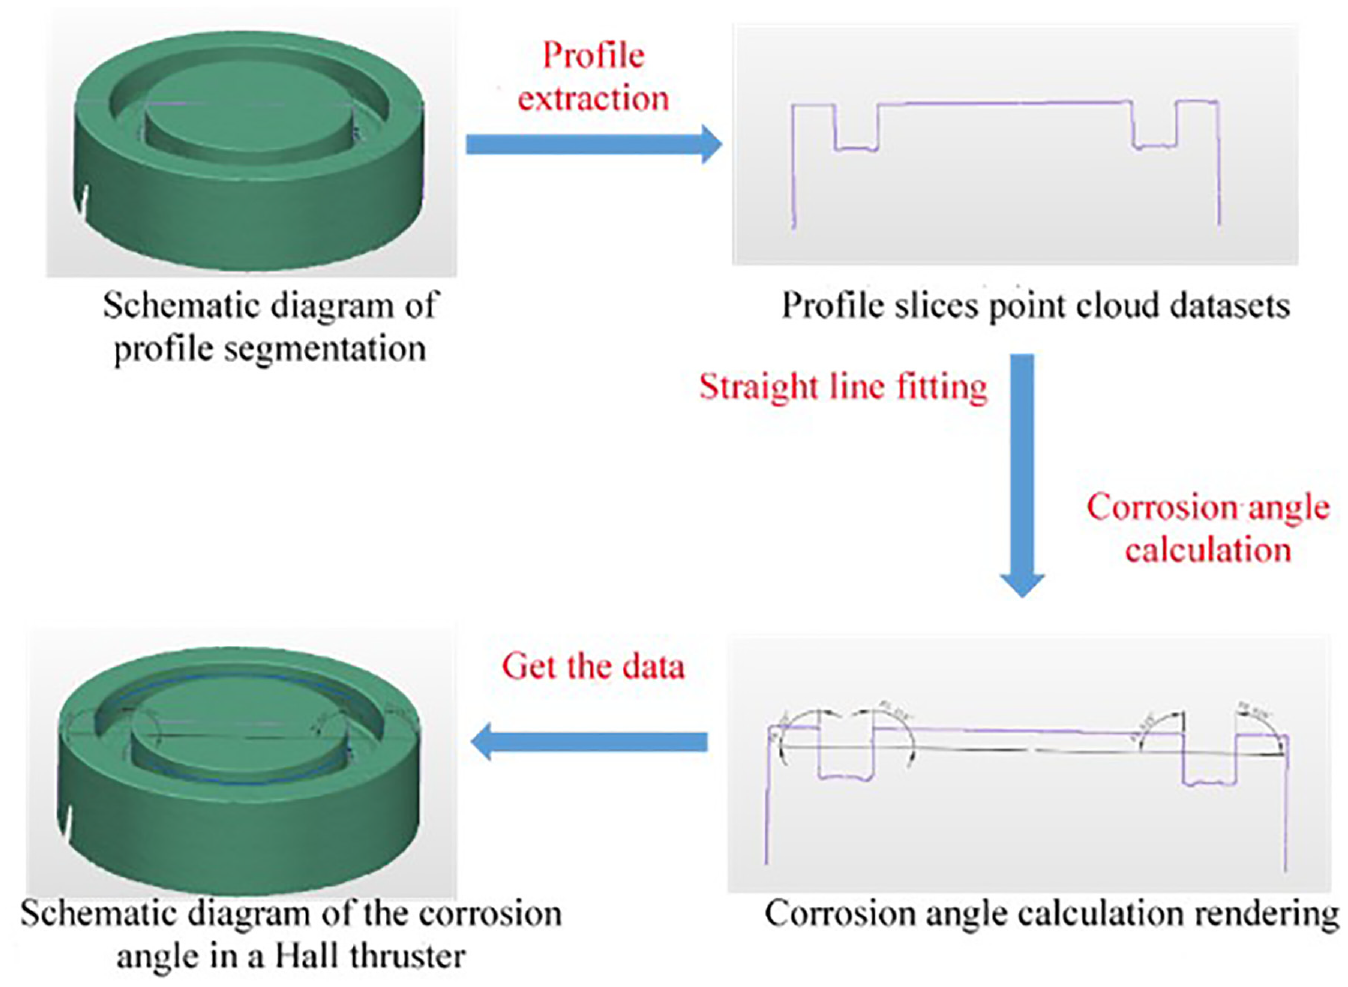
Corrosion angle treatment process diagram.
The data obtained from the measurement of three distinct workpieces is presented in Table 3. The corrosion width is in millimeters, and the corrosion angle is in degrees. The data is rounded off to two significant figures.
Three different sets of workpiece corrosion data sheets.
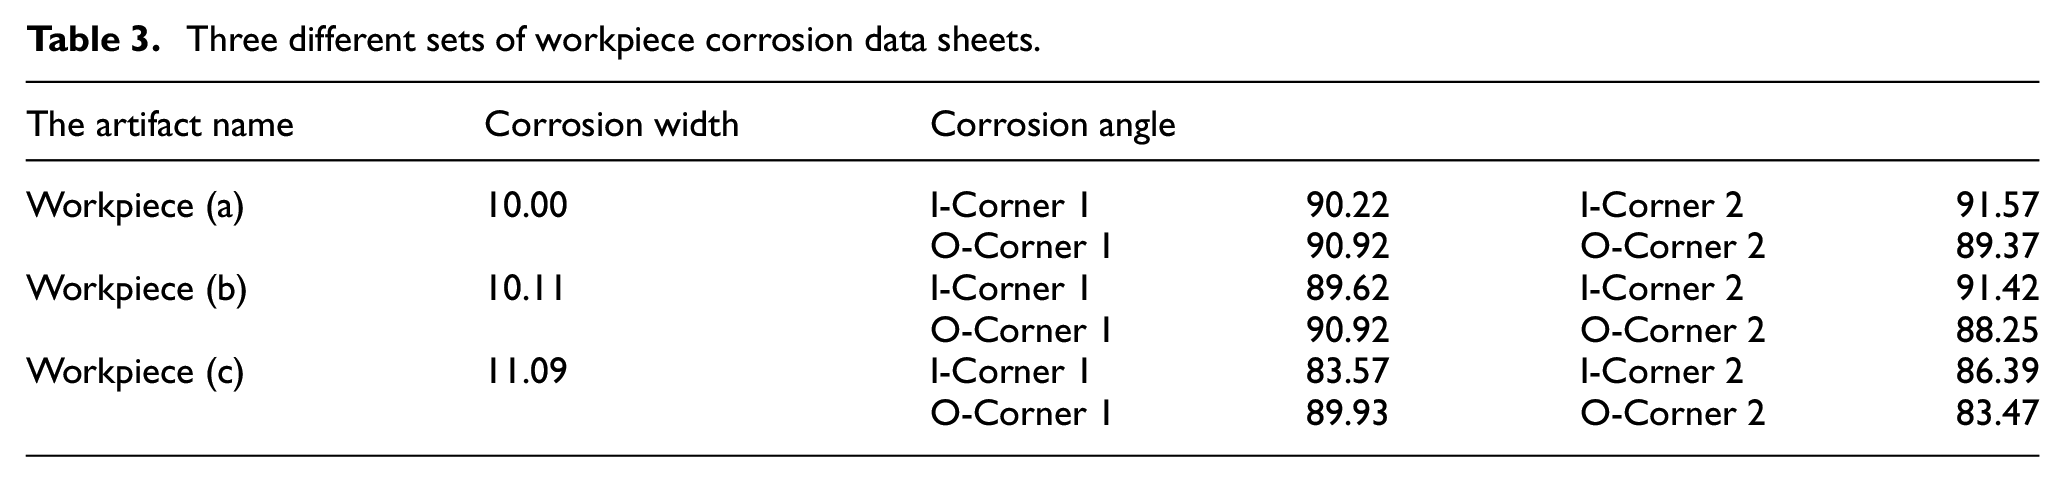
From Table 3, it is evident that workpiece (a) portrays the initial state of the Hall Thruster, where the discharge chamber channel has the narrowest width. Additionally, both inner and outer rounds of the workpiece are machined without chamfering. The corrosion angle is approximately a right angle. The workpiece (b) represents intermediate corrosion condition 1 of the Hall thruster. The channel of the discharge chamber has widened from its initial state and the corrosion angle has decreased, suggesting some degree of corrosion. The workpiece (c) shows an intermediate corrosion state 2 of the Hall thruster. The outlet channel width significantly increased from the initial value, while the corrosion angle reduced compared to the initial value and intermediate state 1, implying corrosion occurred. The chamfer angle at the outlet widened. This aligns with the experimental design and leads to the conclusion that the Hall thruster corrosion measurement technique is proficient in detecting changes in corrosion width and angle.
Conclusion
The proposed measurement method’s measurement system boasts a compact design and allows fully automated detection during vacuum experiments without requiring the vacuum chamber to be opened. This improvement enhances the dependability of the corrosion width and angle data acquired during experiments. Three different workpiece states were designed and processed to simulate data in various corrosion states of the Hall Thruster. The algorithms tested in this chapter feature a robust and noise-resistant surface that precisely extracts contour feature information. They also enable accurate measurement of the Hall Thruster’s corrosion width and angle. Based on Table 2, the Spherical center distance has an actual maximum error of 0.02 mm, which meets the accuracy requirement for Hall thruster measurement of less than 0.06 mm. The error was determined by subtracting the Spherical center distance standard value from the Spherical distance measurement.
In this paper, we propose a methodology for corrosion measurement in Hall thrusters utilizing structured light. Our research concludes that the structured light-based approach is a reliable and accurate method for measuring corrosion. We constructed a test platform and conducted accuracy verification tests.
Creating a 3D model of the Hall thruster through structured light scanning and implementing automated detection of Hall thruster erosion data proves to be effective. The calibration sphere bar detects a maximum error of 0.06 mm.
The binocular structured-light-based method for measuring erosion in the Hall thruster is feasible. The erosion width and angle of the thruster can be determined by obtaining data through lateral and longitudinal cross-section splitting.
Footnotes
Appendix
Declaration of conflicting interests
The author(s) declared no potential conflicts of interest with respect to the research, authorship, and/or publication of this article.
Funding
The author(s) disclosed receipt of the following financial support for the research, authorship, and/or publication of this article: This work is partly supported by the Shanghai Collaborative Innovation Center of Intelligent Manufacturing Robot Technology for Large Components.