
Abstract
Performance of gear transmissions affects the performance of mechanical equipment. It is necessary to develop more reliable gear pitch and tooth thickness accuracy detection methods in order to evaluate gear transmission performance and detect gear pitch and tooth thickness accuracy more accurately. Based on the basic theory of gears, binocular vision technology, and statistical principles, a new method that measures gear pitch and tooth thickness using machine vision is proposed: coaxial multi-ring detection (MCD). There is no contact, no damage, and a high degree of efficiency with this method. Using this method, we are able to detect the pitch and thickness accuracy of each gear tooth multiple times within the tooth width range and in multiple directions perpendicular to the gear axis. We statistically analyze the measurement results to determine the gear’s most accurate detection results. The measurement method for gear machining accuracy is investigated using the coaxial multi-ring detection method. The statistical analysis of multiple measurement results is carried out, and the measurement results obtained are highly consistent with those of the gear detection center. In conclusion, the measurement results of this method are highly reliable, and they can be used as a reliable basis for evaluating gear transmission performance.
Keywords
Introduction
It is widely acknowledged that gears play a very critical role in modern mechanical equipment. The transmission performance and service life of gears have a very significant impact on the reliability of mechanical equipment. Evaluation of gear transmission performance is based on deviations of the tooth pitch and tooth thickness. As a result, it is extremely important to measure gear pitch error and tooth thickness error accurately.
While the measurement accuracy of existing gear product pitch deviation and tooth thickness deviation measurement methods is high, it is easy to cause scratches and damage on the surface of the gear product being tested, which affects the quality of the gear product. Moreover, the detection speed is too slow to meet the requirements for real-time online detection. In most existing gear pitch deviation and tooth thickness deviation measurement methods, pitch deviation and tooth thickness deviation are measured in a two-dimensional plane perpendicular to the gear axis. In this way, only one position can be measured per gear tooth, which results in great uncertainty and large errors, and the measurement results cannot accurately represent tooth pitch and tooth thickness deviations.
A significant amount of research has been conducted on the measurement of gear pitch error and tooth thickness error, which is a topic of great research value, and many scholars at home and abroad have contributed to the field. As far as gear measurement technologies are concerned, gear measurement centres and CMMs are used most frequently to measure gear pitch deviations and tooth thickness deviations through contact. A study was conducted by Liu et al. 1 and Lin et al. 2 to improve the measurement accuracy of the gear measurement center for pitch deviation measurement. Using the method for compensating the alignment angle error in the measurement result of the tooth pitch deviation, Liu 1 uses the coordinate data recorded by the gear measurement center to achieve high-quality pitch deviation measurements for Lin et al. 2 Using either method improves the accuracy of the gear measurement center’s measurements. By developing their own gear measuring machine, Kurokawa et al. 3 achieved a measurement speed of 7 mm/s that effectively improved gear pitch deviation measurement efficiency. Ma et al. 4 developed a new ultra-precision gear pitching instrument that, when combined with computer-aided technology, can measure pitch deviations of ultra-precision gears with grade 1 or grade 2 precision. Based on differential rolling scanning measurement technology, Xie et al. 5 proposed a gear comprehensive error measuring machine able to detect processing quality of small stiffness gears in the range of 0.02–0.2 mm. The geometric parameter error of curved gears cannot be directly detected due to their complexity. Lin et al. 6 proposed a method to measure the artifact of curved gear pairs using the computer numerical control gear measurement center, comparing the measurements with theoretical data.
Similarly, CMMs are commonly used to measure gear pitch deviations and tooth thickness deviations. In developing a gage block gear, Kondo et al. 7 realized the traceability of tooth thickness deviation measurement by CMM. Through multi-step closing technology and multi-measurement technology for measuring tooth pitch, Lou 8 and Sato et al. 9 improved the measurement accuracy of the CMM. By calculating the pitch measurement results at two adjacent positions on the pitch measuring instrument, Lou et al. 10 eliminated the systematic error in measuring pitch deviation. The method is simpler in the measurement process and easier to operate compared to the closed-loop measurement technology.
To solve the problems of insufficient measurement accuracy and traditional measurement methods, such as small samples and inadequate arrangement of measurement points, Xu et al., 11 Wang, 12 Ling 13 were studied. Xu et al. 11 measured the pitch deviation of involute spur gears using rotary profiling. In order to measure the entire tooth profile of a gear, the system uses an air bearing displacement sensor and a diamond contact as a measuring probe. Comparison of the obtained pitch deviation with the reference data indicates that the difference between measurements based on this method and the reference data set is less than1 μm. The tooth profile deviation curve was used by Wang et al. 12 to define and calculate the new index of tooth pitch evaluation, which overcomes the traditional method of evaluating tooth pitch using small samples and extreme values. Ling et al. 13 studied the impact of the probe diameter and the position parameters of the measuring point on the measurement of the cumulative deviation of the gear pitch of ultra-precision gears. Theoretical analysis and experimental research were conducted in order to realize the measurement of the tooth pitch deviation. In this research, the position of the measuring point cannot be arranged on special occasions for measuring the ultra-precision pitch on the index circle of the measured gear. It is increasingly difficult to meet the needs of precision measurement of batch gears in modern industry because contact measurement has slow measurement speed and the measured gear is prone to scratches, damages and other problems that affect the quality of gear products.
Research in future inspection technology will focus on how to enhance the quality inspection of modern gear products by using non-contact measurement technology based on machine vision due to the rapid development of machine vision technology in recent years. According to Auerswald et al., 14 a laser line triangulation sensor can detect the tooth profile on both convex and concave surfaces of gears simultaneously. Sun et al. 15 developed an algorithm based on visual measurement to solve the problem of tooth profile image edge distortion caused by contamination of the tooth profile surface during visual measurement of gears, resulting in tooth profile deviation and pitch deviation accuracy. By combining machine vision measurement technology and global least squares fitting algorithm, Zuo et al. 16 proposed a method of determining the gear center by solving the problem of low stiffness of small-sized gears. As a first step, the method calculates the addendum circle, root circle, and gear center of the gear image; following that, the gear tooth profile is calculated using the Canny algorithm; finally, the data points on each tooth profile surface are calculated; and measurement is performed. Ge et al. 17 used machine vision technology to measure gear pitch and tooth thickness error, but they did not measure each tooth multiple times, resulting in an unreliable measurement. Shen et al. 18 used echo polarization information to obtain a good imaging effect, paving the way for precise measurements to be made. Doppler measurements of asteroids’ orbits were performed by Alexander et al.,19,20 satellite telemetry signals were measured, and two methods for determining planetary orbits were proposed. With the above research results, precision measurement methods have been expanded and the field of precision measurement has greatly developed. In the future, gears will be measured with precision through signals.
Based on the basic theory of gears, binocular vision technology, computer graphics, error theory, and statistical principles, a new non-contact measurement method based on machine vision cylindrical gear pitch deviation and tooth thickness deviation is proposed.
Measurement principle
In this method, n planes are established at equal intervals in the gear’s axial range. According to the gear’s detection accuracy requirements, the number of planes is determined. For each plane, using the intersection of the gear axis and the plane as the center, and the gear indexing circle radius as the radius, establish n detection circles along the gear axis. The number of detected circles equals the number of detected planes. The intersection points of each detection circle and the tooth surfaces on both sides of each gear tooth must be determined, and the center of each detection circle must be connected to each intersection point. In Figure 1, we can see the measurement process used for this method.
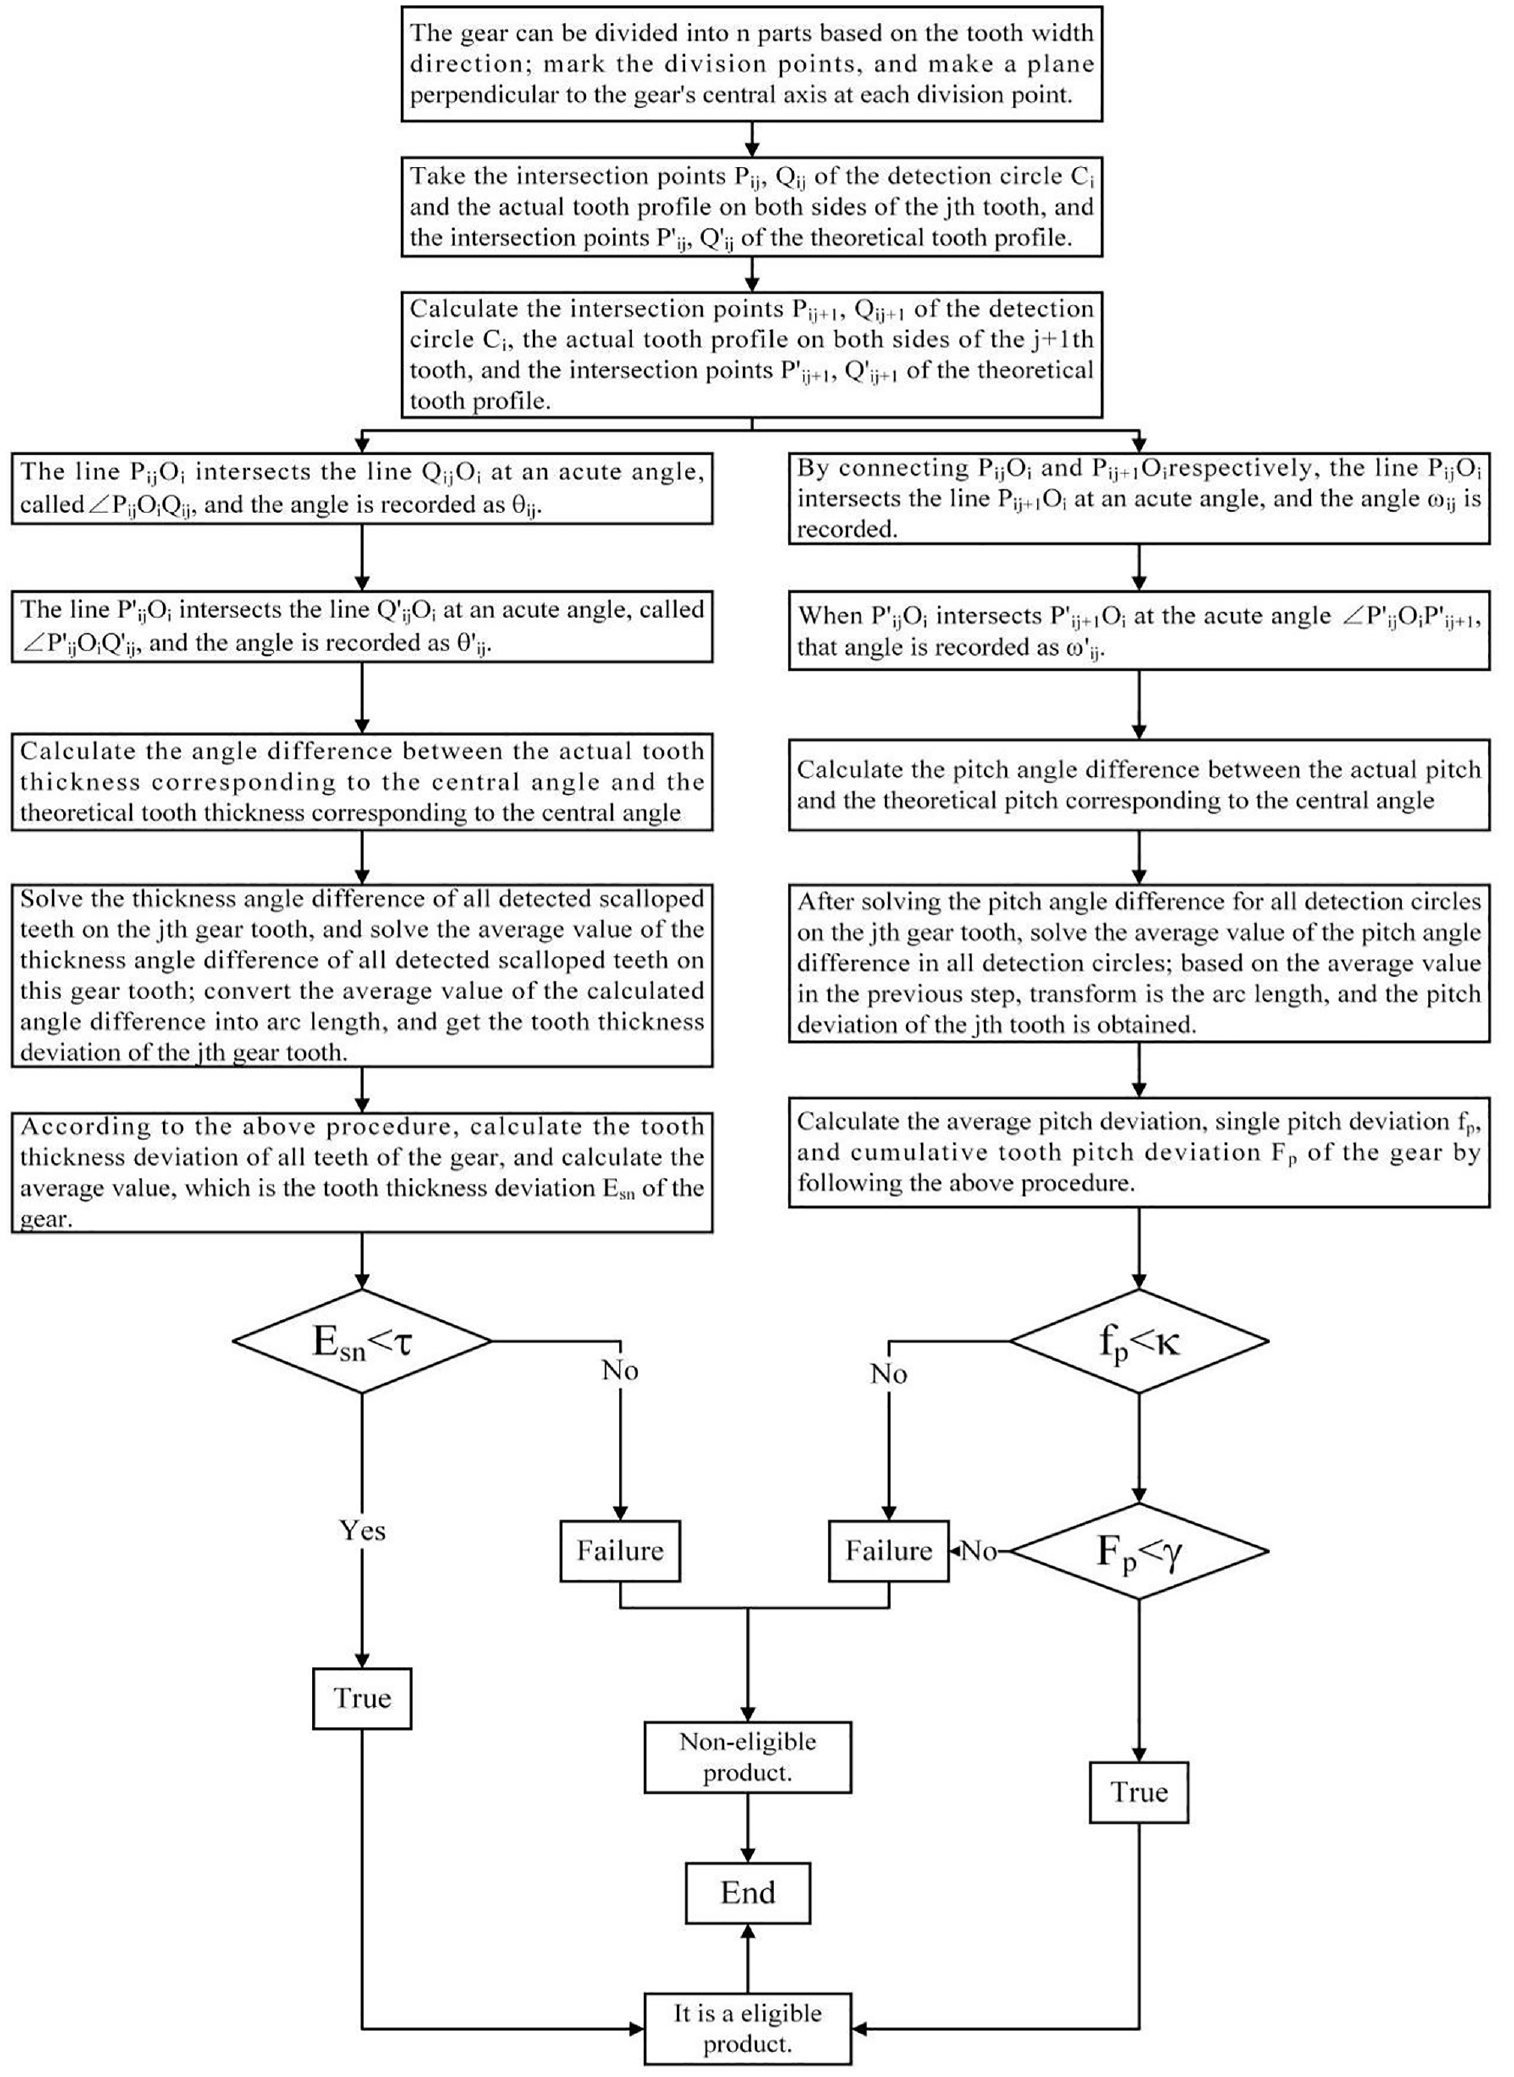
Gear coaxial multi-ring detection flow chart.
Step 1: Creating a split plane
(1) Mark the point where the gear is divided into n equal parts according to the direction of tooth width;
(2) Establish a plane perpendicular to the gear axis at each split point, for a total of n planes. The number of planes will be determined based on precision detection requirements. For this study, five planes are used, namely plane A, plane B, plane C, plane D, and plane E.
Step 2: Set up a detection circle
In each plane, use the indexing circle radius as the radius and the intersection of the gear axis and the plane as the center to define the detection circle. Hence, we have circle a, circle b, circle c, circle d, and circle e.
Step 3: Determine the intersection of the detection circle and both tooth flanks on each gear tooth
(1) Calculate the intersection point of the actual left tooth surface of the detected index circle Ci
(2) The intersection point
(3) It contains the intersection point
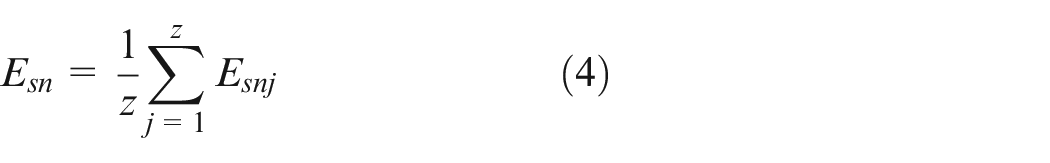
Step 4: Detection of tooth thickness deviationsusing Esn
The acute angle is formed when the actual surface of the tooth on both sides of the same tooth meets the detection circle and the line connecting the center of the circle. An acute angle is formed also by the intersection of the theoretical tooth surface on both sides of the gear tooth and the detection circle and the line connecting the center of the circle. An arc length corresponding to the difference between these two acute angles is called the tooth thickness deviation. Find the tooth thickness deviation for each detection circle, then find the average deviation for all detection circles. This is the tooth thickness deviation. Utilizing the above method, calculate the average of all gear tooth thickness deviations; for this gear, this is the tooth thickness deviation.
In Figure 2, connect
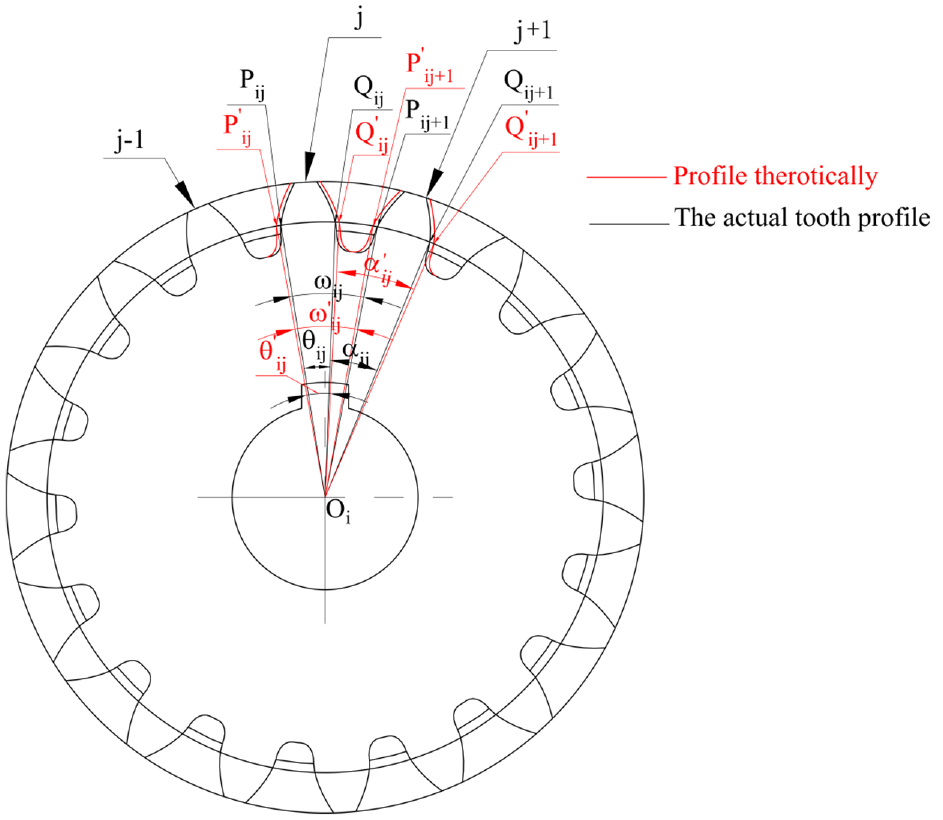
A schematic diagram of a coaxial multi-ring detection gear and its pitch deviation and tooth thickness deviation.
The angle between the actual tooth thickness of the j-th tooth at the i-th detection circle and the theoretical tooth thickness:

where:
At the i-th detection circle,
Averaging the angle difference between the actual tooth thickness and the theoretical tooth thickness at all detection circles is the best way to ensure accurate tooth thickness deviation measurements.
At all detection circles for tooth j, the angle difference between the actual and theoretical tooth thickness is averaged:
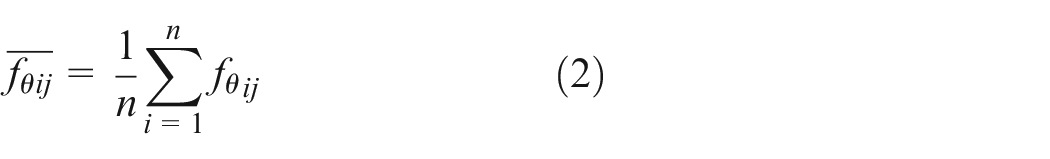
where
Deviation of the j-th tooth’s thickness,
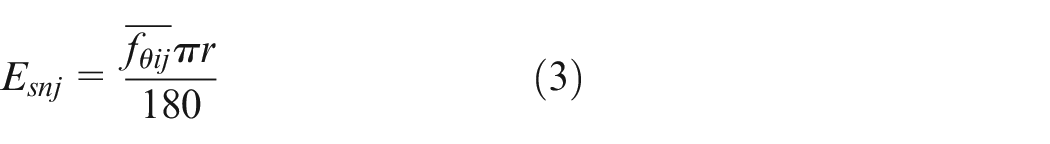
Where the r is the detection circle radius. It is equal to the gear indexing circle radius.
Because of the complexity of the tooth surface and the uncertainties in measuring the tooth thickness error of the gear, the average tooth thickness deviation of all its teeth is used to describe the tooth thickness deviation.
The teeth thickness deviation for this gear is Esn,
Detection of pitch deviation
An acute angle is formed between the actual tooth surface on the same side of two adjacent gear teeth and the detection circle and the line connecting its center. On the same side of the two gear teeth, the intersection between the theoretical tooth surface and the detection circle, and the acute angle are created by the line connecting the center of the detection circle. The pitch deviation corresponds to the angle difference between these two acute angles. Calculate the pitch deviation of all detection circles by using this method. Find the average pitch thickness deviation of the tooth on all detection circles. As a result, use this average as a measure of gear pitch deviation. By using the above method, one can determine the pitch deviation of all the teeth in this gear. It is possible to calculate the average pitch deviation, individual pitch deviation, and cumulative pitch deviation of all gear teeth using this method.
Connect point
Connect point
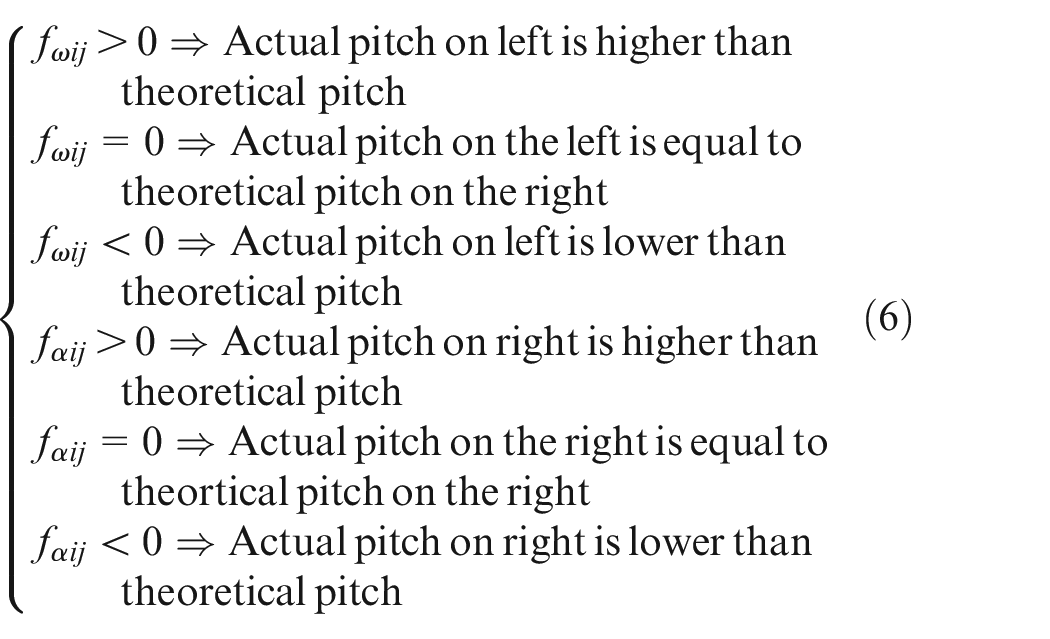
The angle difference associated with the j-th tooth pitch on the i-th detection circle is,
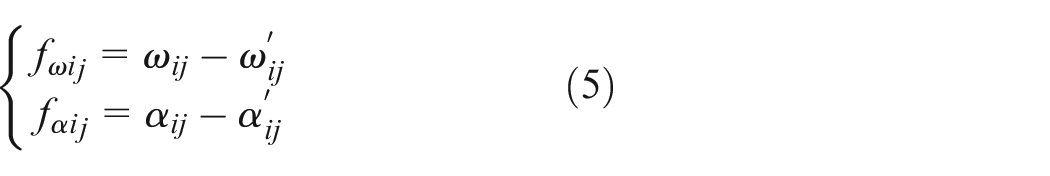
Where at the ith detection circle,
Measurement of pitch deviation takes into account the contingency. In order to ensure the accuracy of the measurement result of the tooth pitch deviation, the angle difference between the actual and theoretical tooth pitch is averaged for the j-th tooth at all detection circles.
The average angle difference between the actual tooth pitch and the theoretical tooth pitch on the j-th detection circle,

where the average value for
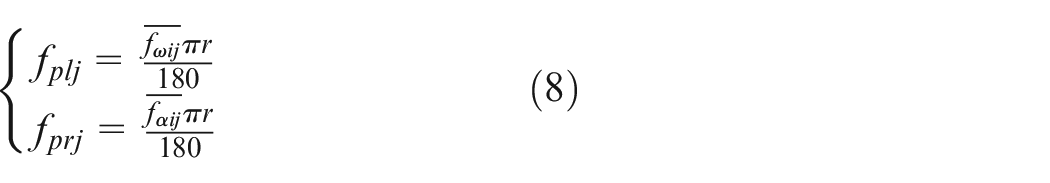
Pitch deviation of the j-th tooth is,
Average pitch deviation,
Deviations in pitch by individual,
Deviation in pitch cumulatively,
In this manner, gear pitch deviation and tooth thickness deviation are measured with greater accuracy, enabling precise evaluation of gear transmission performance.
Experiment
Measurement device
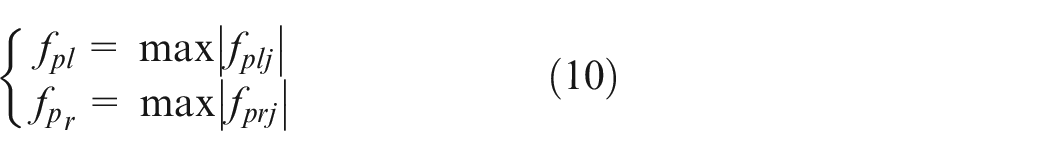
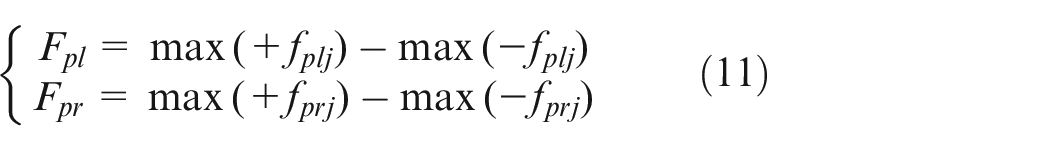
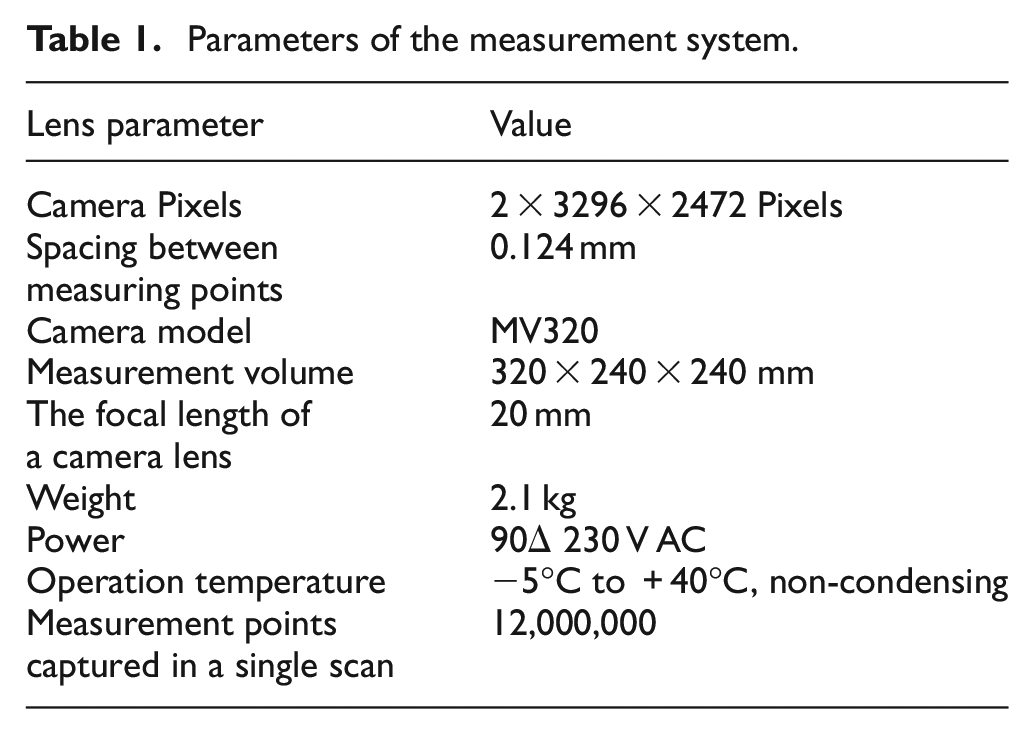
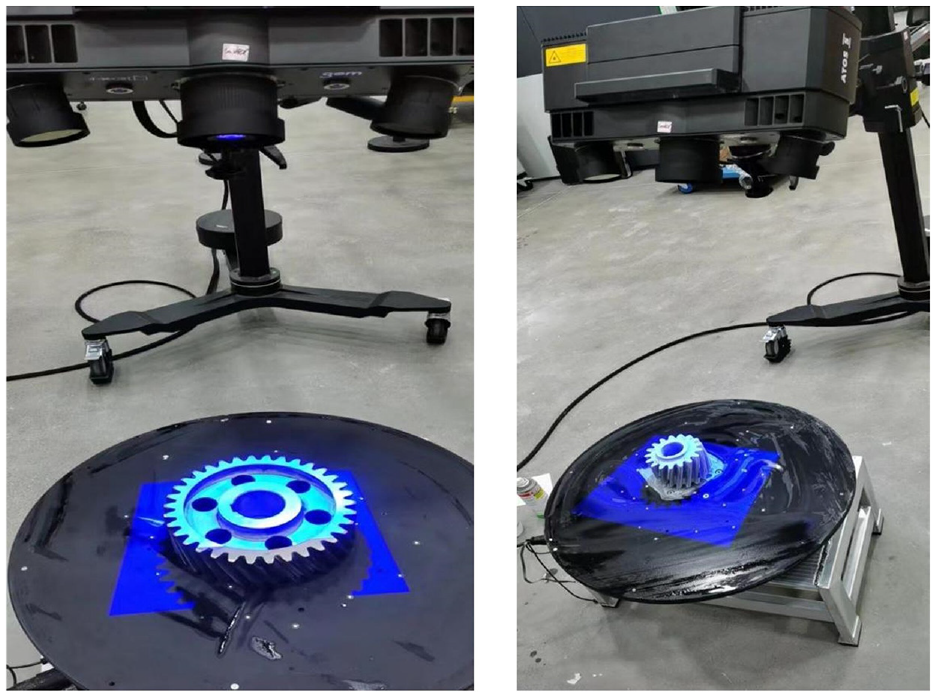
The equipment used in this experiment is the ATOS 5 optical 3D measurement system of GOM, a Carl Zeiss subsidiary. ATOS 5 is a 3D optical measurement system that combines structured light with binocular vision in order to provide accurate and quick 3D measurement data. The measurement equipment is shown in Figure 3, and parameters are shown in Table 1.

Measurement system.
Parameters of the measurement system.
Test gear
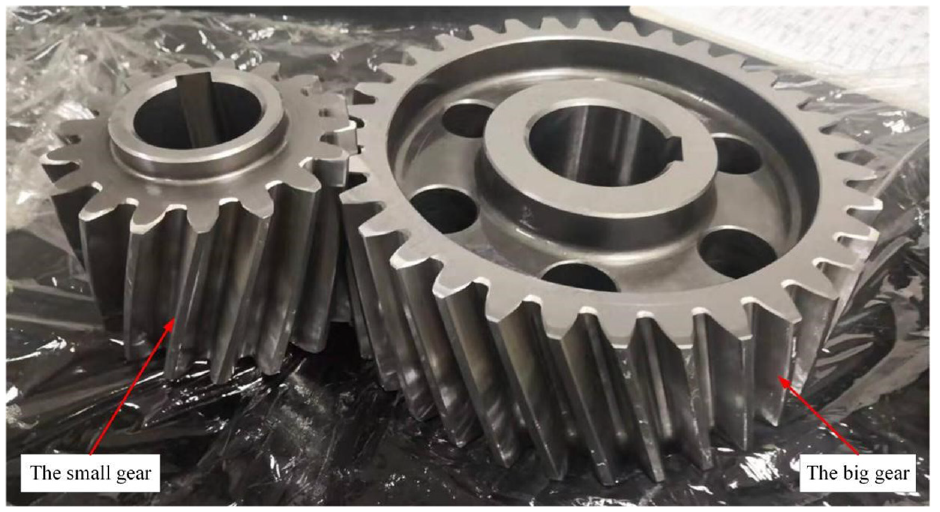
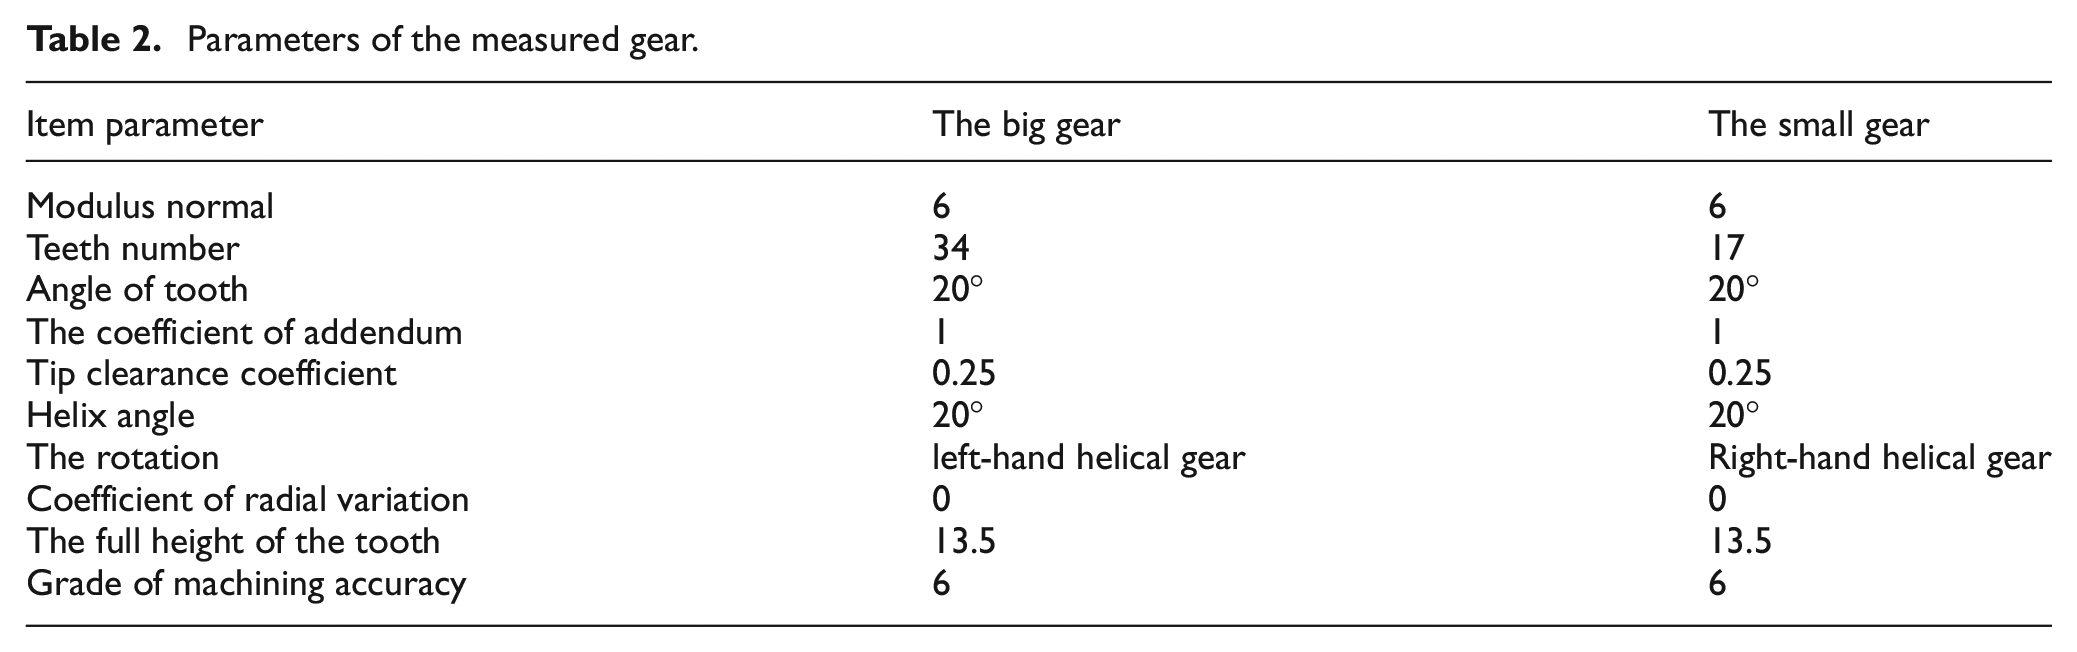
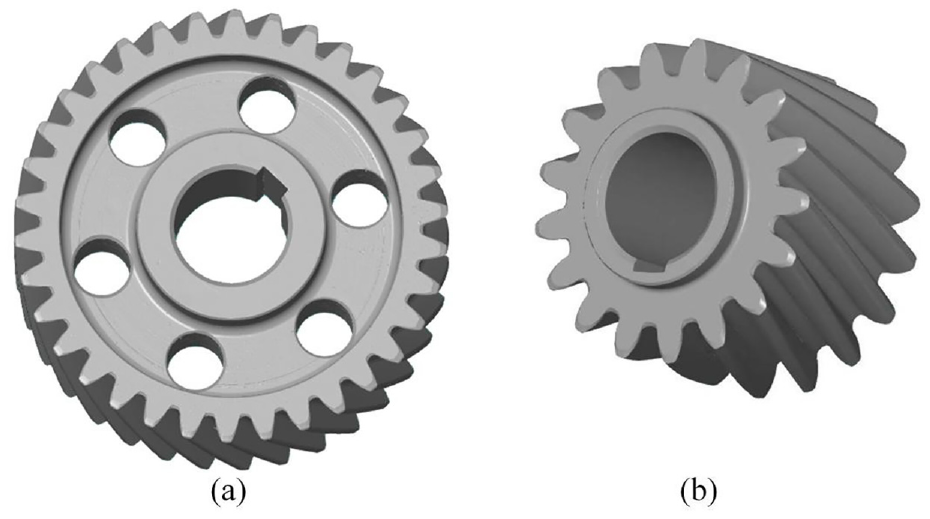
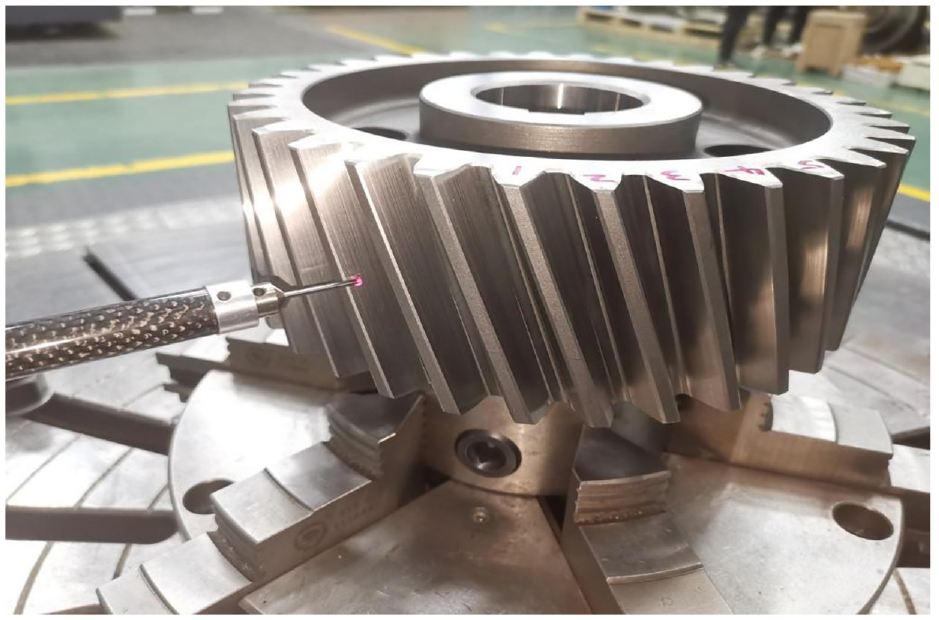
The research object is a pair of cylindrical helical gears with a normal modulus of 6. A photo of the gear to be tested is shown in Figure 4, and a table showing the gear’s parameters is shown in Table 2.
Object for measurement.
Parameters of the measured gear.
Preparation for the test
(1) Pre-calibrate the optical measurement system before measurement to improve accuracy.
(2) Make sure the gear surface is clean before testing with an ultrasonic gear cleaner.
(3) Make sure the marker points are pasted randomly on the gear surface to improve the accuracy of stitching the gear point cloud.
(4) As the gear itself is a highly reflective component, it is important to apply a thin layer of imaging agent on its surface so that the reflection of the gear does not interfere with the optical measurement and to ensure the acquisition of high-precision gear point clouds. In order to achieve gear measurement accuracy, the titanium powder developer that has the least effect on optical measurements is selected, and the size will increase by 1–2 μm once it has been sprayed. 21 Due to the large overall gear size, the gear size has a negligible impact due to the developer.
(5) Data acquisition for 3D models of gears using binocular vision and high-precision optical measurement. Figure 5 shows the measurement process.
Measurement process.
Taking point clouds and stitching them, preprocessing them
(1) Since it is impossible to collect the full 3D point cloud data of the gear at once, multiple collections are necessary for the partial partitioning of the gear.
(2) Perform high-precision data collection on the gear segment of the partition one by one.
(3) Obtain the point cloud data of the gear, based on the identification of the same artificial public mark points, and splice the point cloud data to get the complete 3D point cloud data of the gear. 22
(4) Smooth and denoise the complete spliced gear 3D point cloud data, removing discrete data points. Create more accurate and smoother gear point cloud data as shown in Figure 6, laying the foundation for the next step of precision gear measurement.
Gear point cloud data model.
Measuring gears
First, import the theoretical gear design model and the point cloud data model obtained through scanning into the measurement software. The theoretical design model and the point cloud data model should have calibration points of the same color at the same location. Identifying the calibration points of the same color at the same location on the theoretical design model of the gear and the point cloud data model enables the theoretical design model of the gear to be aligned and registered for the next step.
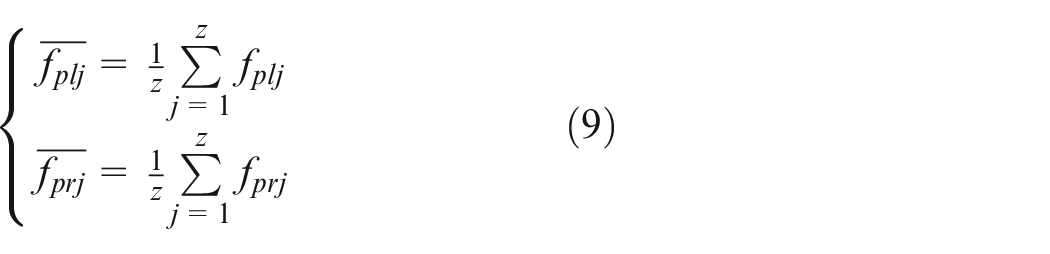
To obtain Figures 7 and 8, establish five planes at equal intervals along the gear axis, and set up a detection circle on the established plane according to Section 2.2. According to Section 2.3, determine the intersection points of each detection circle and the surfaces of the teeth on each side. In addition, the intersections of the gear teeth and the detection circle are respectively connected to the center of the detection circle. 23 Gear tooth thickness deviation is measured according to Section 2.4. To measure the left and right pitch deviations of the gear, refer to Section 2.5. One can use equation (10) to determine the single pitch deviation of a gear by applying them together. The equivalent equation (11) reveal the cumulative gear pitch deviation.
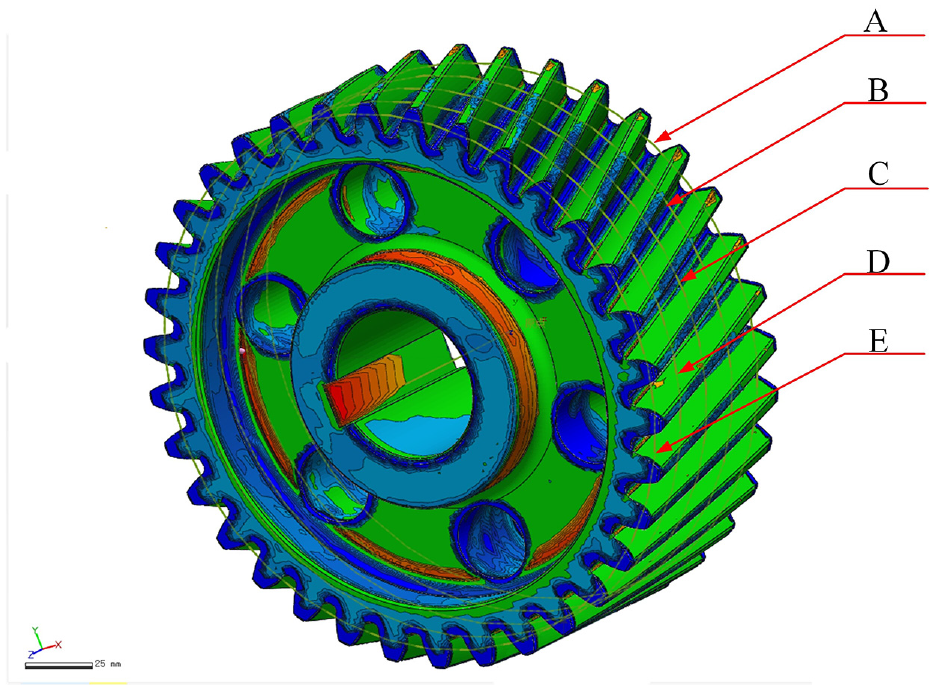
Design of the plane and detection circle for the multi-ring coaxial detection method.
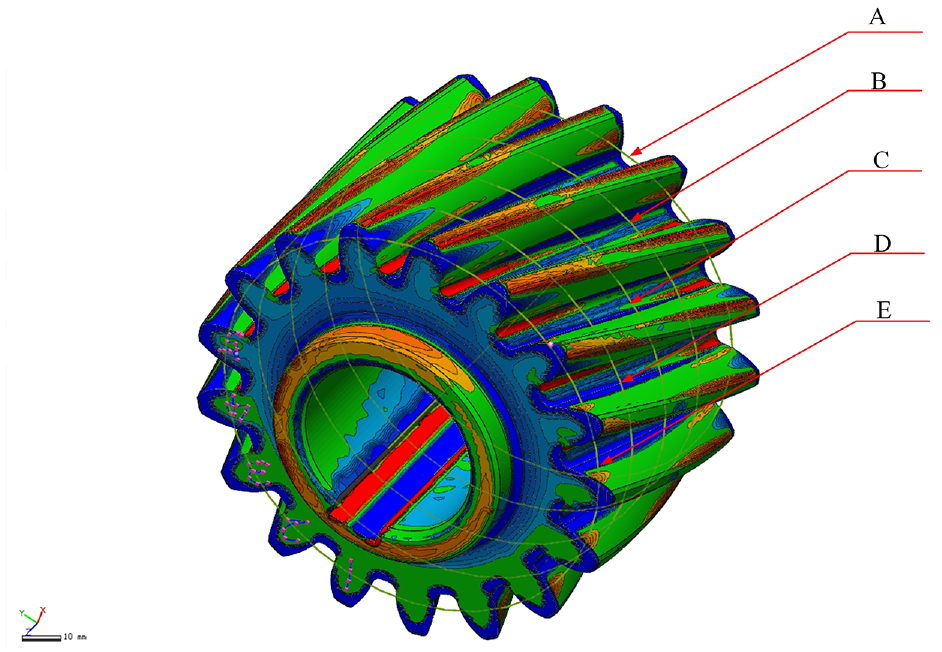
Design of the plane and detection circle for the multi-ring coaxial detection method.
Results and analysis
Measurement of tooth thickness deviations
Gear backlash is affected by tooth thickness deviation. The function of the gear backlash is to ensure that the normal meshing of the gear is maintained, as well as storing lubricating oil, which is closely related to the gear’s service life. 24 Tooth thickness deviation is the major factor affecting gear service life. Thus, it is necessary to measure this deviation.
According to Sections 2.1 and 2.2, the detection plane and detection circle are defined at equal intervals on each gear tooth. Measure each tooth thickness deviation on this gear as described in section 2.4. Based on statistical principles, analyze the tooth thickness deviations of each tooth of the gear at all detection circles, and obtain Figures 9 and 11. To get a more objective and accurate tooth thickness deviation, compute the average value of each detection circle on all teeth of the gear, as shown in Figures 10 and 12.
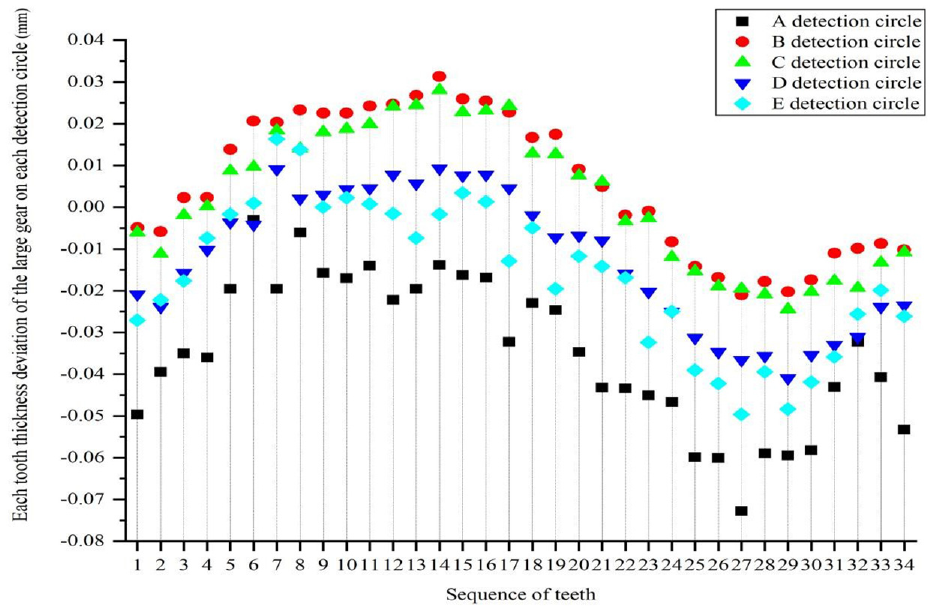
On each detection circle, the tooth thickness deviation of the large gear.
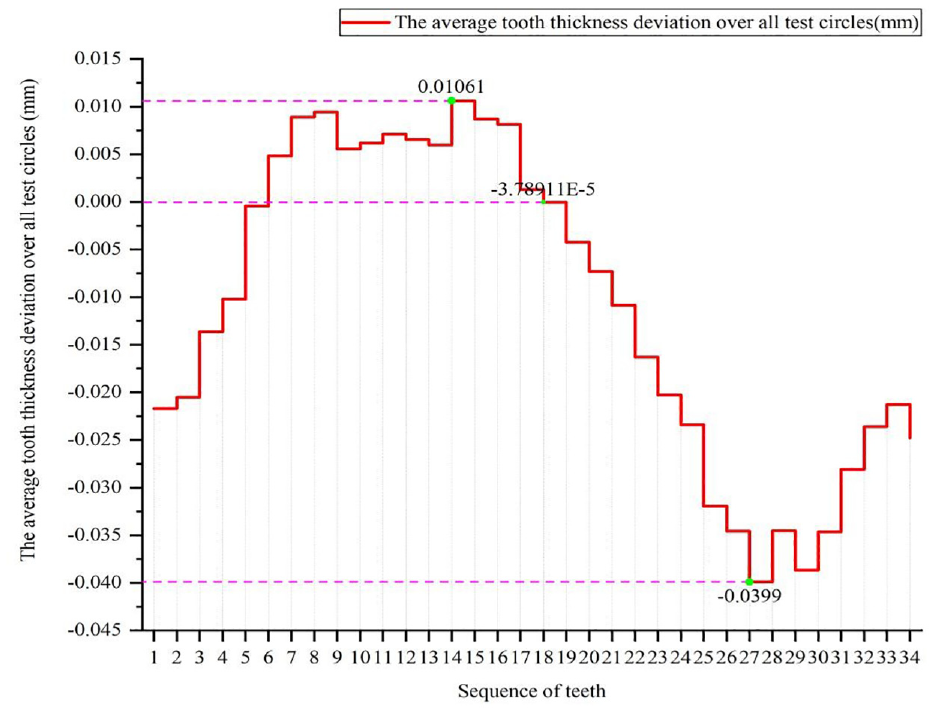
On each detection circle, the average tooth thickness deviation for each tooth of the large gear.
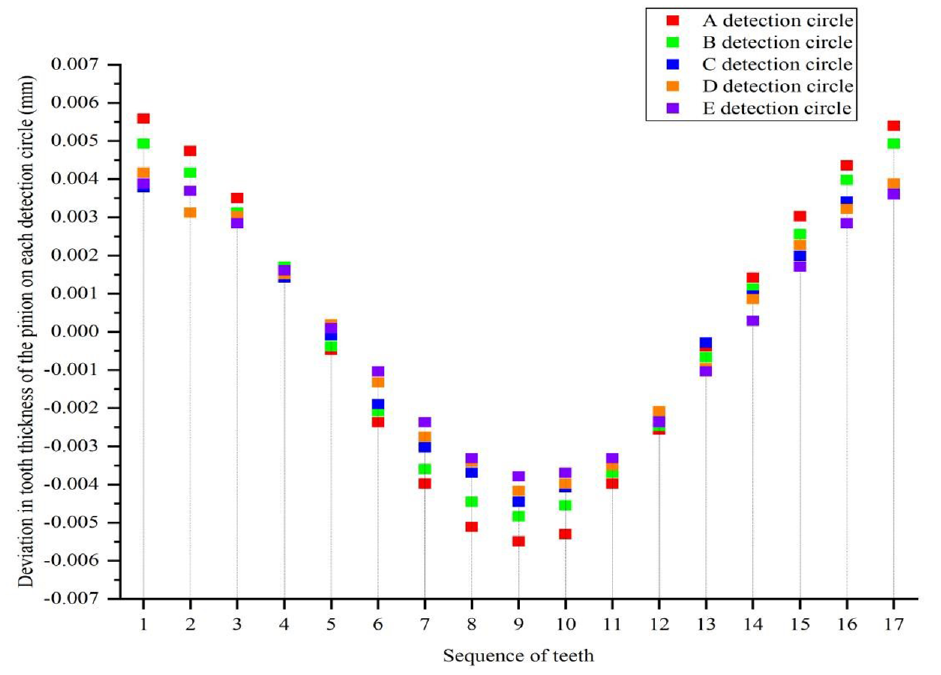
All pinion teeth were measured on their respective test circles for tooth thickness deviation.
Deviation in tooth thickness of individual pinion teeth on all test circles.
Figure 9 shows the tooth thickness deviation for each tooth on each detection circle of the large gear. Five different colors and different shapes are connected in series by a dotted line extending from each tooth serial number along the vertical axis. The data points represent the tooth thickness deviation measurement results of a specific tooth of the gear on five different detection circles. Figure 9 displays the measurement results of the tooth thickness deviation of all the teeth on the same detection circle from tooth No. 1 to tooth No. 34. Five data points connected by a dotted line extend from each tooth serial number along the vertical axis represent the tooth thickness deviation measurement results of five different detection circles for a specific tooth. The tooth thickness deviation measurements of each tooth of the large gear are inconsistent on each detection circle as shown in Figure 9. The data in Figure 9 were averaged to produce Figure 10.
In Figure 10, the average value of the measurement results obtained in Figure 9 is used as a tooth thickness deviation value for each gear tooth, so that there are no accidental errors in the measurement error, making gear tooth thickness measurement more accurate and reliable. As we can see from Figure 10, the largest average positive tooth thickness deviation of this gear is tooth No. 14, and the deviation value is 0.01061 mm, indicating that this gear tooth has extra material; the largest average negative tooth thickness deviation is tooth No. 27, the deviation value is −0.0399 mm, indicating that the gear teeth are over-cut; the minimum average tooth thickness deviation is the 18th tooth, and the deviation value is −3.79E-5 mm. As this gear’s average tooth thickness deviation is −0.035 mm, it can fully meet the measurement requirements for grade 6 precision gears since the tooth thickness deviation is at a low level.
According to Figure 11, the measurement results of the tooth thickness deviation of the pinion can also be obtained using the same measurement method as the large gear. The data in Figure 11 were averaged to produce Figure 12.
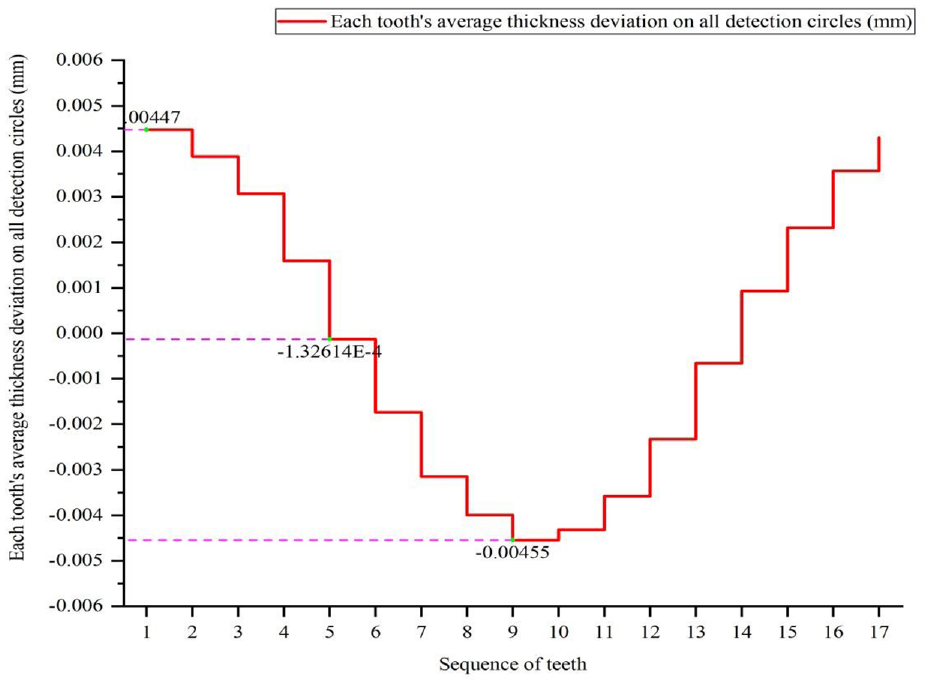
This Figure 12 is obtained by calculating the average value of the tooth thickness deviation of each pinion tooth on all detection circles. It is evident that the average value will not change the trend of the measurement result curve, and the maximum positive value of the pinion will be The average tooth thickness deviation of the No. 1 tooth is 0.00447 mm; the maximum negative average tooth thickness deviation is −0.00455 mm; and the minimum average tooth thickness deviation is −1.3261E-4 mm. Figure 12 shows the average tooth thickness deviation of all pinions, and the tooth thickness deviation of the pinion can be calculated as −0.00026 mm. As a result of the analysis of the tooth thickness deviation measurement results, it is shown that the tooth thickness deviation of the pinion is very small, at a relatively low level, and fully meets the requirements for use of grade 6 precision gears.
Measurement of large gear pitch deviation
The gear is a transmission component, and the pitch deviation is closely related to the transmission performance. A single pitch deviation affects transmission stability; a cumulative pitch deviation affects motion accuracy. 25 Therefore, gear pitch deviations are almost a must-check item in gear accuracy testing, and it is crucial to conduct more accurate detections of gear pitch deviations.
According to section 4.1, establish the detection plane and detection circle at equal intervals on each gear tooth. The left and right pitch deviation of each tooth of this gear should be measured as described in sections 2.5. Determine the left pitch deviation and right pitch deviation of each tooth of the gear based on statistical principles, and obtain Figures 13 and 15. In order to accurately measure the left and right pitch deviations for each tooth of this gear, take the average value of the left pitch deviation and right pitch deviation of all detection circles for each tooth, and get Figures 14 and 16.
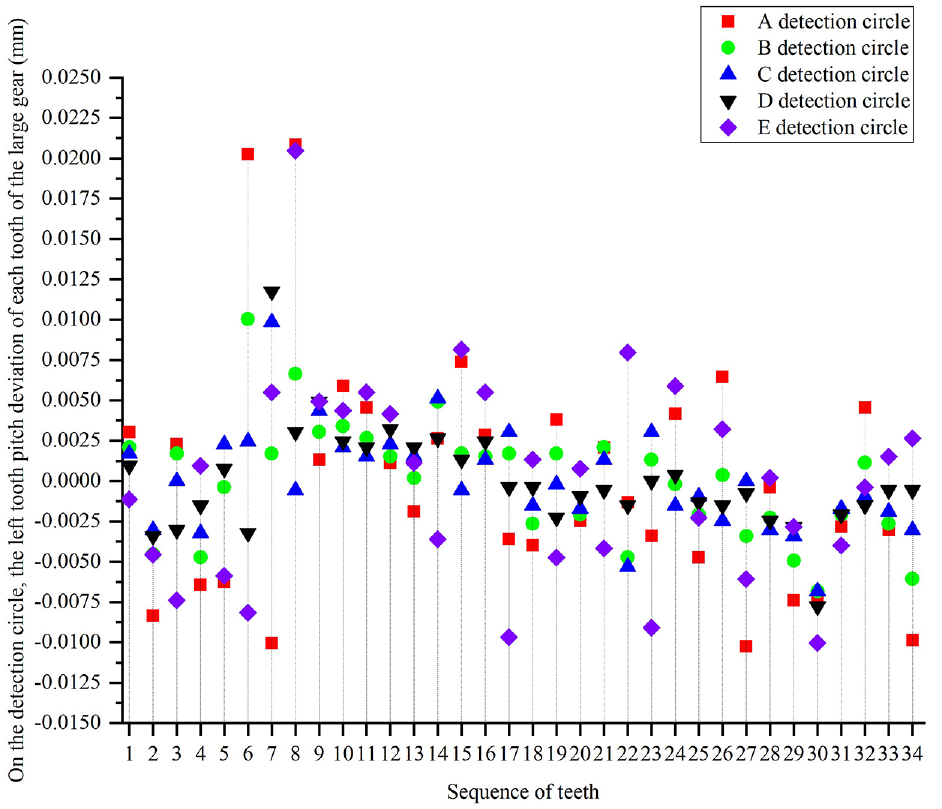
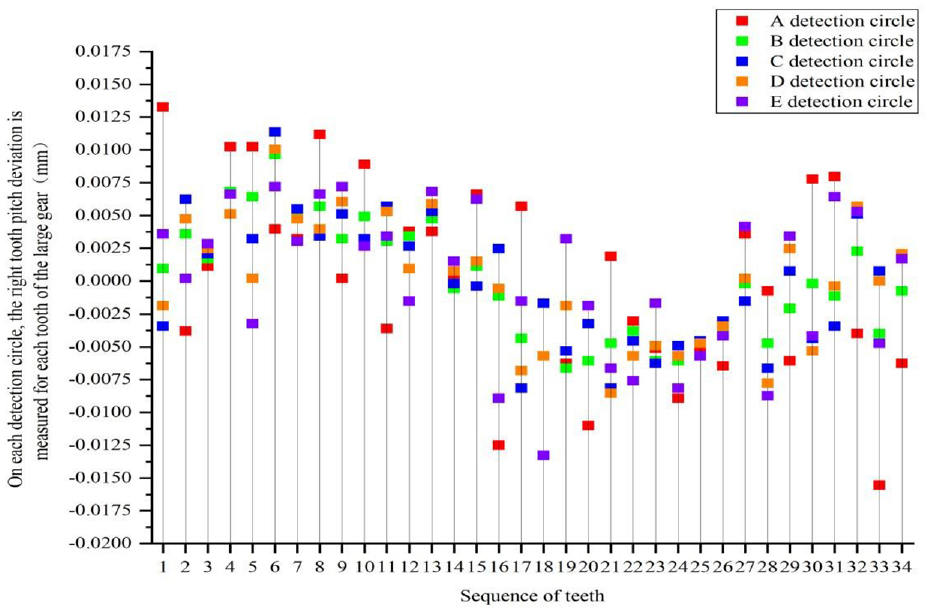
Results of left tooth pitch deviation measurements on each detection circle for the large gear.
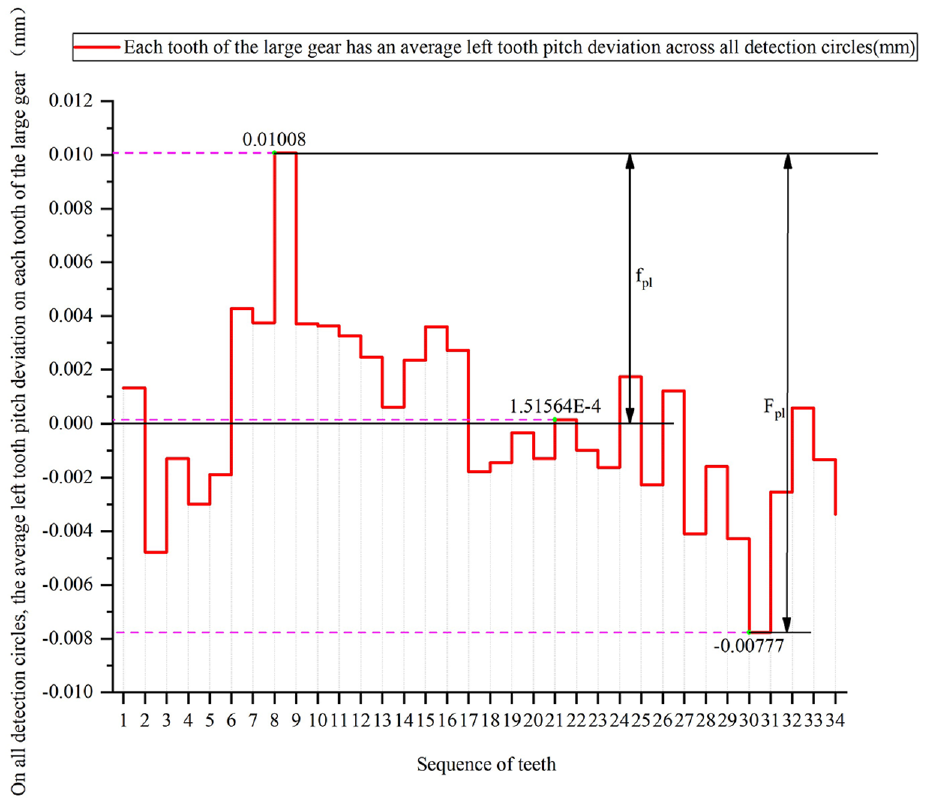
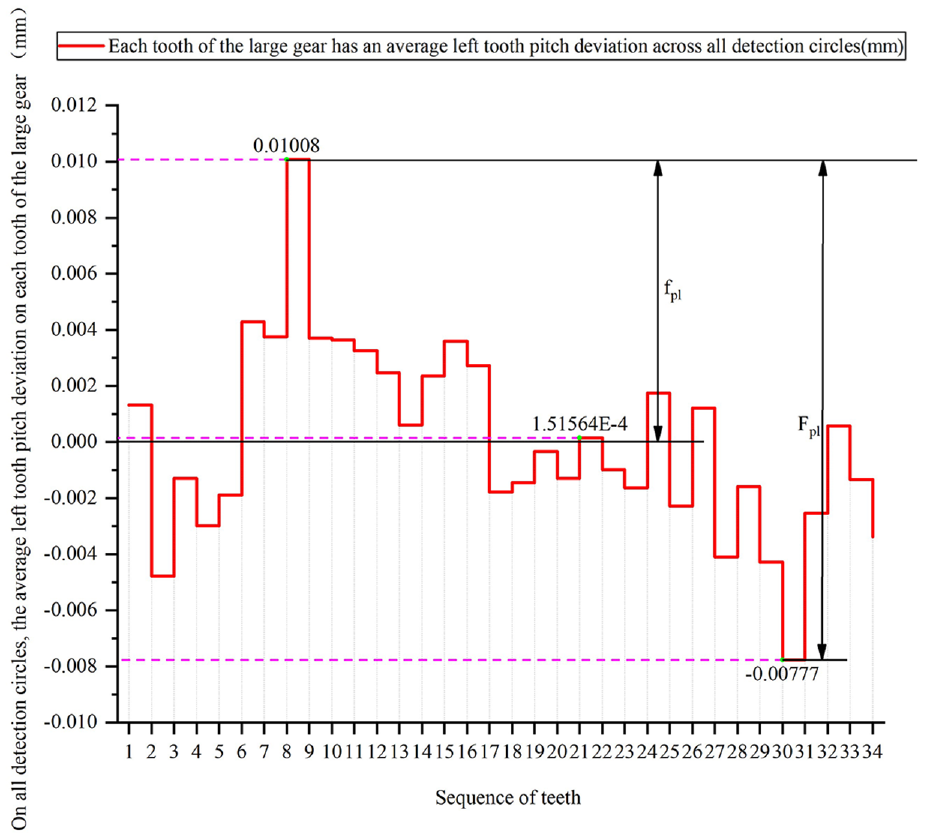
Across all detection circles, the average left tooth pitch deviation of each tooth of the large gear.
On each detection circle, the right tooth pitch deviation of each large gear tooth was measured.
Each detection circle’s average value of the right tooth pitch deviation for each tooth of the large gear.
Measurement of large gear left tooth pitch deviation
Using sections 2.5, the left pitch deviation for the big gear is calculated and shown in Figure 13. In Figure 13, data points of the same color and shape represent the measurement results of the left tooth pitch deviation of each tooth of the large gear on the same detection circle; five different colors and shapes represent the measurement results of the left tooth pitch deviation of a specific tooth of the gear on five different detection circles.
Figure 13 shows that the left tooth pitch deviations of most gear teeth on the five detection circles are very close, such as tooth No. 1. Some teeth, however, such as teeth No. 6–8, No. 15 and No. 17, show large differences between the results of the left tooth pitch deviation of the five different detection circles. To reduce the difference in the measurement results of the left tooth pitch deviation, improve the reliability of the measurement results, and obtain more accurate measurement results of the left tooth pitch deviation of the large gear, calculate the average value of the deviation measurement results for each tooth on different detection circles.
As shown in Figure 14, the maximum positive deviation of the left tooth pitch of the large gear occurs on the eighth tooth, with a deviation value of 0.01008 mm; the maximum negative deviation of the left tooth pitch occurs on the 21st tooth, with a deviation value of 1.516E-4 mm. The left tooth pitch deviation of the gear is −5.572E-06 mm if you average all the teeth in Figure 14. The single left tooth pitch deviation of the gear is 0.01008 mm = 10.08 μm, based on equation (10). As a result of equation (11), the accumulative tooth pitch deviation on the left side of the gear is 0.01008-(−0.00777) = 0.01785 mm = 17.85 μm. Based on the analysis, we can see that the left average pitch deviation, single tooth pitch deviation, and left cumulative tooth pitch deviation are all at a low level, which meet the requirements for a single tooth of a 6-grade precision gear in the gear precision standard GB/T 10095.1. The allowable value of pitch deviation and the allowable value of accumulative pitch deviation.
Deviation of right pitch of large gear
Use the left-side pitch deviation measurement method listed in Section 4.2.1 to measure the right-side pitch deviation of the big gear, and use the results for statistical analysis.
As shown in Figure 15, the data points of the same color and shape represent the measurement results of the right tooth pitch deviation of each tooth of the large gear on the same detection circle; the dotted line extending from the tooth serial number along the vertical axis is connected in series. The five data points of different colors and shapes represent the measurement results of the right tooth pitch deviation of a specific tooth of the gear on five different detection circles. Figure 15 shows how the right pitch deviations of each tooth of a small number of large gears on different detection circles are very close, such as No. 3 tooth, No. 14 tooth, No. 25 tooth, and so on. Different right pitch deviation measurements on different test circles for most gear teeth, for example, tooth 5, tooth 17, tooth 31, etc. As a result, Figure 16 is obtained by averaging the data in Figure 15.
As demonstrated by Figure 16, the largest positive deviation of the right tooth pitch of the large gear is on the No. 6 tooth, and the deviation value is 0.00845 mm; the largest negative deviation of the right tooth pitch of the large gear is on the No. 24 tooth, and the deviation value is −0.00674 mm; the smallest deviation of the right tooth pitch of the large gear is on the 29th and 34th teeth, and the deviation value is −3.032E-4 mm. Take the average right pitch deviation of all gear teeth in Figure 16, and get the right pitch deviation of the large gear as −2.23E-5 mm. According to the equation (10), the single right pitch deviation of the gear is 0.00845 mm = 8.45 μm; according to the equation (11), the accumulative tooth pitch deviation on the right side of the gear is 0.00845-(−0.00674) =0.01519 mm=15.19 μm. Analysis shows that the right average pitch deviation, single tooth pitch deviation, and right cumulative pitch deviation of the large gear are all at relatively low levels, all of which can satisfy the requirements for a single tooth of a 6-grade precision gear according to GB/T 10095.1. Pitch deviation allowable value and accumulative pitch deviation allowable value.
Measurement of pinion pitch deviation
A similar analysis method and process are used for the measurement results of the left and right pitch deviations of the large gear in Sections 4.2.1 and 4.2.2, as well as the measurement results of the left and right pitch deviations of the pinion.
Pinion left tooth pitch deviation measurement and analysis
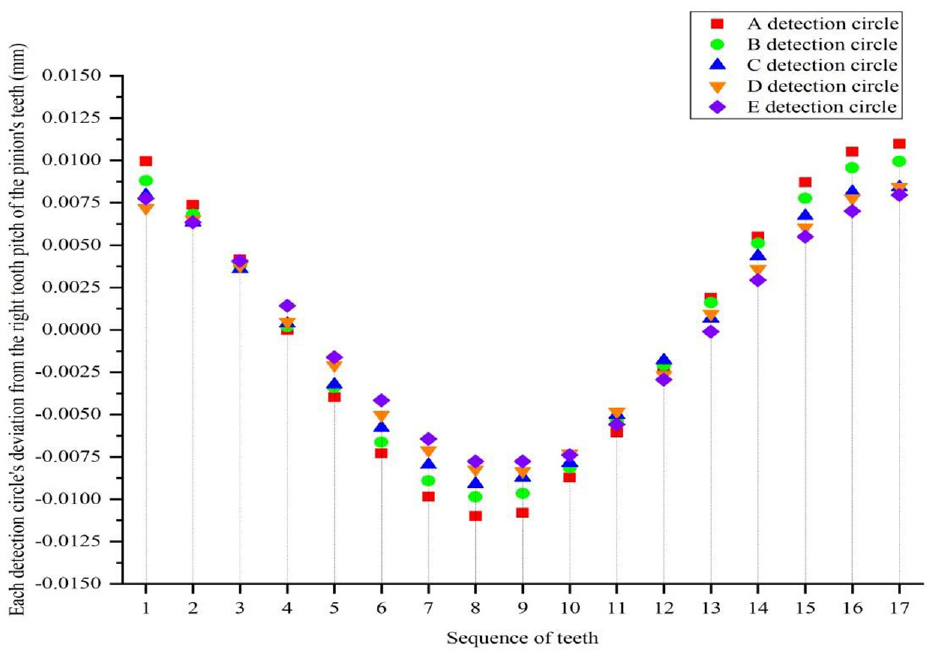
In Figure 17, the data points of the same color and shape represent the measurement results of the left tooth pitch deviation of each tooth on the same detection circle; the dotted line extends along the vertical axis of each tooth serial number. The five data points of different colors and shapes represent the measurement results of the left tooth pitch deviation of a specific tooth on different detection circles. Figure 17 shows that the left pitch deviations of the pinion teeth on different detection circles, such as tooth No. 3, tooth No. 5, and tooth No. 12, are very close. Pitch deviation measurements for a small number of teeth on different test circles, such as tooth 7, tooth 8, tooth 16. The left pitch deviation of the pinion gear from teeth 1 to 4 and 13 to 17 is greater than 0; the deviation of the pinion from teeth 5 to 12 is less than 0. Calculate the average left tooth pitch deviation measurement results for each pinion tooth on each detection circle and obtain Figure 18.
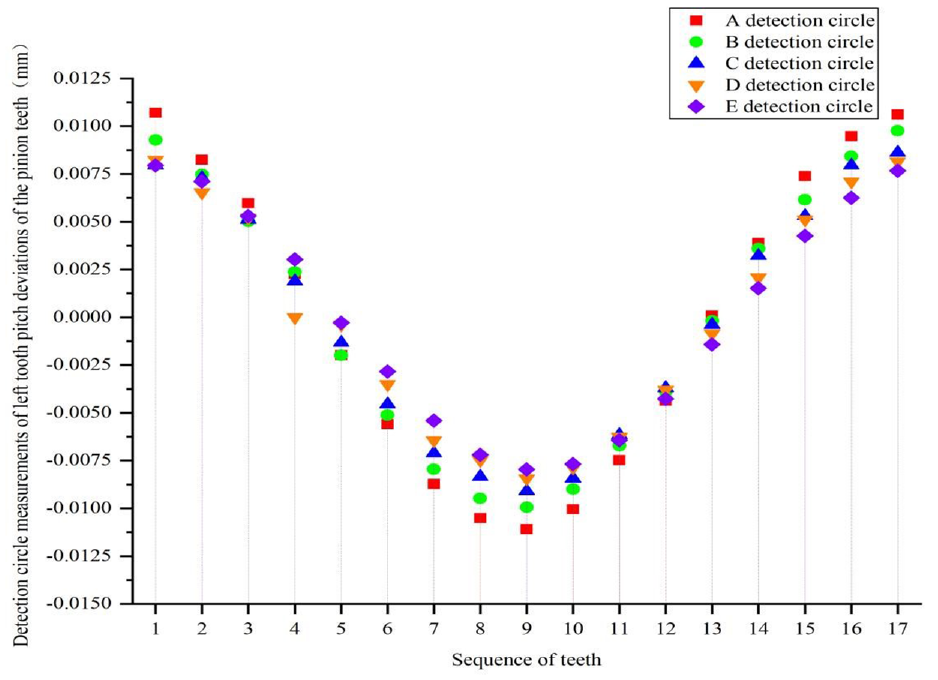
Pitch deviation measurements on each detection circle on the left side of the pinion.
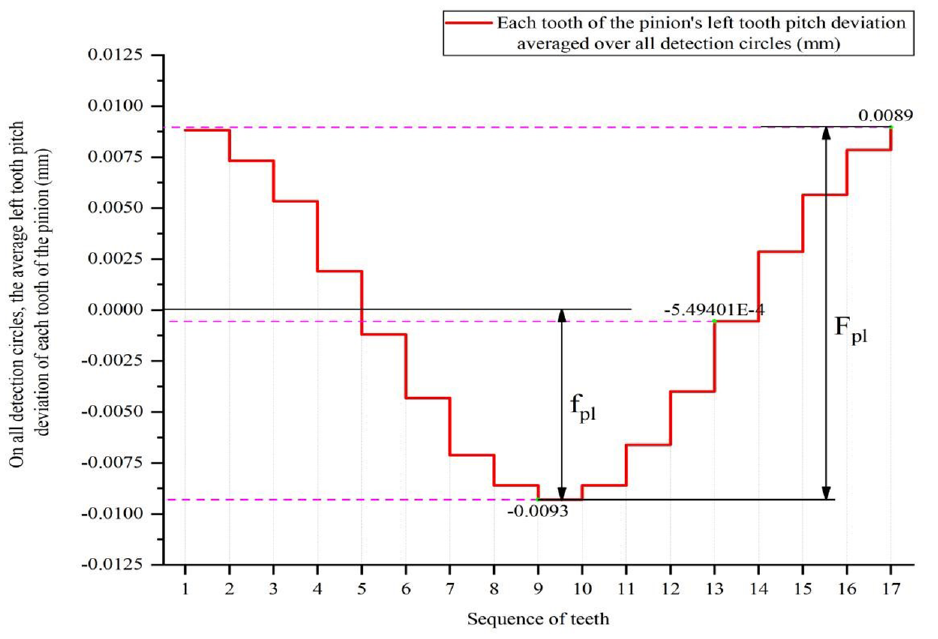
On the detection circle, the average left tooth pitch deviation for each tooth of the pinion.
Figure 18 shows that the largest deviation of the left tooth pitch of the pinion occurs on the 17th tooth, and the deviation value is 0.0089 mm; the largest negative deviation occurs on the ninth tooth, and the deviation value is −0.0093 mm; The smallest deviation occurs on the 13th tooth, and the deviation value is −5.49E-4 mm. The left tooth pitch deviation of the gear is −9.36E-05 mm when you average the left tooth pitch deviation of all the teeth in Figure 18. According to equation(10), the single left tooth pitch deviation of the gear is 0.0093 mm = 9.3 μm; according to equation(11), the accumulative left tooth pitch deviation of the gear is 0.0089-(−0.0093) = 0.0182 mm = 18.2 μm. This analysis shows that the left average pitch deviation, single tooth pitch deviation, and cumulative tooth pitch deviation of the pinion are all at low levels, all of which are within the tolerances of the sixth grade precision gear standard GB/T 10095.1. Pitch deviation allowable value and cumulative pitch deviation allowable value.
Pinion right tooth pitch deviation measurement and analysis
Figure 19 shows that the right pitch deviations of the pinion teeth on different detection circles are very close, such as teeth No. 3, teeth No. 11, and teeth No. 12. Right pitch deviation measurements for most gear teeth differ on different test circles, such as tooth 1, tooth 6, and tooth 8. The left pitch deviation of the pinion gear from teeth 1 to 4 and 13 to 17 is greater than 0; the deviation of the pinion from teeth 5 to 12 is less than 0. Figure 20 is obtained by calculating the average value of the data in Figure 19.
In each detection circle, the deviation of the right tooth pitch of each tooth of the pinion.
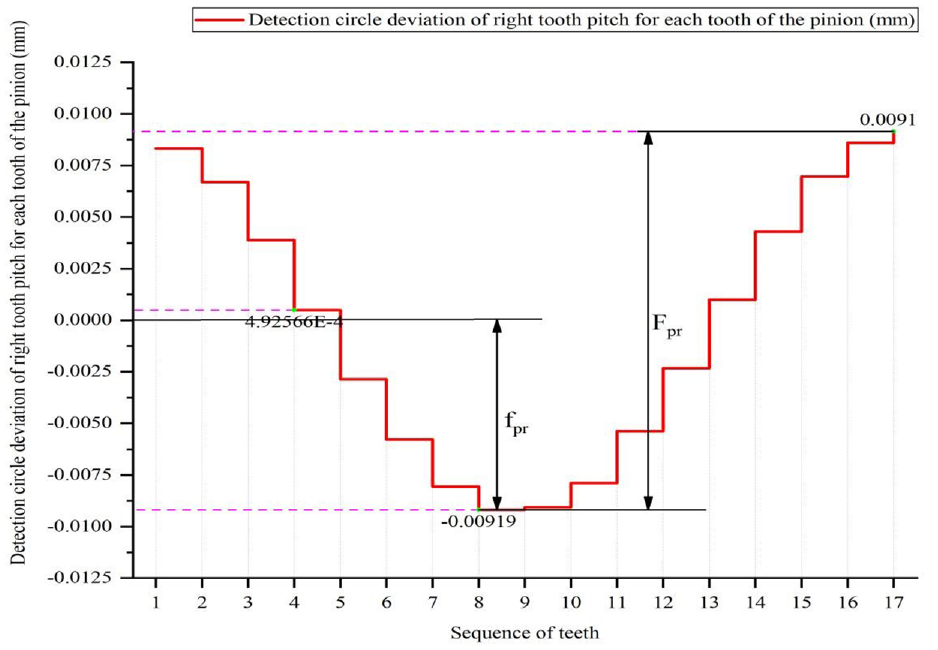
Detection circle deviation of right tooth pitch for each tooth of the pinion.
According to Figure 20, the largest positive deviation of the right tooth pitch of the pinion is on the 17th tooth, with a deviation value of 0.0091 mm; the largest negative deviation is on the eighth tooth, with a deviation value of −0.00919 mm; the smallest deviation is on the fourth tooth, with a deviation value of 4.926E-4 mm. Based on the average right pitch deviation of all gear teeth in Figure 18, the large gear’s right pitch deviation is −6.57498E-5 mm. In equation(10), the single right tooth pitch deviation of the gear is 0.0091 mm = 9.1 μm; in equation(11), the accumulative tooth pitch deviation on the right side of the gear is 0.0091-(−0.00919) = 0.01829 mm = 18.29 μm. The right average pitch deviation, single tooth pitch deviation, and right cumulative tooth pitch deviation of the pinion are all within acceptable limits in the gear precision standard GB/T 10095.1. The allowable value of pitch deviation and the allowable value of accumulative pitch deviation.
Comparison of pitch deviation measurement results
These two gears were tested in the WGT3000 large gear measurement center and the Klingelnberg P 26 gear measurement center for verification of the reliability and accuracy of the coaxial multi-ring detection method proposed in this research. The measurement items such as gear tooth thickness deviation, left tooth pitch deviation, and right tooth pitch deviation were measured and compared, as shown in Figures 21 and 22. Verify the reliability of the measurement results of the measurement method proposed in this study by comparing the contact measurement results with the measurement results of the measurement method proposed in this study.
Large gear measuring center WGT-3000.
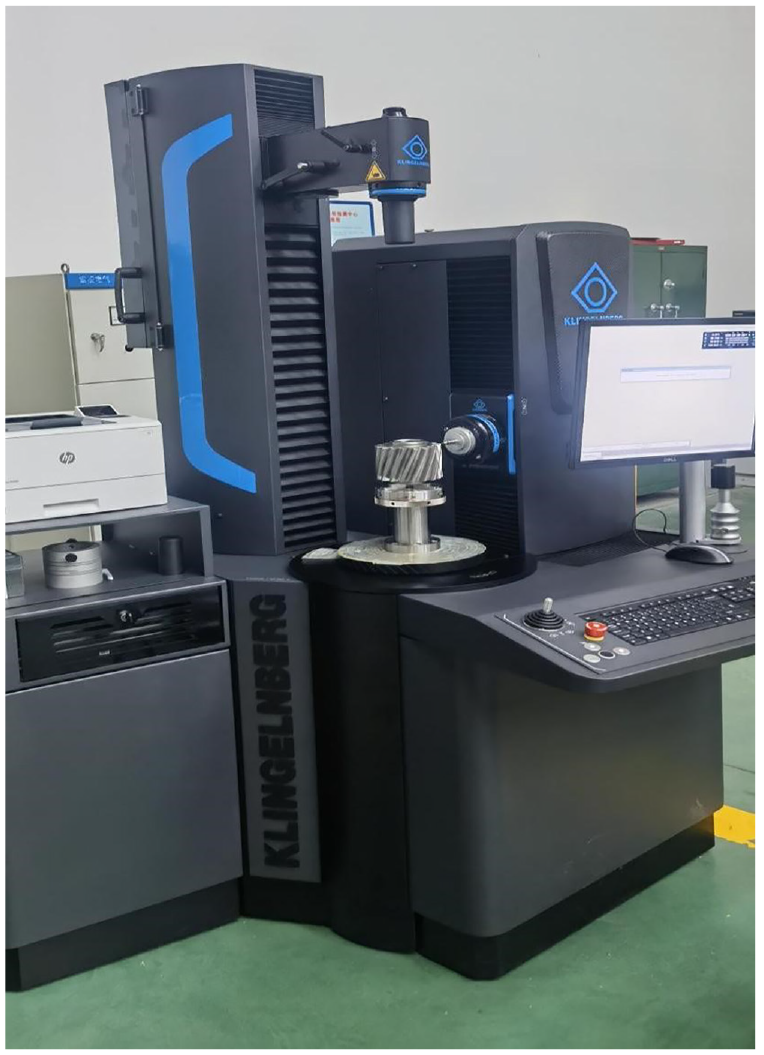
Measurement pinion for Klingelnberg P26 measuring center.
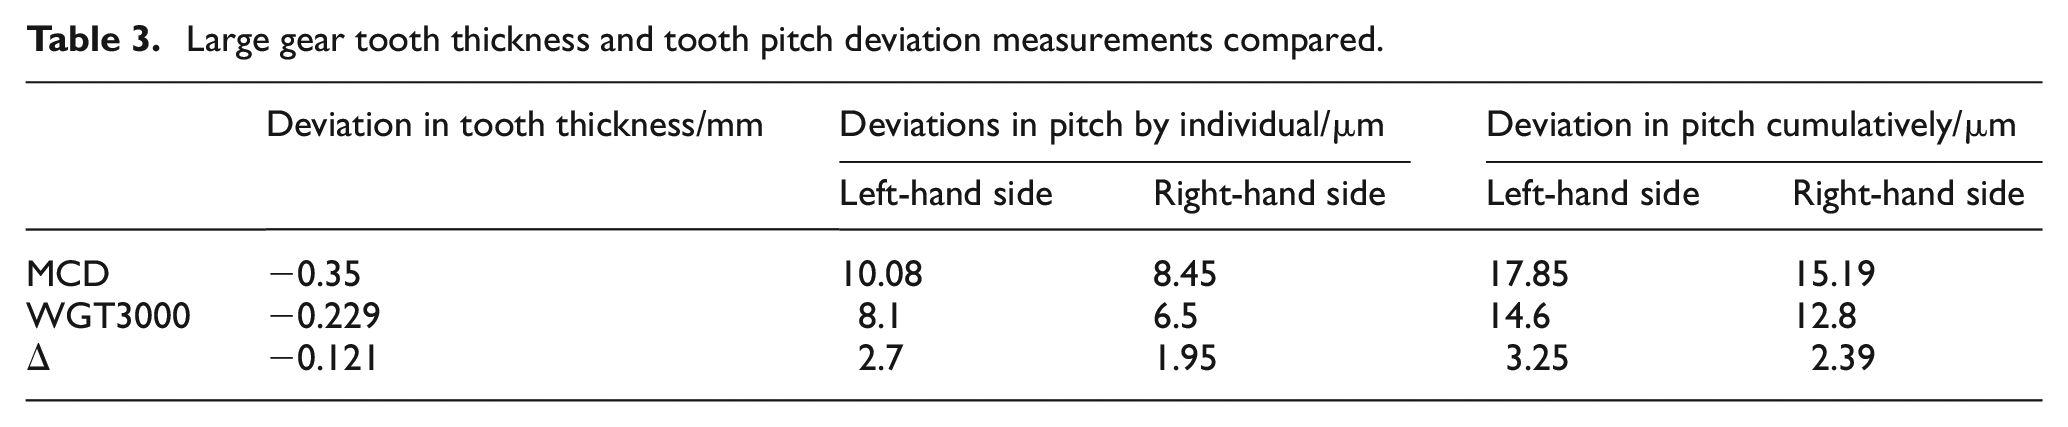
According to Table 3, in the measurement results of large gears, the results of measuring gears by coaxial multi-ring detection method are generally larger than the results of measuring gears with WGT3000 gear measurement center. In contrast, the measurement result of the large gear’s tooth thickness deviation is slightly smaller than that of the gear measurement center. A comparison of the coaxial multi-ring detection method with gear measurement center measurement results reveals an error of −0.121 mm in the tooth thickness deviation measurement item; The error in the cumulative distance deviation measurement item is: the left tooth distance deviation is 2.7 μm, the right tooth distance deviation is 1.95 μm, the left tooth distance cumulative deviation is 3.25 μm, and the right tooth distance cumulative deviation is 2.39 μm. In a comparative analysis, the coaxial multi-ring detection method’s gear parameter measurements are highly consistent with those of the gear measurement center, indicating that it is very reliable in measuring large gear parameters.
Large gear tooth thickness and tooth pitch deviation measurements compared.
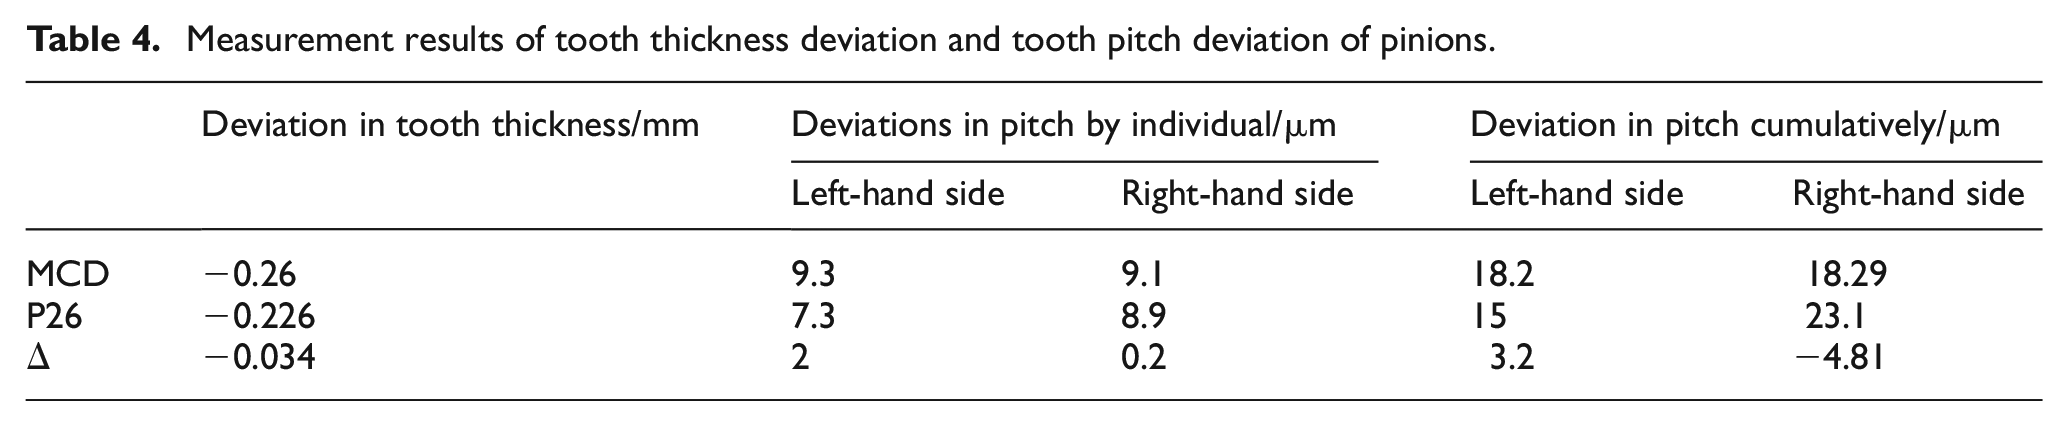
According to Table 4, the measurement results of the pinion using the coaxial multi-ring detection method are compared with the three measured items: left tooth pitch deviation, right tooth pitch deviation, and left tooth pitch cumulative deviation. The measurement result of the measurement center is too large. However, the visual measurement results of the coaxial multi-ring detection method for the two measurement items of pinion tooth thickness deviation and right tooth pitch cumulative deviation are slightly smaller than those of the gear measurement center. The coaxial multi-ring detection method is found to have an error of −0.034 mm when compared with the measurement results of the gear measurement center; the deviation of the left tooth distance is 2 μm, the deviation of the right tooth distance is 0.2 μm, the cumulative deviation of the left tooth distance is 3.2 μm, and the cumulative deviation of the right tooth distance is −4.81 μm when compared with the measurement results of the gear measurement center. Using a comparative analysis, we found that the gear parameter measurement results of the coaxial multi-ring detection method are very close to those of the gear measurement center, demonstrating the accuracy of the coaxial multi-ring detection method in measuring pinion parameters.
Measurement results of tooth thickness deviation and tooth pitch deviation of pinions.
Conclusion
The traditional measurement method has large measurement errors for gear pitch deviation and tooth thickness deviation, and cannot adequately reflect tooth thickness deviation and tooth pitch deviation of gears. It is proposed to use a machine vision-coaxial multi-ring detection method based on the basic theory of gears, binocular vision technology, computer graphics, error theory, and statistical principles for measuring the pitch deviation and tooth thickness deviation of cylindrical gears. When used correctly, this measurement method can effectively eliminate existing gear pitch and tooth thickness errors, as gear pitch deviations and tooth thickness deviations are traditionally measured only in one plane perpendicular to the gear axis, leading to inaccurate measurements.
The measurement results from this method are highly consistent with those from the D80 gear inspection center, indicating that the method is reliable. In analysis of the measurement results, it has been shown that this method accurately reflects tooth pitch deviation and tooth thickness deviation for gears. Using this measurement method has effectively improved the measurement accuracy of gear pitch error and tooth thickness error, and has broad implications for evaluating gear transmission stability and transmission accuracy in a scientific and objective manner, effectively improving the accuracy of gear transmission performance evaluation reliability.
Footnotes
Appendix A
MCD Method of coaxial multi-ring detection.
n The number of detection planes and circles.
Ci Circle of detection i.
j This is the tooth of the jth gear that needs to be tested.
j + 1 This is the gear tooth j + 1th that needs to be tested.
Oi Center of the i-th detected circle.
Pij On the left side of the j-th tooth, the intersection point of the i-th detection circle and the actual tooth profile.
P ’ij On the left side of the j-th tooth, the i-th detection circle intersects the theoretical tooth profile.
Pij+1 On the left side of the j + 1-th tooth, the intersection point of the i-th detection circle and the actual tooth profile.
P ’ij+1 On the left side of the j + 1-th tooth, the i-th detection circle intersects the theoretical tooth profile.
Qij The intersection of the i-th detection circle with the actual tooth profile on the right side of the j-th gear tooth.
Q ’ij On the right side of the j-th gear tooth, the i-th detection circle intersects with the theoretical tooth profile.
Qij + 1 The intersection of the i-th detection circle with the actual tooth profile on the right side of the j + 1-th gear tooth.
Q ’ij+1 On the right side of the j + 1-th gear tooth, the i-th detection circle intersects with the theoretical tooth profile.
θij Angle corresponding to actual tooth thickness.
θ’ij Angle corresponding to theoretical tooth thickness.
ωij Gear center angle corresponding to the tooth pitch on the left side.
ω’ij Gear center angle corresponding to theoretical tooth pitch.
fθij A measure of the angular difference between the actual tooth thickness and the theoretical tooth thickness of the jth gear tooth at the ith detection circle.
Esn Deviation in tooth thickness.
Esnj The j-th tooth’s thickness deviation.
fωij Angle difference corresponding to the left tooth pitch of the jth gear tooth at the ith detection circle.
fplj Left tooth pitch deviation of the jth gear tooth.
fpl A single pitch deviation to the left.
Fpl Left tooth pitch deviation cumulatively.
αij On the right, the center angle corresponds to the actual tooth pitch.
α’ij + 1 On the right, the center angle corresponds to the theoretical tooth pitch.
fαij In the ith detection circle, the angle difference corresponds to the right tooth pitch of the j-th gear tooth.
fprj Right tooth pitch deviation of the j-th gear tooth.
fpr A single deviation to the right.
Fpr The cumulative total deviation of the pitch of the right tooth.
Declaration of conflicting interests
The author(s) declared no potential conflicts of interest with respect to the research, authorship, and/or publication of this article.
Funding
The author(s) disclosed receipt of the following financial support for the research, authorship, and/or publication of this article: This research was funded by National Natural Science Foundation of China, (No. 52006201); the National Natural Science Foundation of China General Program (No. 52275295); the Innovation Leadership Project of Yancheng, Jiangsu Province, grant number YW [2020] No. 40; the Industry University Research Cooperation Plan Project of Zhengzhou City grant number ZKH [2020] No. 3.