
Abstract
The Line laser gear measuring center (LLGMC) is an innovative gear measurement equipment that offers high efficiency but low accuracy. One crucial factor that influences its measurement accuracy is the presence of geometric errors. In this study, we conducted a thorough analysis of these geometric errors and proposed a method for modeling spatial errors. Instead of directly considering the geometric errors, we replaced them with the installation errors of the gear and line laser probe. This approach simplifies and improves the error transmission relationship. Subsequently, the installation errors are converted into a unified representation of the height error of the incident light from the line laser. A spatial error model that considers nine installation errors is then further established. By numerically calculating the sensitivity of different error sources, we effectively identified the errors that have a significant impact on the accuracy of LLGMC. Moreover, accuracy distribution is carried out to ensure that LLGMC can meet the measurement accuracy requirements for gears with a tolerance class of 6. This article provides a theoretical foundation for the structural design and accuracy assurance of LLGMC during the research and development phase.
Introduction
Gear measurement plays a crucial role in ensuring the quality of gears. 1 However, the current contact measurement method used for gear measurement exhibits high accuracy but low efficiency, making it challenging to meet the increasing demands of the gear market. To address this, researchers have focused on the development of a novel type of gear measurement equipment known as the line laser gear measuring center (LLGMC). Unlike traditional contact gear measurement devices, the LLGMC utilizes a non-contact measurement principle based on line laser technology, offering advantages such as rapid measurement, high efficiency, and dynamic response. As a result, it has gained significant attention in the field of gear gauge research.
Leading manufacturers, including Slone Gear, Gleason, and Klingelnberg, have incorporated line lasers into their advanced gear measurement devices.2–4 Scholars have proposed various schemes for gear measurement using line lasers and successfully detected gear deviation issues. Kerforn proposed a solution for 3D measurement of gears based on a precision turntable with a line laser, but the probe is fixed. 5 Mies proposed a scheme of 3D measurement of gears based on the line laser measuring center, but the measurement process still needs a contact probe to improve the accuracy. 6 Hartig proposed a scheme for the measurement of gears based on articulated arm with line laser. However, its measurement accuracy is not high, which limits its application in the measurement of high-precision gears. 7 By replacing the contact probe with a line laser sensor in a traditional gear measuring center, Shi’s team achieved rapid acquisition of 3D gear data, leading to significant advancements in the field.8–12 However, a fully developed line laser gear measurement device is yet to be realized. This is because while using line laser equipment for gear measurement offers efficiency, there is still room for improvement in terms of accuracy. The complex composition of the LLGMC’s mechanical structure and the presence of geometric errors in its components are two key factors contributing to this challenge.
Error modeling and compensation techniques are vital for improving the measurement accuracy of instruments, enabling more precise measurements at a reduced cost. 13 Numerous scholars have studied error modeling in traditional contact gear measuring centers from two primary perspectives. One approach involves creating a digital twin of the gear measurement center and compensating for errors based on the error model, which can enhance the measurement accuracy to a certain extent. For example, Lu 14 built the digital twin of a gear measuring center (DTGMC) as an evaluation platform for various measurement software. It can effectively identify various errors, providing a new idea for the independent evaluation of measurement software. Takeoka 15 proposed a virtual gear checker and analyzed the influence of its error factors and gear measurement uncertainties. Yin 16 established the tooth profile deviation measurement model of the standard polar coordinate method and the coordinate system establishment error model. On the DTGMC platform, the influence of the coordinate system establishment errors in the X and Y directions on the measurement accuracy of the involute tooth profile was simulated. In addition, the measurement uncertainty model of gear tooth profile coupling geometric error and installation error on DTGMC was established using the gear parameter module as the factor of measurement uncertainty evaluation. 17 However, it should be noted that the digital twin is not an exact replica of the actual gear measuring center; rather, it is a computer program that measures digital workpieces instead of physical ones. Another method utilizes the principles of multi-body system theory to establish topological and geometric error models, which have found wide application in equipment such as CNC machine tools.18–21 This approach has also been applied to contact gear measuring centers. For example, for the self-developed HY 300 gear measurement center, Ye 22 applied the multi-body system topology analysis method to establish the system topology and geometric motion error model. They deduced the precise and the ideal measurement without error equation. 22 Basing on multi-body system topology analysis theory, Fan established the topology and geometric motion model of the gear measuring center. 23 Nonetheless, this method has certain limitations, particularly in the context of the LLGMC, which has a complex structure. The modeling process involves the homogeneous coordinate transformation between low-order bodies, which is intricate, cumbersome, and unsuitable for LLGMC. While scholars have primarily focused on new methods for measuring gears using line lasers, there is currently a lack of systematic analysis on the error sources, geometric error modeling, and accuracy distribution for such instruments. Therefore, this paper aims to advance the research and development progress of LLGMC, enhance its cost performance and market competitiveness, and present structural optimization design and accuracy assurance techniques.
The subsequent sections of this paper are organized as follows: Section 2 provides an overview of the mechanical structure and measurement principle of LLGMC. Section 3 conducts a detailed analysis of the error sources that affect the measurement accuracy of LLGMC. It clarifies the relationship between geometric errors and installation errors and proposes a spatial error modeling method suitable for LLGMC. In Section 4, a spatial error model for LLGMC is established, taking into account nine installation errors. Section 5 focuses on numerical calculations. Based on these calculations, the accuracy distribution of LLGMC is performed, and the accuracy indicators of critical components are determined.
Structure and measurement principle of the LLGMC
The line laser sensor provides the most accurate measurement along the contact line of the tooth surface, which is a straight line. At this point, the light plane must be positioned at a specific angle with respect to the axis of the measured gear. 24 Therefore, LLGMC adds a 2D turntable S based on the structure of the traditional gear measuring center, as shown in Figure 1. The adjustment mechanism of the probe utilizes three linear guide rails and a 2D turntable, allowing the probe to be adjusted to any position and attitude to adapt to various types of gears. The y-oriented slider and guide rail constitute a tangential motion system, which is mounted on the base. The z-oriented slider and guide rail comprise an axial motion system, which is installed on the y-oriented slider. The x-oriented slider and guide rail comprise a radial motion system, which is mounted on the z-oriented slider. The 2D turntable S is attached to the y-oriented slider, which drives the probe to do roll and pitch movement. Moreover, the turntable R drives the measured gear to rotate through the mandrel shaft.
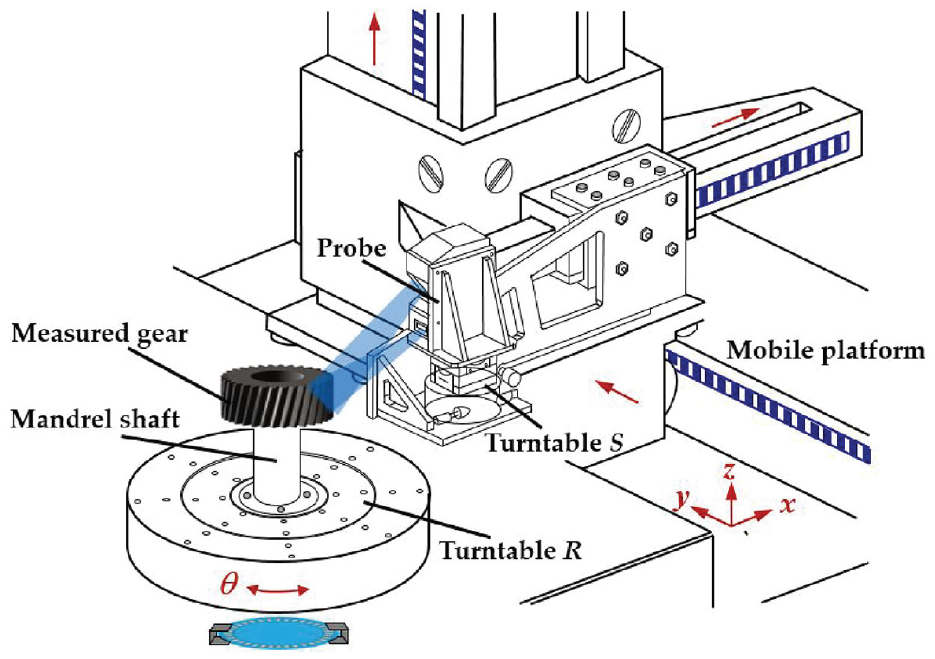
Schematic diagram of line laser gear measuring center.
When measuring, the laser beam generated by the internal laser is refracted by a cylindrical lens into a narrow laser fan-shaped plane, as shown in Figure 2. After the laser plane strikes the gear surface, it creates a bright line that reflects the undulating appearance of the gear surface. Before measuring, according to the type and specification of the gear to be measured, the position and attitude of the line laser probe are set and fixed so that the measured portion of the tooth surface is within the range of the probe. With the rotation of the turntable R, the line laser scans each tooth surface in turn to obtain the 3D contour point cloud data of the tooth surface. After data processing, a 3D model of the measured gear can be reconstructed as follows 8 :
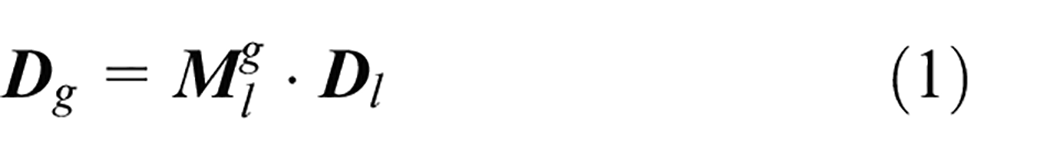
where
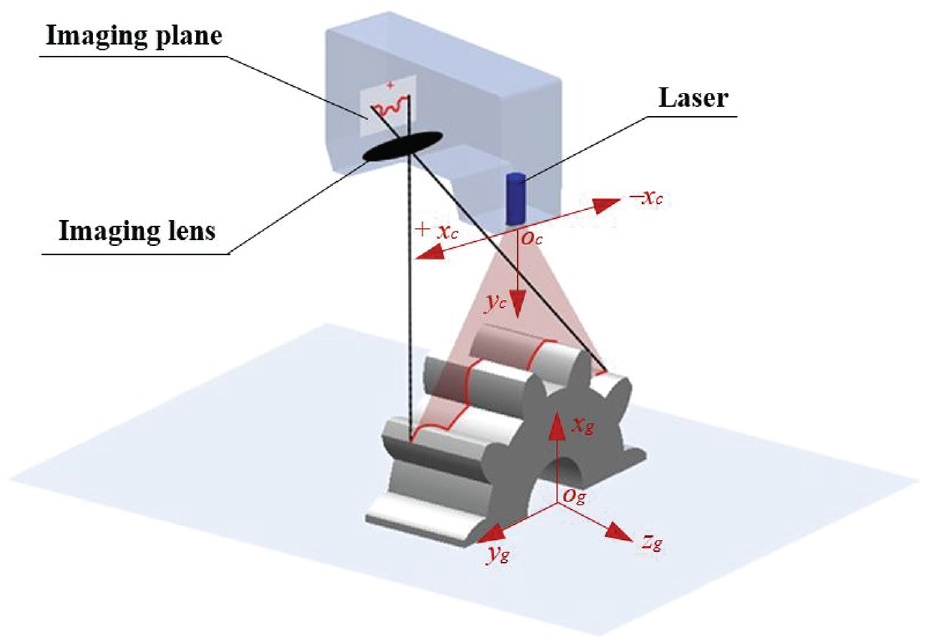
Schematic diagram of the gear measurement.
The evaluation results of the gear are directly affected by the measurement accuracy of the point cloud data. Thus, the accuracy of LLGMC should be ensured to achieve high-precision measurement of the gear.
Error sources of LLGMC
Geometric error, load error, thermal error, and optical error are the primary error factors affecting the measurement accuracy of LLGMC. Despite the complexity of the probe adjustment mechanism of LLGMC, it is a quasi-static system. That is, when measuring a batch of gears with the same type, the probe is fixed, and its adjustment mechanism no longer moves during the measurement process. Therefore, the load error is constant and can be reduced or eliminated by compensation. Thermal errors can be reduced or eliminated by placing the instrument in a stable temperature environment. The optical error is primarily related to the selected sensor and the measurement environment, and the accuracy can be improved by selecting high-precision sensors and calibration. However, the instrument has a complex structure and many components, so its measurement accuracy is primarily constrained by its geometric precision. Particularly, the installation accuracy of the line laser sensor must be strictly controlled to ensure that the measurement results have good linearity in the depth of field range. 25 In addition, accuracy distribution is a significant research content in LLGMC design, which greatly affects cost performance and directly determines the product’s market competitiveness. Meanwhile, the identification of geometric error-sensitive sources is the premise of accuracy distribution.
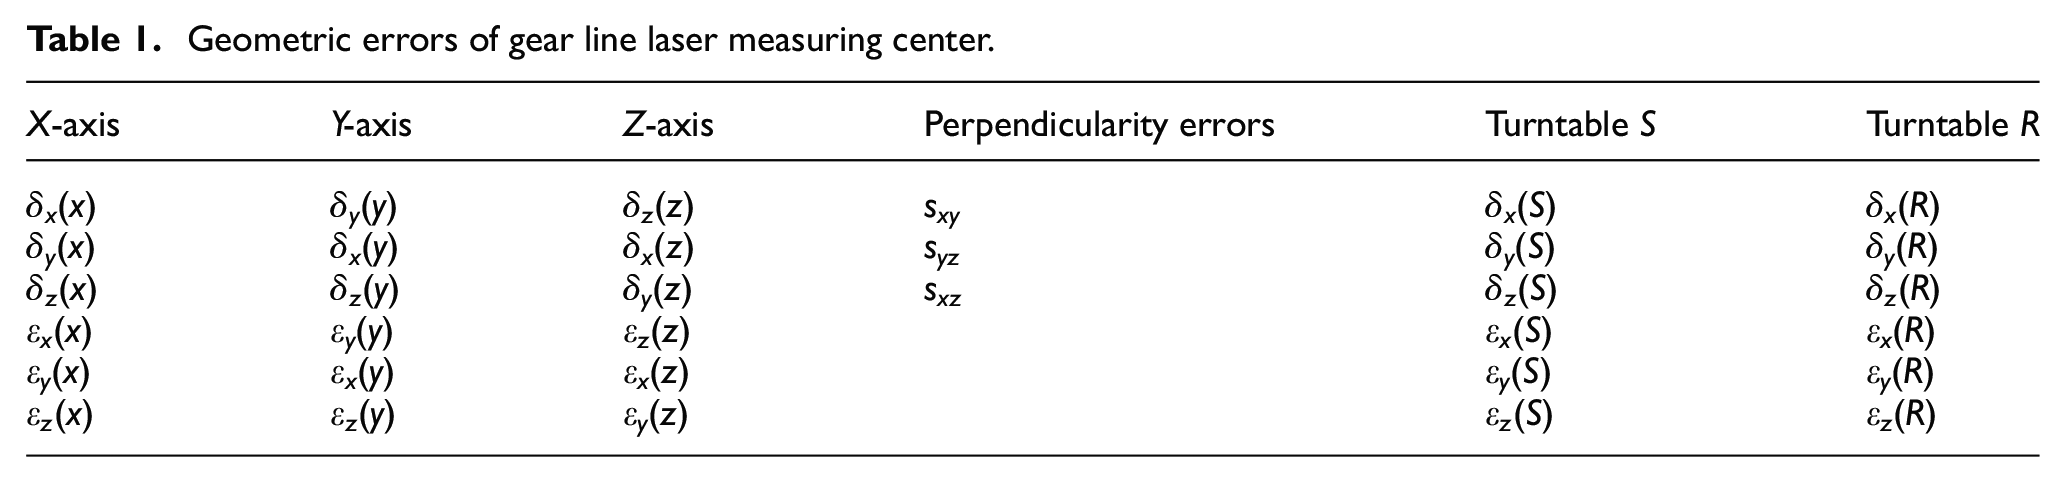
According to ISO 230-1, each linear axis has six geometric errors, including one positioning error, two straightness errors, and three angular errors, namely, roll, pitch, and yaw errors. For x-axis, these errors are expressed as: δx(x), (δy(x), δz(x)), (εx(x), εy(x), εz(x)). Similarly, the y-axis and the z-axis have six geometric errors, corresponding to δy(y), (δx(y), δz(y)), (εx(y), εy(y), εz(y)), and δz(z), (δx(z), δy(z)), (εx(z), εy(z), εz(z)). There are three perpendicularity errors (sxy, syz, szx) between the three linear axes. Each rotary axis also has six geometric errors, including one axial error, two radial errors, one angular positioning error, and two inclination errors. For example, for the turntable R, these errors are expressed as: (δz(R), δx(R), δy(R)), (εx(R), εy(R), εz(R)). Similarly, turntable S has six geometric errors: (δx(S), δy(S), δz(S)), (εx(S), εy(S), εz(S)). In summary, there are 33 geometric errors in LLGMC, as shown in Table 1.
Geometric errors of gear line laser measuring center.
The comprehensive influence of these geometric errors on the measurement results is the spatial error of LLGMC. The transfer model between 33 geometric errors and spatial errors can be established according to multi-body system theory. However, this method is extremely cumbersome and complex, and some geometric errors cannot be measured and separated. According to the relevant calibration specifications of the gear measuring center, the calibration projects of the gear measuring center is not for each geometric error, but rather for the comprehensive errors of the gear and probe after installation. When measuring a batch of gears with the same type, the probe is stationary and its adjustment mechanism can be regarded as a whole. In addition, 33 geometric errors are coupled to one another and finally concentrated as nine installation errors of the probe or gear, including the following: roll angle error Δ θ of the turntable R, installation eccentricity error Δ e of the gear, installation tilt error Δ i of the mandrel shaft, position error Δ x of the probe in x-direction, position error Δ y of the probe in y-direction, position error Δ z of the probe in z-direction, pitch angle error βp of the probe, roll angle error βr of the probe, and yaw angle error βw of the probe. The relationship between 33 geometric errors and nine installation errors is shown in Figure 3; that is, the influence of geometric errors on the measurement result is equivalent to that of installation errors. In summary, during the research and development of LLGMC, putting forward the accuracy requirements for the installation can ensure the instrument’s measurement accuracy. Owing to the modest amount of installation errors, this method is feasible, effective, and in accordance with actual requirements.
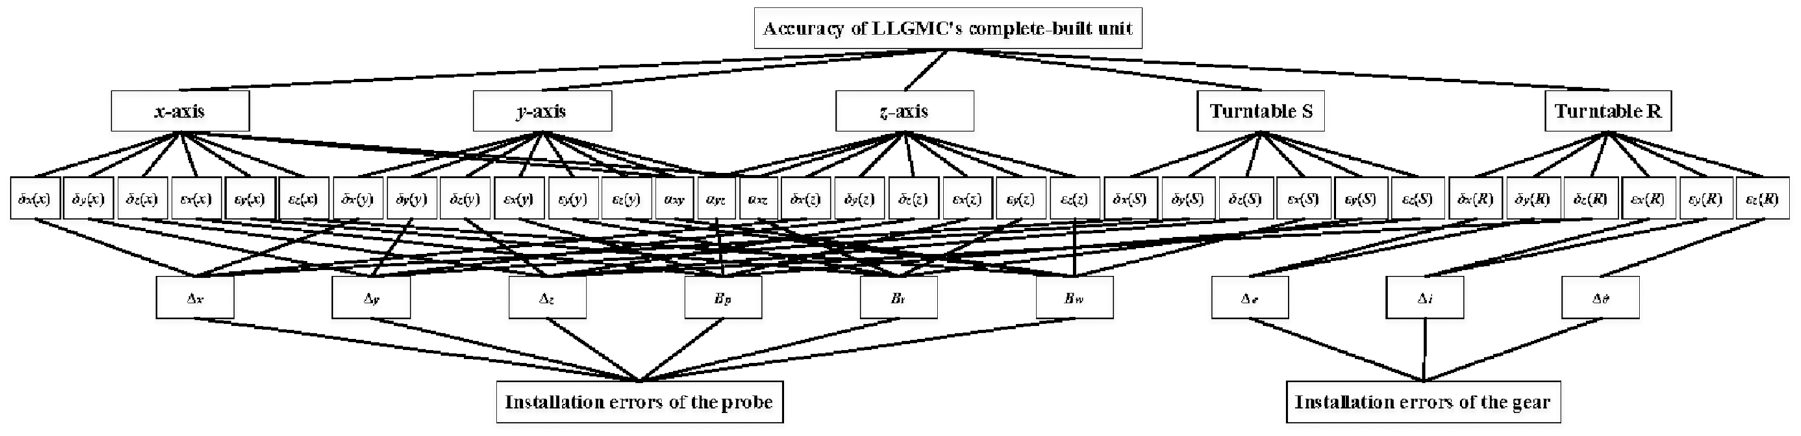
Relationship between geometric errors and installation errors of LLGMC.
Spatial error modeling of LLGMC
LLGMC adopts the principle of active laser triangulation to obtain the height data of the gear surface. The spatial error of LLGMC indicates the deviation value of the actual measurement point in position and attitude relative to the ideal situation. Establishing an accurate spatial error model is the key to achieving accurate distribution and high-precision error compensation.
When an installation error exists in the probe or the measured gear, the change in the relative position of the probe and the measured gear will cause the height change in Yc direction of the incident light from the line laser, as shown in Figure 2, resulting in a spatial error. After the line laser sensor is calibrated, the height of the incident light is the only factor affecting the spatial error of the instrument for a batch of gears with the same type. Therefore, for LLGMC, the installation errors can be uniformly converted into the error in the height of the tooth surface to be measured, that is, the Yc height error of the incident light (referred to as the height error), and then further converted into the spatial error.
Installation errors of the gear
Angle error Δ θ of turntable R
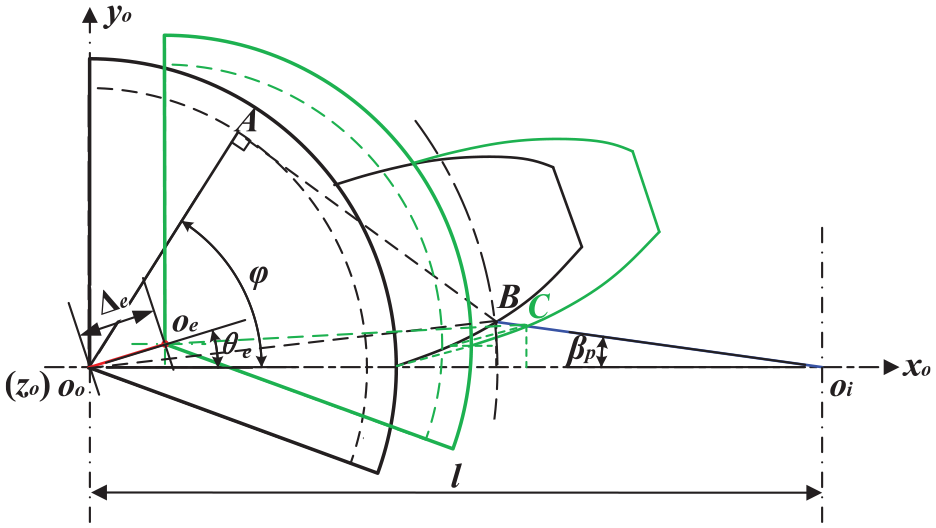
The ideal axis of the standard gear is used as the zo axis, and the connection between the transverse plane center of the gear and the involute start of a specific tooth is used as the xo axis. The right-hand rule determines the yo axis, and the coordinate system oo– xo, yo, zo is established, as shown in Figure 4. Let
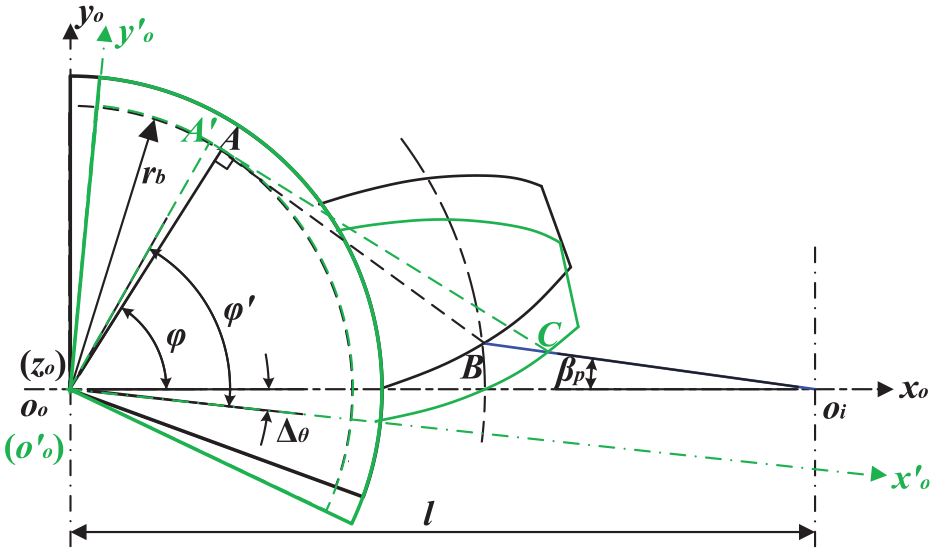
Influence of angle error of turntable R.
In the
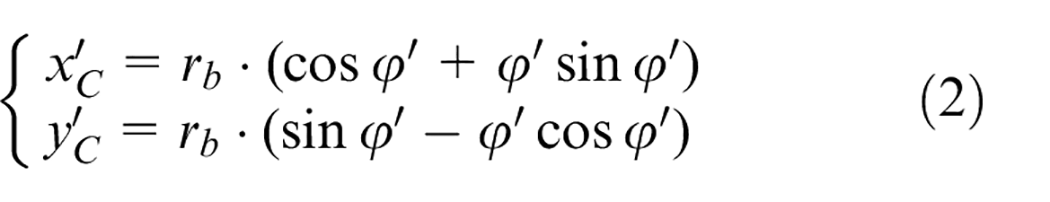
where rb is the radius of the base circle.
In the xoooyo coordinate system, the coordinates (xC, yC) of point C is expressed as:
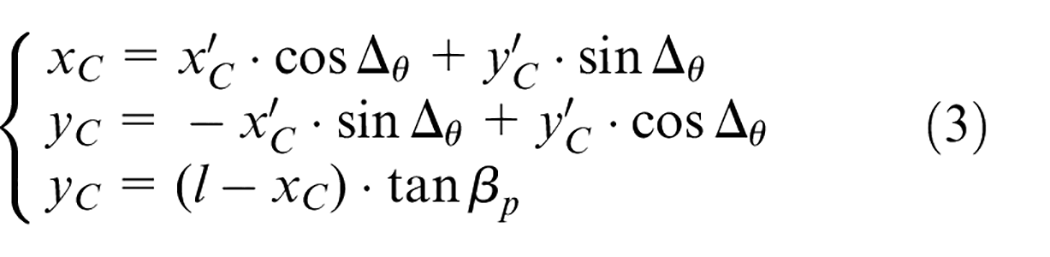
With equations (2) and (3), the coordinates (xC, yC) can be solved.
In the xoooyo coordinate system, the coordinates (xB, yB) of point B are expressed as:
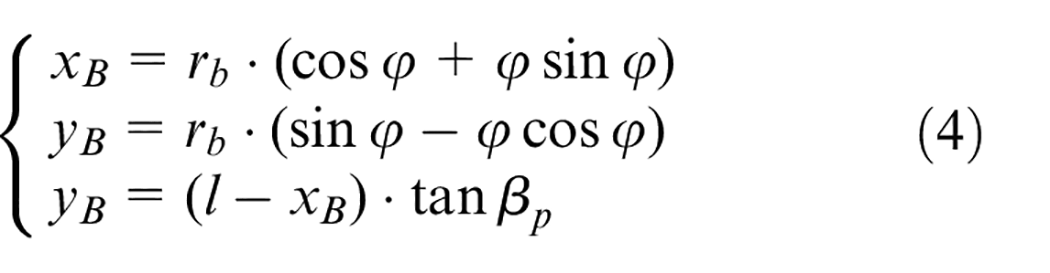
With equation (4), the coordinates (xB, yB) can be obtained.
Subsequently, the height error ΔG1 caused by the roll angle error of turntable R is expressed as follows:
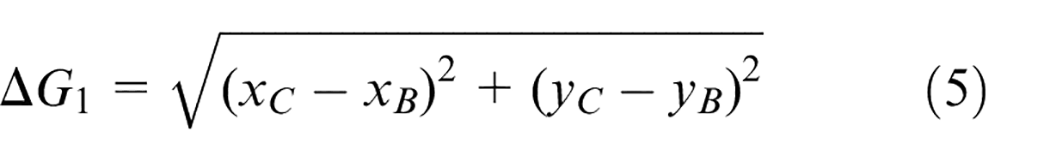
The modeling of some subsequent errors involves the modeling method of the roll angle error of turntable R. Hence, for the convenience of illustration, the height error caused by the roll angle error Δ θ of turntable R is recorded as f(Δ θ ).
Installation eccentricity error Δ e of the gear
The origin of the gear with installation eccentricity is set as oe, the eccentricity amount as Δ e , and the eccentricity angle as θe, as shown in Figure 5.
Influence of installation eccentric error.
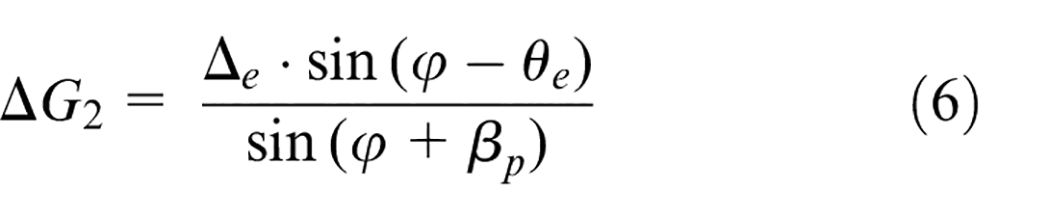
The height error ΔG2 caused by the eccentricity error Δ e is then expressed as:
Tilt error of the mandrel shaft
The mandrel shaft tilt does not change the tilt angle of each measurement point. 26 Therefore, the effect on each gear tooth is the same and any gear tooth can be taken for error analysis.
(a) The mandrel shaft is tilted δi1 in the xooozo plane.
This tilt causes the incident light to shift in xo and zo directions, as shown in Figure 6.
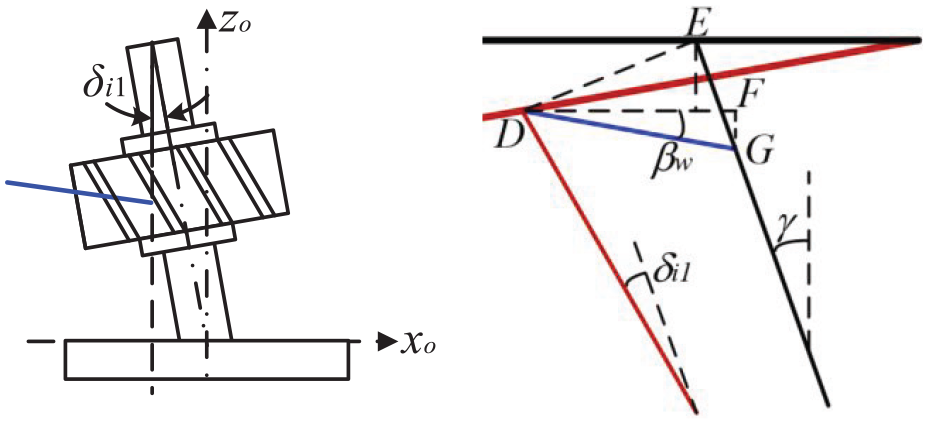
Tilt error of the mandrel shaft in the xooozo plane.
The offsets in xo and zo are respectively expressed as follows:
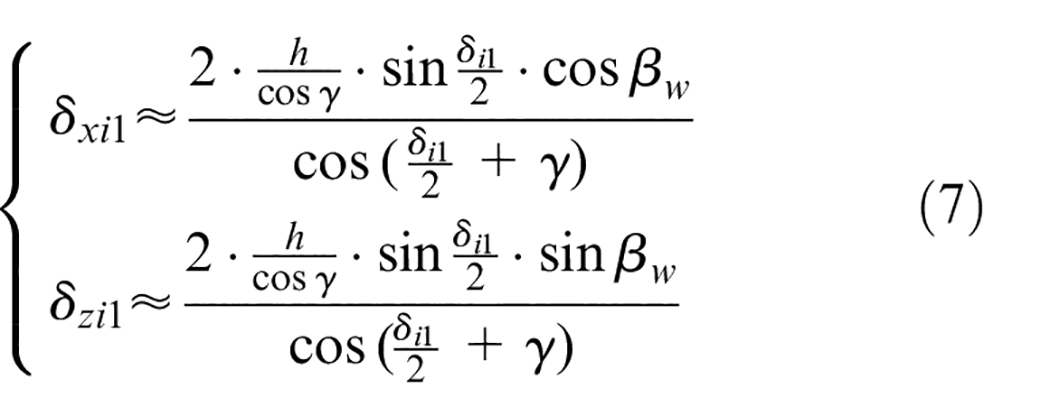
where, βw is the pitch angle of the probe, γ is the helix angle.
The height error caused by δi1 is expressed as:
(b) The mandrel shaft is tilted δi2 in the yooozo plane.
This tilt causes the incident light to shift in yo and zo directions, as shown in Figure 7.
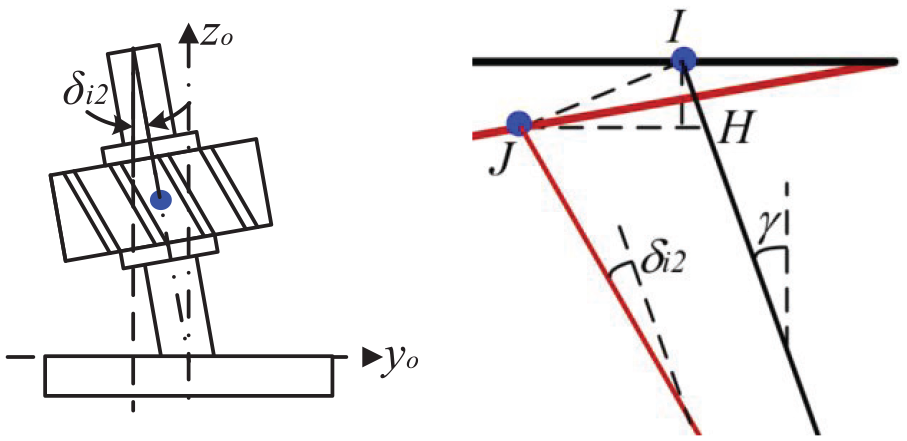
Tilt error of the mandrel shaft in the yooozo plane.
The offsets in yo and zo are respectively expressed as follows:
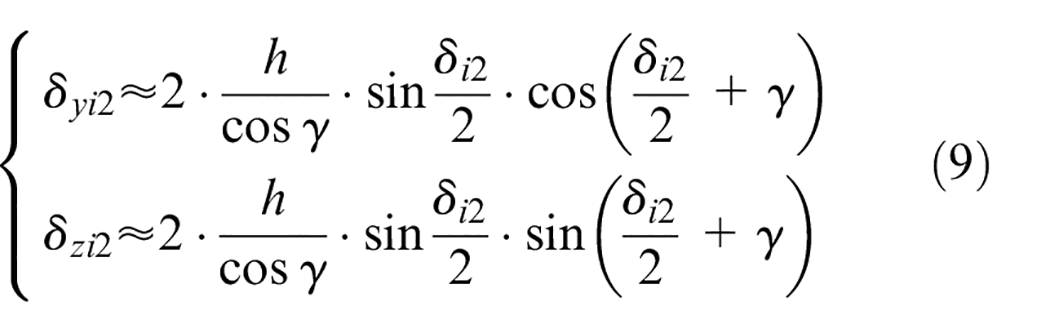
The height error caused by δi2 is expressed as:
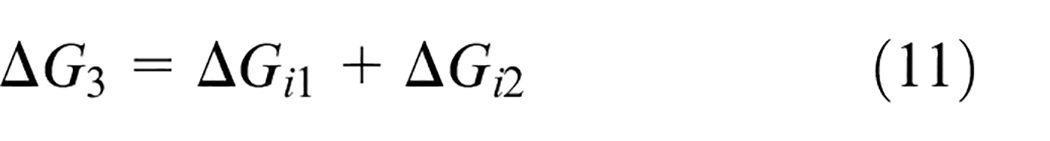
Then the height error caused by the installation tilt error of the mandrel shaft is expressed as:
Installation errors of the probe
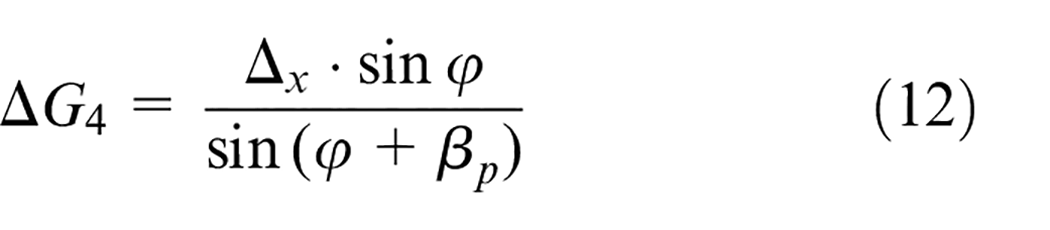
Position error Δ x and Δ y of the probe in xo and yo directions
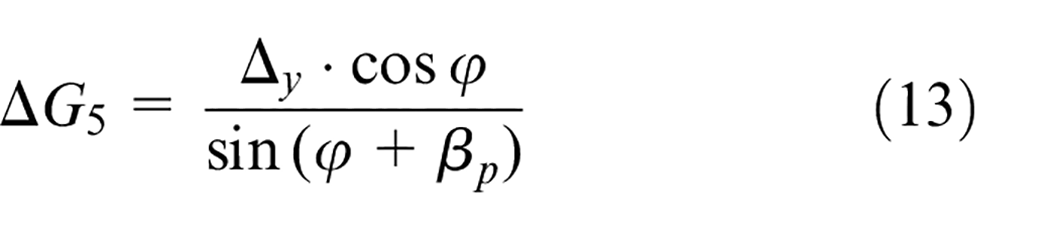
The position error Δ x in xo direction and Δ y in yo direction are the special cases of eccentricity error mentioned in Section 4.1.2. The height error caused by Δ x and Δ y are recorded as ΔG4 and ΔG5, respectively; therefore:
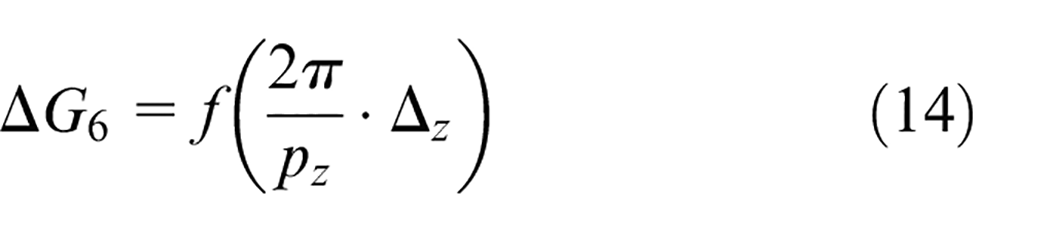
Position error Δ z of the probe in zo-direction
The position error Δ z of the probe in zo direction can be converted to the roll angle error of the turntable R. If pz is the lead, the height error ΔG5 caused by Δ z is expressed as:
Traditional contact probes measure involute profiles in a plane perpendicular to the axis of rotation of gears, without rotating. As previously stated, the light plane of the line laser sensor is at a certain angle to the rotary axis, resulting in the three angle errors of roll, pitch, and yaw.
Roll angle error βr
As shown in Figure 8, Or is the rolling center of the probe, h is the height or evaluation area of the gear, a is the width component of the line laser in the yooozo plane, lr is the zo direction distance between the probe rolling center and the incident light, βr is the angle between the light and the zo axis, and βr is the roll angle error. Point K is the left endpoint of the light, and K1 and K2 are the left endpoints of the light when the probe is in the ideal position and in the position with roll angle error βr.
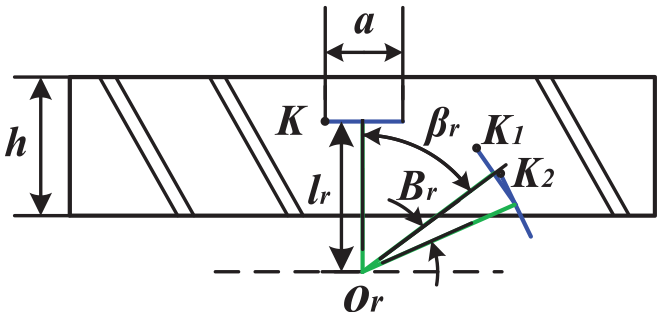
Influence of roll angle error.
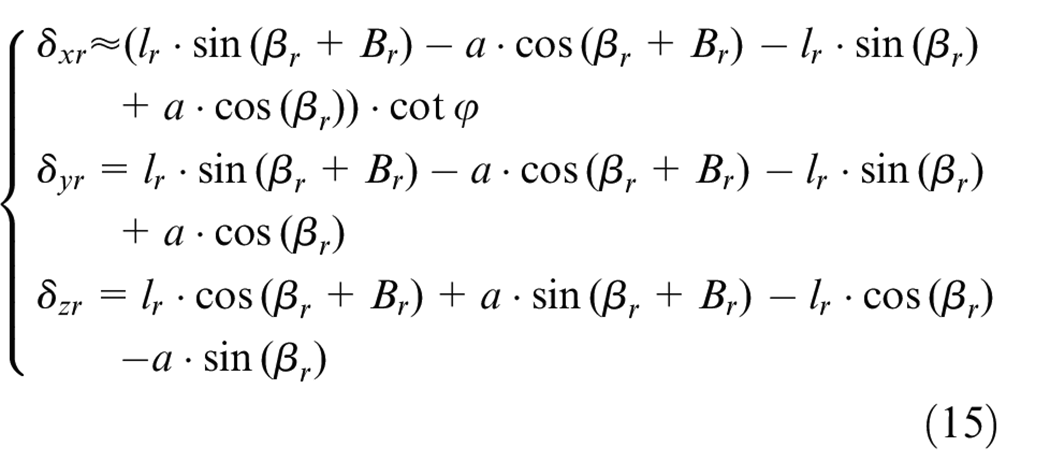
The roll angle error causes the incident light to shift in all three axes. As such, the height error caused by the offset in each axis can be calculated separately and then superimposed.
The offsets in the three axes of xo, yo, and zo are respectively expressed as follows:
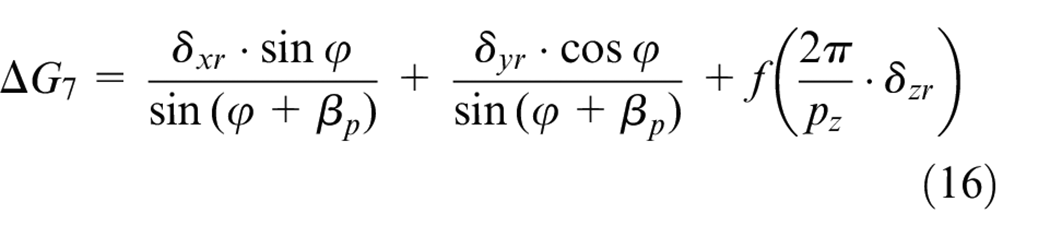
Subsequently, the height error ΔG7 caused by the roll angle error βr is expressed as:
Pitch angle error βw
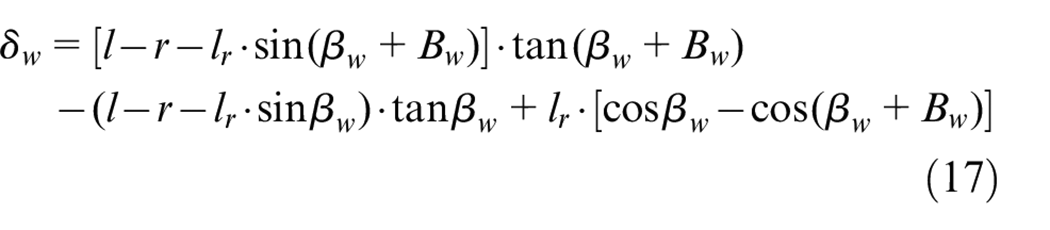
Op is the pitch center of the probe, βw is the angle between the line laser probe and the zo axis, and βw is the angle error. The initial point of incident light with no error and pitch angle error are P1 and P2, respectively, as shown in Figure 9.
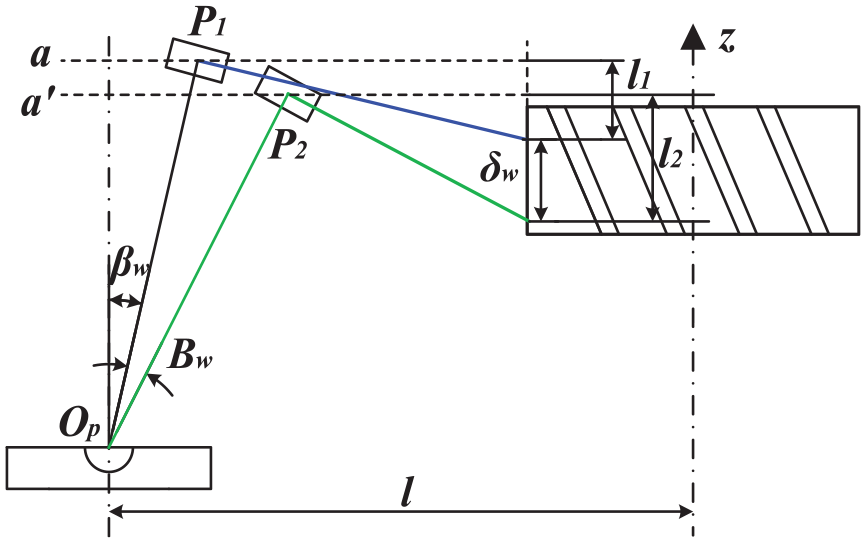
Influence of pitch angle error.
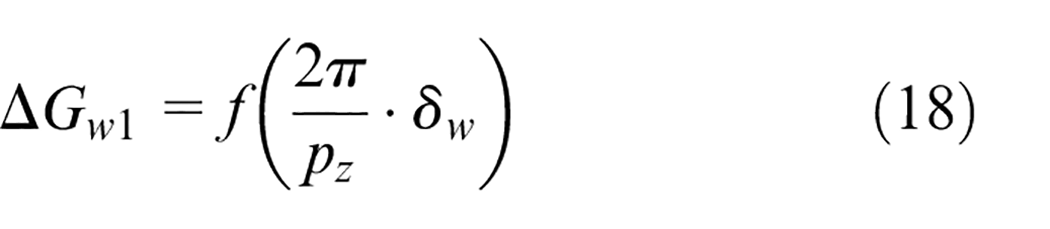
This error can be converted to position error δw in zo direction:
The height error caused by δw is denoted as ΔGw1, so:
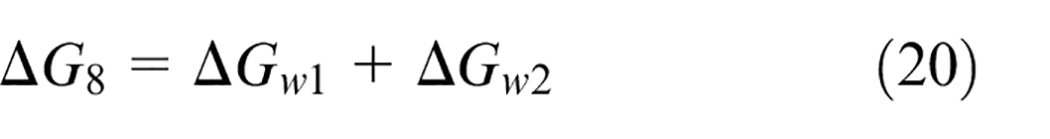
In addition, the change of the probe position from P1 to P2 can cause the height error, which is recorded as ΔGw2:
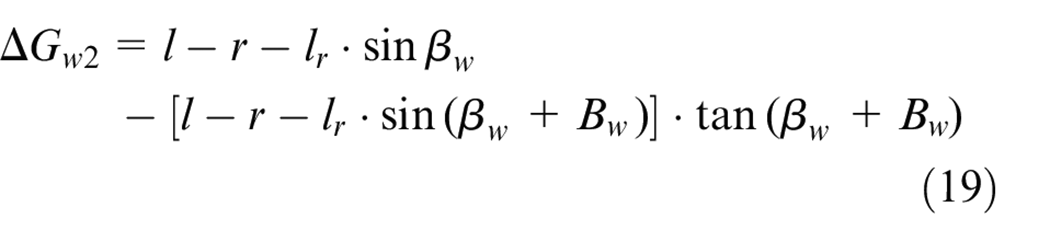
Following, the height error ΔG8 caused by the pitch angle error βw is expressed as:
Yaw angle error βp
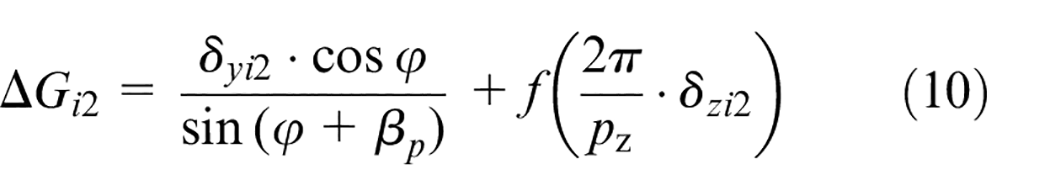
As shown in Figure 10, the height error ΔG8 caused by the yaw angle error βp is expressed as:
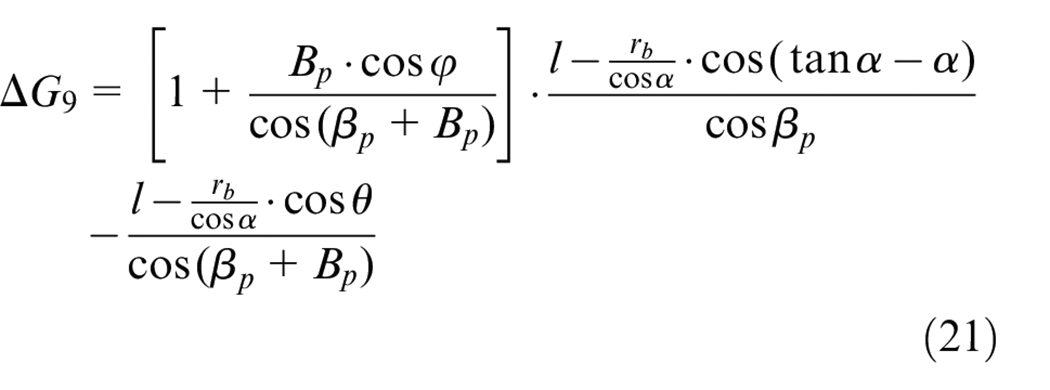
where θ is the involute polar angle of point B.
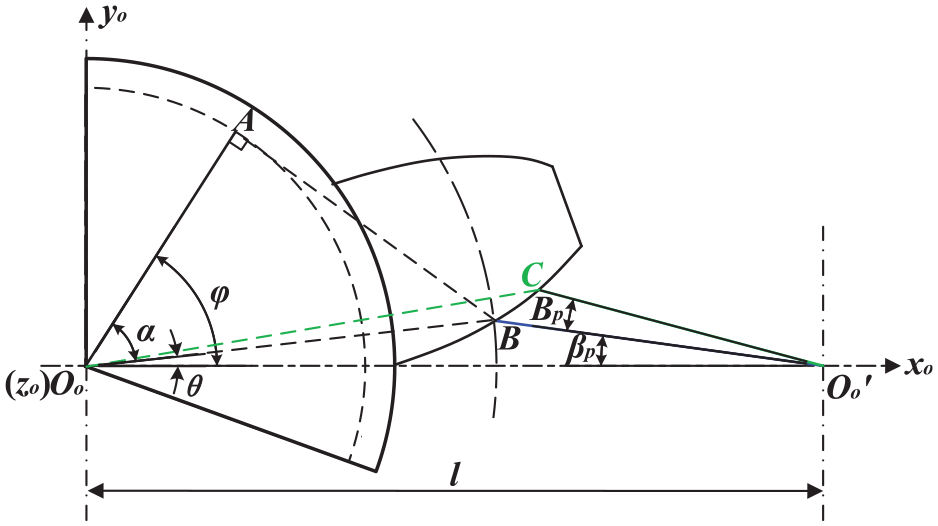
Influence of yaw angle error.
Spatial error modeling
Tooth profile deviation, pitch deviation, and helix deviation are the most common single error detection items of gears. Profile deviation is measured in the transverse plane perpendicular to the involute profile direction. Helix deviation is measured in the direction of the base circle tangent in the transverse plane. Pitch deviation is measured in the circumferential direction close to the middle of the tooth height in the transverse plane. After computation and analysis, installation errors have the same influence trend on each deviation. This study carries out the spatial error modeling and accuracy distribution of LLGMC based on profile deviation modeling due to the length of the article.
Profile deviation refers to the amount by which the actual profile deviates from the design profile, as measured in the transverse plane and perpendicular to the involute profile. In Figure 11, point B is the theoretical intersection point between the incident light and tooth profile in the transverse face, point C is the intersection point between the light and the tooth profile with installation error. βz is the angle between the light and the zo axis, as shown in Figure 12.
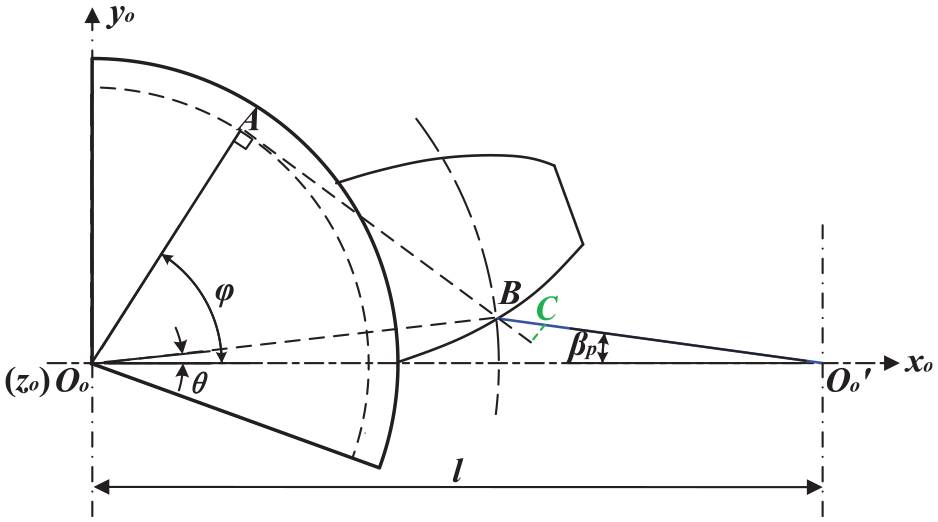
Influence of the incident height error in xoooyo plane.
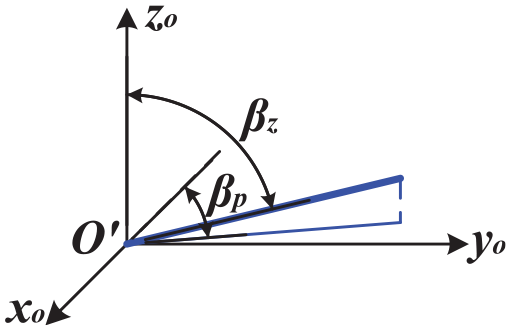
Schematic diagram of laser incident light direction.
The component of the height error caused by each installation error in xoooyo plane is set as ΔGxy. The profile deviation caused by ΔGxy is expressed as:
The component of the height error caused by each installation error in zo direction is set as ΔGz. The profile deviation caused by ΔGz is expressed as:
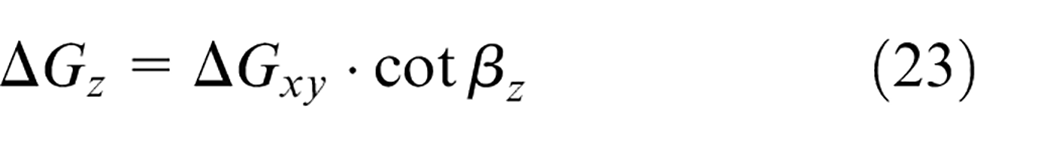
When the measured gear is spur gear, ΔGz causes no profile deviation. When the measured gear is a helical gear, according to the calculation in Section 4.2.2, the profile deviation caused by ΔGz is typically more than two orders of magnitude smaller than that caused by other errors. Therefore, ΔGz is ignored in this article.
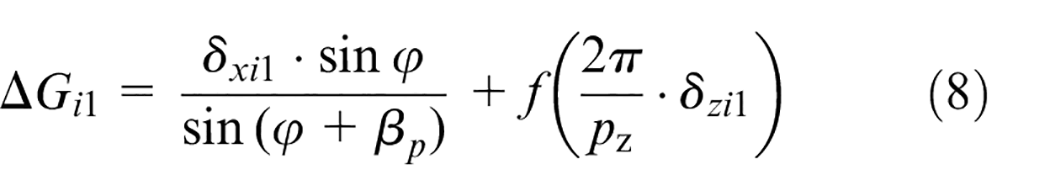
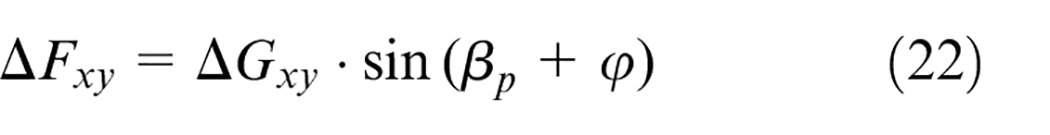
Based on the above analysis, each installation error can be uniformly converted into the height error ΔGi of the line laser in the xoooyo plane. (Note: the height error mentioned above is the height error in the xoooyo plane by default.) Formula (22) can then be used to calculate the tooth profile deviation ΔFi caused by each installation error. Further results for the total deviation of tooth profile caused by nine installation errors are expressed as:
Numerical calculation and accuracy distribution
Parameter selection and value
The line laser gear measuring center can measure the gear modules with a range of 1–5 mm, and an outer diameter of up to 200 mm. The selected line laser sensor has a measurement range of ±8 mm and a reference distance of 60 mm. According to market research, the pre-selection position error is 1 µm, and the rotation angle error is 3.6″, based on the current processing technology and assembly level. After calculation, the changing trend of lr or l and tooth profile deviation is identical. Therefore, within the measuring range of the sensor and under the condition that the structure does not interfere, the values of lr or l should be as small as possible.
Numerical calculation and analysis
For numerical calculation, three helical gears with different moduli (1, 3, and 5 mm) are selected because the tooth profile deviation caused by the installation error varies depending on the gear module. All gears have 40 teeth, a helix angle of 10°, and a pressure angle of 20°. Table 2 displays the preset values for the nine installation errors and the corresponding profile deviation.
Preset installation errors and corresponding profile deviations.
The data in Table 1 demonstrate that as gear modulus increases, the total tooth profile deviation caused by installation error increases. In addition, a significant difference is noted in tooth profile deviation caused by each installation error, providing a basis for the accurate selection of LLGMC’s critical components. (1) For the turntable R, the angle error Δ θ is an sensitive error. For a gear with a modulus of 3 mm, it can create a profile deviation of up to 1 µm, and the influence of amplification is obvious. The weight value of profile deviation caused by this error increases as the gear modulus increases. Thus, this error value must be strictly controlled, especially for gears with large modulus. The primary geometric error correlation term for this installation error is the rotation angle error εz(R) of the turntable R about the zo axis. (2) For the adjustment mechanism of the probe, the position error in the tangential direction Δ y , which causes the profile deviation to reach 0.93 µm, must be considered. The primary geometric error correlation terms of Δ y are straightness error δy(x), δy(z), position error δy(y), and verticality error αxy and αyz, which should be controlled in the accuracy design. However, the position error Δ z and the pitch angle error βw have little influence, and the accuracy can be amplified appropriately.
Accuracy distribution
For gears with a tolerance class of 6; modulus numbers of 1, 3, and 5 mm; and a tooth number of 40, the profile deviation should be controlled within 7.5, 11, and 15 µm, respectively. The error generated by the measurement instrument should be controlled at 1/3, that is, 2.5, 3.67, and 5 µm. Therefore, measuring gears with a small modulus has greater requirements for the instrument’s precision. As the gear module that may be measured with LLGMC is 1−5 mm, the accuracy distribution should be carried out to meet the measurement accuracy of the gear with 1 mm module. That is, the error Δ introduced by the measurement instrument should be controlled within 2.5 µm. Considering that the temperature error Δ t is 1 µm, the optical error Δ g is 2 µm, and the load error Δ l is 0.5 µm, the geometric error calculation formula is expressed as:
The profile deviation caused by the geometric error of the instrument should be controlled at 1 µm. Table 1 demonstrates that when the installation error is preset, the total profile deviation for a gear with a module of 1 mm is 1.25 µm, which does not meet the accuracy requirements and requires accuracy distribution. The specific operation steps consist of (1) preselection, (2) calculation, and (3) adjustment. For the first step, the same accuracy is selected for the same error, and the selection begins as close as possible to the lowest accuracy. In the second step, the preselected values are brought into the spatial error model to calculate the total profile deviation. Regarding the third step, if the calculated total profile error does not meet the instrument’s accuracy requirements, the accuracy value is scaled according to the sensitive error source. The calculation is repeated until the accuracy requirements are reached. As Δ θ and Δ y are error-sensitive terms in LLGMC, the accuracy of these two errors should be enhanced. The accuracy of other indicators must then be improved accordingly. As demonstrated in Table 3, the accuracy distribution of LLGMC should be conclusively determined.
Installation errors and corresponding profile deviations before and after accuracy distribution.
The data in Table 3 demonstrate that after the accuracy adjustment, the total profile deviation caused by the installation error is reduced to 0.96 µm. This outcome meets the accuracy design requirements of the instrument and improves the accuracy by 23.2%.
According to the “Guide to the Expression of Uncertainty in Measurement” (GUM), the complete measurement result should actually include the estimated value and the uncertainty of the measurand. At present, in the research field of measurement uncertainty, the evaluation methods of measurement uncertainty mainly include the Sensitivity Coefficient Analysis (GUM method), the use of calibrated workpieces, and the computer simulation method. 17 Various errors contribute to gear measurement uncertainty. The gear measurement uncertainty is usually substituted as the uncertainty of the instrument, but the gear parameters also have an impact on the gear measurement uncertainty. The uncertainty evaluation model of gear measurement can be established based on Monte Carlo method, which is a method of distribution propagation via the random sampling of a probability distribution. This part will be studied later.
Conclusion
To address the issue of homogeneous coordinate transformation in traditional error modeling, a spatial error modeling method is proposed by considering the adjustment mechanism of the instrument probe as a quasi-static system. Instead of focusing on geometric errors, this method utilizes installation errors as a substitute. These installation errors are then converted uniformly into height errors in the Yc direction of the incident light, leading to the establishment of a single error model and a comprehensive error model. Based on these models, a numerical calculation of error-sensitive sources is conducted, revealing that the angle error (Δ θ ) of turntable R and the tangential position error (Δ y ) of the line laser probe have a significant impact on measurement error. In contrast, the position error (Δ z ) and pitch angle error (Bw) contribute minimally to the measurement error. Using this information, the accuracy distribution of LLGMC is determined. This research provides a theoretical foundation for the structural optimization design and selection of critical components in the design stage of LLGMC. Furthermore, it can also be used for error compensation to improve the accuracy of LLGMC. In future studies, the authors intend to explore the influence of other errors, such as thermal errors and optical errors, on LLGMC, as well as investigate the coupling relationship among all errors.
Footnotes
Author contributions
Writing—original draft preparation, S.Z.; validation, resources, H.Y.; software, Y.L; investigation, J.H.; All authors have read and agreed to the published version of the manuscript.
Declaration of conflicting interests
The author(s) declared no potential conflicts of interest with respect to the research, authorship, and/or publication of this article.
Funding
The author(s) disclosed receipt of the following financial support for the research, authorship, and/or publication of this article: This study is supported by the National Key R&D Program of China 2018YFB2001400, the Key R&D Program of Anhui province 202004a07020046.
Data availability statement
Not applicable.