
Abstract
Batch process quality-related fault detection is necessary for keeping operation safety and quality consistency. However, the process variables have a weak ability to explain the quality variables makes the batch process quality-related fault detection a difficult task. In this work, a multi-way orthogonal signal correction enhanced total principal component regression (MOSC-ETPCR) is proposed to achieve the nonlinear quality-related fault detection of the batch process. First, after batch process data expansion, the orthogonal signal correction algorithm is used to filter out the quality-irrelevant information in process variables and avoid the influence of quality-irrelevant data on process modeling. Secondly, the nonlinear characteristics of the process are extracted by the maximum information coefficient matrix, and the quality-related nonlinear regression model is constructed to ensure the maximum correlation between the extracted features and quality variables. Thirdly, the statistics and corresponding control limits are established based on the obtained regression model. Finally, the effectiveness of the MOSC-ETPCR algorithm was verified by numerical simulation and the penicillin fermentation process.
Keywords
Introduction
As one of the important production modes in the modern manufacturing industry, the batch process has occupied a major position in fine chemical, biopharmaceutical, semiconductor, and other industries, and has become a research hotspot. 1 Principal component analysis (PCA), partial least squares (PLS), and other related multivariate statistical methods are widely used in process fault detection.2–5 The multivariate statistical methods are becoming more and more mature in fault detection and diagnosis. As a guaranteed stage of the manufacturing level, quality-related process monitoring technologies have attracted widespread attention from industry and academia. But in actual industrial production, the measurement of quality variables always lags behind the detection of process variables. Therefore, in the data-driven process monitoring method, the correlation between process variables and quality variables is used to reveal the fault conditions of quality variables through process variables, which can avoid many unnecessary problems in production.6–8
The batch processes data are composed of batches, variables, and sampling points. Traditional fault detection methods require data preprocessing with multi-way unfolding tricks before modeling. Such as multiway PCA, multiway PLS, 9 multiway modified kernel slow feature analysis. 10 Those methods are used to solve the static, linear, and single-phase, rather than dynamic, nonlinear, and multi-phase characteristics of the batch process. Therefore, Zhang et al. 11 proposed a method to explore the dynamic and static characteristics in process statuses identification. Hui and Zhao 12 proposed a method that considered the nonlinear and dynamic in batch process monitoring. Zhu et al. 13 proposed a dynamic time-slice multi-stage batch process monitoring method, dynamic behaviors of each phase can be captured from both single batch run and batch-to-batch evolutions.
To ensure operation safety and quality reliability, it is necessary to detect faults related to process quality. The quality-related fault can be detected by establishing a supervision relationship between quality variables and process variables. 14 For the quality-related batch process monitoring, Peng et al. 15 proposed a hybrid method combining PCR and Bayesian inference to identify the fault. Jiang et al. 14 proposed a quality-related process monitoring method based on optimized sparse partial least squares. Peng et al. 16 proposed an over-complete independent component analysis method for non-Gaussian and non-linear quality-related batch process monitoring. Zhu et al. 17 proposed concurrent CCA to monitor process-related and quality-related faults respectively. Considering the changes of statistical values or relationships between quality variables and process variables, a quality-related fault detection method based on the statistical model and regression coefficient 18 was proposed, linear regression coefficient and mutual information are used to establish the nonlinear and linear relationship between quality variables and process variables. Wang et al. 19 proposed a method to divide KPI-related process variables into linear and nonlinear parts by using OSC, and established a monitoring model for the nonlinear part. Wang and Jiao 20 proposed a method to divide process variables into quality-related and quality-unrelated subspaces and use TPCR for fault detection. These two methods are not sufficient to extract the nonlinear characteristics of process data. Zhao et al. 21 proposed a quality weakly related fault detection method based on weighted dual-step feature extraction. However, the nonlinear characteristics of separated data are not considered.
In the detection of batch process quality-related faults, the above methods do not consider filtering out variables that are not related to quality in the process variables, in addition, the quality-related nonlinear characteristic of the batch process is not fully characterized. For the nonlinear batch process, this paper uses an orthogonal signal correction algorithm to filter out the components that are irrelevant to quality variables in the process variables, and then the maximum information coefficient square matrix is used to extract nonlinear features. Then, the regression model is established, and the process space is divided into quality-related and quality irrelevant subspace, and the statistics are established respectively. The kernel density estimation (KDE) is introduced to determine the control limit of fault detection.
Principal component regression (PCR)
The core of PCR algorithm is to extract the score matrix through principal component analysis (PCA) algorithm, and then establish the regression relationship between the quality matrix and the score matrix through least squares. Taken a set of data samples whose number of input variables is m and sample length is r, the input matrix can be expressed as
After the process variable matrix

Where,
The regression relationship between the score matrix

The predicted value

Multi-way orthogonal signal correction enhanced total principal component regression algorithm (MOSC-ETPCR)
Preprocessing of batch process data
The three-dimensional data matrix
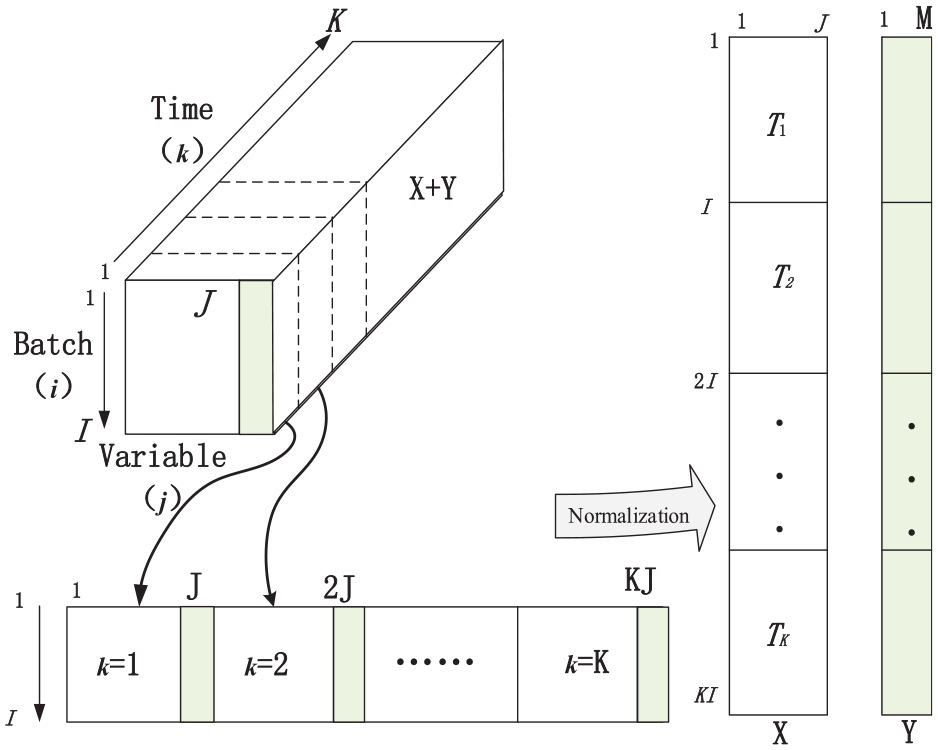
Hybrid expansion of 3D data in batch process.
Selection of quality-related features
Due to the existence of components with orthogonal to the quality variable

Where

We need to judge whether
Finally, the quadrature signals are subtracted from X, and equation (6) is obtained:

Equation (6) is the process variable that is non-orthogonal to the quality variable after being corrected by the quadrature signals.
Enhanced total principal component regression (ETPCR) algorithm
The process variables and quality variables corrected by the orthogonal signals are used to establish a PCR model. The covariance matrix used in the calculation of PCA decomposition can only measure the linear relationship between features and cannot measure other nonlinear relationships, the square of the maximum information coefficient (MIC) 23 matrix is used to replace the covariance matrix for nonlinearity feature extraction, which not only enhances the correlation between the extracted features and quality variables, but also solves the nonlinear relationship between variables. The MIC value of the two variables is shown in equation (7).

In order to verify MIC’s measurement of variable correlation, the following variables are selected for further illustration. As shown in Figure 2, the variable
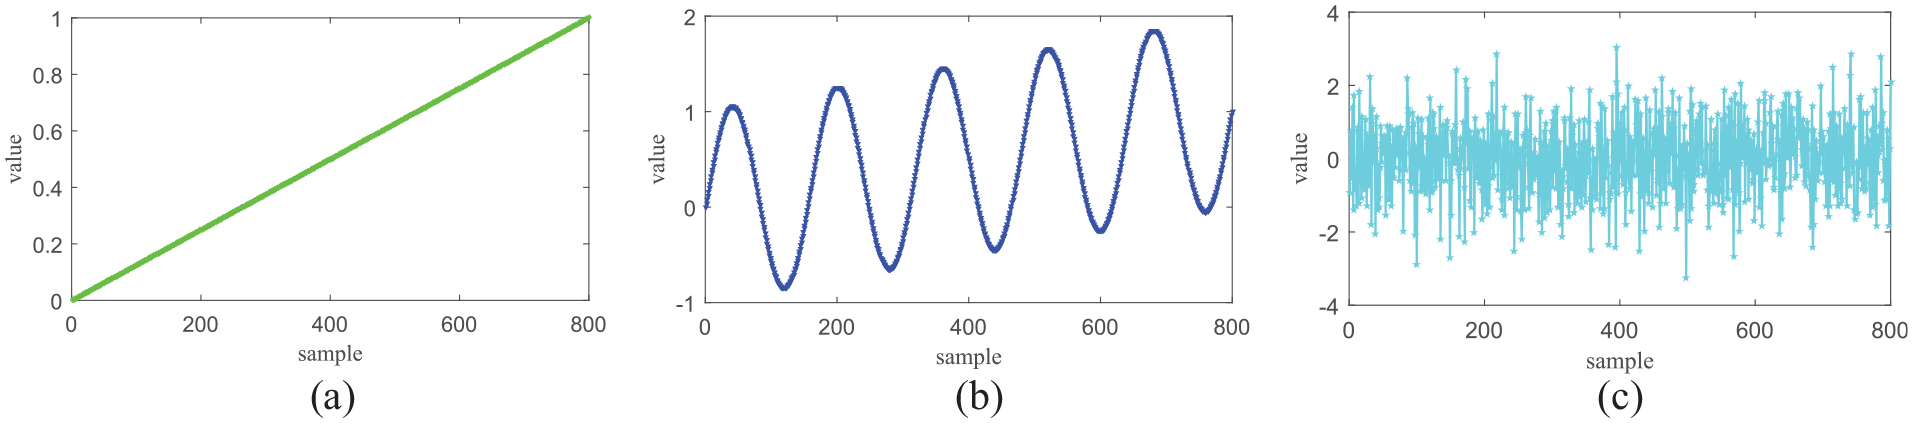
The test variables: (a)
MIC is used to test the correlationship of x and y, x and z. The result of MIC(x,y)=1, this shows that x and y have a strong correlation, and also can detect nonlinear correlation. The result of MIC(x, y) = 0.0448, this means that x and z are unrelated. The results are consistent with the actual situation, indicating that MIC has a good discriminant ability of variable correlation.
The maximum information coefficient matrix for the process variable corrected by the orthogonal signal is calculated, namely
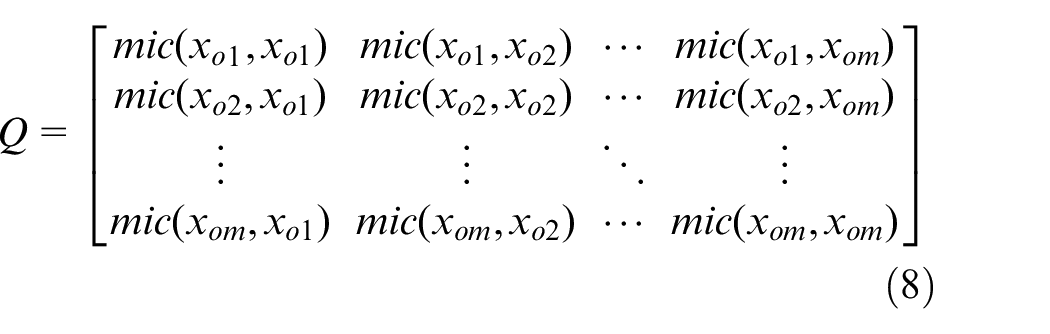
Taken the square term of Q and marked

According to (1), the principal component
Then quality prediction matrix is:

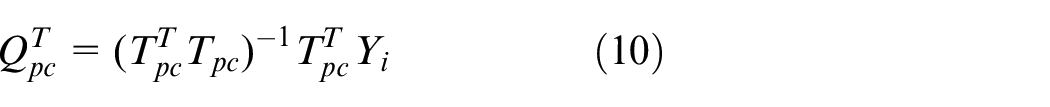
The total principal component regression processing method is used to continue to extract the part directly related to
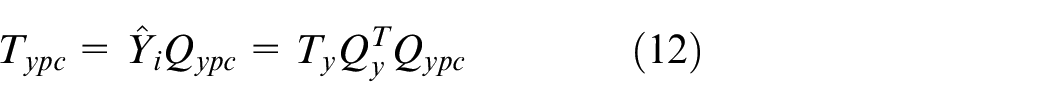
Least squares regression on
From the (1), the quality-related part is shown in equation (14).

The corresponding quality-independent part is shown in equation (15).

That is, process variables
Batch process quality related fault detection based on MOSC-ETPCR
After the normal batch data is preprocessed, the orthogonal signal correction algorithm is used to filter out the components which are orthogonal to the quality variables in the process variables. Then the quality correlation relationship is established and processed by the total principal component regression method. Variables are decomposed into quality-related and quality-irrelevant subspaces. The

Similarly, the

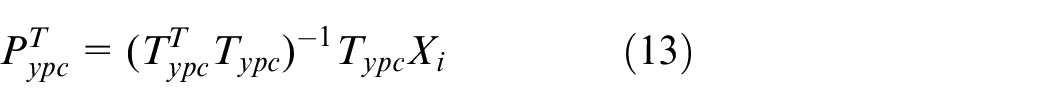
Usually, the assumption of Gaussian distribution needs to be met when the control limit is calculated, but the actual process data is non-Gaussian, so the kernel density estimation (KDE)
24
is introduced to obtain the control limit

Where
Generally, window width has an important influence on kernel density estimation, and the optimal window width is related to sampling points, data distribution characteristics, kernel function selection, etc. In this paper, the method of optimal window width is adopted, namely Mean Integrated Squared Error (MISE) method.
25
Here, the Gaussian kernel function
Offline modeling of batch process based on MOSC-ETPCR
Step 1: Select a three-dimensional data training sample
Step 2: Rearrange the standardized
Step 3: Perform orthogonal signal correction processing for each process variable
Step 4: Calculate the square matrix of the maximum information coefficient for the corrected process variables, as shown in equation (9), establish the ETPCR model, and determine that the quality-related subspace
Step 5: Construct quality-relevant and quality-irrelevant statistics
Step 6: Using KDE to solve the control limits of statistics
Online monitoring of batch process based on MOSC-ETPCR
Step 1: Collect online data, and use the mean and standard deviation of the offline modeling process for standardization;
Step 2: Perform projection according to the ETPCR model established in the offline process;
Step 3: Calculate
Step 4: Monitor whether the statistics exceed the control limits. If the
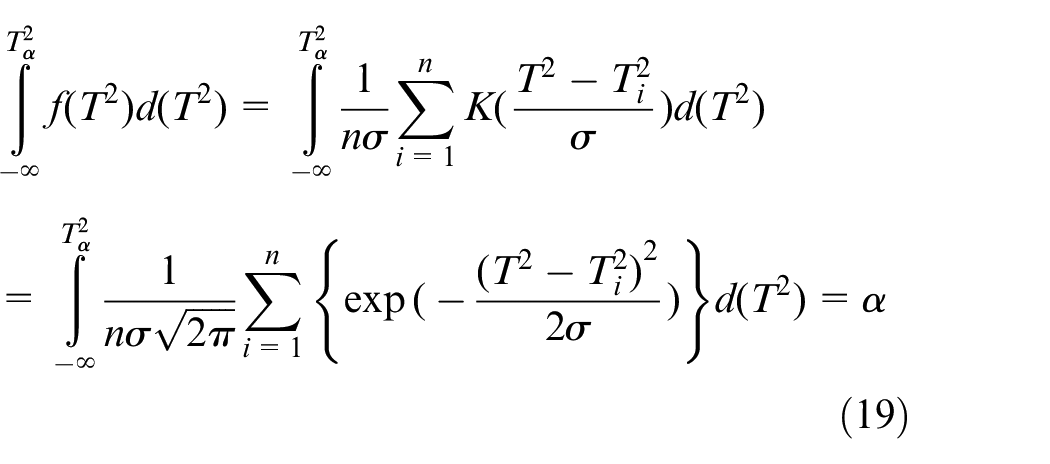
Figure 3 is the flow chart of quality-related fault detection based on MOSC-ETPCR.
Flow chart of quality-related fault detection based on MOSC-ETPCR.
Experimental verification and analysis
This paper introduces two cases to verify the effectiveness of the MOSC-ETPCR algorithm. One is a numerical simulation of nonlinear batch process, the other is the typical penicillin fermentation process. To prove the effectiveness of the proposed algorithm, the quality-related fault detection method of batch process, such as Multiway PLS (MPLS), multiway total principal component regression (MTPCR), multiway modified PLS (MMPLS), multiway expectation maximization partial robust m-regression (MEMPRM), 26 are selected. These methods are based on quality-related subspace and quality-unrelated subspace to establish regression models. MPLS, MMPLS, MTPCR, MEMPRM, and MOSC-ETPCR algorithm are applied to these two cases to compare and analyze the fault detection effects.
Numerical simulation example
In the experiment, eight process variables and one quality variable are selected as numerical simulation examples. The entire numerical system is expressed as equation (20).
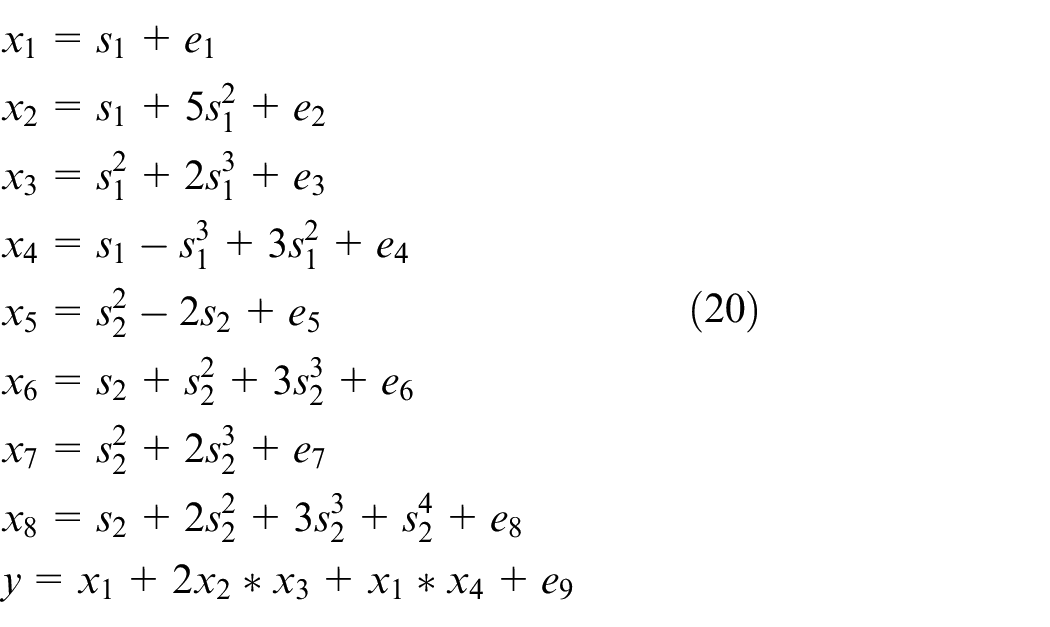
Where,
MPLS, MMPLS, MTPCR, MEMPRM, and MOSC-ETPCR algorithms are used in the numerical simulation example for fault detection, the fault detection result can be seen in Figure 4, the blue wave lines between 0 and 100 sample points represent normal process data, the red solid line represents the control limit, and the purple-red dashed line represents the fault detection effect after adding a fault. The fault detection effect of MPLS algorithm is shown in Figure 4(a). It can be seen that the
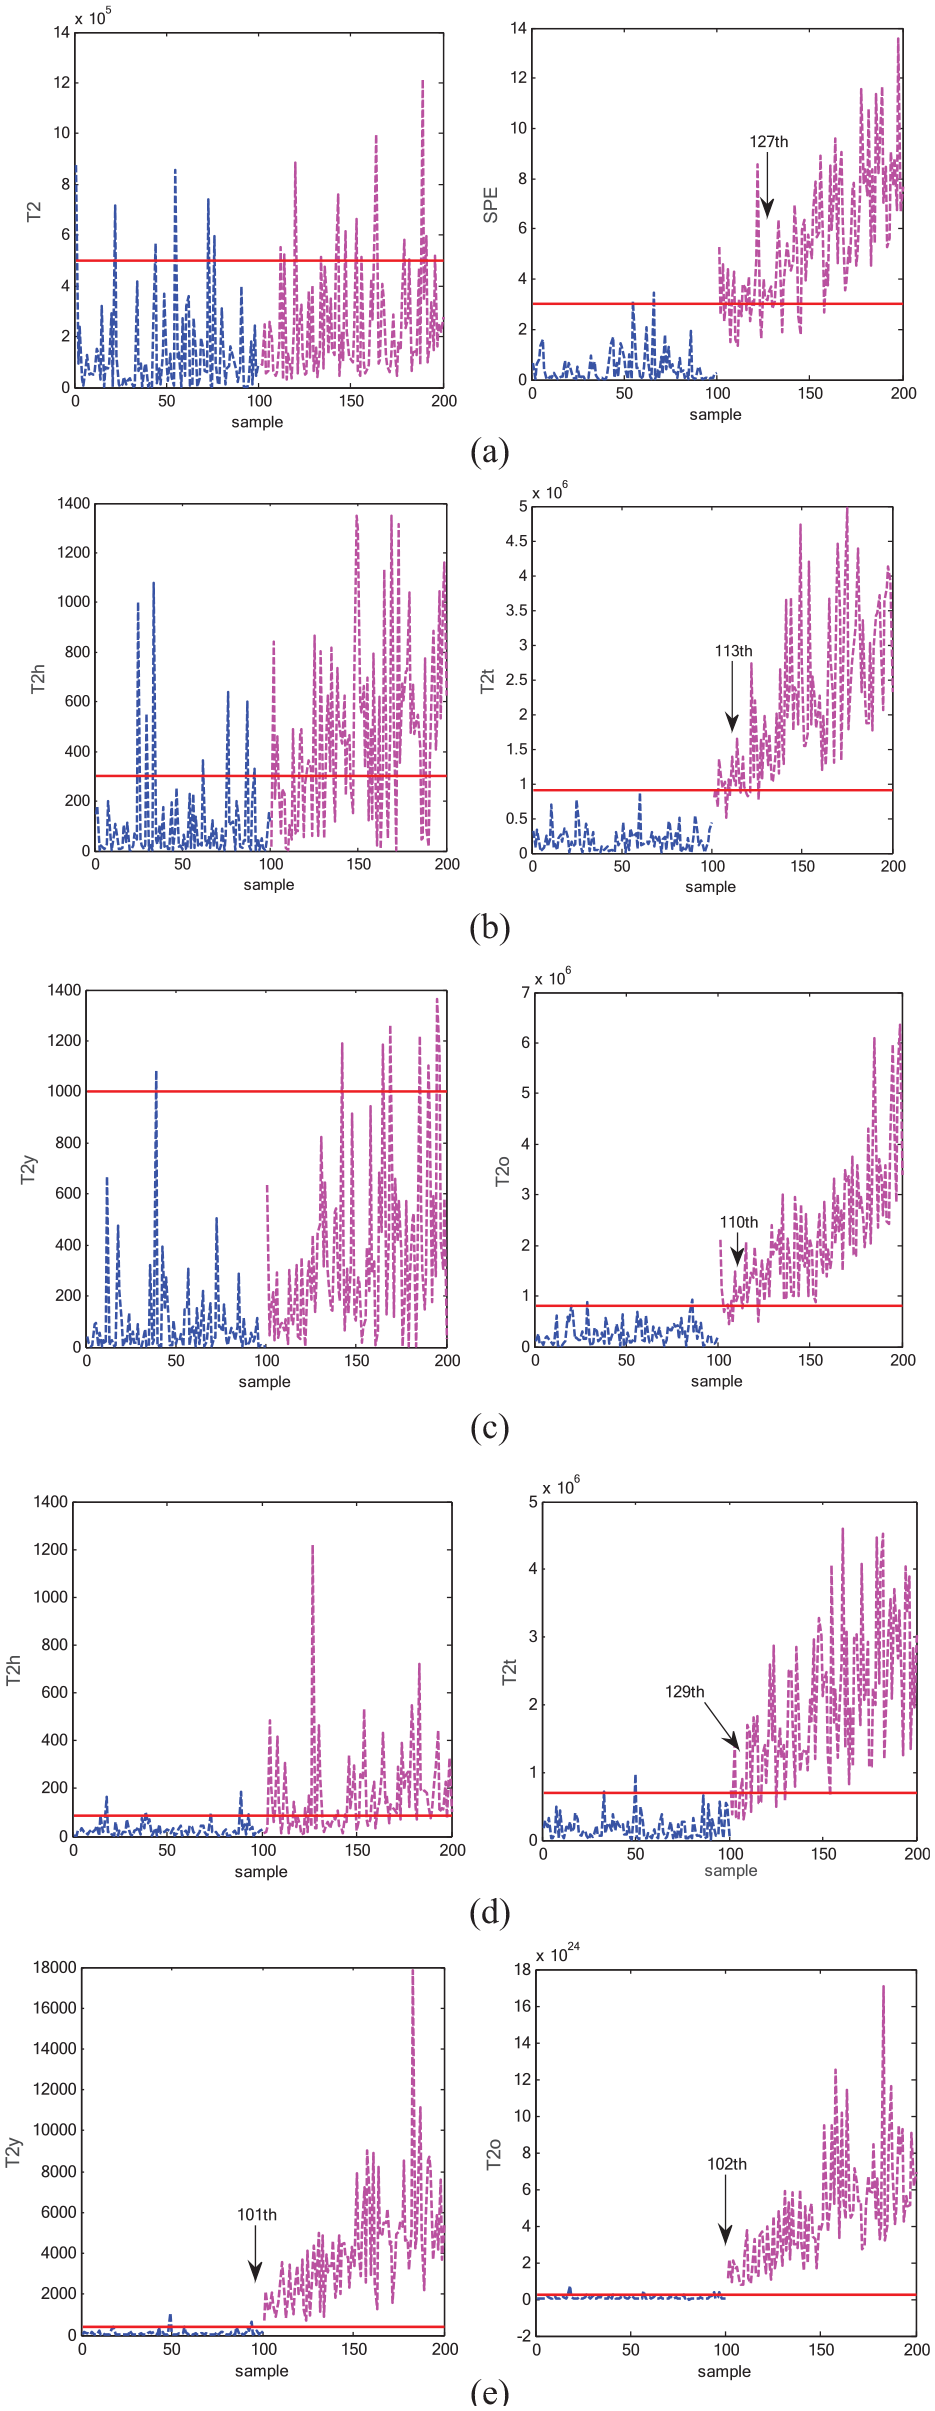
Fault detection results of numeric process test data: (a) MPLS, (b) MMPLS, (c) MTPCR, (d) MEMPRM, and (e) MOSC-ETPCR.
Penicillin fermentation process
In order to further verify the effect of MOSC-ETPCR method, the typical batch process penicillin fermentation experiment was introduced to verify the fault detect effect. 27 Generally, the penicillin fermentation process consisted by three stages, the first stage is the cell growth (1–50 h), the reaction time is short and the process is relatively stable. The second stage is the penicillin synthesis stage (51–290 h). The third stage is the autolysis stage (291–400 h), the reaction process is relatively stable and lasts a short time. In these three stages, the main factors affecting penicillin fermentation efficiency are dissolved oxygen concentration, substrate concentration, pH, and temperature.
The Pensim2.0 simulation platform 28 was used to test fault detection effect. Figure 5 shows the flow chart of penicillin fermentation.
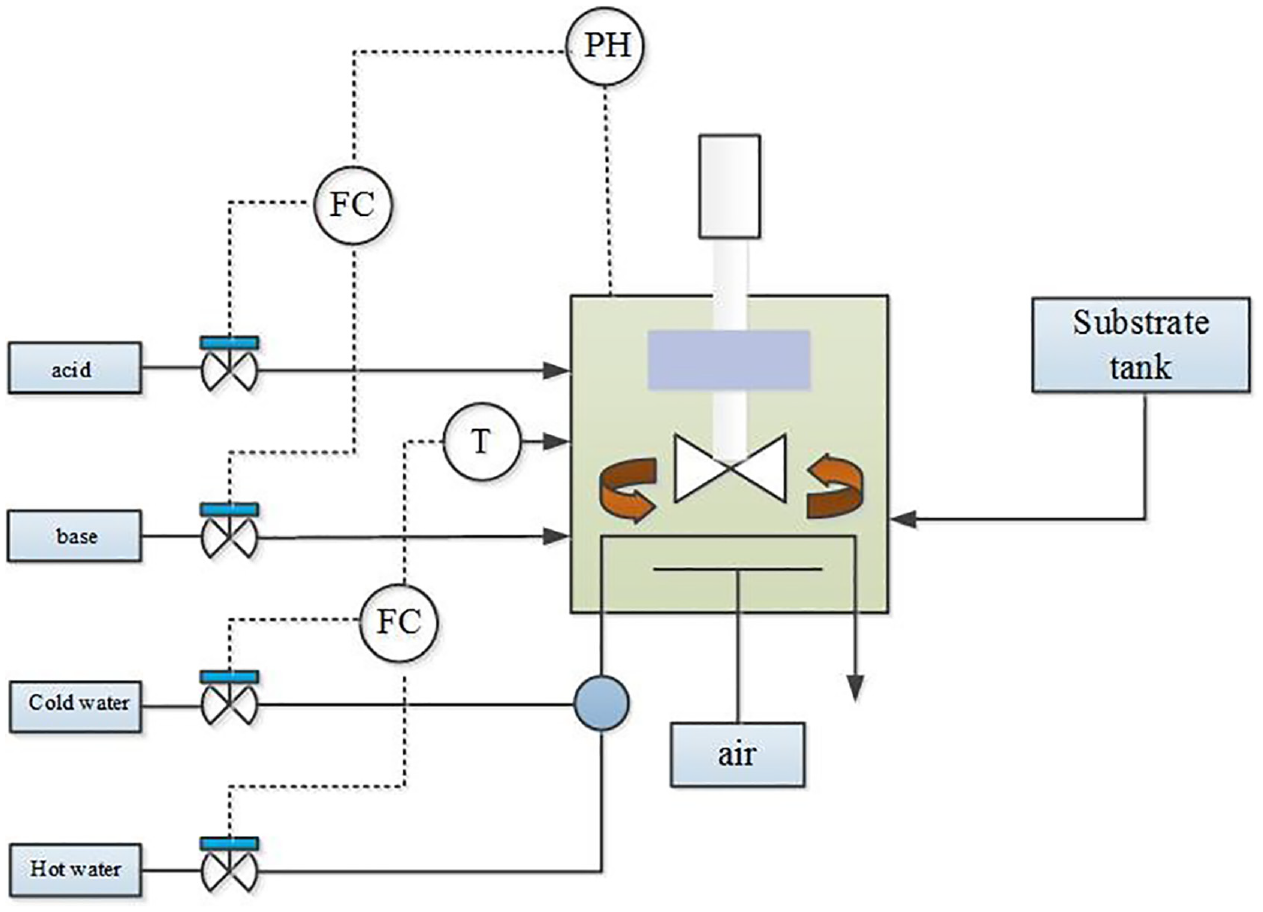
Reaction flow chart of the penicillin fermentation process.
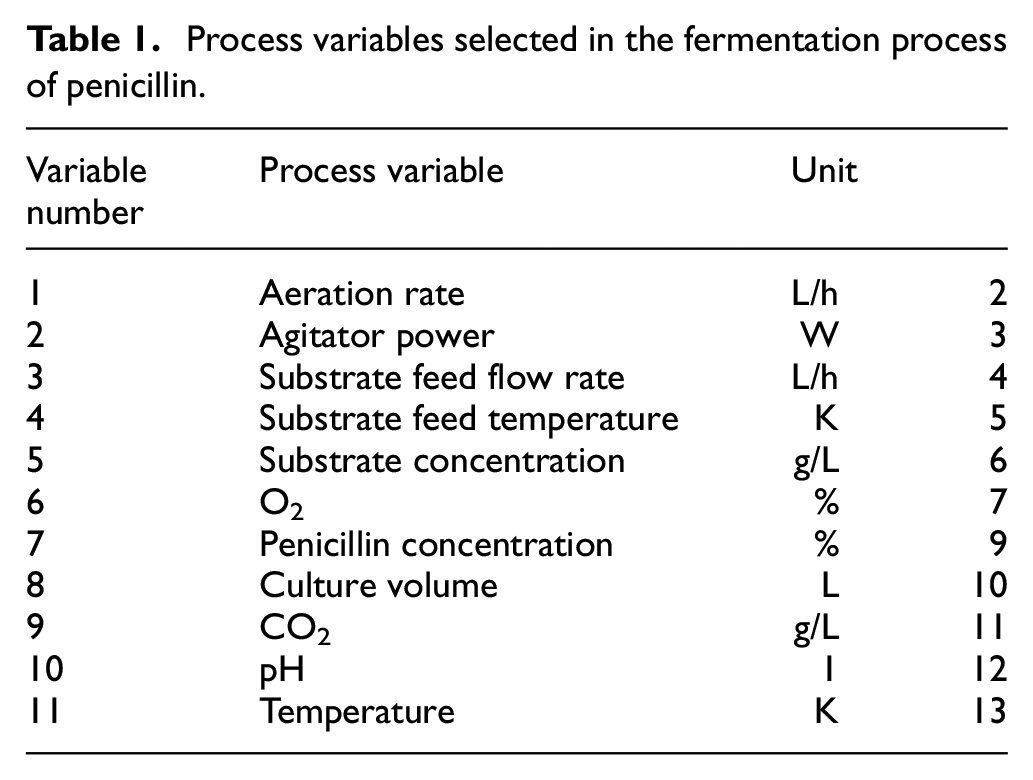
The fermentation time of penicillin is 400 h per batch, and the sampling time is 1 h. Thirty normal batches are used for experiment. The observation data of 11 measurement variables are selected (as shown in Table 1), and the product concentration are the quality variables, so the training data
Process variables selected in the fermentation process of penicillin.
Types of faults added in the fermentation process of penicillin.
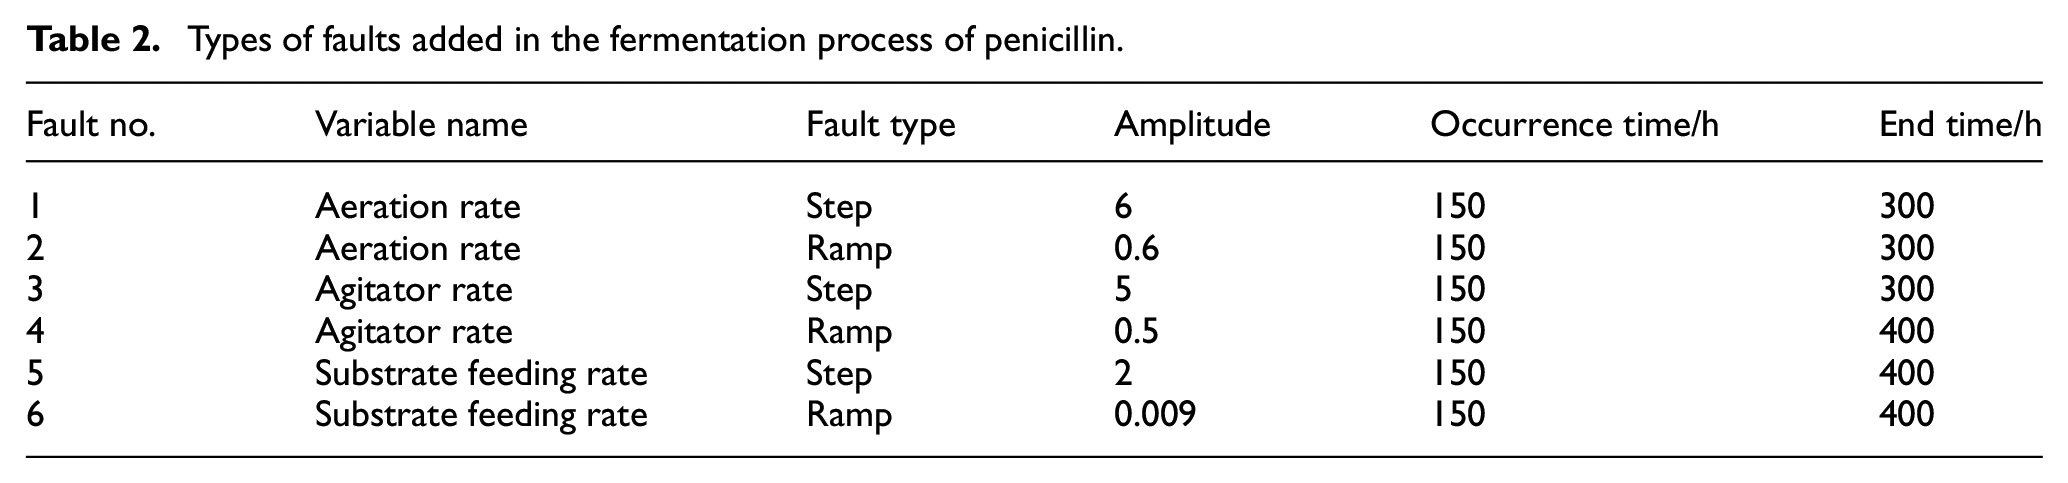
Figure 6 is the fault detection effect diagram of MPLS, MMPLS, MTPCR, MEMPRM, and MOSC-ETPCR algorithms under fault 1. Fault 1 is a step fault with a fault amplitude of 6 added between 150 and 300 h. The
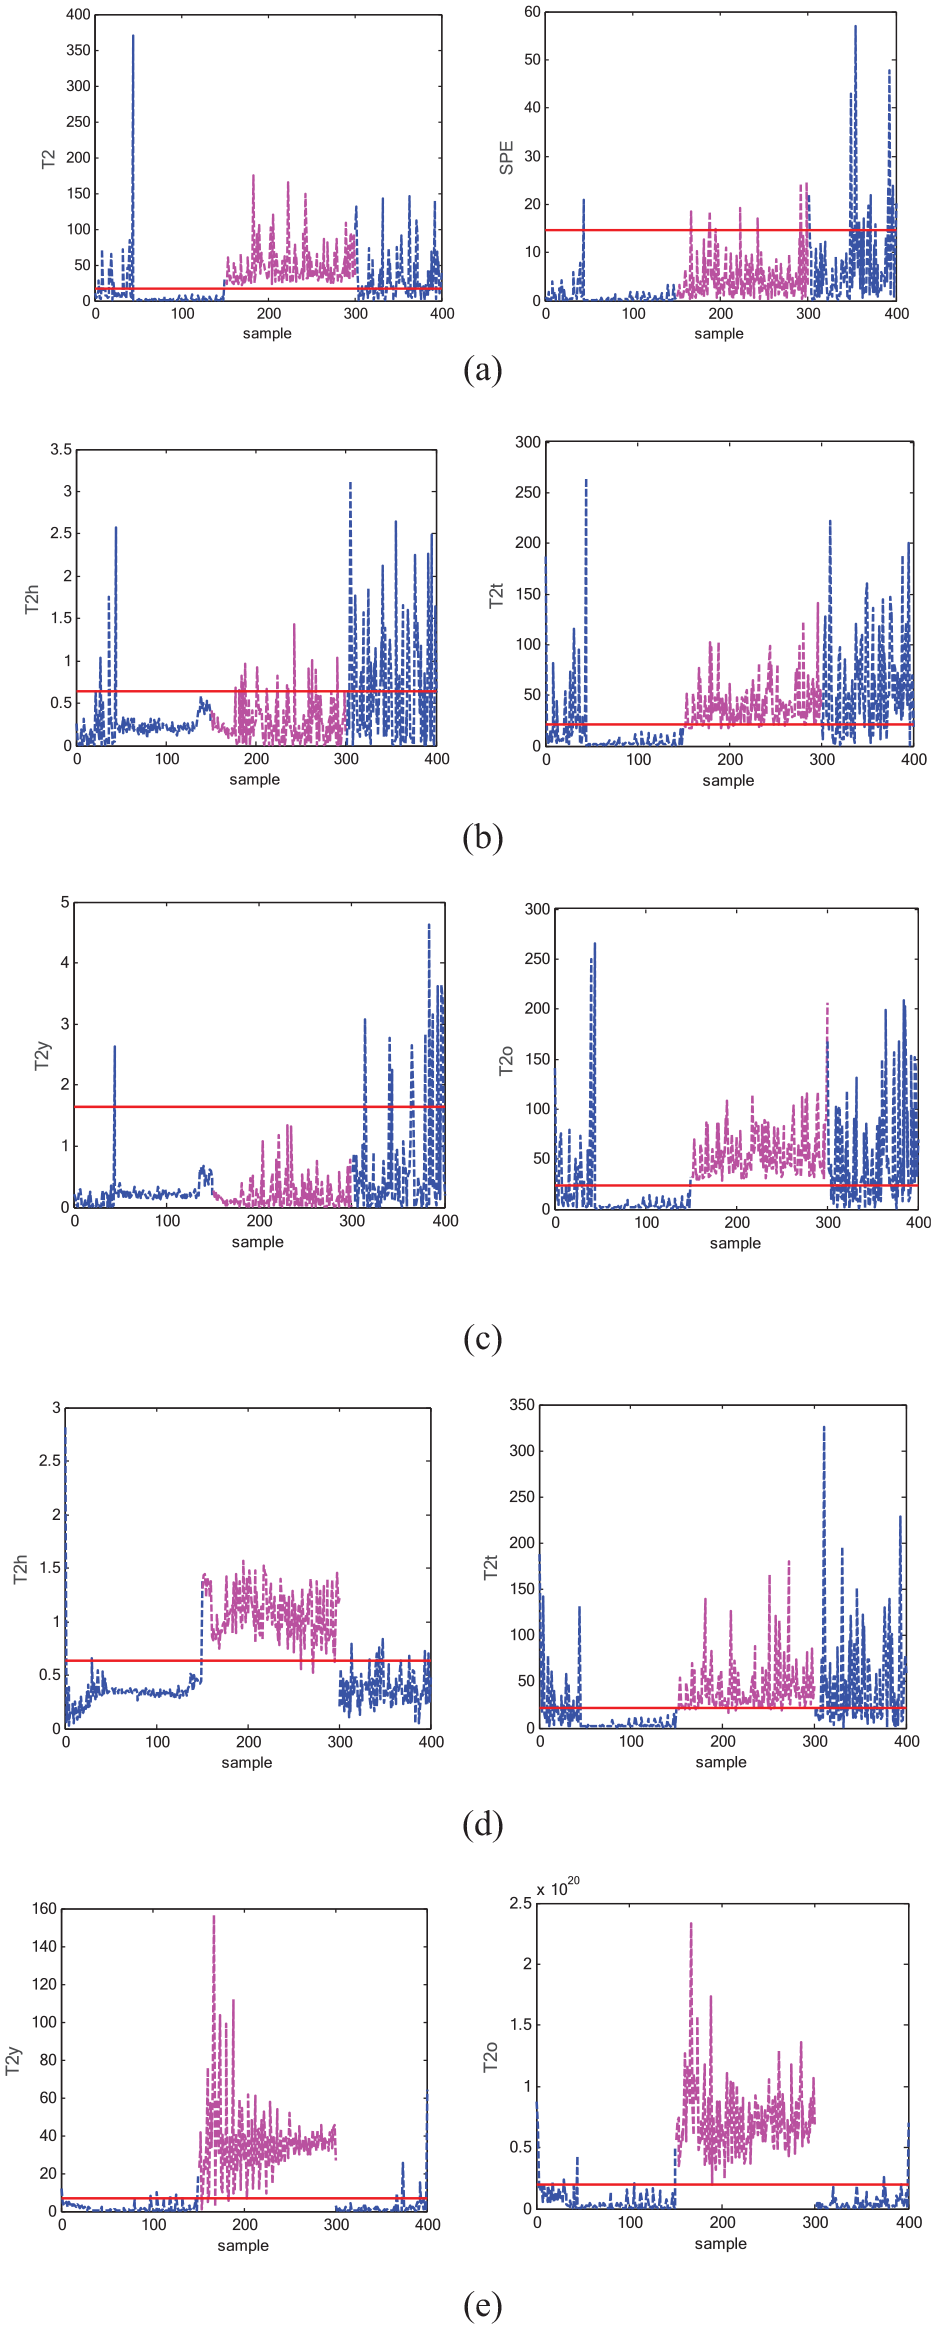
Fault detection diagram of MPLS, MMPLS, MTPCR, MEMPRM, and MOSC-ETPCR algorithm under fault 1: (a) MPLS, (b) MMPLS, (c) MTPCR, (d) MEMPRM, and (e) MOSC-ETPCR.
Figure 7 is the fault detection diagram of MPLS, MMPLS, MTPCR, MEMPRM, and MOSC-ETPCR algorithms under fault 4. Fault 4 is a ramp fault with a fault amplitude of 0.5 added between 150 and 400 samples. Compared with step faults, ramp faults are difficult to detect in time due to slow changes in process variables. Figure 7(a) shows
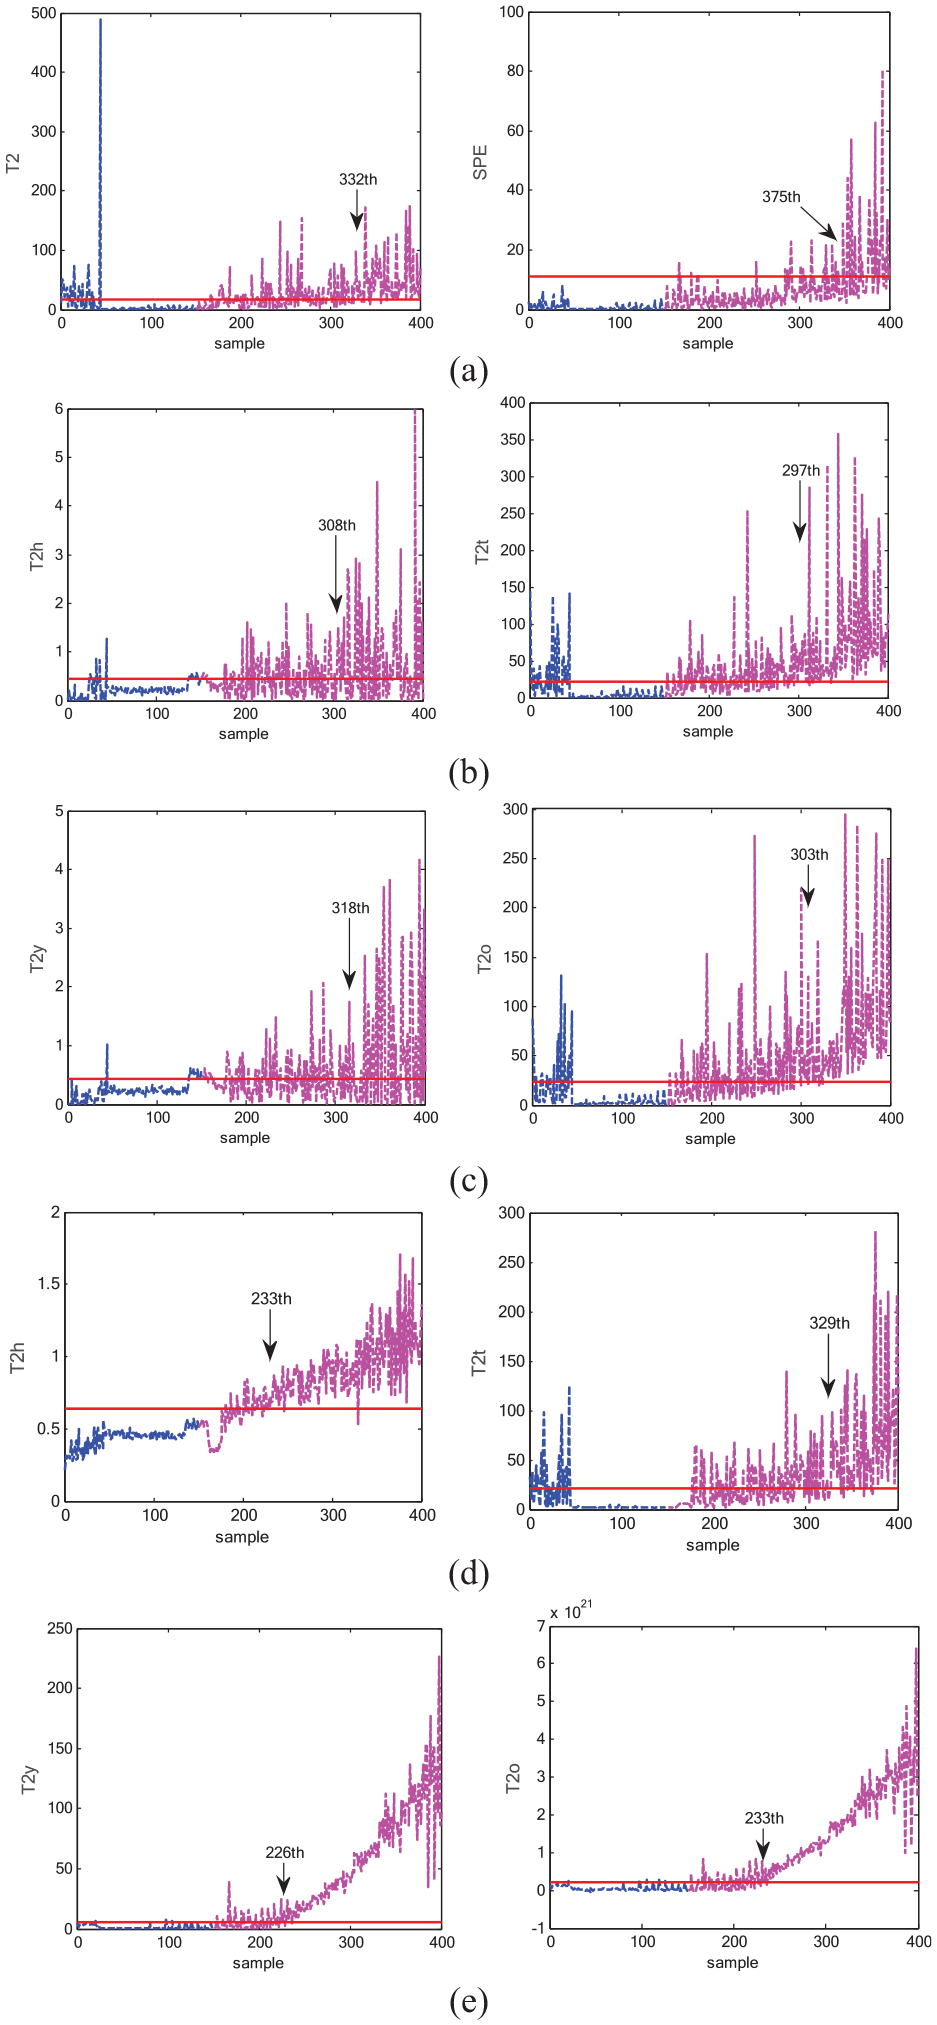
Fault detection diagram of MPLS, MMPLS, MTPCR, MEMPRM, and MOSC-ETPCR algorithm under fault 4: (a) MPLS, (b) MMPLS, (c) MTPCR, (d) MEMPRM, and (e) MOSC-ETPCR.
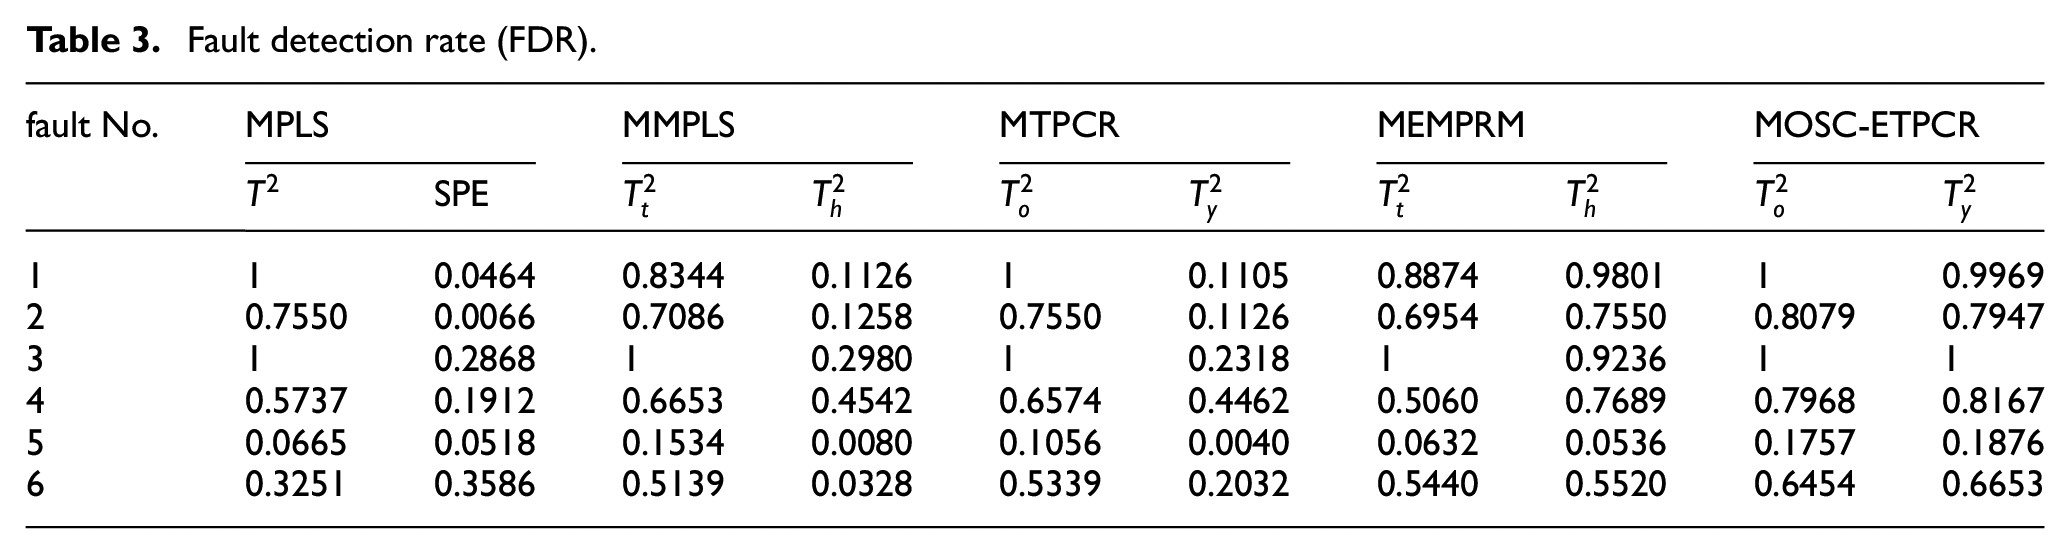
The MPLS, MMPLS, MTPCR, MEMPRM, and MOSC-ETPCR algorithms were used in the penicillin fermentation process for comparative verification. The results of the FDR and the FAR are shown in Tables 3 and 4. FDA and FAR are defined as follows:


Fault detection rate (FDR).
False alarm rate (FAR).
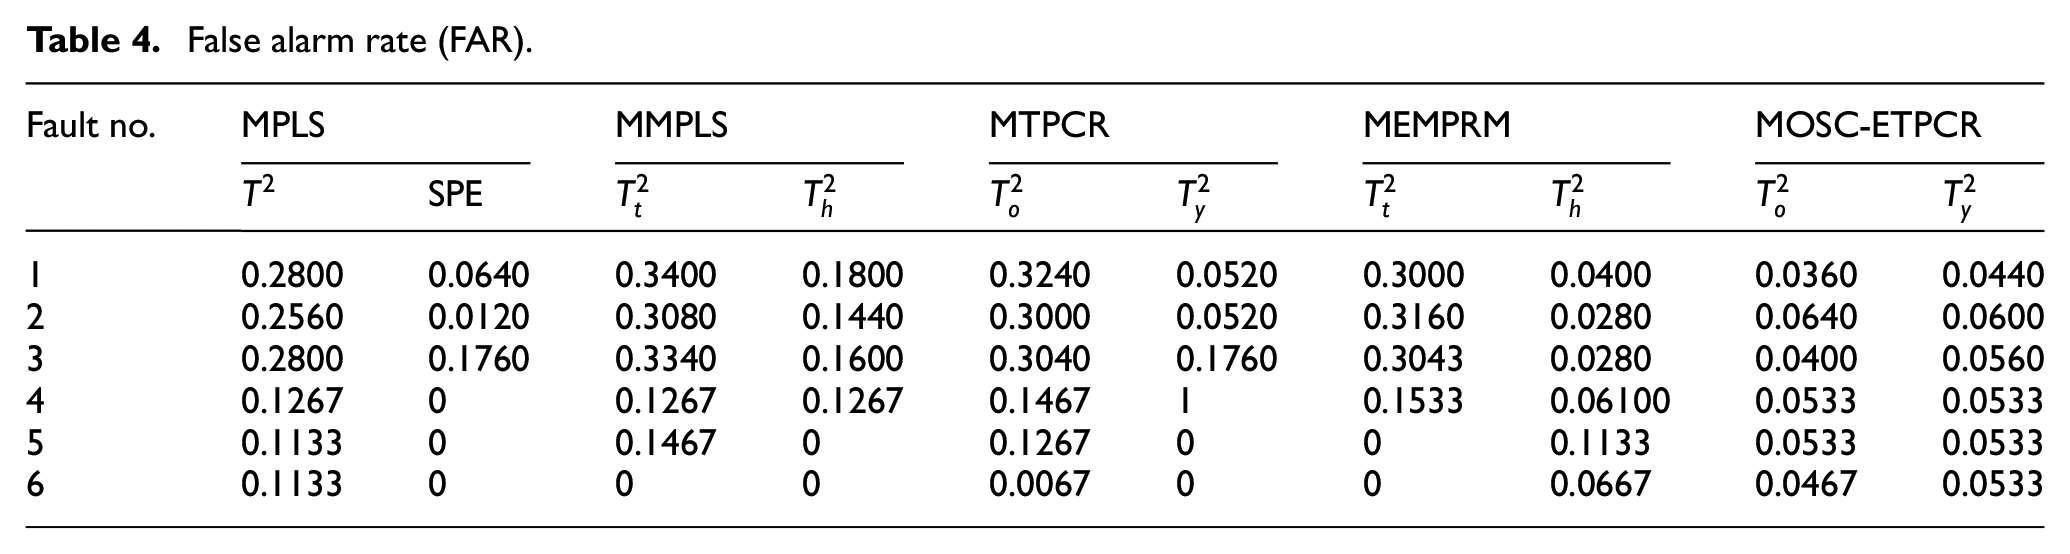
where, J represents the statistics, Jth represents the control limits. We can see that except for fault 5, the MOSC-ETPCR is superior to MPLS, MTPCR, MMPLS, and MEMPRM, it has the highest FDR and the lowest false FAR. For fault 1 and fault 3, the four algorithms can detect the fault in time, but compared to MPLS, MMPLS, MMPLS, and MEMPRM, the MOSC-ETPCR algorithm has a lower FAR. Fault 5 is the substrate feeding rate fault, we can see that the four algorithms cannot detect the fault directly. The reason for the delay in fault detection is that the glucose substrate feed rate propagates slowly between relevant variables. It can also be seen from the table that ramp faults 2, 4, and 6 are harder to detect than step faults, because the ramp fault cause the variables change more slowly. For the detection of ramp fault, the MOSC-ETPCR algorithm can detect the fault timely and accurately than MPLS, MMPLS, MMPLS, and MEMPRM algorithms.
Conclusion
In this paper, a quality-related fault detection method of batch process based on multi-way orthogonal signal correction and enhanced total principal component regression (MOSC-ETPCR) is proposed. First, after preprocessing the batch process data, the orthogonal signal correction algorithm is used to filter out the variables that independent with quality in the process variables. Secondly, the covariance matrix of the principal component regression is improved by the square matrix of the maximum information coefficient, which not only enhances the correlation between quality variables and process variables but also solves the linear and non-linear relationships among variables. Thirdly, relevant statistics are established and KDE is used to obtain its control limits for quality-related fault detection of the batch process. Finally, a numerical simulation and the penicillin fermentation process verify that the MOSC-ETPCR algorithm has a higher FDR and a lower FAR in quality-related fault detection of the batch process.
Footnotes
Declaration of conflicting interests
The author(s) declared no potential conflicts of interest with respect to the research, authorship, and/or publication of this article.
Funding
The author(s) disclosed receipt of the following financial support for the research, authorship, and/or publication of this article: This work was supported by the Science and Technology Project of Gansu Province (21JR7RA206); the National Key Research and Development Plan (2020YFB1713600)