
Abstract
As an important production method, the batch process is complex and flexible. Moreover, the modeling complexity and the spatial complexity of the storage model are higher, and the monitoring of the actual batch process is more difficult. To address this problem, this article proposes a fault detection method based on random projection, K-means clustering, and the k-nearest neighbor algorithm. First, a multiperiod division method is put forward based on the random projection and the K-means clustering algorithm. This reduces the computational complexity while ensuring the fault detection performance of the algorithm. Second, a real-time monitoring model is established based on each sub-period data using the k-nearest neighbor method to realize online monitoring of the batch production process. According to the premise that the fault detection performance is approximately equal, the proposed method reduces the complexity and computation of the model and realizes the real-time demand of fault detection.
Introduction
Batch process, as a significant production mode, has been utilized openly in the dye, food, pharmaceutical, and other fields. Compared with the continuous production process, the batch process has a complex reaction and is more flexible. This could make the actual batch process monitoring more difficult. 1
In recent years, process monitoring methods based on multivariate statistics, such as principal component analysis (PCA) 2 –4 and partial least squares, 5,6 have been widely used to monitor batch production processes. The PCA-based process monitoring method assumes that the operating conditions are stable, the variables are linear, and the data are subject to the Gaussian distribution. However, the batch process usually runs in a non-single, steady-state condition where the nonlinearity of the variables and the non-Gaussian features of the data are significant, making it difficult to monitor the batch process effectively using the traditional PCA-based monitoring method. In addition, for nonlinear, non-Gaussian, and multimodal problems, there are corresponding improvements, such as kernel PCA 7 for nonlinear, independent component analysis (ICA) 8 for non-Gaussian, and multimodal PCA for multimode. 9 However, when these problems coexist, these methods are not satisfactory. To circumvent these difficulties, He and Wang 10 proposed a new method, termed fault detection using the k-nearest neighbor rule (FD-kNN). This method utilizes the distance relations between local samples to execute the anomaly detection. It has no restriction on the data; therefore, it can be applied to industrial processes with the abovementioned characteristics. FD-kNN adopts the method of off-line monitoring; that is, it can be applied to detect whether a batch process is abnormal until this process is finished. Moreover, when it is used to monitor an ongoing process in real time, it has to estimate the measurement data from the next sampling time to the end of the batch process; the fault detection performance is affected by the estimated accuracy. 11 The monitoring model for each sample time or a period of time is established using PCA. 12 The corresponding time model and the sampling data obtained online are compared to realize real-time fault detection and the implementation of the corresponding control measures. Although this approach reduces the estimated data to a certain extent, it retains the nonlinear and non-Gaussian problems of the batch process.
Batch process is divided into several operation subperiods, and the sub-period monitoring model is established to replace the previous single-time model. This reveals the multiperiod characteristics of the process and improves the real-time performance. Several mark points are selected at equal intervals over one operation cycle; 13 from the beginning of production to each mark point represents one sub-operation period. Models are established for each time period to reduce the number of estimated samples. This time division method is relatively rough and does not take into account the process itself. An improved division method is proposed. 14 First, PCA is used to extract the main component and variable variation of each time slice data. Using the principle of minimization of similarity, the time slice matrix is clustered to realize the fine division of the process. Finally, the PCA monitoring model is established for different periods. These existing subperiod monitoring methods are based primarily on the PCA model and are difficult to apply to nonlinear, non-Gaussian batch production processes.
In this article, the subperiod is divided based on the historical data, and the k-nearest neighbor (kNN) method is used to establish the monitoring model. To reduce the complexity of the batch process in real time for the single-time model, while revealing the multiperiod characteristics of the process, a real-time monitoring method of the batch process based on time division is proposed based on the K-means clustering algorithm and kNN method. First, a time division method based on random projection and K-means clustering is proposed. This method is based on the K-means clustering algorithm, which divides the whole cycle time of the batch process into multiple subperiods. Then, the subperiod monitoring model is established using the kNN method to monitor the batch process in real time. Finally, a numerical experiment is used to illustrate the feasibility of these algorithms proposed in this chapter.
Related information
Random projection
Random projection is a widely used dimension reduction method. The basis of the method is to project the data in a higher dimension space randomly into a lower dimension space and ensure that the sample spacing is relatively constant before and after projection. Random projection has the capability of distance preservation, depending on the Johnson–Lindenstrauss (JL) lemma.
Lemma 1:
For any two points in the given range 0 < ε < 1 and

where
JL lemma states that any set in (high) m-dimensional Euclidean space can be mapped into an O(ε−2 log(p))-dimensional Euclidean space such that the distance between any two points is distorted by only a factor of 1 ± ε(0 < ε < 1). Assuming that
Theorem 2:
For an arbitrary set

For integer d ≥ d0, assume a projection matrix


Let

Let f: R
m
→R
d
map the ith row of X to row of
K-means clustering
The K-means is a more commonly used clustering method based on the idea that the original data set is divided into K clusters (clustering), and iterations are updated until the sum of the errors of each sample in the training data set in its cluster are minimized. In general, the sum of the squared error (SSE) is used as the evaluation index of cluster quality and has the following form


where Ci denotes the ith cluster, i = 1, 2,…, K; ci denotes the centroid; and Ni denotes the number of samples.
For a sample set of n points the K sample points the similarity between the samples is measured based on the Euclidean distance, where the distance between the sample and the centroid is calculated and assigned to the nearest cluster to form K clusters the centroid of each cluster is recalculated using equation (7), and the SSE of the clusters is calculated by equation (6). For
Process monitoring based on kNN
The basic idea of FD-kNN is that a normal sample is similar to the samples in the training set as all the training samples are obtained from normal batch processes, whereas a faulty sample is different from the training samples.
6
In FD-kNN, this is implemented by evaluating the kNN distance, which is defined as the cumulative squared distance between a sample and its kNN, in the training samples. Therefore, the kNN distance of a faulty sample must be greater than that of a normal sample. The details of this method are as follows. Model building
For each sample find its kNNs by computing the distance between it and all other samples calculate the kNN distance determine the threshold


The common way to set

where Fault detection
For a new sample find its kNNs in X using equation (4); calculate its kNN distance compare
If
Real-time monitoring method of batch process based on time division
In this section, a real-time monitoring method of the batch process based on time division by combining K-means clustering and the kNN algorithm is proposed. First, according to the historical data of the process, a complete batch production cycle is divided into multiple suboperation stages. Then, the subperiod monitoring model is established off-line. Finally, the process data collected by the model are monitored in real time. This proposed method includes subperiod division, modeling, and real-time monitoring. The following is described in detail in the proposed algorithm.
Subperiod division of batch process
Based on random projection and K-means clustering, a subperiod division method is proposed to realize the time division of the batch process. The batch process has a multiperiod characteristic, and the process variable does not change over time, but follows the operation and mechanism characteristics of the process. Correspondingly, the historical measurement data of the batch process can be clustered into multiple clusters, revealing different process characteristics for each period.
It should be noted that this article is based on a single batch of a subtime division method. It is difficult to obtain sufficient single-batch data to solve the subtime division problem in the short term. However, the process for multibatch data is more complex; in contrast, single-batch data process is relatively simple.
Suppose there is a batch of data for the batch process, denoted by dimension reduction: Based on random projection, the original data set is projected into the lower dimension space according to equation (5) to obtain the projected matrix cutting: cut two-dimensional data subperiod division: The M data points adjustment: The input of the clustering algorithm is arranged in chronological order, and the consistency of the process variables is divided accordingly. However, owing to the presence of noise or measurement errors, highly similar variables may exist in different periods. Correspondingly, the subperiods may appear discontinuously in time, indicated by “jump points.” Then, these jump points are grouped into temporally adjacent subperiods in conjunction with the clustering results and the process operation time. Finally, the K subperiods of the batch process are obtained.
kNN modeling and real-time monitoring based on subperiod
Through the analysis in the previous section, the subperiod division of the batch process is realized so that sampling points with similar characteristics are divided into one subperiod, and the successive points with large differences are assigned to different periods. This section divides the historical data of the batch process into K subperiods, establishes the monitoring model of each subperiod by the kNN method, and realizes the batch production process online based on these models.
Assume that the operation cycle selects I for K subperiods the three-dimensional matrix of each subperiod for each subperiod data Where the control limits For ith period, For an ongoing batch production process, the measurement data for the lth sample are acquired online assuming that the current time belongs to the ith subperiod, the batch process at the current time is monitored by the model based on the ith subperiod; in the ith sub-period data the control limit


Simulation
Data generation
Based on the numerical simulation, the batch process contains two steady-state phases and a transition phase; there are 5 latent variables and 20 process variables. The operation time is 200 h, where the two steady-state phases are 120 and 50 h, respectively. The transition phase is 30 h. The sampling interval is 1 h with 200 sample points. The sample batch contains 40 samples, and the resulting modeling data are denoted by
Result analysis
This section divides the subperiods of the batch process based on the above proposed method and then performs modeling and online monitoring based on the kNN method. The process characteristics are combined and the following parameters are set: number of expected clusters K = 3, error parameters of projection ε = 0.8 and δ = 0.4, projected spatial dimension d = 6, number of neighbors k = 3, and confidence level α = 1%.
The K-means clustering and the proposed new method in this article are used to divide the entire batch process. The results of these two methods are shown in Figures1 and 2. It can be seen that both methods can divide the entire batch process into three subperiods and have jump points. In Figure 1, the 16th sample point is divided into the second subperiod. However, the points before and after this point are assigned to the first subperiod; thus, this sample point is considered to be a jump point. Therefore, the time division result of the K-means clustering method is first subperiod 1–121, second subperiod 122–150, and third subperiod 151–200. Similarly, the time division result of this new method is the first subperiod is 1–119, the second subperiod is 120–150, and the third subperiod is 151–200.Comparison of the results of these two methods shows that both methods can divide a batch process accurately; however, the method proposed in this article can reduce the time complexity of a sub-period division significantly, as shown in Table 1.

The time division of K-means clustering.

The time division of this new method.
Time complexity of the two methods.

The measurement data of 40 operating cycles were divided according to this method, eventually forming three subperiod data: X1∈R40×20×119, X2∈R40×20×31, and X3∈R40×20×50.The uniform monitoring model of the subperiods is established using the kNN method, and the batch process is monitored based on these models.
From Figure 3, it can be seen that the kNN method has a poor fault detection effect on the second subperiod. Combined with the characteristics of the batch process itself, the second subperiod corresponds to the transition phase. Compared to the steady-state phase, the transition phase is more dynamic and is disturbed easily by instability. Therefore, the difference in the measurement data at the same time for different batches, or at different times in the same batch, is relatively large in the transition phase, and the calculated k-distance is also relatively large. On the other hand, owing to the instability of the transition phase, the fault samples may be similar to the normal samples at other times. Accordingly, their k-distance will not exceed the control limit, and such faults will not be detected.
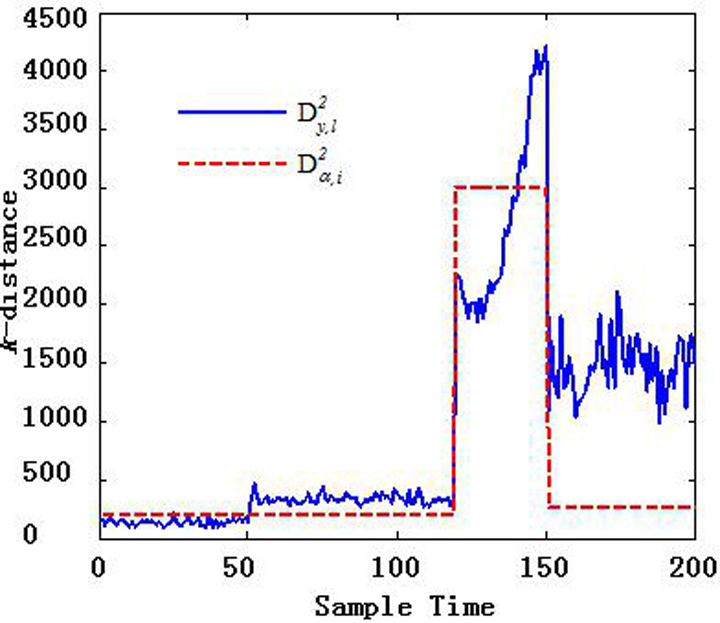
Real-time monitoring results of subperiod models.
For a single-time monitoring model, 200 monitoring models are required for 200 sample points. When there are numerous sample points, the time complexity of modeling and the spatial complexity of the storage model are substantial. In this study, the batch process is divided into subperiods, and a unified monitoring model is established for each subperiod. This proposed method divides the above batch process into three subperiods and establishes three sub-period monitoring models, which greatly reduce the model complexity.
Conclusions
This article presents a real-time monitoring method for the batch process based on time division. First, a time division method based on random projection and K-means clustering is proposed. Based on the measurement data after random projection, the K-means clustering algorithm is used to divide the whole cycle time of the batch process into multiple subperiods. Then, the kNN method establishes the subperiod monitoring model to monitor the batch process in real time. The proposed method is simple and suitable for production processes with large variable correlations. It can reveal the multiperiod characteristics of the batch process more objectively, while reducing the complexity of a single-time model. Further, combining the prior knowledge of the process will help to improve the accuracy of a subperiod division and the performance of process anomaly monitoring, which is an important direction for future research.
Footnotes
Declaration of conflicting interests
The author(s) declared no potential conflicts of interest with respect to the research, authorship, and/or publication of this article.
Funding
The author(s) disclosed receipt of the following financial support for the research, authorship, and/or publication of this article: This work was supported by the National Natural Science Foundation of China, Nos. U1504616, 61503123, 61673160, 61573137; sponsored by Program for Science and Technology Innovation Talents in Universities of Henan Province under Grant 17HASTIT021; supported by Shaanxi Key Laboratory project of Complex System Control and Intelligent Information Processing under Grant 2017cp05.