
Abstract
The paper introduces a Programmable Logic Controller (PLC) / Human Machine Interface (HMI) system incorporated along with machine learning (ML) classifiers. Although some other studies have incorporated ML techniques to predict and control petroleum product terminals in terms of concentration, the proposed framework incorporates Add On Instruction (AOI) programming, PLC, and ML methods to automatically monitor petroleum products terminals. The framework adds an AOI in programming to achieve maximum usage of processor capabilities. Moreover, it uses AOI for programming in cooperation with the ladder diagram (LD). This leads to simplifying the LD graphical programming language, reducing the time of scanning, and making facilitate troubleshooting. The AOI is merged with ML to automate tank level detection and maintain good operational conditions and consequently protect these expensive essential assets. The introduced framework consists of three stages. The first stage is the PLC programming phase where the PLC is created using Add-On instructions. Next, HMI graphic displays are drawn and linked to the PLC tags in the following stage. During the third stage, the actual process readings are applied to the system based on ML algorithms to test its functionality. The proposed system results indicates a reduction in the LD number, highest program size, and maximum time of scanning. The results indicate that the AOI can help to trace the program more easily in fault situations. Besides, additional program instructions could reduce processor memory, system construction costs, and upgrade projects.
Keywords
Introduction
The oil industry is a very critical field of operation. Petrochemical or oil terminals are treating units where crude petroleum and gas are controlled for human usage. Valuable and cleaner products like gasoline, petrol, diesel, kerosene are essential, laying huge industrial facilities with a widespread and interconnected piping system running across the compound. The industry deals with extreme amounts of explosives and with high amounts of toxin gases. The safety of the worker is always a significant concern for the business. Thus, petrochemical terminals are the heart of the downstream sector in the petroleum field. Recent developments in technologies such as automated control systems lead to more advanced and efficient performances and often increase production rates. Conventionally, industries rely on human resources for controlling, monitoring, and inspecting various components of the plant. However, replacing it with a computer system reduces the error rate considerably and, most importantly, develops the response rate. Data gathering from field sensors, actuators, and other controllers are smoother and quicker. 1,2,3
The role of Programmable Logic Controller (PLC), Supervisory Control and Data Acquisition (SCADA) systems, and machine learning (ML) is essential in the modern paradigm of industry 4.0. Machine learning. with the advent of artificial intelligence, a new paradigm managed by ML is opening up. That means that currently, SCADA systems based on ML are becoming smart. This smart SCADA can monitor and control the facilities of any industry via a practical and perceptive map.
A proposed method of using ML techniques with PLC program is introduced through this paper. Such work aims to obtain better performance and a smarter automation system with less human actions. The first purpose of this work is to achieve a shorter program, smaller program size in processor memory, and a shorter scan time for a program created using Add On Instruction (AOI) than the same which is created using a conventional ladder diagram (LD). The second purpose is to add a smart feature to the system by applying real process sensors reading to ML classifiers to get results about the ability to predict tank levels. An oil products terminal for vessel loading and pipeline dispatching will be described in this paper. This terminal is integrated with ML classifiers to predict low and high levels for better operating conditions. Oil product fluids that are handled are diesel, kerosene, and gasoline. 4 The controlled narrative is described from two aspects, the operation, and the control systems. The terminal consists of three tank groups and three loading stations. Each group of tanks has a separate product feeder line and contains three tanks. Moreover, each loading station includes three pumps. The terminals are used for the loading of vessels, the shipment of products and the storage of tanks. To examine the behavior of the processor, a Rockwell PLC is designed utilizing RSLogix Emulate 5000 Chassis Monitor. The LD program was made using Studio 5000 Logix designers. The processor is linked to the Human Machine Interface (HMI) server and graphics displays by RSLinx Classic communication software. Visual displays designed using FactoryTalk View Studio. All mentioned applications belong to the Rockwell Automation (RA) company. Graphical user interface (GUI) displays are implemented to display all necessary data about valves, tanks, and pumps such as statuses, level, temperature, pressure, and ampere current readings. Displays also provide control of these facilities. The PLC is programmed to send all readings to GUI. An open-source software called Waikato Environment for Knowledge Analysis (WEKA) is used. 5 It contains a collection of ML algorithms for data mining tasks. 6 Ten ML classifiers are applied to two process reading files. Each classifier is used individually to compare their performance and choose the best one of them. The collected readings are tank level, pump suction pressure, pump discharge pressure, and filling flow rate. The first file contains 800 process readings, and the second one with 320 process readings, and their outputs were presented in the results section. These readings are real-time sensor data. They were taken from the SUMED CO. Oil terminal operation system. Readings were collected for all data at the same time of occurrence and with constant time intervals, (1 s sampling time). This procedure is done twice to create the mentioned reading files.
The rest of the paper is structured as follows: The second section introduces the literature. Following, section 3 illustrates the methods and materials. Next, in section 4 the proposed framework is discussed. Then, in section 5 the results and discussions are illustrated. Finally, Conclusion presents the conclusion.
Relevant Studies
Case studies of terminal facilities have been conducted in Chkara and Seghiouer 3 in order to select an appropriate controlling system. The Case studies of terminal facilities have been conducted in Cchaara and Seguer 3 in order to select an appropriate controling system. The authors’ challenge in this paper is to choose the best control system from many systems offered by various suppliers which is based on some factors. Those aspects include international score, delays in providing fast answers, the best comprehensive service, after-sales service, financial offers, regional supplier representative, and project completion times. They compared all suppliers’ overall scores.. The suppliers 2 and 3 have been technically accepted. Supplier 3 has a competitive advantage in several languages, and is more robust in the region than supplier 2. The limitations of the selected supplier are some deficiencies in the tendering and project implementation phases, such as Factory Acceptance Test facilities (FAT), response speed, and training for operational and maintenance staff. Other framework was introduced in R. Lopez Perez et al., F. Adamsky et al. R. Sousa, and T. Engel 7 to defend a Supervisory Control and Data Acquisition (SCADA) approach opposed to outbursts utilizing Machine learning (ML) techniques. Their work concentrated on assessing ML performance in identifying anomalies in SCADA structures. The authors analyzed SCADA protocols from periodic scans across the Internet and developed several SCADA services that can be used and attacked over the Internet. The results of the discussed work concluded as the classification accuracy attained was equal to 99.90%. The RF algorithm was performed by detecting 99.90% of benign data and 98.46% of attacks, and the overall detection rate (recall) reached 99.58%. However, the limitations of this system are that it can only be applied to SCADA that communicates with Modbus RTU traffic. In reference, 8 the authors designed a proportional—integral—derived (PID) controller for the rectifying of ethanol, enabling the production of highly concentrated products and temperature control. The analysis using different mathematical models is the best way to manage the temperature of the first plate of the correction column. PID is based on computational optimization and is implemented in the S7-1200 PLC. The rectifying operation of the ethanol column was then evaluated. The temperature of the upper section of the rectification column is controlled. The error was below 2.02% of the boiling temperature of ethanol. The ethanol concentration result was 87.3%. The limitations of this work required the use of complex control designs to minimize static errors. One more study 9 explained the composition of the SCADA system and HMI for multi-stage flash brine desalination (BR) recirculation plants. The objective of this study was to increase the data transfer rate through the control network from 10/100 kbps to 185 kbps. The authors attached the system server to the main control circuit by means of a multi-point interface (MPI). This is due to the fact that MPI is now faster than Ethernet connections. The introduced framework improved the data transmission speed between the server and control loops and reached the desired 185kbps network speed. In addition, the number of data received on the operator screen was increased, but the number of input and output signals was not sufficient because of the limited number of PLC channels (S7-300). Further limitation is that the MPI connection proposed refers only to an Open Platform Communications Server (OPC), this system can therefore be used in hot redundancy applications using two OPC servers.
A new model is introduced in 10 to provide solutions to real-world planning and time planning problems in oil refineries. The main objective of this study is to enhance the automatic planning and scheduling of short-term schedules generated by control systems. The objective is achieved by establishing planning/scheduling problems as large-scale mixed integer optimization models (MIPs). Besides, the scheduling paradigm of Moro et al. 11 was expanded in order to organize scheduling determinations at in the liquefied petroleum gas (LPG) zone to enlarge the production and distribution of products. The optimization model has been successfully created. It has defined new operating points, increased product production, and maintained all specifications restrictions. Additionally, the difficulty of planning and scheduling was defined and defined as a large-scale MIP model. Though, the disadvantage of this system is that there is no global solution guaranteed by the bilinear terms in viscosity limitations. The authors of 12 described a novel method on the basis of SCADA/HMI distributed in several layers. This method is utilized to examine and control the refinery terminals of trucks loaded with oil and pipelines for transportation of goods. The objective is to build a distributed PLC system, centered on a network, with SCADA functions connected to HMI. This paper is concerned with connecting system hardware to graphics panels that integrate all stages of process control. The designed PLC system was built using hardware elements of the Yokogawa Stardom system. A networked-based Control System (NCS) is positioned between the lower-end PLC/SCADA systems and the higher-end DCS (Distributed Control System). The application used to build SCADA/HMI displays for the design was customized and extended through its open hardware and software tools. The system has many advantages, including modularity, extension, and communication with remote devices from manufacturers and suppliers. In addition, most system components have a double redundancy architecture. Standard and open real-time software architectures are also very valuable. The authors of reference 4 intended to build a SCADA-PLC system that could control all refineries in real-time, rather than conventional distributed control systems (DCSs). The input and output signals connected to Siemens’ S7-300 PLC are attached to WINCC-based SCADA software to monitor the system A PID digital controller controlled the industrial wastewater unit. Control action of this unit is done with the Micrologix-1200 PLC and the RSVIEW-32 SCADA and communication software RSLinx. The results show that the intended control system can be successfully implemented on a more realistic screen. Furthermore, the system also has additional functions such as real-time data analysis, setting point modifications, and automatic reporting.
The article 13 aimed to implement a real-time wireless control and monitoring system based on PLC. The authors of this paper discussed the ability to use the ZigBee protocol for connecting wireless PLC networks. A ZigBee-based wireless unit was applied to Arduino. An Arduino device and XBee module are connected to a PLC device. The wireless unit employed ZigBee protocol for mesh networking. In a realistic networking scenario setup. The result showed the success of establishing the system with a packet delay of around 0.01 times the occurrence probability. The limitations of the discussed work were that the Arduino device was not industrial so that it could’t handle heavy industrial applications compared to industrial communication devices. Also, wireless communication networks were not a good solution for industrial applications because wired networks are more protected and less exposed to interference. Similarly, the authors of 14 introduced a control system based on PLC but for other applications. The system automatically saves tanks from overflowing. Such work aimed to increase the safety and efficiency of the system. Also, to monitor tank levels and operate the pumps fully automated using PLC instead of the pump’s manual operation. This problem was solved by building a control system consisting of level switches, Allen Bradley MicroLogix 1400, Solenoid valves, relay, motor, and centrifugal pump. The PLC processor was programmed by RSLogix software. The results of this system showed that the tanks, levels, and pumps were fully automated using the PLC. This means that the manual operation of the pump was replaced successfully. Thus, errors and accidents were reduced. Furthermore, the tank was safe from overflowing. This system’s disadvantage is that the processor had limited input and output channels, so it could not be employed in large applications or in cases where many tanks are needed to be protected. An automatic control system based on PLC was proposed in ref. 15 for crude oil refining and distillation unit. The authors designed an intuitive operation and control system for the crude oil refining process in a distillation unit. A LD PLC program was created and downloaded to a controller to execute the desired sequences. Successful temperatures, valf, and pump controls were achieved. This work’s drawback was its incapacity to use the PID (proportional, derivative, and integral) control because of the limitation of the PLC software used in this study. Moreover, all control loops' performance is not highly efficient and can be improved using a higher version of the software.
In ref. 16, the authors proposed a way of optimizing a catalytic cracking unit. The study aimed to attain a higher product revenue, less catalyst consumption, and a more efficient process. A soft sensor was designed to predict catalyst saturation levels in a Fluid Catalytic Cracking Unit (FCCU). The input used for the model was collected data from several sensors across a refinery. Catalyst saturation levels were measured manually and put in tables. Manual measurements joined with the laboratory data to offer training input for the soft sensor models. The new soft sensor model is then employed to optimize the use of the catalyst within the FCCU continuously. The results achieved a continuous saturation level close to 0.37wt% compared to the original 0.33wt%. The proposed optimization model was introduced as an intelligent flow control process in the development of Industry 4.0, it was possible to fine-tune both the modeling and simulation components to achieve a more optimal saturation level.
The paper 17 aimed to serve petrochemical and other manufacturing industries to adapt to changes in the environment using ML. The authors purposed to build a structure and methodologies to construct a digital twin based on the petrochemical industrial Internet of things (IIoT), ML. A practice loop was to exchange information between the physical factory and a virtual digital twin model to perform production control. The research integrated ML and real-time industrial big data to train and optimize digital twin models. The approaches are applied in the production unit of a petrochemical factory. The model was trained through industrial IoT data and used to get intelligent production control based on real-time data. Depending on the environmental features, the paper provided real solutions for ML difficulties in the petrochemical industry. Results proved the efficiency of this structure and achieved production control optimization. There were some limitations. First, the impact of the model did not complete the best economic benefit. Second, the digital twin model described was not a one-time process. It was a repeating a circle practice loop. Third, this research focused only on the petrochemical industry.
Methods and Materials
This article proposes a framework for an automated PLC system for operating a petroleum products terminal. The system is integrated with ML techniques for the automatic level detection of tanks in operation. The framework consists of three stages. In the first, the PLC program is created using Add-On instructions. In the second stage, the same program is created using conventional rung instructions. After that, HMI displays were designed. The third stage is applying ML classifiers to actual readings from a real operation. This framework corresponds to two experiments. In experiment I, each PLC program runs to compare their results (scan time, program size, and the number of rungs). In experiment II, actual operation readings were collected (level, suction pressure, discharge pressure, and flow rate) and applied to ML classifiers to predict operation level based on training data. In the following subsections, details of these stages are discussed in detail.
Data collection
Real process readings are collected from an actual running system of a real petroleum terminal. In this study, two datasets were used. Readings are collected manually from historical trends. The collected readings are tank level, pump suction pressure, pump discharge pressure, and filling flow rate. The importance of collecting these data is to provide ML classifiers with enough examples to train with them. To get the values of tank levels when they are not given in readings. To get an instant decision for the operation to protect operational tanks and pumps. A historical trend was created, and the mentioned data was imported to it. Readings were collected for all data at the same time of occurrence and with constant time intervals, (1 s sampling time). This procedure is done twice to create two reading files. The first file includes 802 process readings. The second one contains 320 process readings. Readings are taken from the SUMED CO. oil terminal. Ten ML classifiers were applied to each file.
Machine learning techniques
Naive bayes classifier
Naïve Bayes (NB) is a probabilistic algorithm applied for the classification of data. It is grounded on the class conditional independence theory. It has a mild construction and is very effective with strong dependencies. This algorithm can determine the training cases with inadequate knowledge. In other words, it can predict the class label of new cases even with missing data. The NB classifier has three benefits. First, the construction is predefined, and no learning structure is required. Second, it is very effective and suitable to deal with many datasets, essentially when the features are not strongly correlated. Third, it needs a small amount of training data to determine the model parameters. The NB classifier is easy to perform and usually produces good results. This classifier is expressed via the fully posterior (MAP) decision rule. It relies on the Bayesian theorem to get a particular event and the unconditional probability of an event in each class. The NB classifier is faster than other more sophisticated algorithms. The separation of the class distributions indicates that each one can individually be assessed as a one-dimensional distribution. This separation, in turn, helps in alleviating problems from the dimensionality curse. NB works well mainly when the dimensionality of the contributions is high. 18–21
Support vector machine
Support vector machine is a robust ML classifier. For a given set of training examples, each instance in this set is labeled (each item grouped to a positive or negative class). Support vector machine determines the hyperplane that appropriately assigns the cases to the suitable class and maximizes the border between the data examples and the hyperplane. The result hyperplane is used to predict the class type for any new data instance. This classifier’s plan was performed using a kernel function that maps the similarity linking the input vector and the new higher-dimension feature space. A linear kernel is regularly used when that dataset is divided by a linear line. However, a quadratic kernel is a nonlinear function when the dataset is complex and not linearly separable. Quadratic kernels may improve the accuracy. Other advantages of quadratic kernels include having fine mathematical tractability and direct geometric representation. 19,22–25
K - Nearest neighbors
K-NN is a popular classifier used commonly because of its simplicity, straightforwardness, and high efficiency despite noisy data. K-NN gives a class for each point in the test set. The type is given to the data point rendering to the k-nearest neighbors inside the training set. This classification is done by computing the distance between each point in the test set and another in the training set. Space shows how the test point is comparable to the instances in the training set. 26,27
Decision stump
Decision Stump is a ML classifier that consists of a one-level Decision Tree (DT). In other words, it is a DT classifier with one internal joint node called the root that is directly attached to the terminal nodes (its leaves). A decision stump classifier gives a prediction based on the value of only a single input point. For each feature, one may create a stump that contains a leaf for each fair feature value or a stump with two leaves, one of which matches some accepted category and the other leaf for all different categories. For binary cases, these two schemes are equal. Decision stumps are regularly applied in large data applications. 24,28,29
Hoeffding tree
Hoeffding tree is an incremental DT algorithm that allows current trees to be adaptively modified using small portions of the dataset. It builds a tree structure by learning from the stream of extensive data by considering that the configuration example will not vary by time. This view was confirmed by Hoeffding bound’s calculation, with checks needed to determine specific statistics. 30,31
J48 classifier
J48 is a DT algorithm that creates a classification for the supplied dataset by recursive partitioning of data. The decision is built utilizing the Depth-first procedure. J48 classifies a new case by forming a DT from the input training set’s element values. As soon as it comes across the training set, it identifies the characteristics responsible for classifying the different cases most perfectly. The possible characteristic values with no uncertainty are assigned to the concerned branch by stopping it. This algorithm studies all probable tests that can divide the training set and decides the metric that provides the most helpful learning gain. 32,33
Logistic model tree
The logistic model tree (LMT) belongs to the DT classifier. It is a hierarchical method that consists of one root, branch, leaf, and nodes. Branches are split into sections combined with the nodes. Each node matches a specific feature, while the branches correspond to various values that must separate the set of values of the given characteristic. The LMT is a mixture of the C4.5 algorithm and logistic regression functions. The knowledge accumulation ratio is utilized for splitting, and the LogitBoost algorithm is applied for providing the logistics regression functions at a tree node. C4.5 uses an entropy-based measure as learning this type of classifier. To stop overfitting that might occur during the LMT construction, the CART algorithm was used for pruning. 29,34
Random forest
The Random Forest classifier is employed to predict the class value by creating many trees from a provided information data feature utilizing the divide-and-conquer approach (DAC). The DAC approach depends on the recursive partitioning of the information input range into many subspaces based on the candidate information data characteristic’s value. It meets many classification trees to a data set and then connects all the correlated trees' predictions. Each tree depends on the value of the individually examined random vector. The RF classifier corresponds to several merged DTs. The trees that make up the RF are made randomly, picking value fixed for all node’s characteristics in each node of the tree, where the fittest attribute is determined to separate the nodes. The candidate data feature is separated by implementing the goodness metric on the data attribute. Several goodness metrics can be used for ranking, including a likelihood ratio and a gain ratio. The leaves of the created trees are marked either as a class label or a probability distribution. The vector worked for training each tree is taken from a random collection of instances. To define the type of sample, all the trees show output, and the most suggested is selected as a result. The classification error depends on the forest’s trees' power and the correlation between any two trees in the forest. 5,20
Random tree
A Random Tree is a DT classifier that is created by a stochastic method. In a regular tree, each node is divided using the best separation criteria among all characteristics. The random tree combines learning algorithms that generate many different trees. It is an algorithm to build several trees that manage many random points at each node. It includes a bagging idea to generate a random set of data for producing the tree structure. Random Tree algorithm can determine the class possibilities for the classification process. This algorithm can handle both classification and regression problems. 5,29
REPTREE
To decrease the error snipping that might appear in DT, the REPTREE classifier is recommended because it is a quick DT learning algorithm and based on the concept of estimating the knowledge gain with entropy and decreasing the error resulting from diversity. REPTREE utilizes regression tree logic and produces various trees with altered repetition. Then, it decides the most suitable tree from all generated trees. This algorithm builds the regression/DT applying variance and information gain. Additionally, this algorithm clips the tree with reduced error pruning using a back fitting process. It classifies the values of numeric properties at the start of the model training. Moreover, this algorithm labels dropping values by dividing similar examples into sections. 35
Description of the Proposed Framework
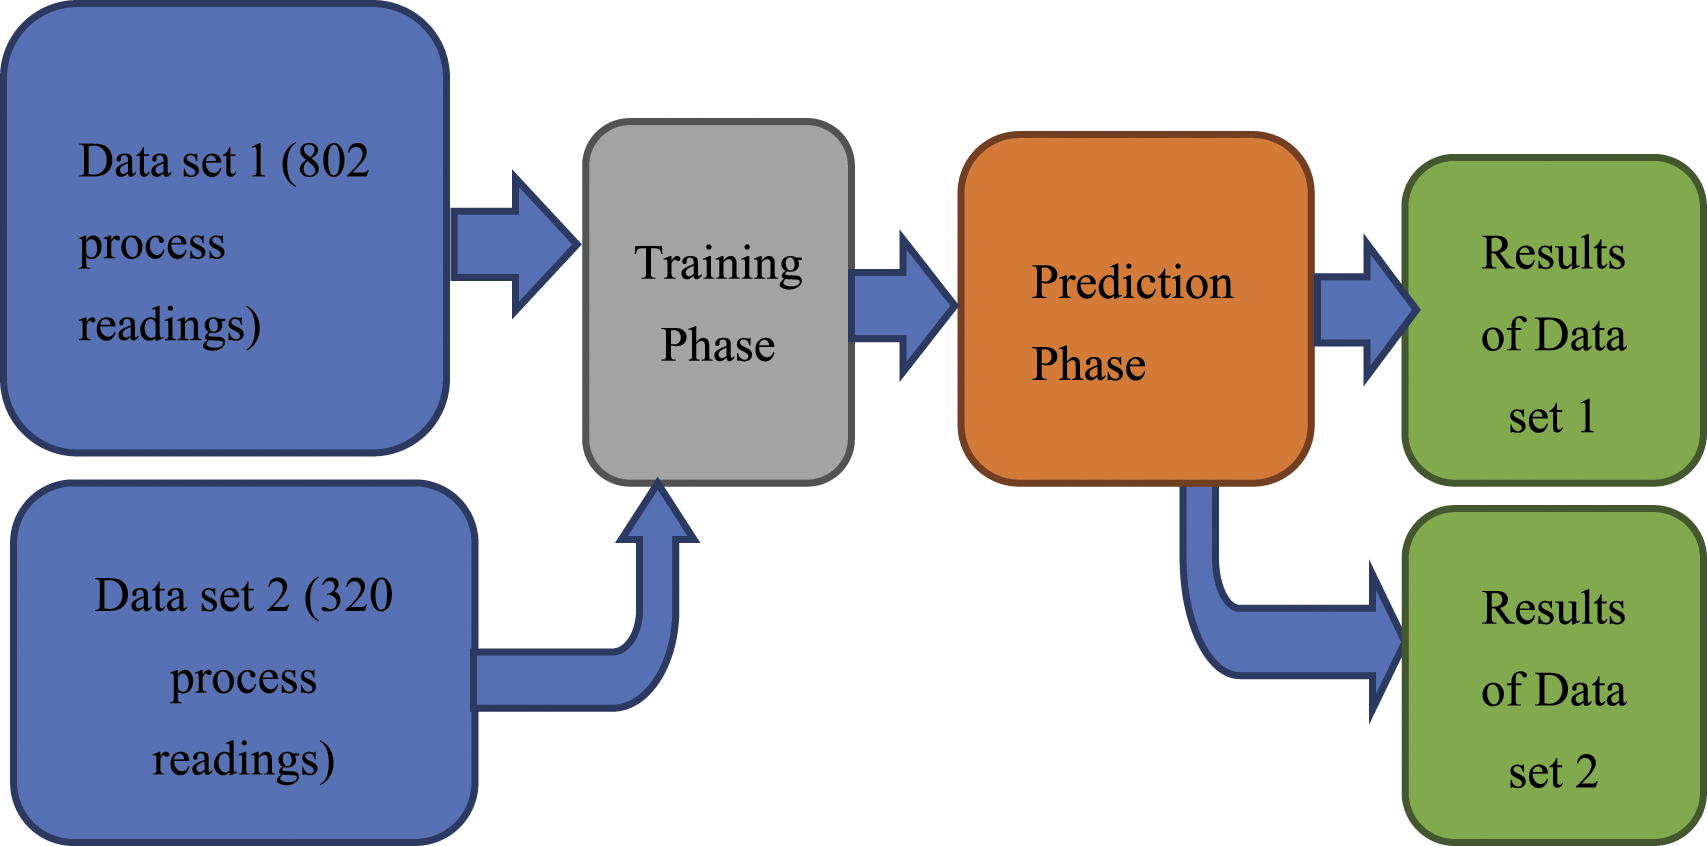
Normally, the PLC program is too long and branched out. In the large-scale application of the food, oil, and gas industry, the program should be easily able to reach thousands of ladders. This length makes troubleshooting very difficult and requires very skilled engineers. All references mentioned in the related works section and refs. 36–42 focused on doing a specific control task and achieving it correctly. All of them used the conventional LD or different language to reach their desired purposes. Some of them depended on PLC, and others used Arduino controllers. However, to our knowledge, no previous work employed the AOI in the programming. The aim of this work is to create a more simple PLC programming method having lesser rungs, fewer processor memory and shorter execution time. The introduced framework is a PLC/HMI control system merged with ML techniques to add a new innovative feature to the automation field. The new feature is to make the system smarter by making it able to predict tank levels by itself. The proposed system uses an AOI in the ladder programming in cooperation with the conventional ladder instructions to achieve this goal. Add On Instruction is a function that could be called in any part of the routine. It is used when the exact rungs are used frequently in the code. This framework is independent of communication protocols. Therefore it can accommodate with different industrial communication protocols, like Profibus, Profinet, Modbus, etc. Figure 1 shows the block diagram of the proposed method. Figure 2 shows the block diagram of the ML system. Block diagram of the proposed system. Block diagram of the used Machine Learning system.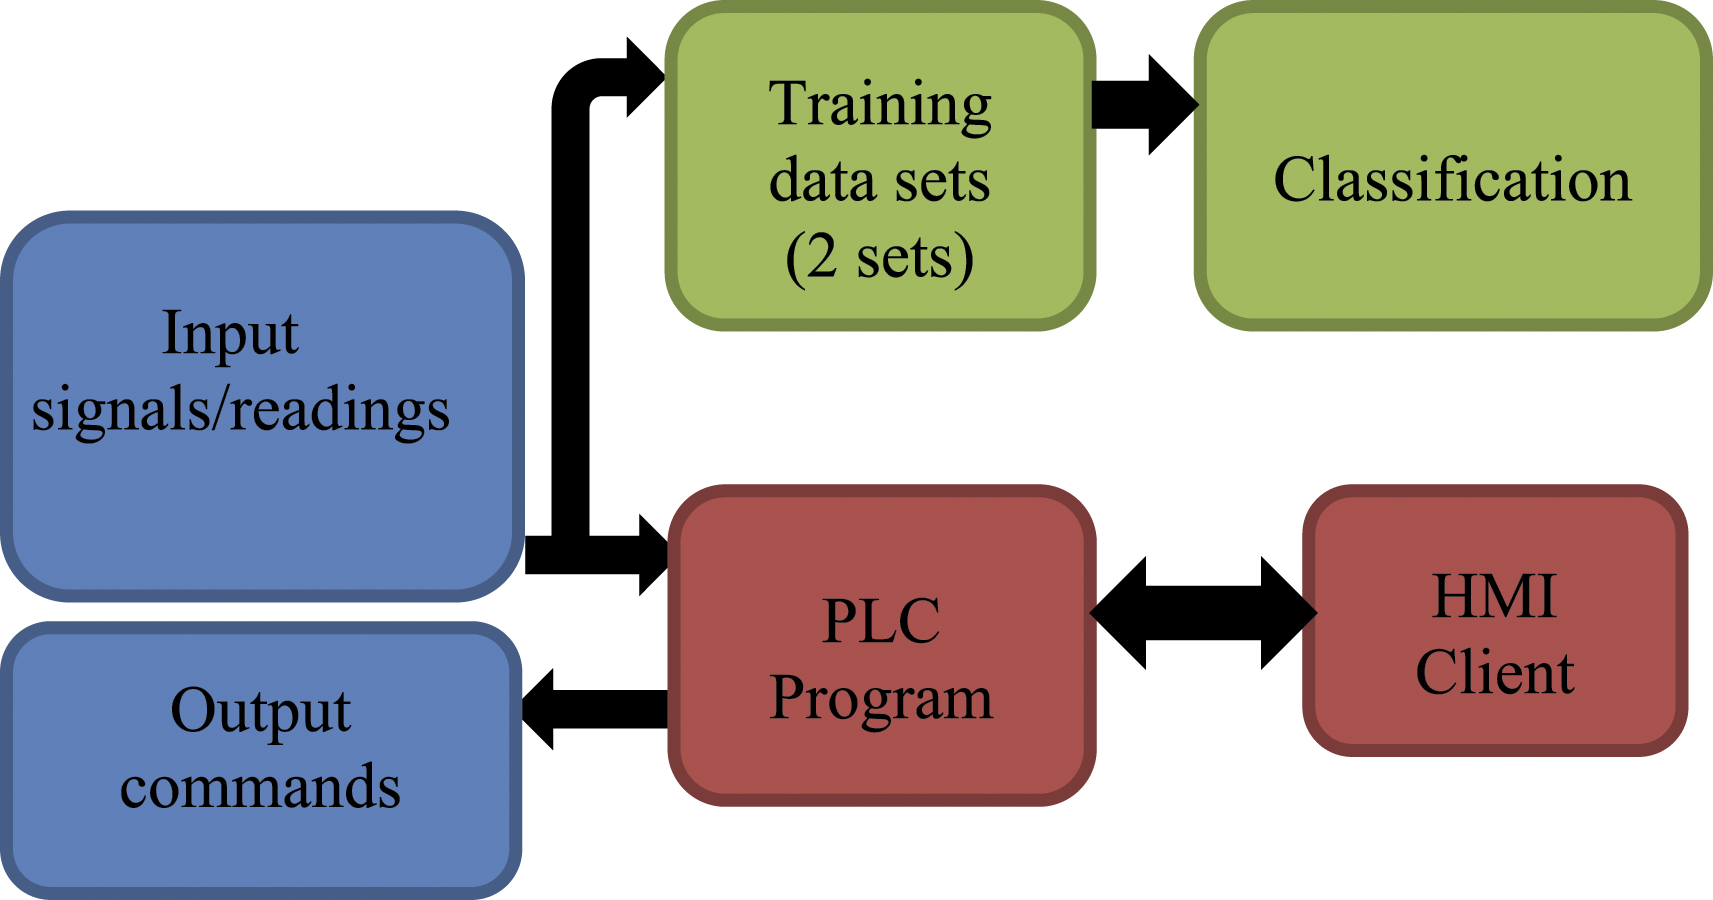
The framework regulates the crude oil product terminals of the storage facilities and loading docks. The terminal is composed of three groups of the same size. Every group provides a specific type of product. Every product is brought from a separate delivery line. • Group A is employed to store and load diesel. • Group B is employed to store and load kerosene. • Group C is employed to store and load gasoline.
Every group involves an input feeder line, three storage tanks, and three load pump modules. The feeder line provides every tank all through a manifold valve. The valve is manually controlled by HMI. Each tank has an automatic mixer that controls the tank level reading by the input/output valve verification signal and the tank level reading. The exits of each tank are connected to the common headers via an exit valve controlled manually by HMI. Every single load pump module includes a loading pump, suction valve, and discharge valve, and the load pump module controls either manually or in semi-auto mode. In manual mode, operators can control each piece of equipment separately from the HMI. Operators can control the operation of modules with a single push start/stop button in semi-auto mode. Firstly, the suction valves and discharge valves are automatically opened in the start-up sequence. Then, when the valve opens, the pump automatically begins. In the stop sequence, the pump is first stopped, and the suction and discharge valves are closed automatically.
Description of the control logic
The tasks introduced in the paper are created using the main program. The program consists of subroutines as shown in Figure 3. The initial routine is named (Main-Routine), which performs all other routines. Then, the following routine namely (GROUP_A), executes the control logic components of group A. Next, the following routine referred to as (GROUP_B), regulates all group B components. Finally, the last routine namely (GROUP_C) is controlling components of group C. The main program runs all other subroutines using the Jump to Subroutine Instructions (JSR).
43
The three tank groups’ logic is the same structure. They first move analogue data to the location of the desired memory and conduct valve control. After that, they control the tanks and pumps. Each system component logic is created using add-on instructions (AOIs), which are key in PLC programming. Those logics enable programmers to express ritual instructions in a way that maximizes re-use of code and simplifies development. Furthermore, it increases the program’s scanning time and decreases it more than usual. AOI is a function created by logic programmers that can be called anywhere in a routine. Establishing AOI is straightforward, however, it requires good knowledge of PLC programming. This is used if the code often uses exact strings. In this situation, AOI can help simplify code into a smaller number of rungs and accelerate programming. Moreover, it strengthens interfaces between logic and program labels.
44
The controller program subroutines.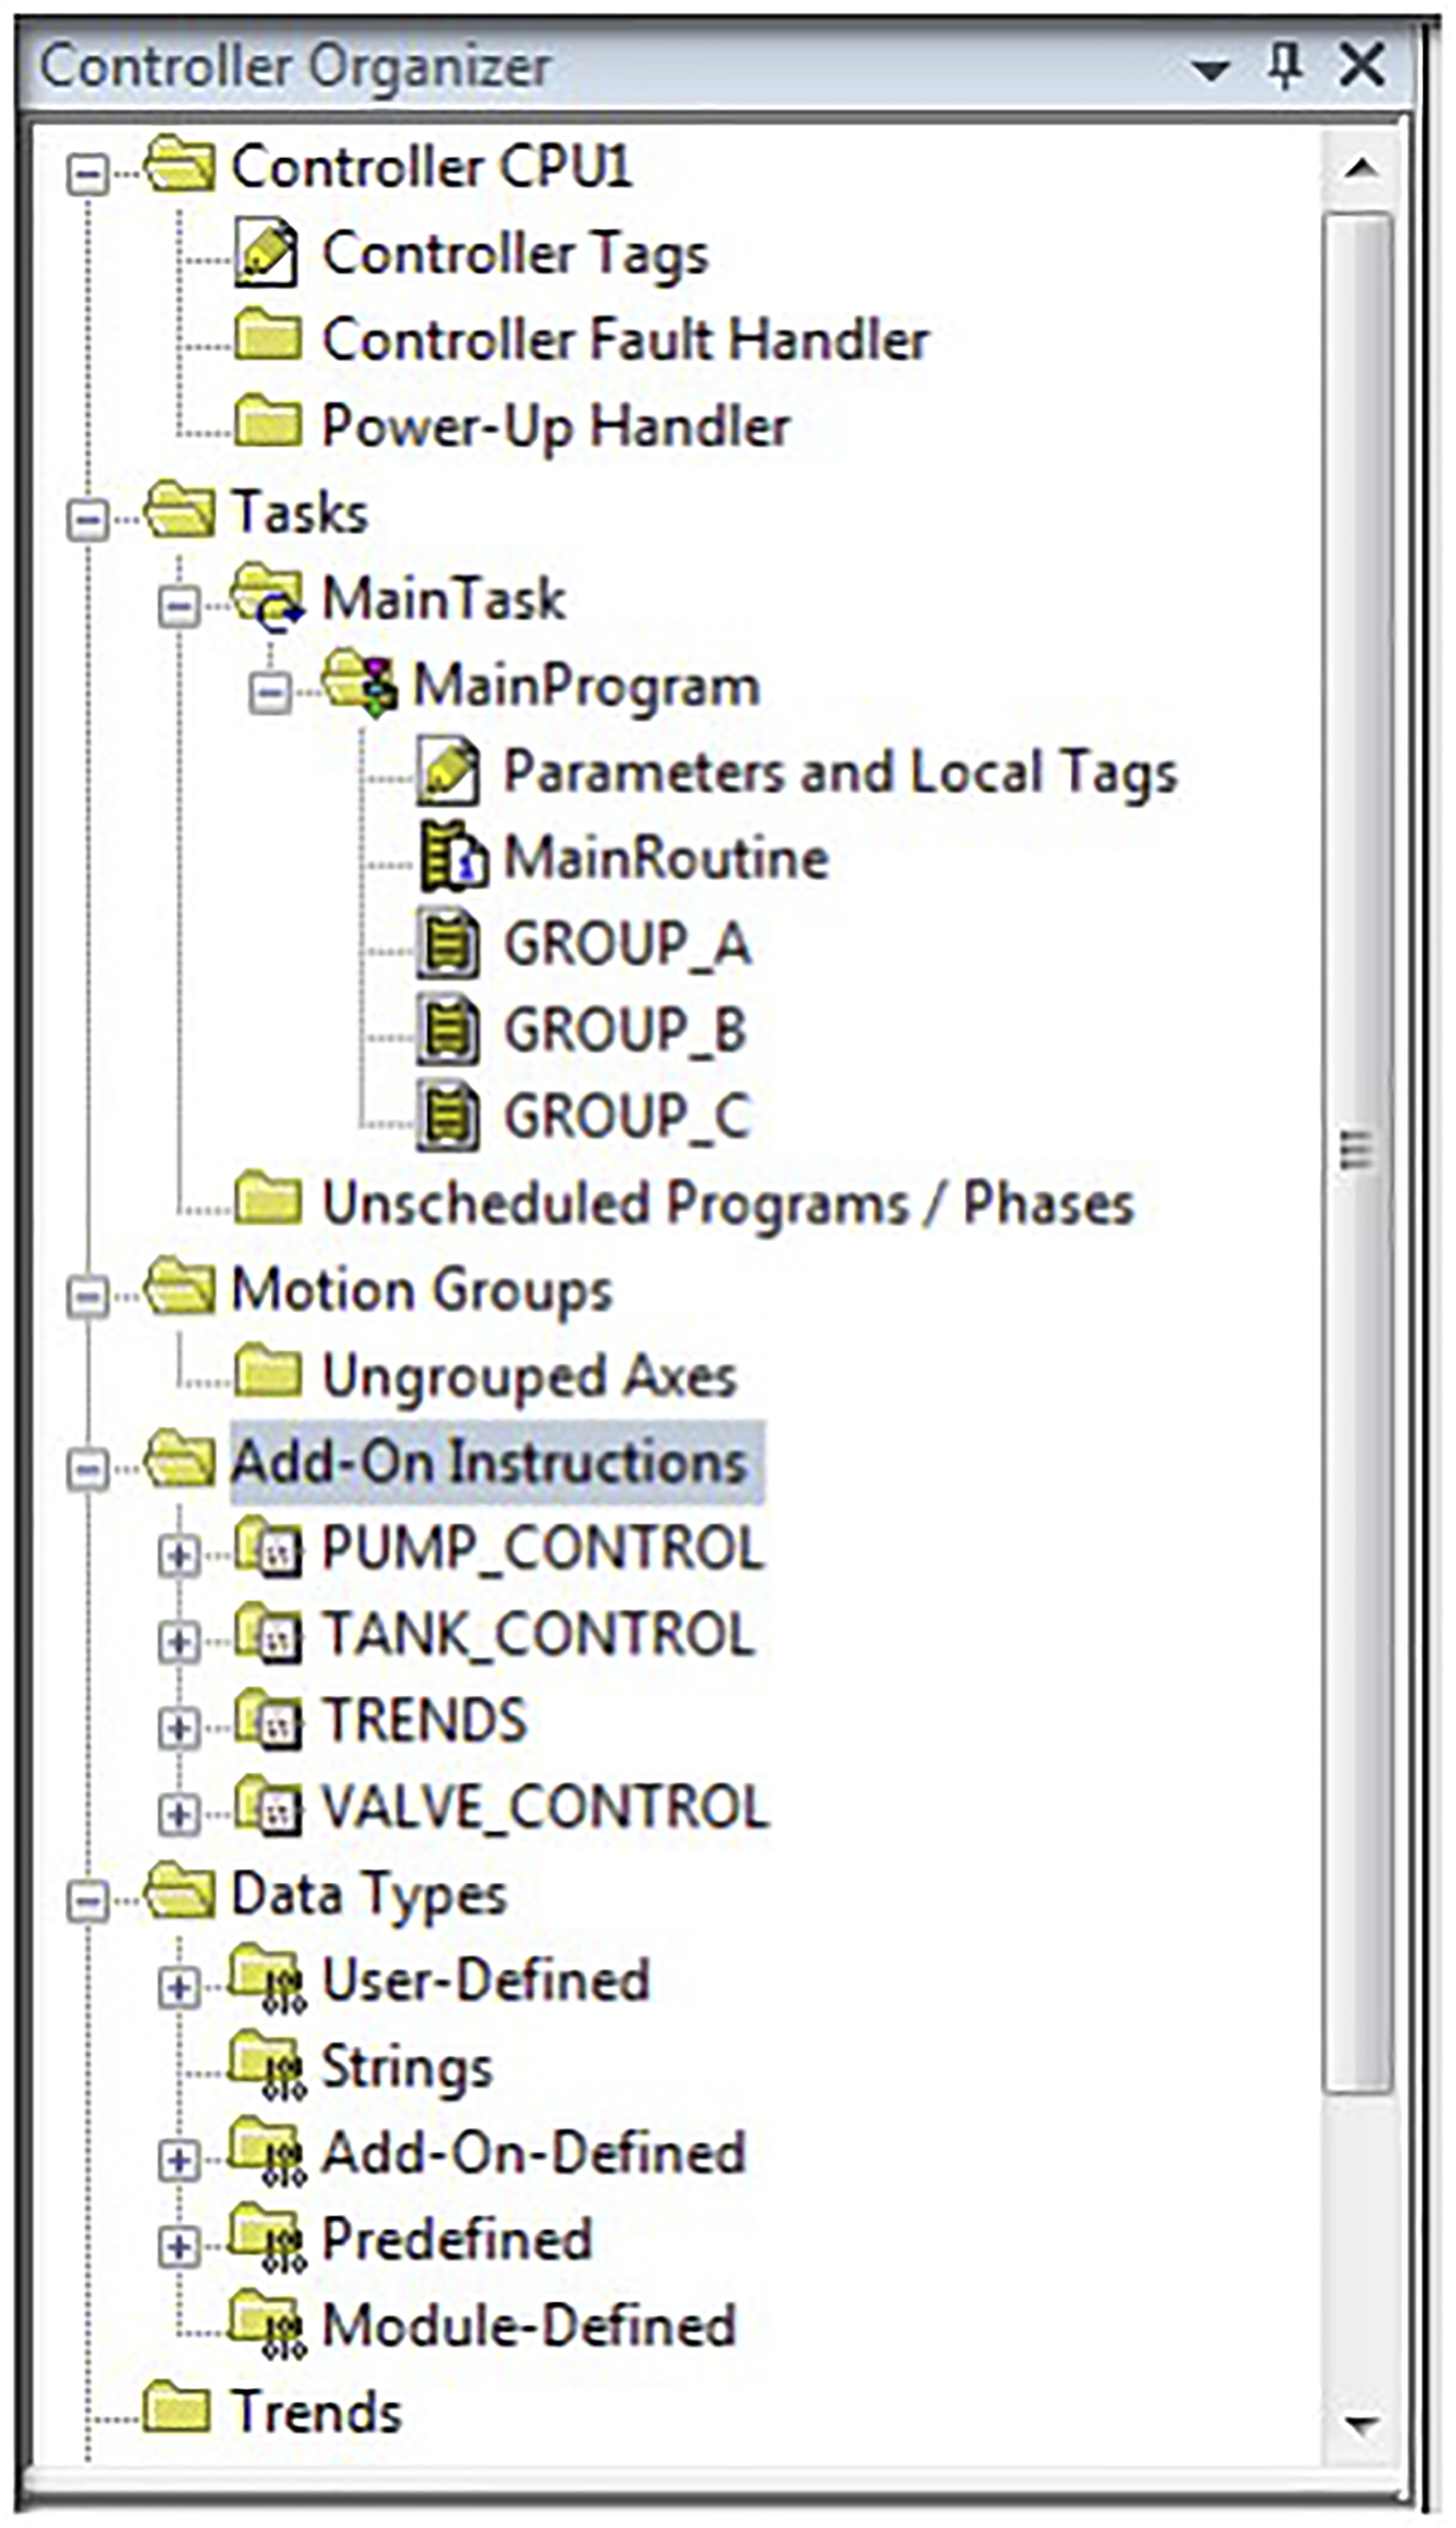
Advantages of employing a combination of AOI instructions are: • Facilitating the understanding of interfaces. • Simplifying maintenance and resolving errors. • Reducing the amount of rungs. • Decreasing the size of the program. • Lowering the scanning time of the cycle.
The program creates three types of AOIs and uses them for pumps control, tank control, and valve control as shown in Figure 4. Pumps, tanks, and valves Add-on commands.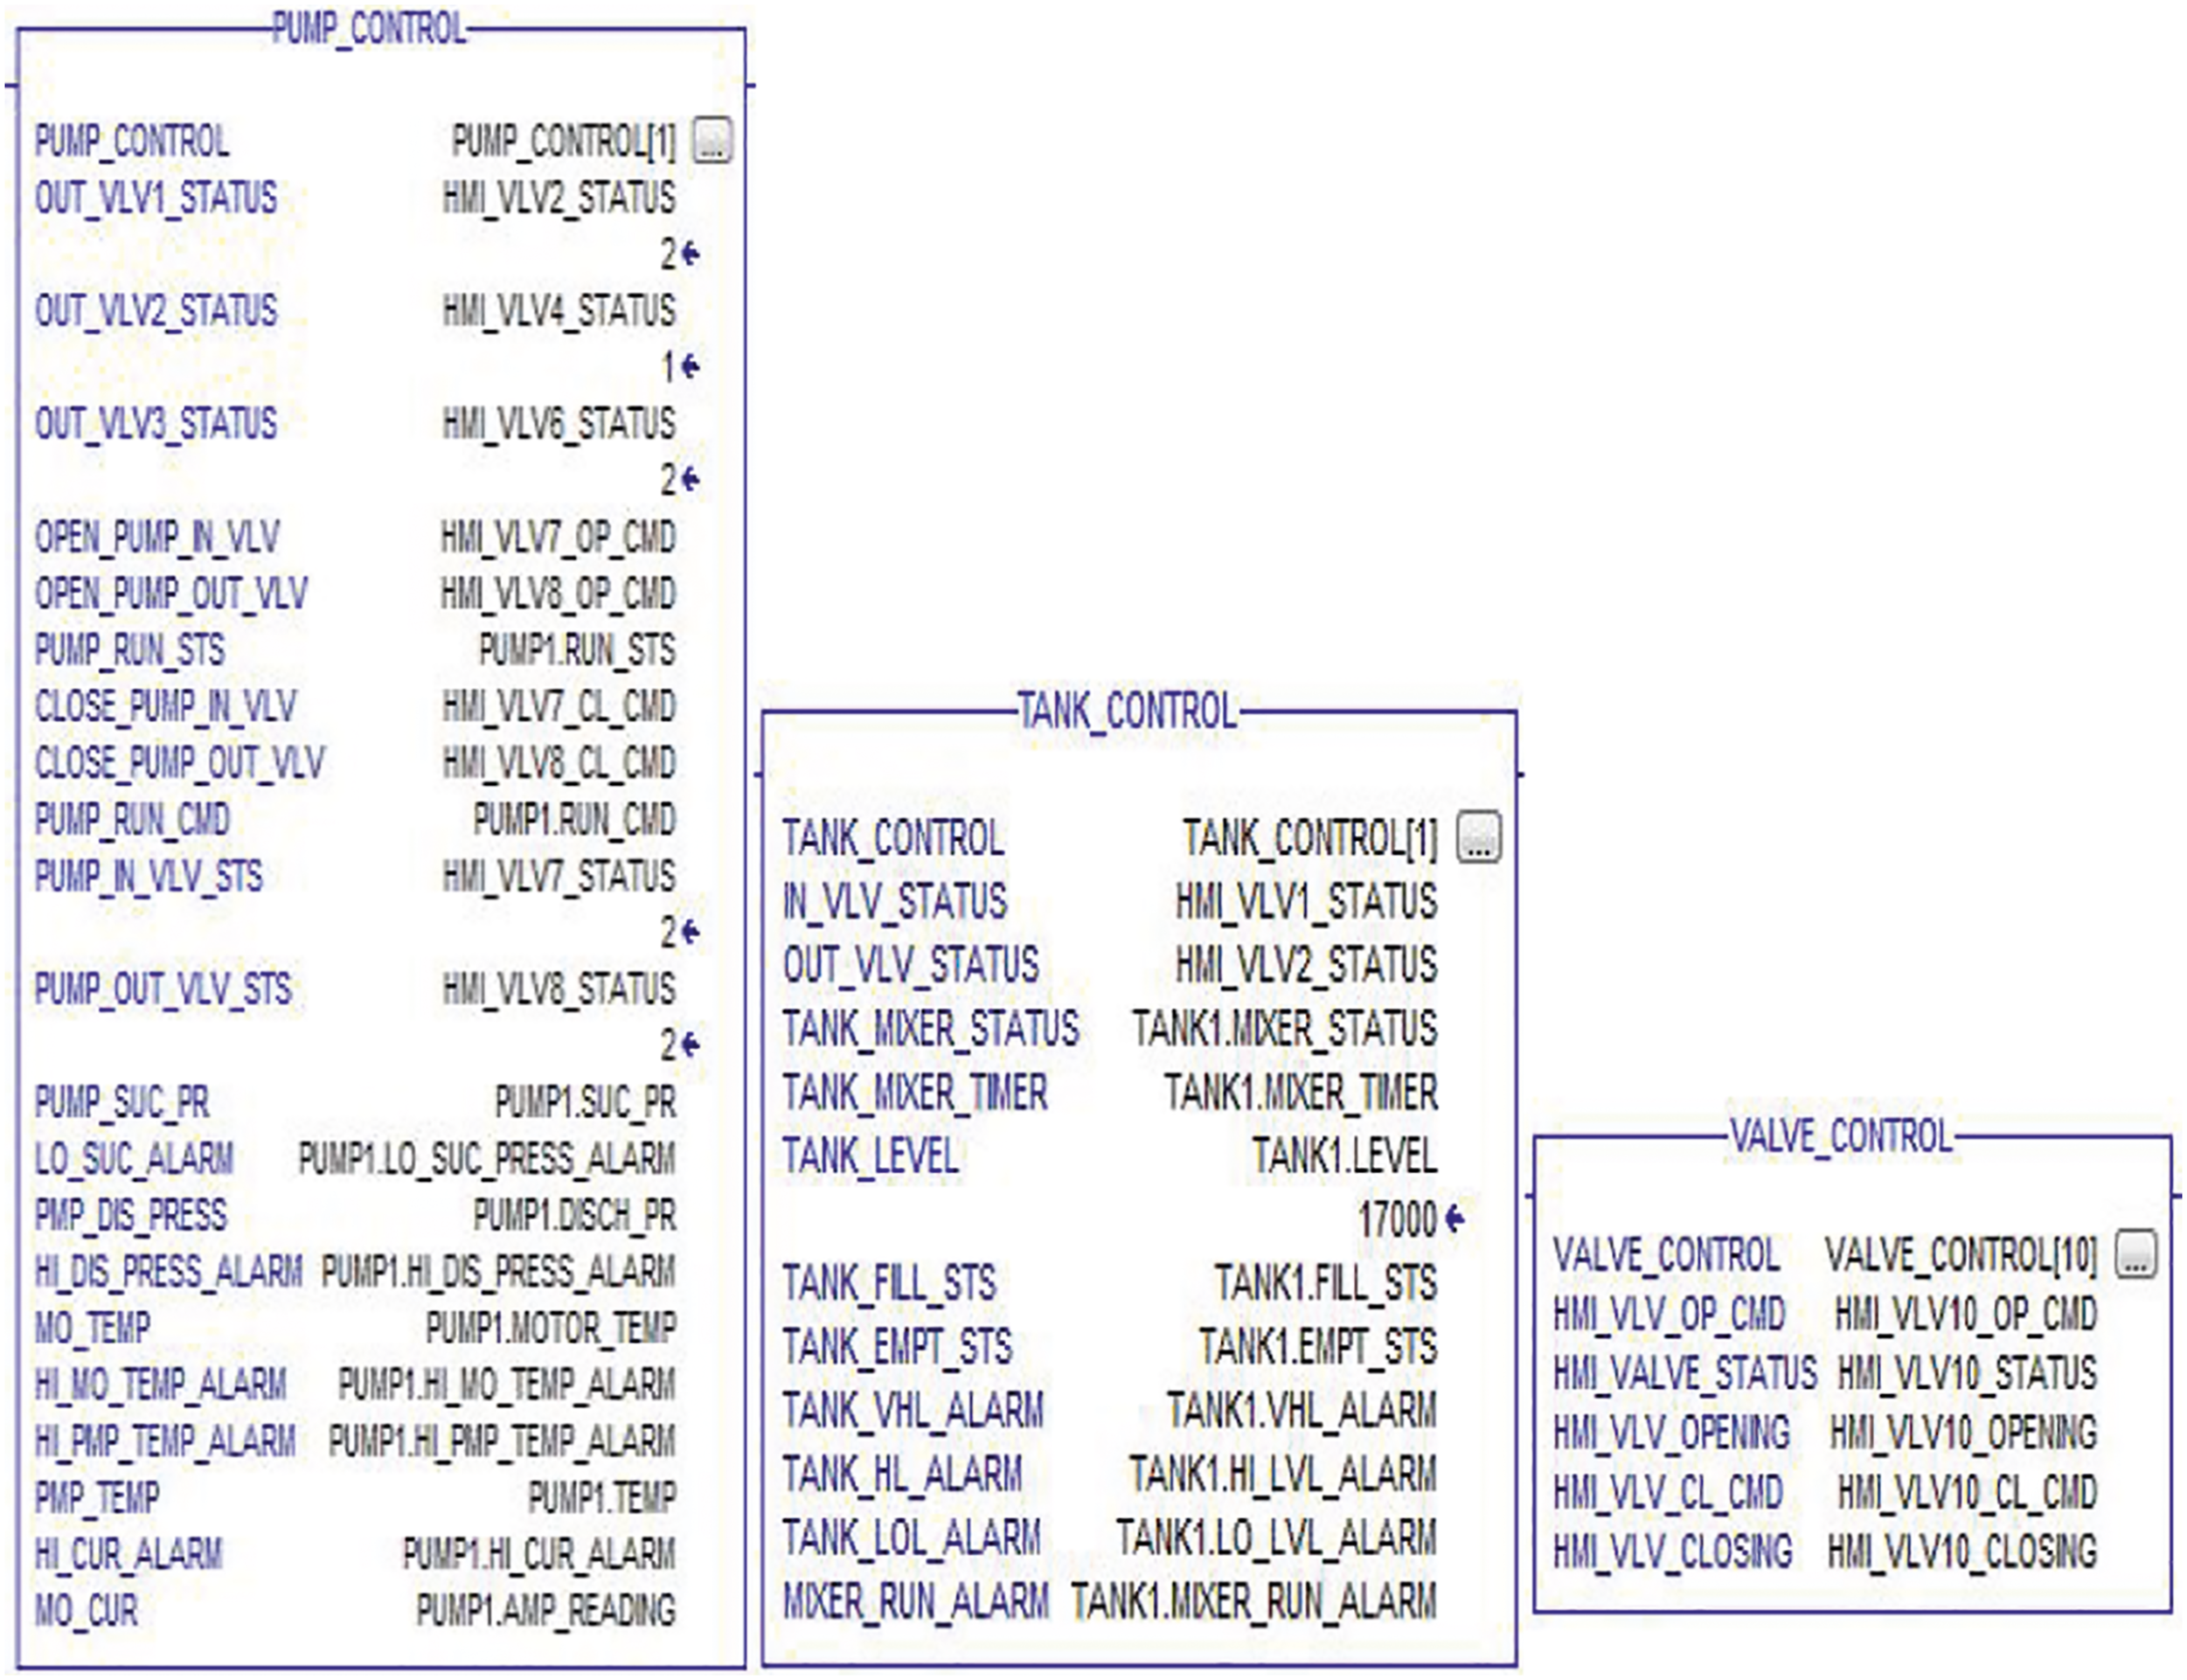
Home page display
This section describes the HMI home page display. Figure 5 shows the main display of the terminal. It consists of three button panels. Each panel is dedicated to a separate group. Each group has its own selection list. The first button is the process button, which opens the tank group display to control the process flow and show the reading data. These data include information regarding open or close valves and start or stop pumps. The second button is for showing the tank’s trends. All group tank trends’ data are merged in one trend display. The third button is for the first pump unit trend in the pumping station and the last two buttons. Each one opens a separate trend display for each pump unit. An alarm line displays the last alarm, its time, date, and status at the bottom. Each warning’s status is described by its color, which will be explained in the HMI alarm page section (Human machine interface Alarm page). Under the alarm line, the navigation bar exists, facilitating the movement between different system displays. It contains the most used and essential buttons. Like the home page button, the various process displays buttons and the alarm page button. Also, there is a name bar that shows the current display name on the screen. Next to it, there are the time and date bars which offer the present time, weekday name, month name, day number, and year. Both the alarm line and navigation bar are docked at the bottom of each display of the GUI. Home Page with alarm line and navigation bar.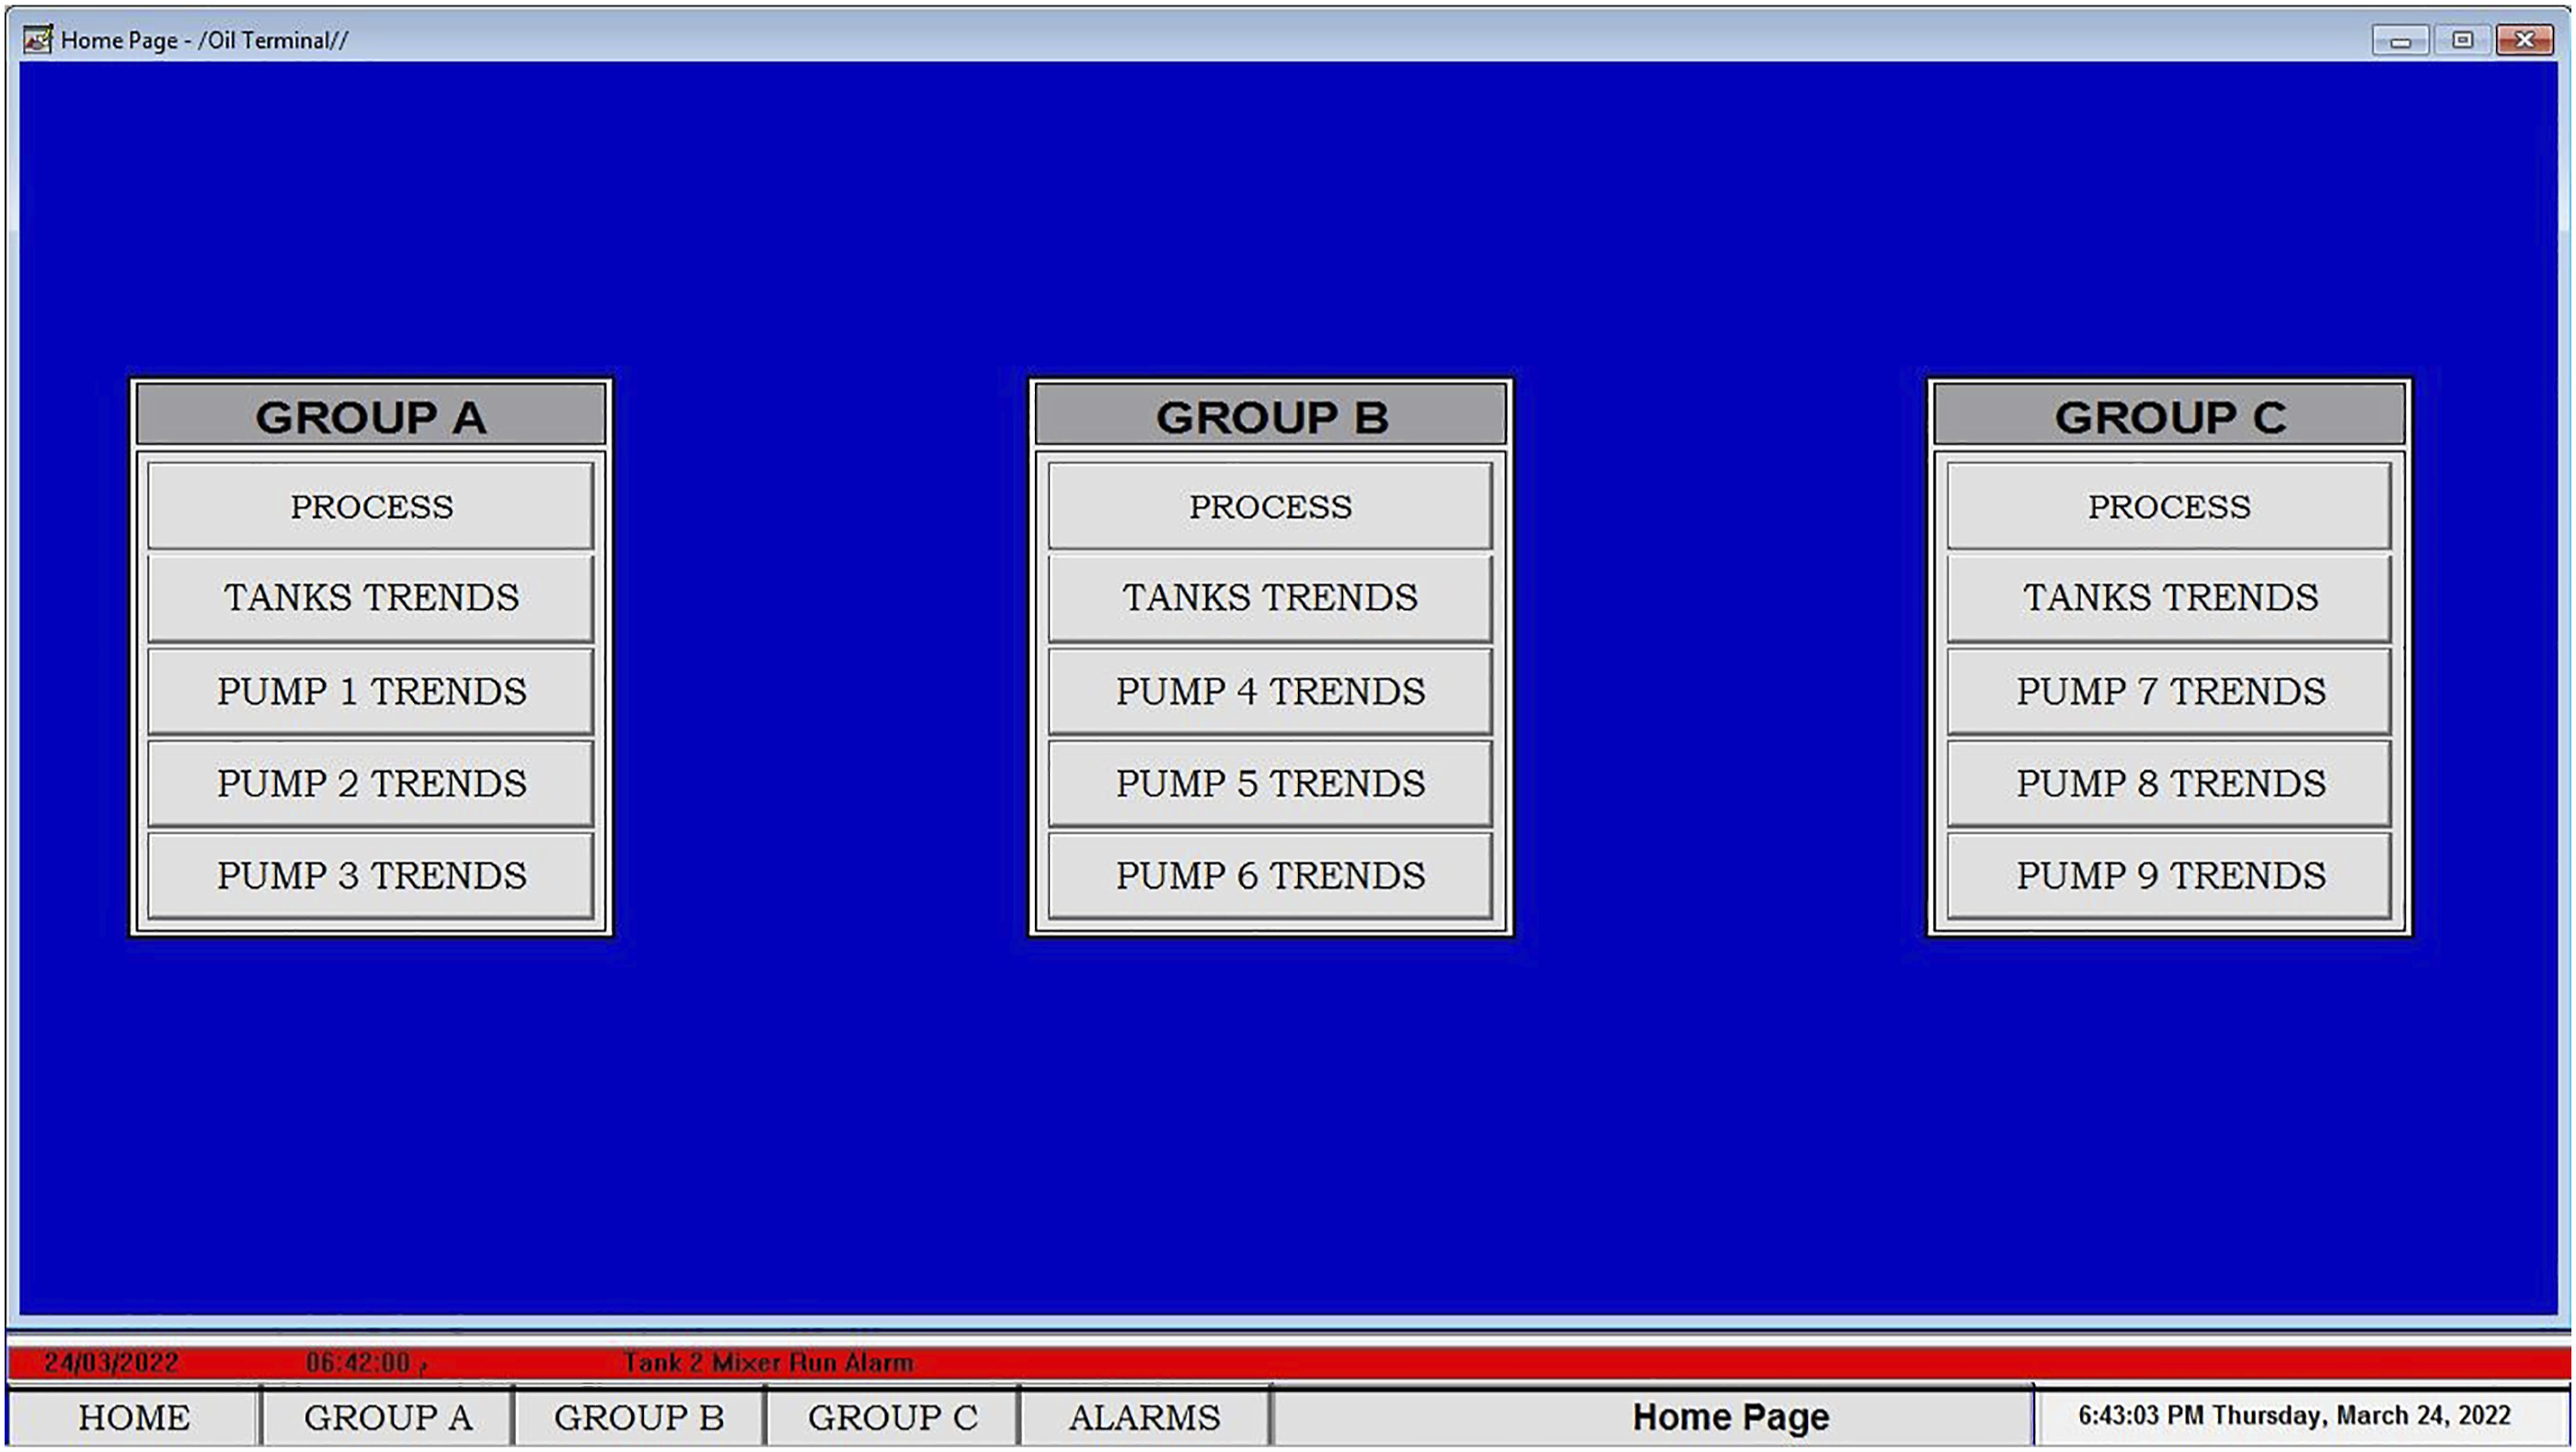
Group A tanks/pumps GUI
Group A display consists of: • A feeder line which is dedicated for diesel transfer to tanks group. • A motor-operated valve (MOV_0) at the inlet of the tank group. • Motor-operated valves (MOV_1,3,5) at the inlet of tanks (T-1,2,3). • Floating roof storage tanks (T-1,2,3). Floating roof tanks were selected to prevent gases evaporation and, in turn, reduce fire and explosion risks from volatile stock.
4
• Ultrasonic level gauging device for each tank.
45
• RTD temperature sensors to measure the liquid temperature in each tank.
46
• Motor-operated mixers. Each tank has one mixer. To ensure heat distribution to all product levels. • Motor-operated valves (MOV_2,4,6) at the outlet of tanks (T-1,2,3). • Motor-operated valves (MOV_7,9,11) at the suction of each pump unit (PUMP-1,2,3). • Pumping units for diesel loading (PUMP_1,2,3). • Motor-operated valves (MOV_8,10,12) at the discharge of each pump unit. • Pressure transmitters to measure the loading pump’s suction and discharge pressures.
45
• Current transmitter to measure pump’s motors current.
17
• RTD temperature sensors to measure pumps and motors’ temperatures during operation.
46
• Turbine flow meter to measure the amount loaded from each pump.
45
The first group of tanks is created for diesel storage and loading. Figure 6 shows the process of displaying group A. The diesel enters the feeder line of the group through the group inlet valve (MOV_0). The diesel level is controlled in each tank through the inlet valves (MOV_1,3,5) and outlet valves (MOV_2,4,6). The level is shown in each tank by a filling bar and a numeric value. A numeric value indicates the temperature value of diesel inside the tank under the tank level value. Each tank has its own mixer, which is operated automatically. An up/down arrow represents the filling/discharging status of each tank. The outlets of the three tanks are connected to the common pump suction header. The diesel is loaded through three loading pumps (PUMP_1,2,3). Each loading pump is fed by diesel through a suction valve (MOV_7,9,11) and discharged through a discharge valve (MOV_8,10,12). The Auto/Manual Push buttons are used to select the control mode of the loading pump. The status of the selected control mode is shown beside each pump. The operation parameters belonging to each pump are presented above the pump, such as suction pressure, discharge pressure, motor temperature, pump temperature, and motor current. The loaded amount from each pump is measured by a flowmeter and presented as a numeric value. Tank group A for diesel storage and loading.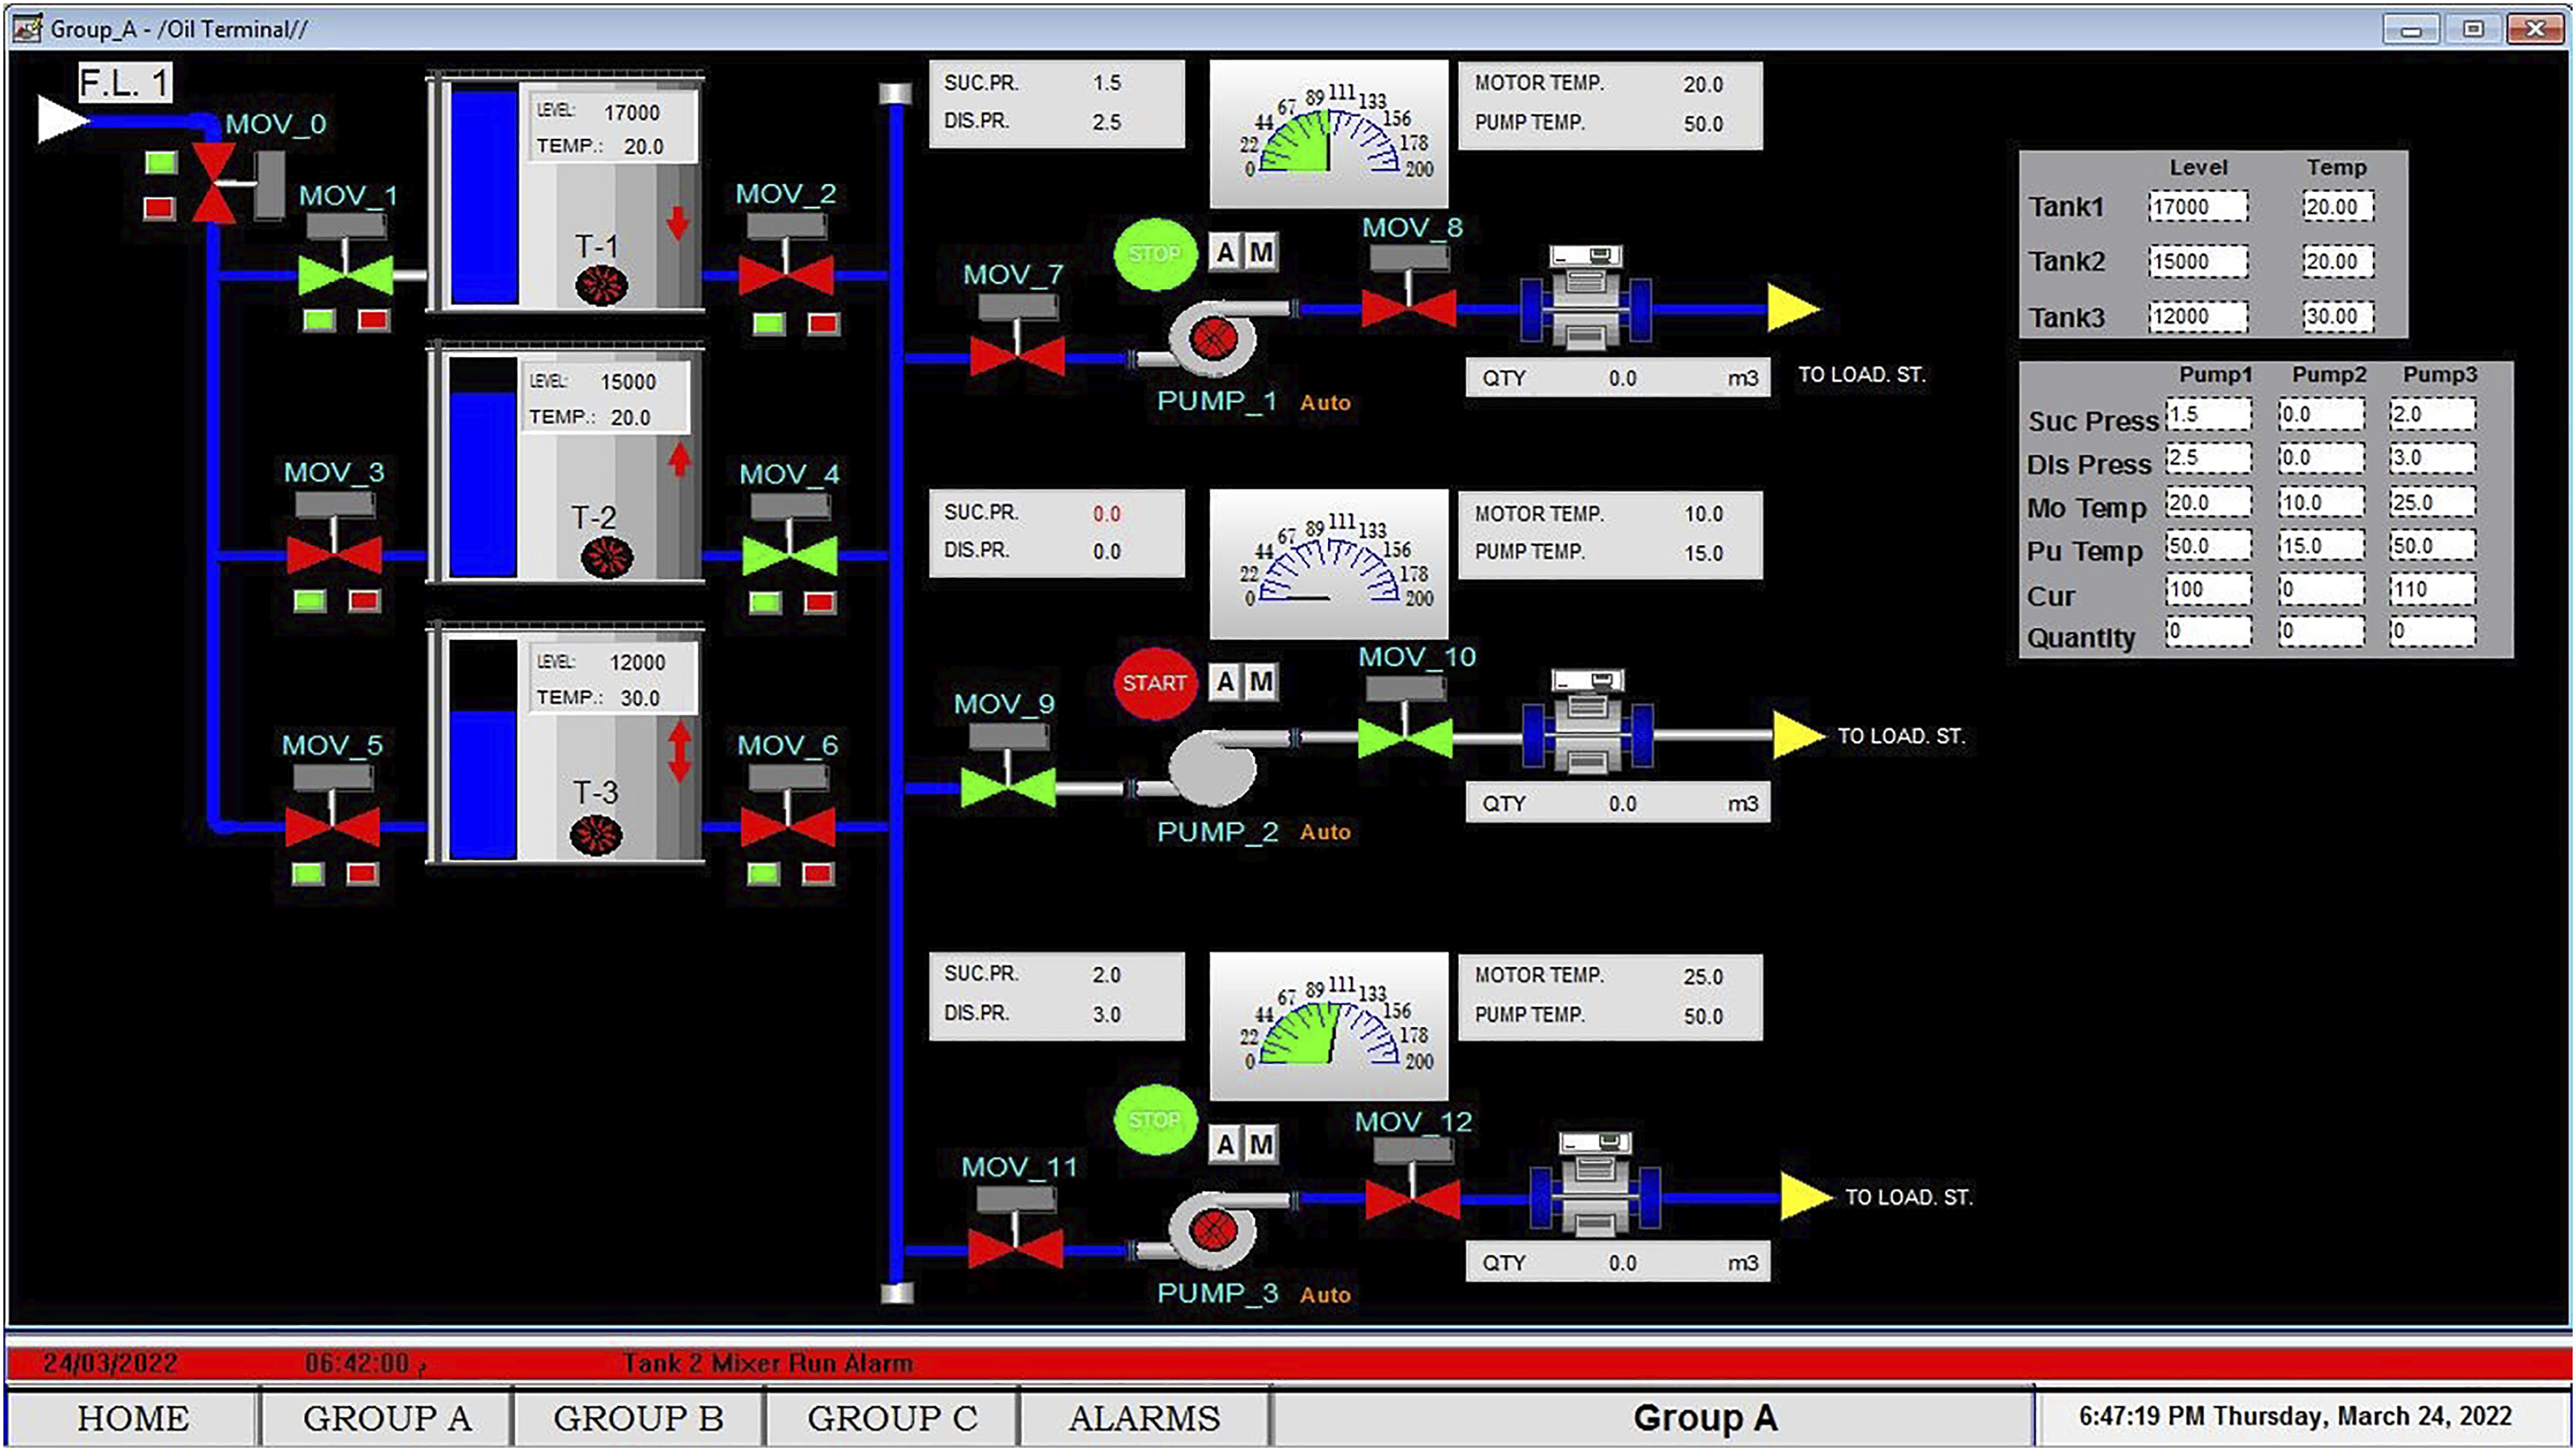
Group B tanks/pumps GUI
Group B display consists of: • A feeder line is dedicated for kerosene transfer to the tanks group. • A motor-operated valve (MOV_13) at the inlet of the tank group. • Motor operated valves (MOV_14,16,18) at the inlet of tanks (T-4,5,6). • Floating roof storage tanks (T-4,5,6). • Ultrasonic level gauging device for each tank.
45
• RTD temperature sensors to measure the liquid temperature in each tank.
46
• Motor-operated mixers. Each tank has one mixer. To ensure heat distribution to all product levels. • Motor operated valves (MOV_15,17,19) at the outlet of tanks (T-4,5,6). • Motor operated valves (MOV_20,22,24) at the suction of each pump unit (PUMP-4,5,6). • Pumping units for kerosene loading (PUMP_4,5,6). • Motor-operated valves (MOV_21,23,25) at the discharge of each pump unit. • Pressure transmitters to measure the loading pump’s suction and discharge pressures.
45
• Current transmitter to measure pump’s motor currents.
45
• RTD temperature sensors to measure pumps and motors' temperatures during operation.
46
• Turbine flow meter to measure the amount loaded from each pump.
45
The second group of tanks is created for kerosene storage and loading. Figure 7 shows the process display of group B. The kerosene enters the feeder line of the group through the group inlet valve (MOV_13). The kerosene level is controlled in each tank through the inlet valves (MOV_14,16,18) and outlet valves (MOV_15,17,19). The level is shown in each tank by a filling bar and a numeric value. A numeric value indicates the temperature value of kerosene inside the tank under the tank level value. Every tank has its own mixer, which is operated automatically. An up/down arrow represents the filling/discharging status of each tank. The outlets of the three tanks are connected to the common pump suction header. The kerosene is loaded through three loading pumps (PUMP_4,5,6). Each loading pump is fed by kerosene through a suction valve (MOV_20,22,24) and discharged through a discharge valve (MOV_21,23,25). The Auto/Manual Push buttons are used to select the control mode of the loading pump. The status of the selected control mode is shown beside each pump. The operation parameters belonging to each pump are presented below the pump, such as suction pressure, discharge pressure, motor temp, pump temp, and motor current. The loaded amount from each pump is measured by a flowmeter and presented as a numeric value. Tank group B for kerosene storage and loading.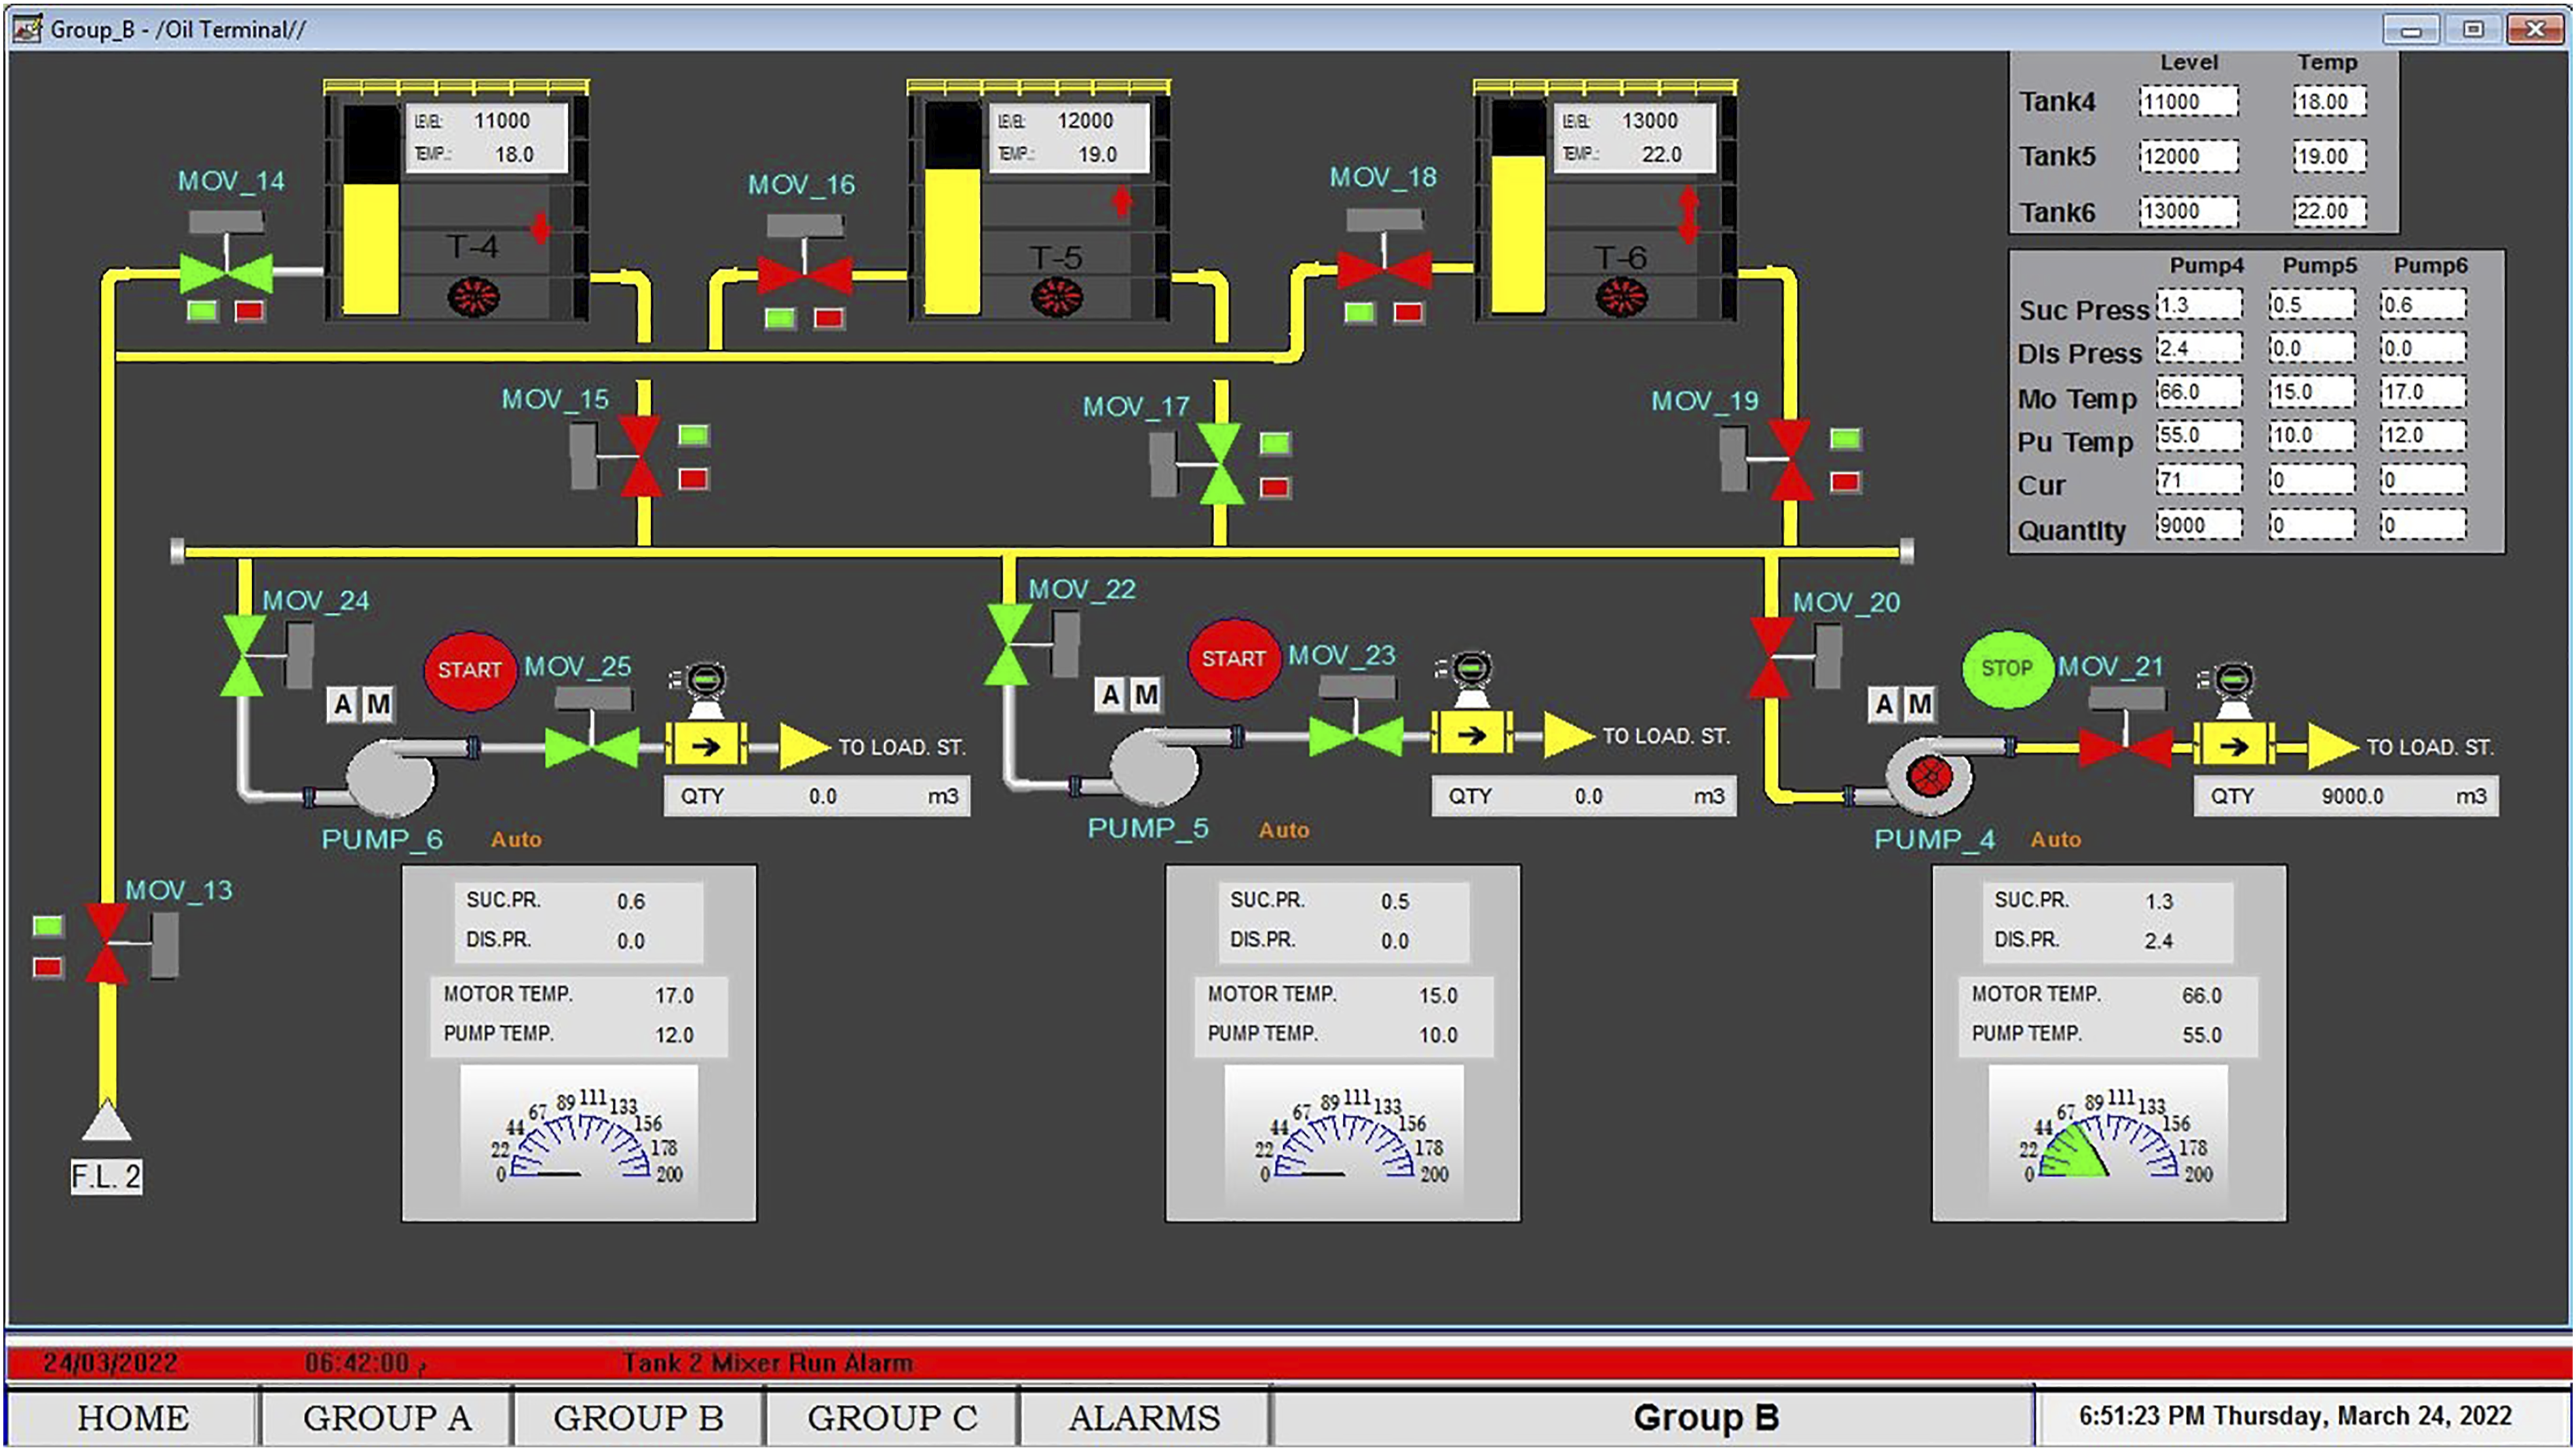
Group C tanks/pumps GUI
Group C display consists of: • A feeder line is dedicated for gasoline transfer to the tanks group. • A motor-operated valve (MOV_32) at the inlet of the tank group. • Motor-operated valves (MOV_26,28,30) at the inlet of tanks (T-7,8,9). • Floating roof storage tanks (T-7,8,9). • Ultrasonic level gauging device for each tank.
45
• RTD temperature sensors to measure the liquid temperature in each tank.
46
• Motor-operated mixers. Each tank has one mixer. To ensure heat distribution to all product levels. • Motor-operated valves (MOV_27,29,31) at the outlet of tanks (T-7,8,9). • Motor-operated valves (MOV_33,35,37) at the suction of each pump unit (PUMP-7,8,9). • Pumping units for gasoline loading (PUMP_7,8,9). • Motor-operated valves (MOV_34,36,38) at the discharge of each pump unit. • Pressure transmitters to measure the loading pump’s suction and discharge pressures.
45
• Current transmitter to measure pump’s motor currents.
45
• RTD temperature sensors to measure pumps and motors' temperatures during operation.
46
• Turbine flow meter to measure the amount loaded from each pump.
45
The third group of tanks is created for gasoline storage and loading. Figure 8 shows the process display of group C. The gasoline enters this group of tanks through the inlet valve (MOV_32) on the feeder line of the group. The gasoline level is controlled in tanks 7, 8, and 9 through their inlet valves (MOV_26,28,30) and outlet valves (MOV_27,29,31). Tank level is shown in each tank by a filling bar and a numeric value display. A numeric value indicates the temperature value of gasoline inside each tank under the tank level value. Each tank has a mixer that is operated automatically. An up/down arrow represents the filling/discharging status of each tank. The outlets of the three tanks are connected to the common pump suction header. The gasoline is loaded through three loading pumps (PUMP_7,8,9). Each loading pump is fed by gasoline through a suction valve (MOV_33,35,37) and discharged through a discharge valve (MOV_34,36,38). The Auto/Manual Push buttons are used to select the control mode of the loading pump. The status of the selected control mode is shown beside each pump. The operation parameters belonging to each pump are presented below the pump, such as suction pressure, discharge pressure, motor temp, pump temp, and motor current. The loaded amount from each pump is measured by a flowmeter and presented as a numeric value. Tank group C for gasoline storage and loading.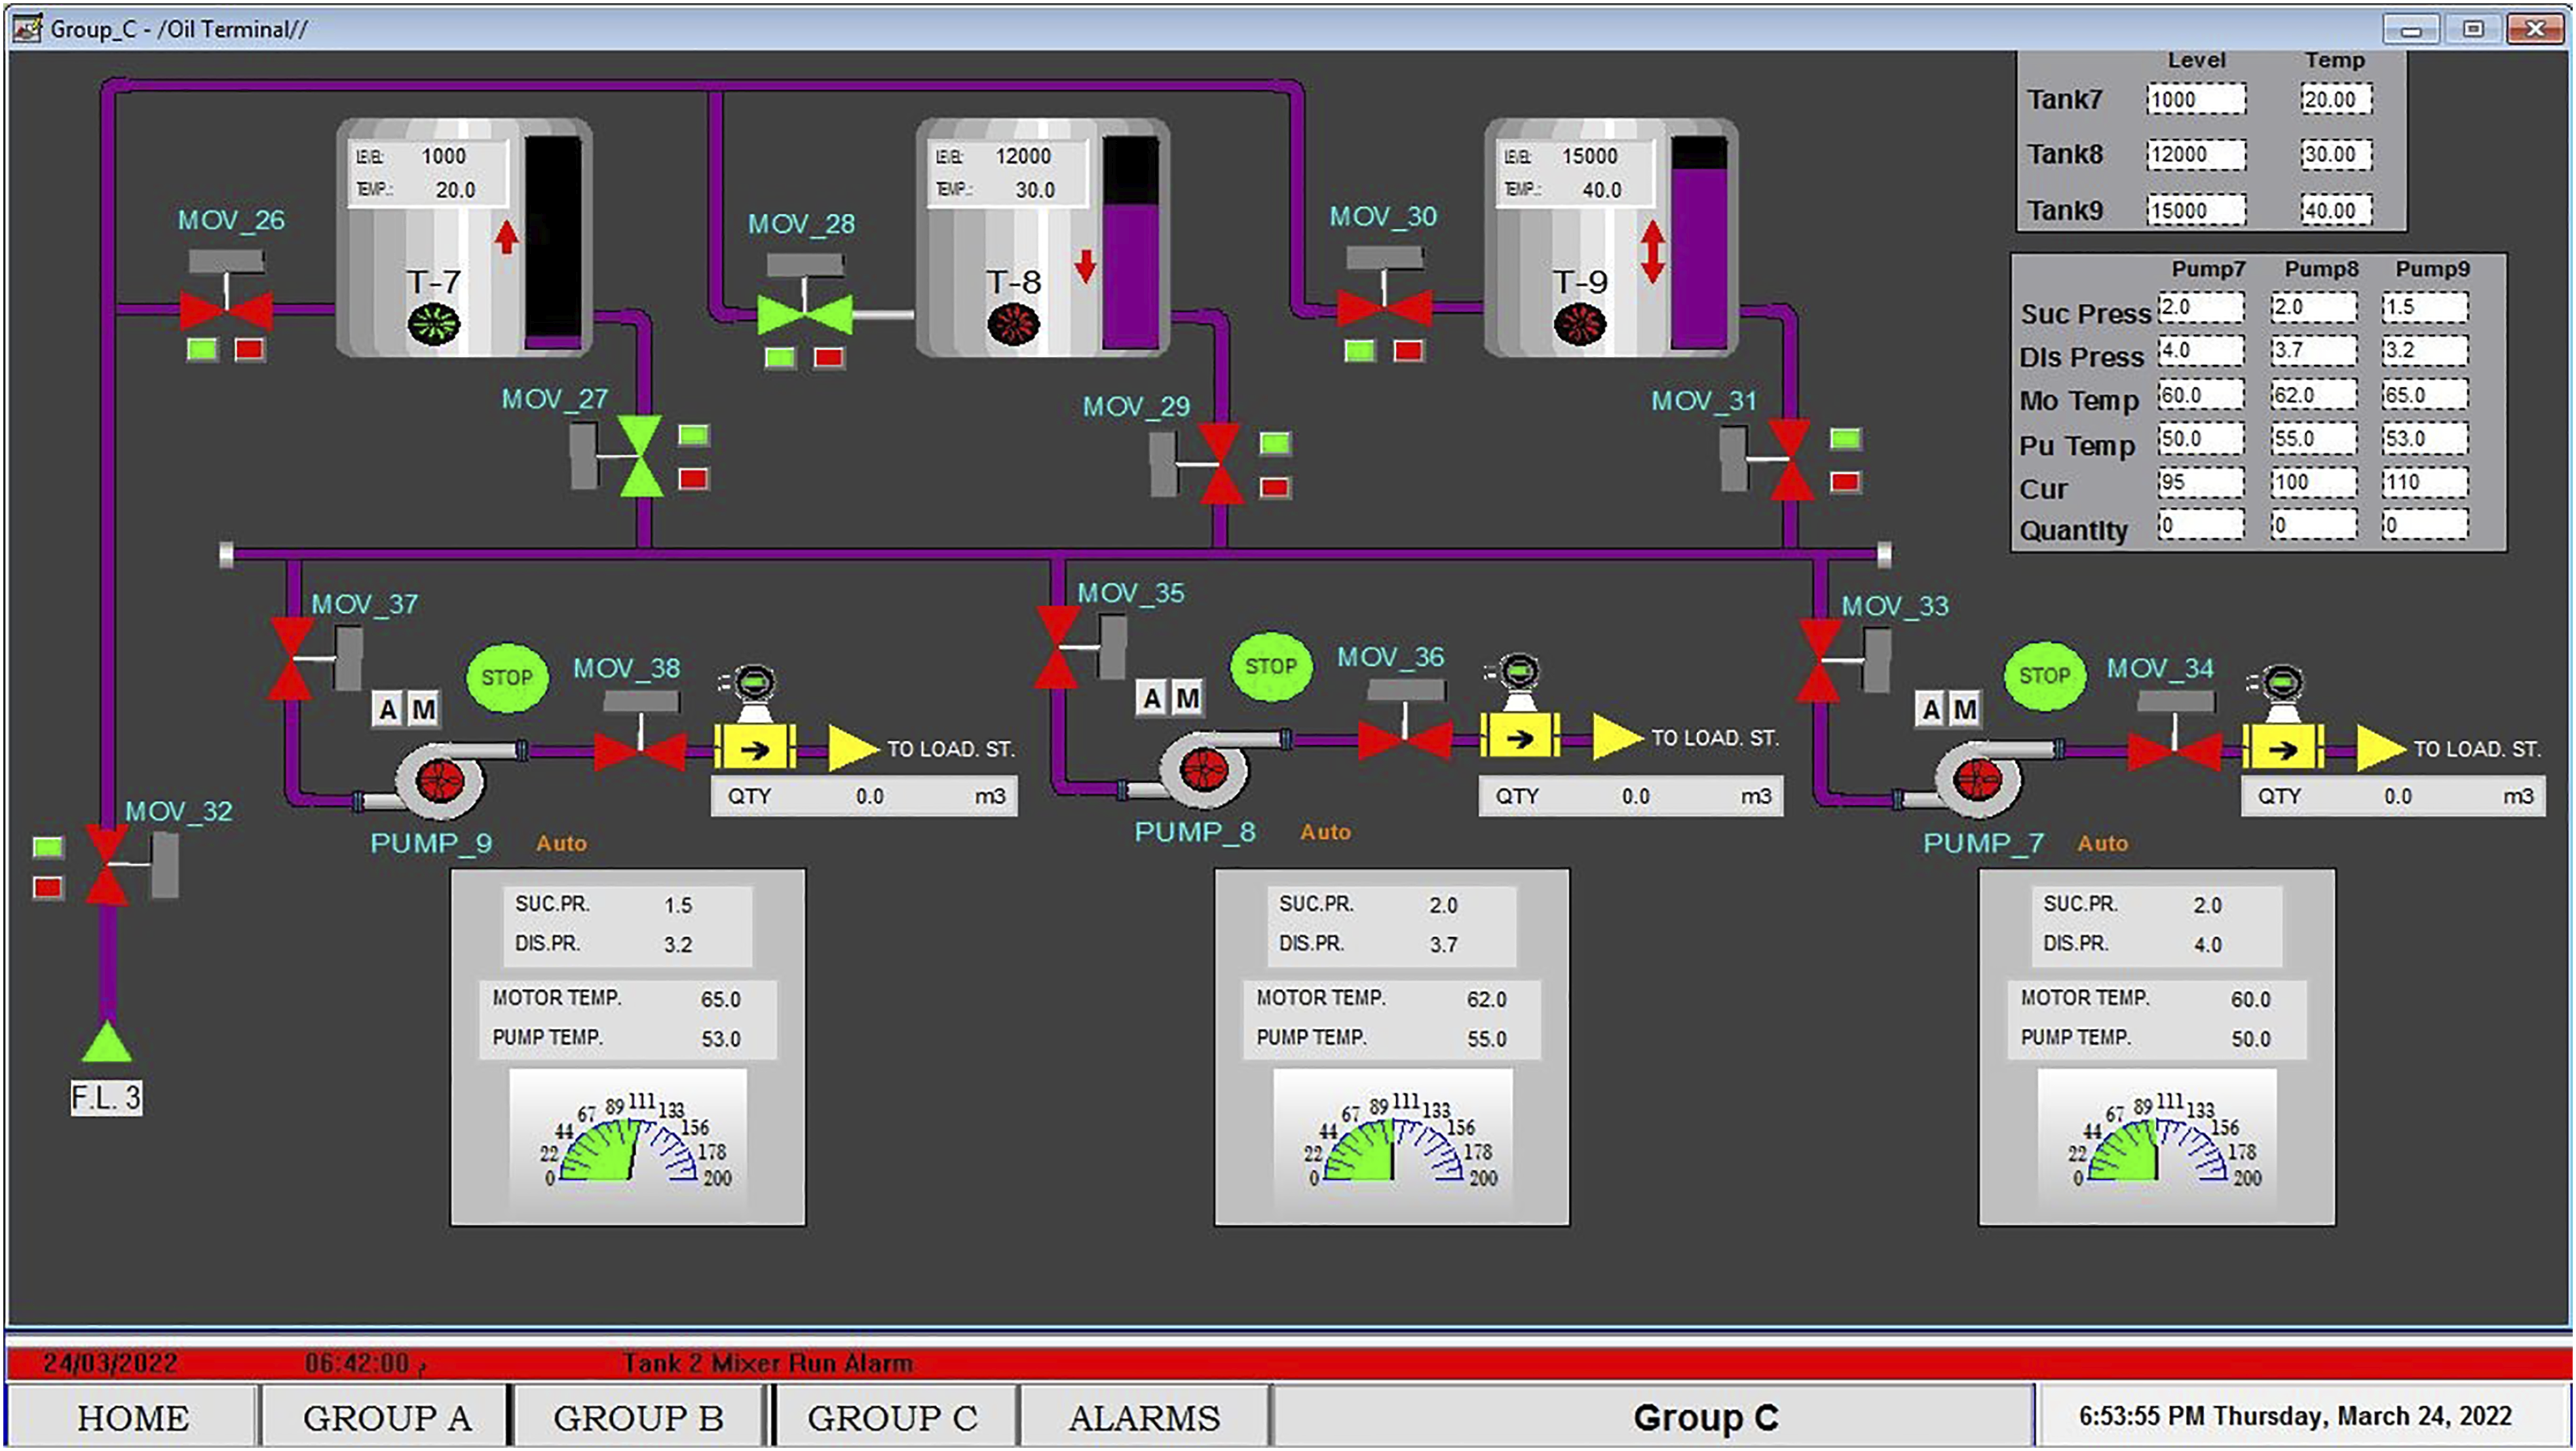
Human machine interface alarm page
The status of the process alarms related to each piece of equipment, such as tanks, pumps, and mixers, are shown in the HMI alarm page displayed in Figure 9. All notices are sorted by their trigger time. Each alarm is sounded beside its date, trigger time, and description, as shown in Figure 9. At the bottom of the page, there are a group of function pushbuttons such as; acknowledging the current alarm, acknowledging the page, acknowledging all warnings, and silence of notices. HMI alarm page.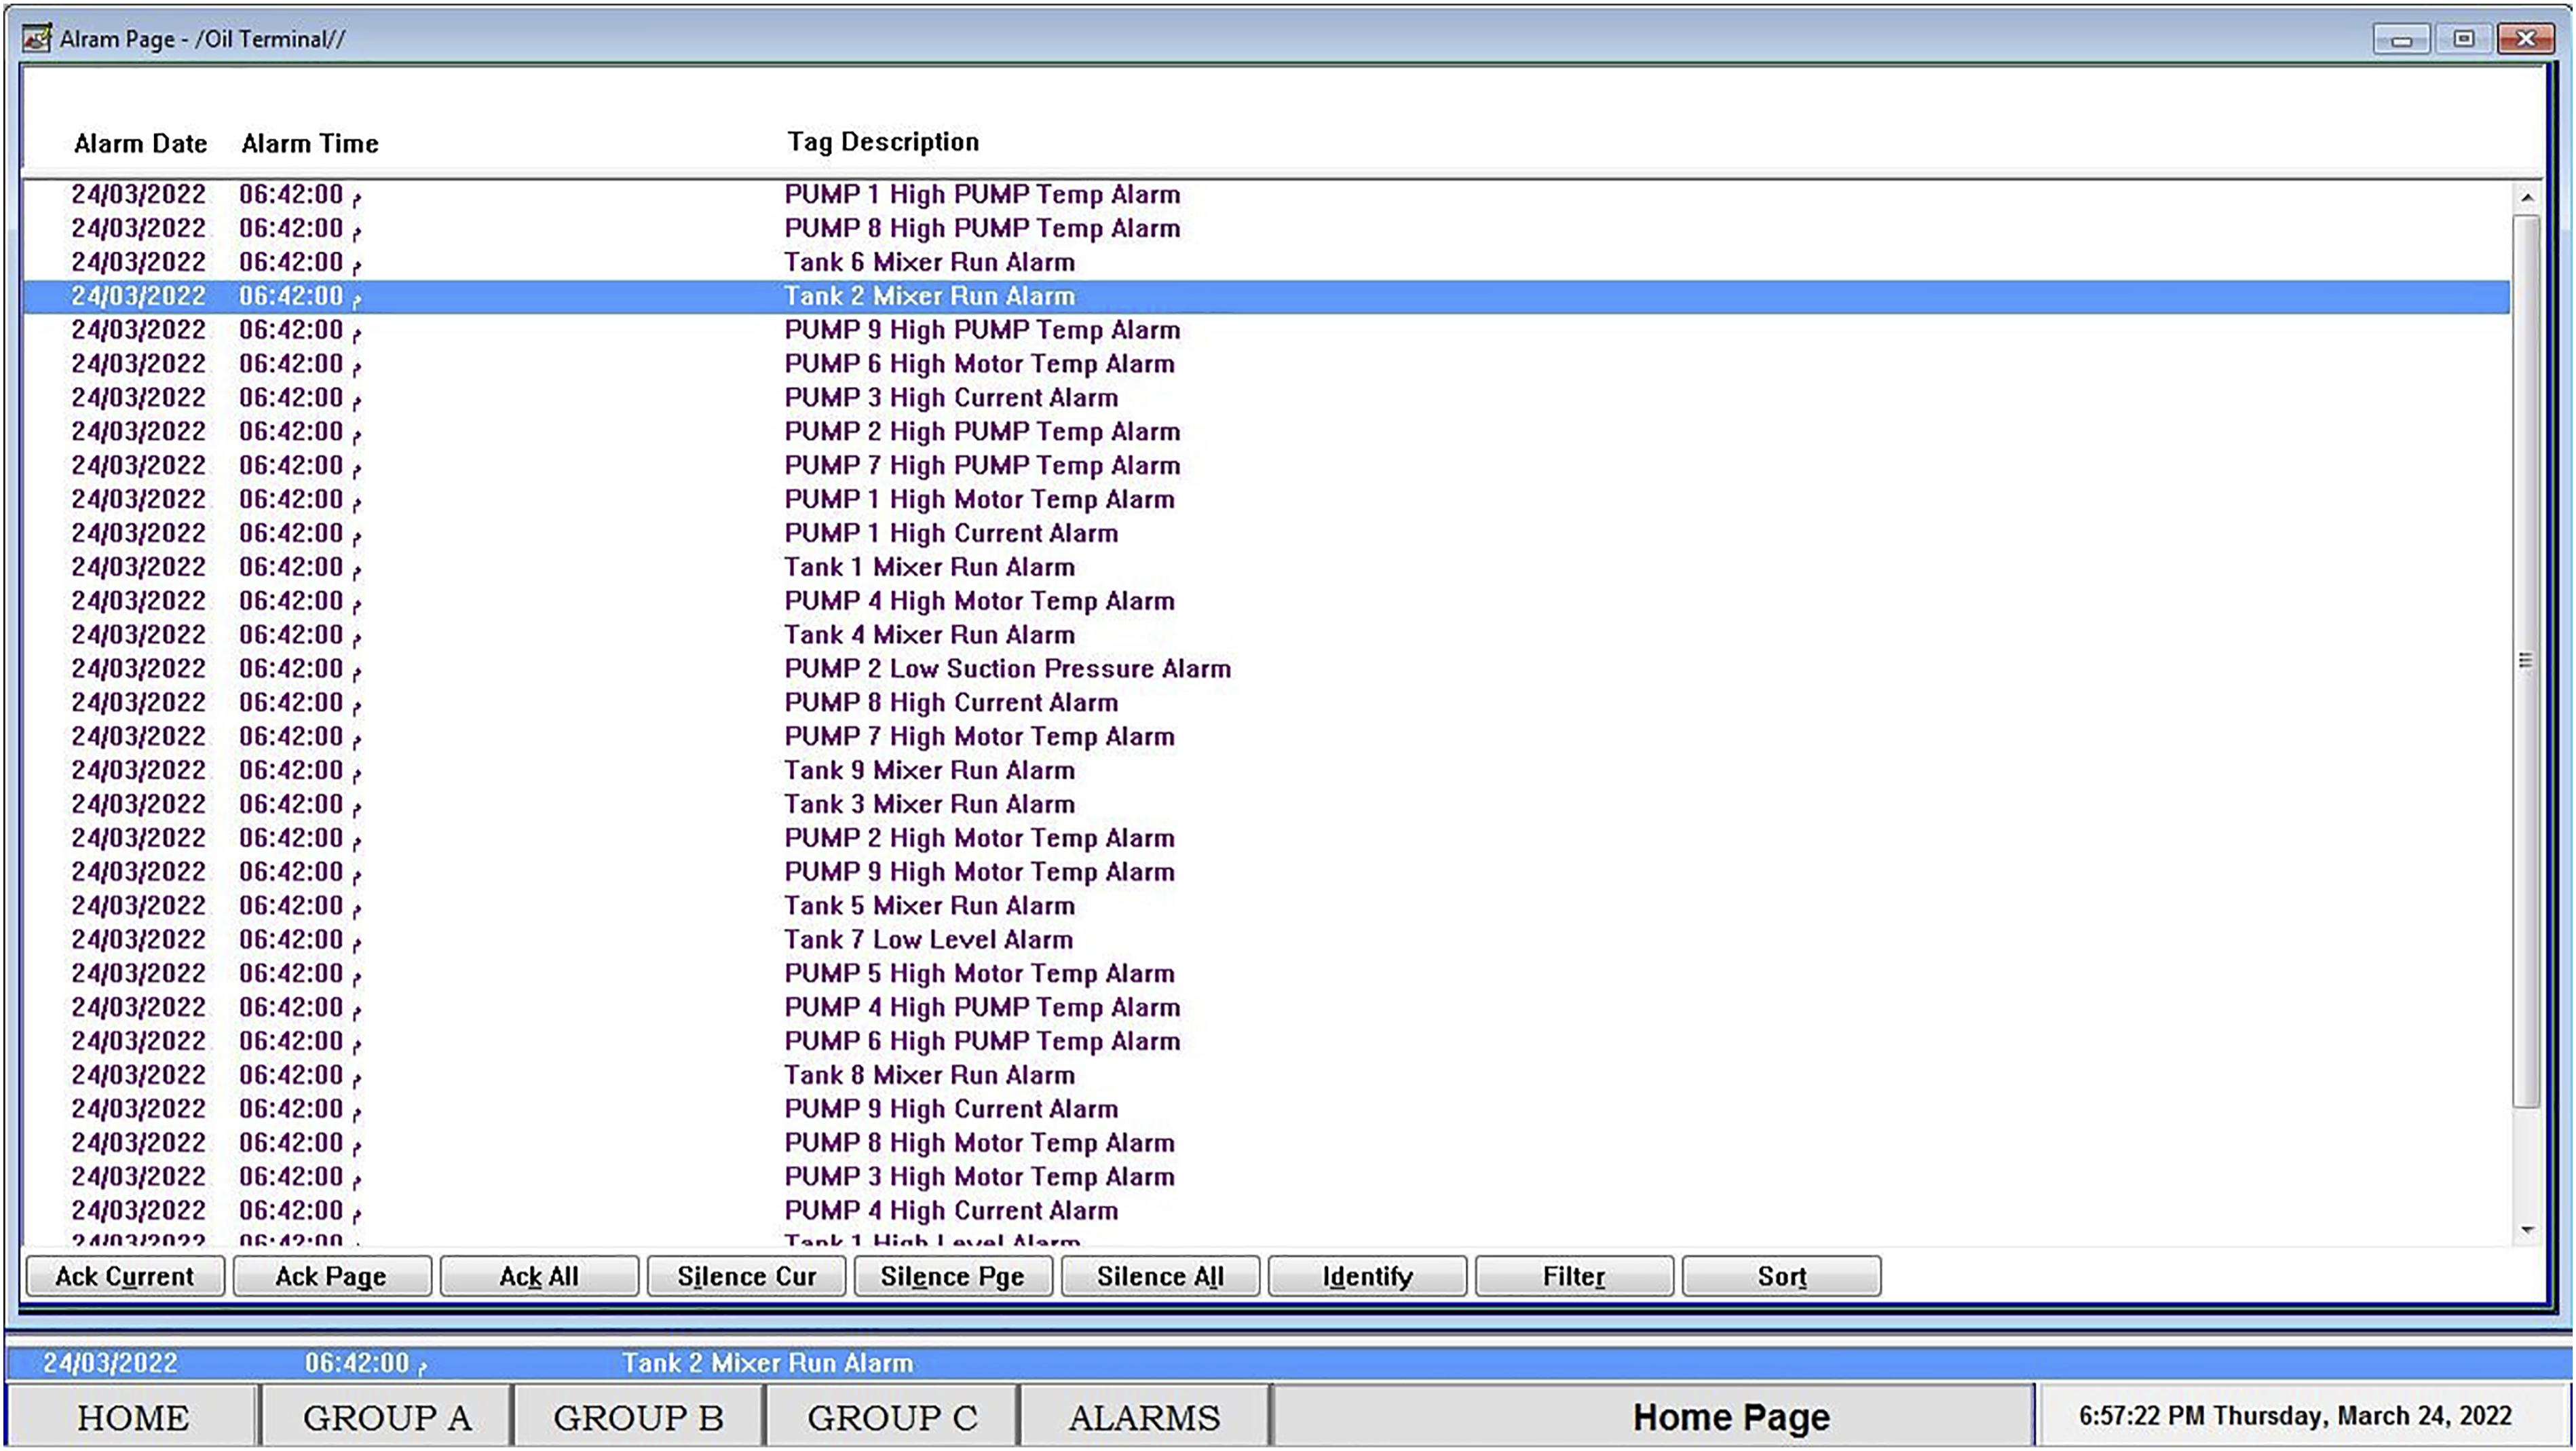
All alarms are configured in their different cases when it is still in warning, out of alarm, or if acknowledged by the operator. For the “in the alarm” case, the text will be written in red color. The background will be colored white. It will blink to change both text and background colors to be black text and red background. This is done to bring the operator’s attention because of the presence of a critical condition. On the other hand, for the “out of the alarm” case, the text will be colored blue, and the background will stay white. There is no need for blinking in this case because the critical condition is gone. In the last case, which is the “acknowledged alarm,” text will be written with purple color; the background will be colored in white. This is visual information that the alarm is still present but with no sound. Figure 10 shows the configuration window for alarms. HMI alarm configuration window.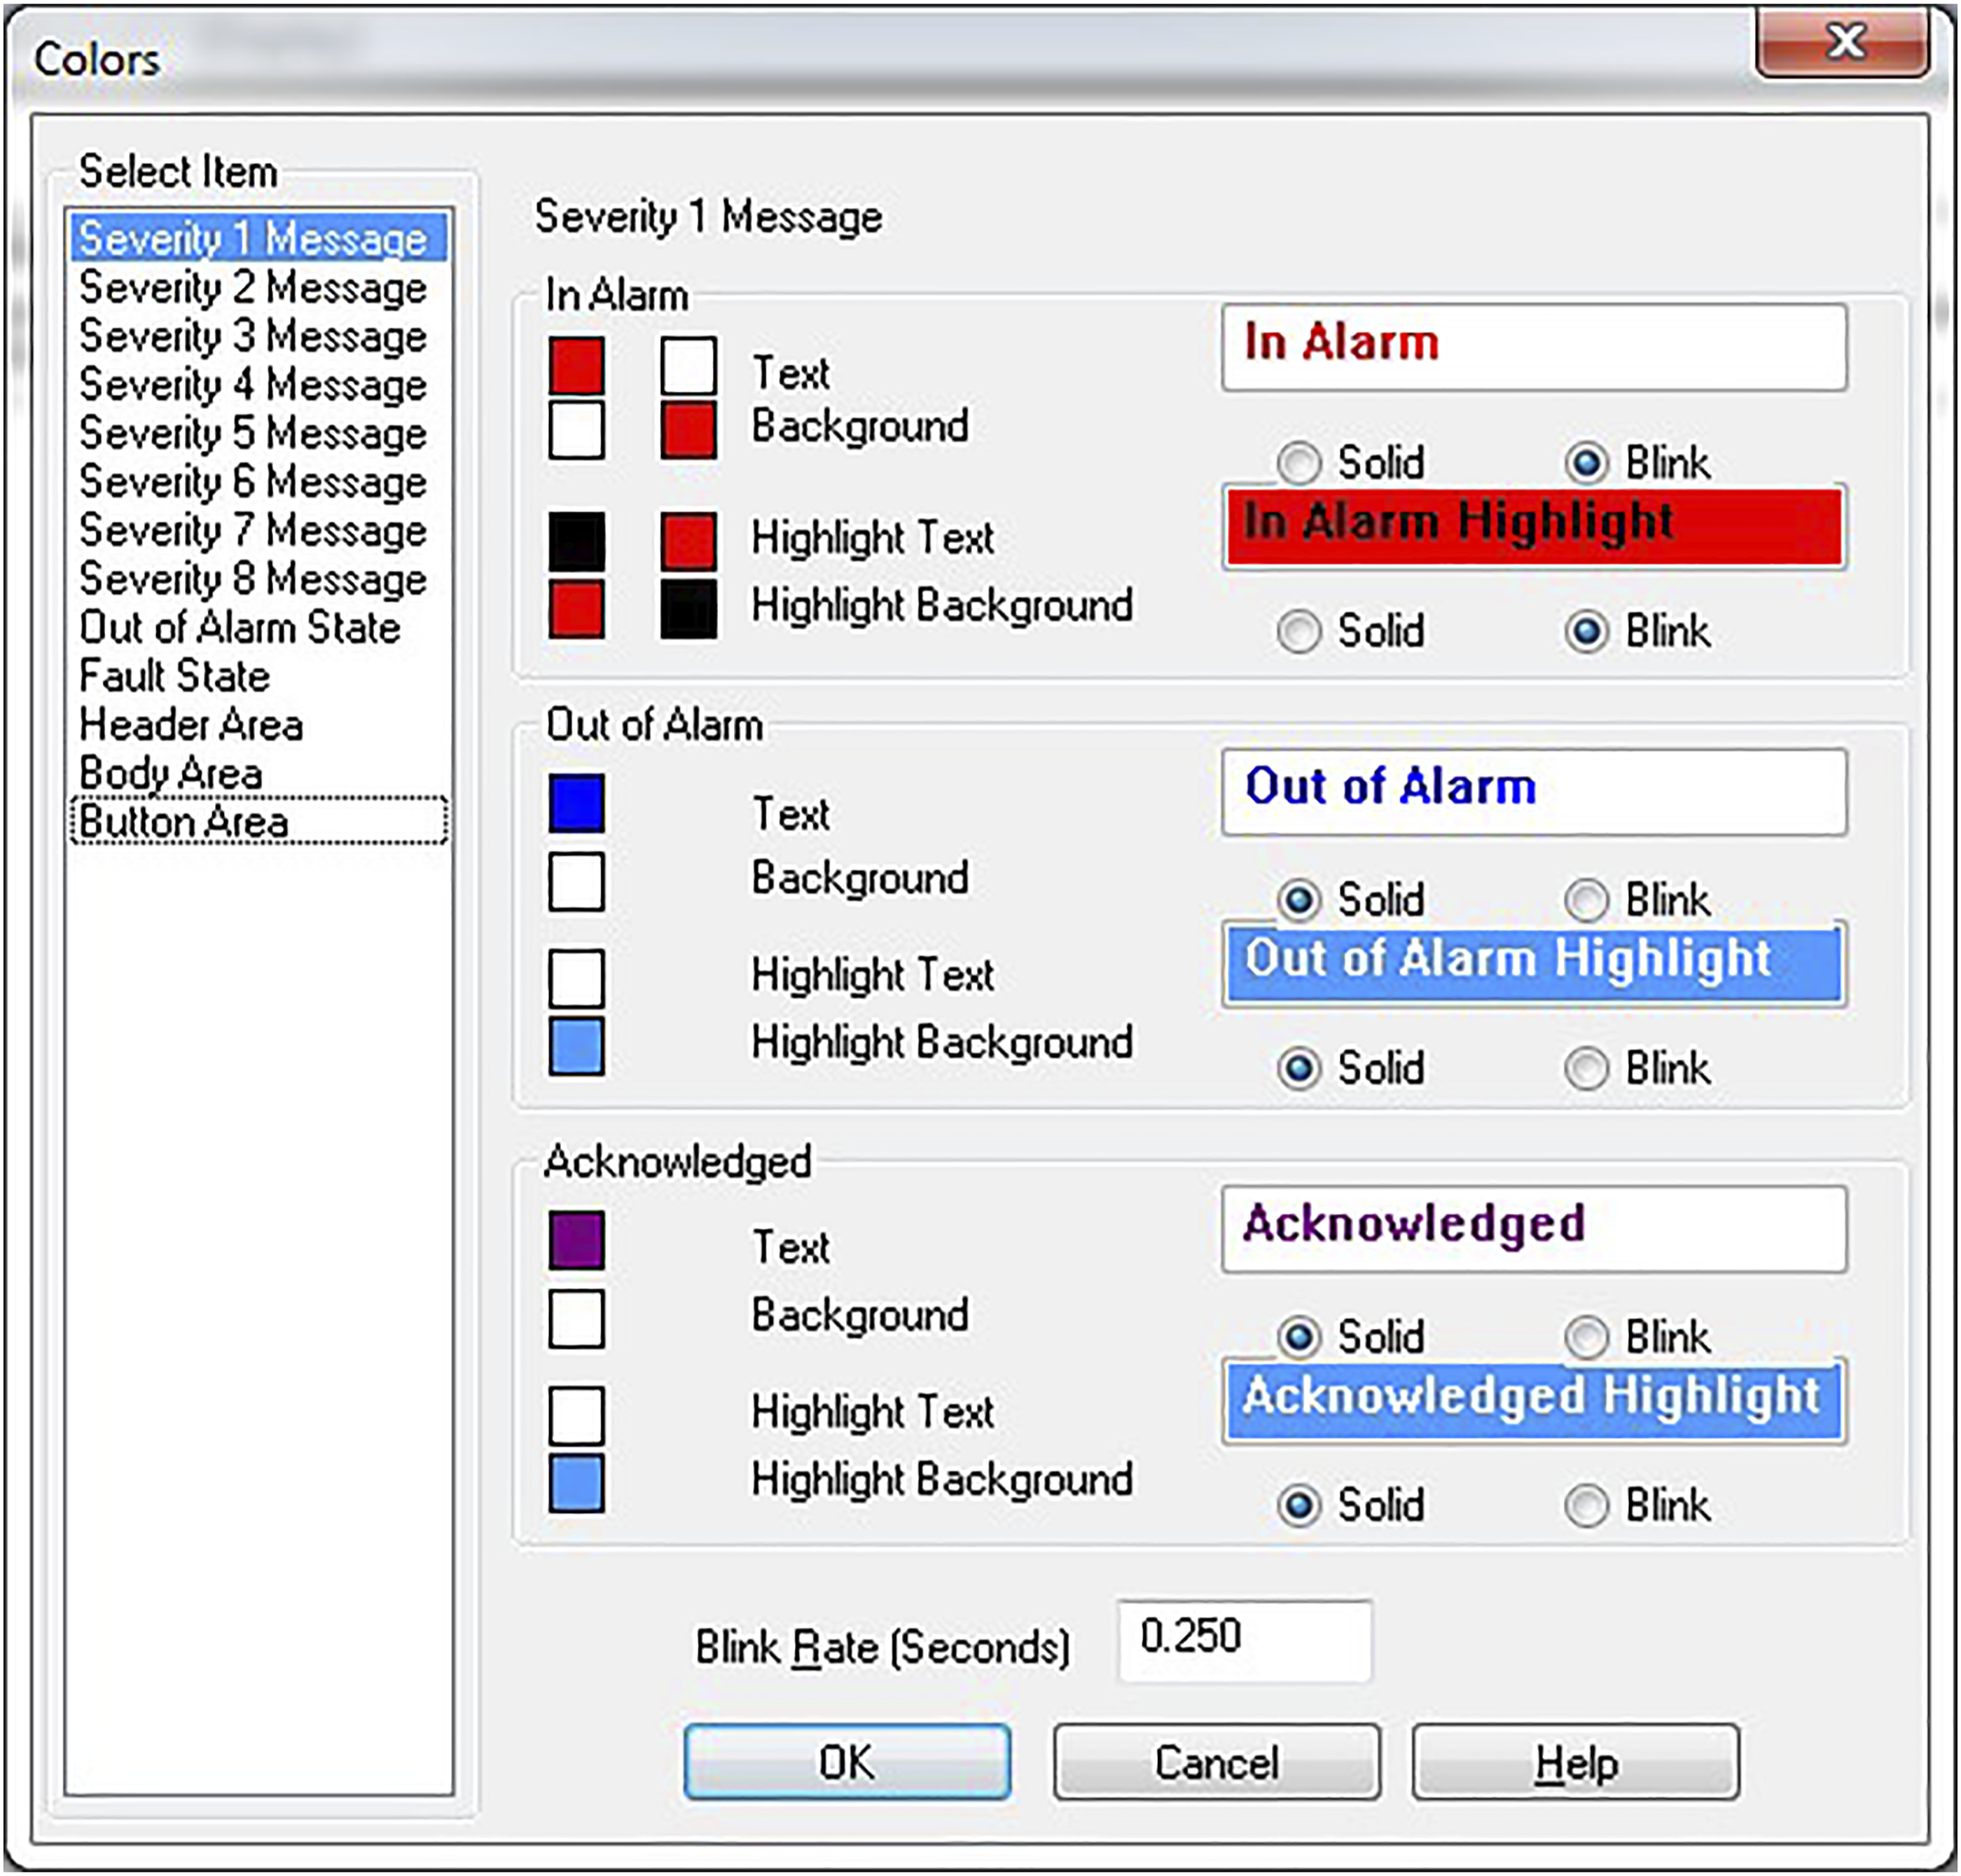
Human machine interface trend pages
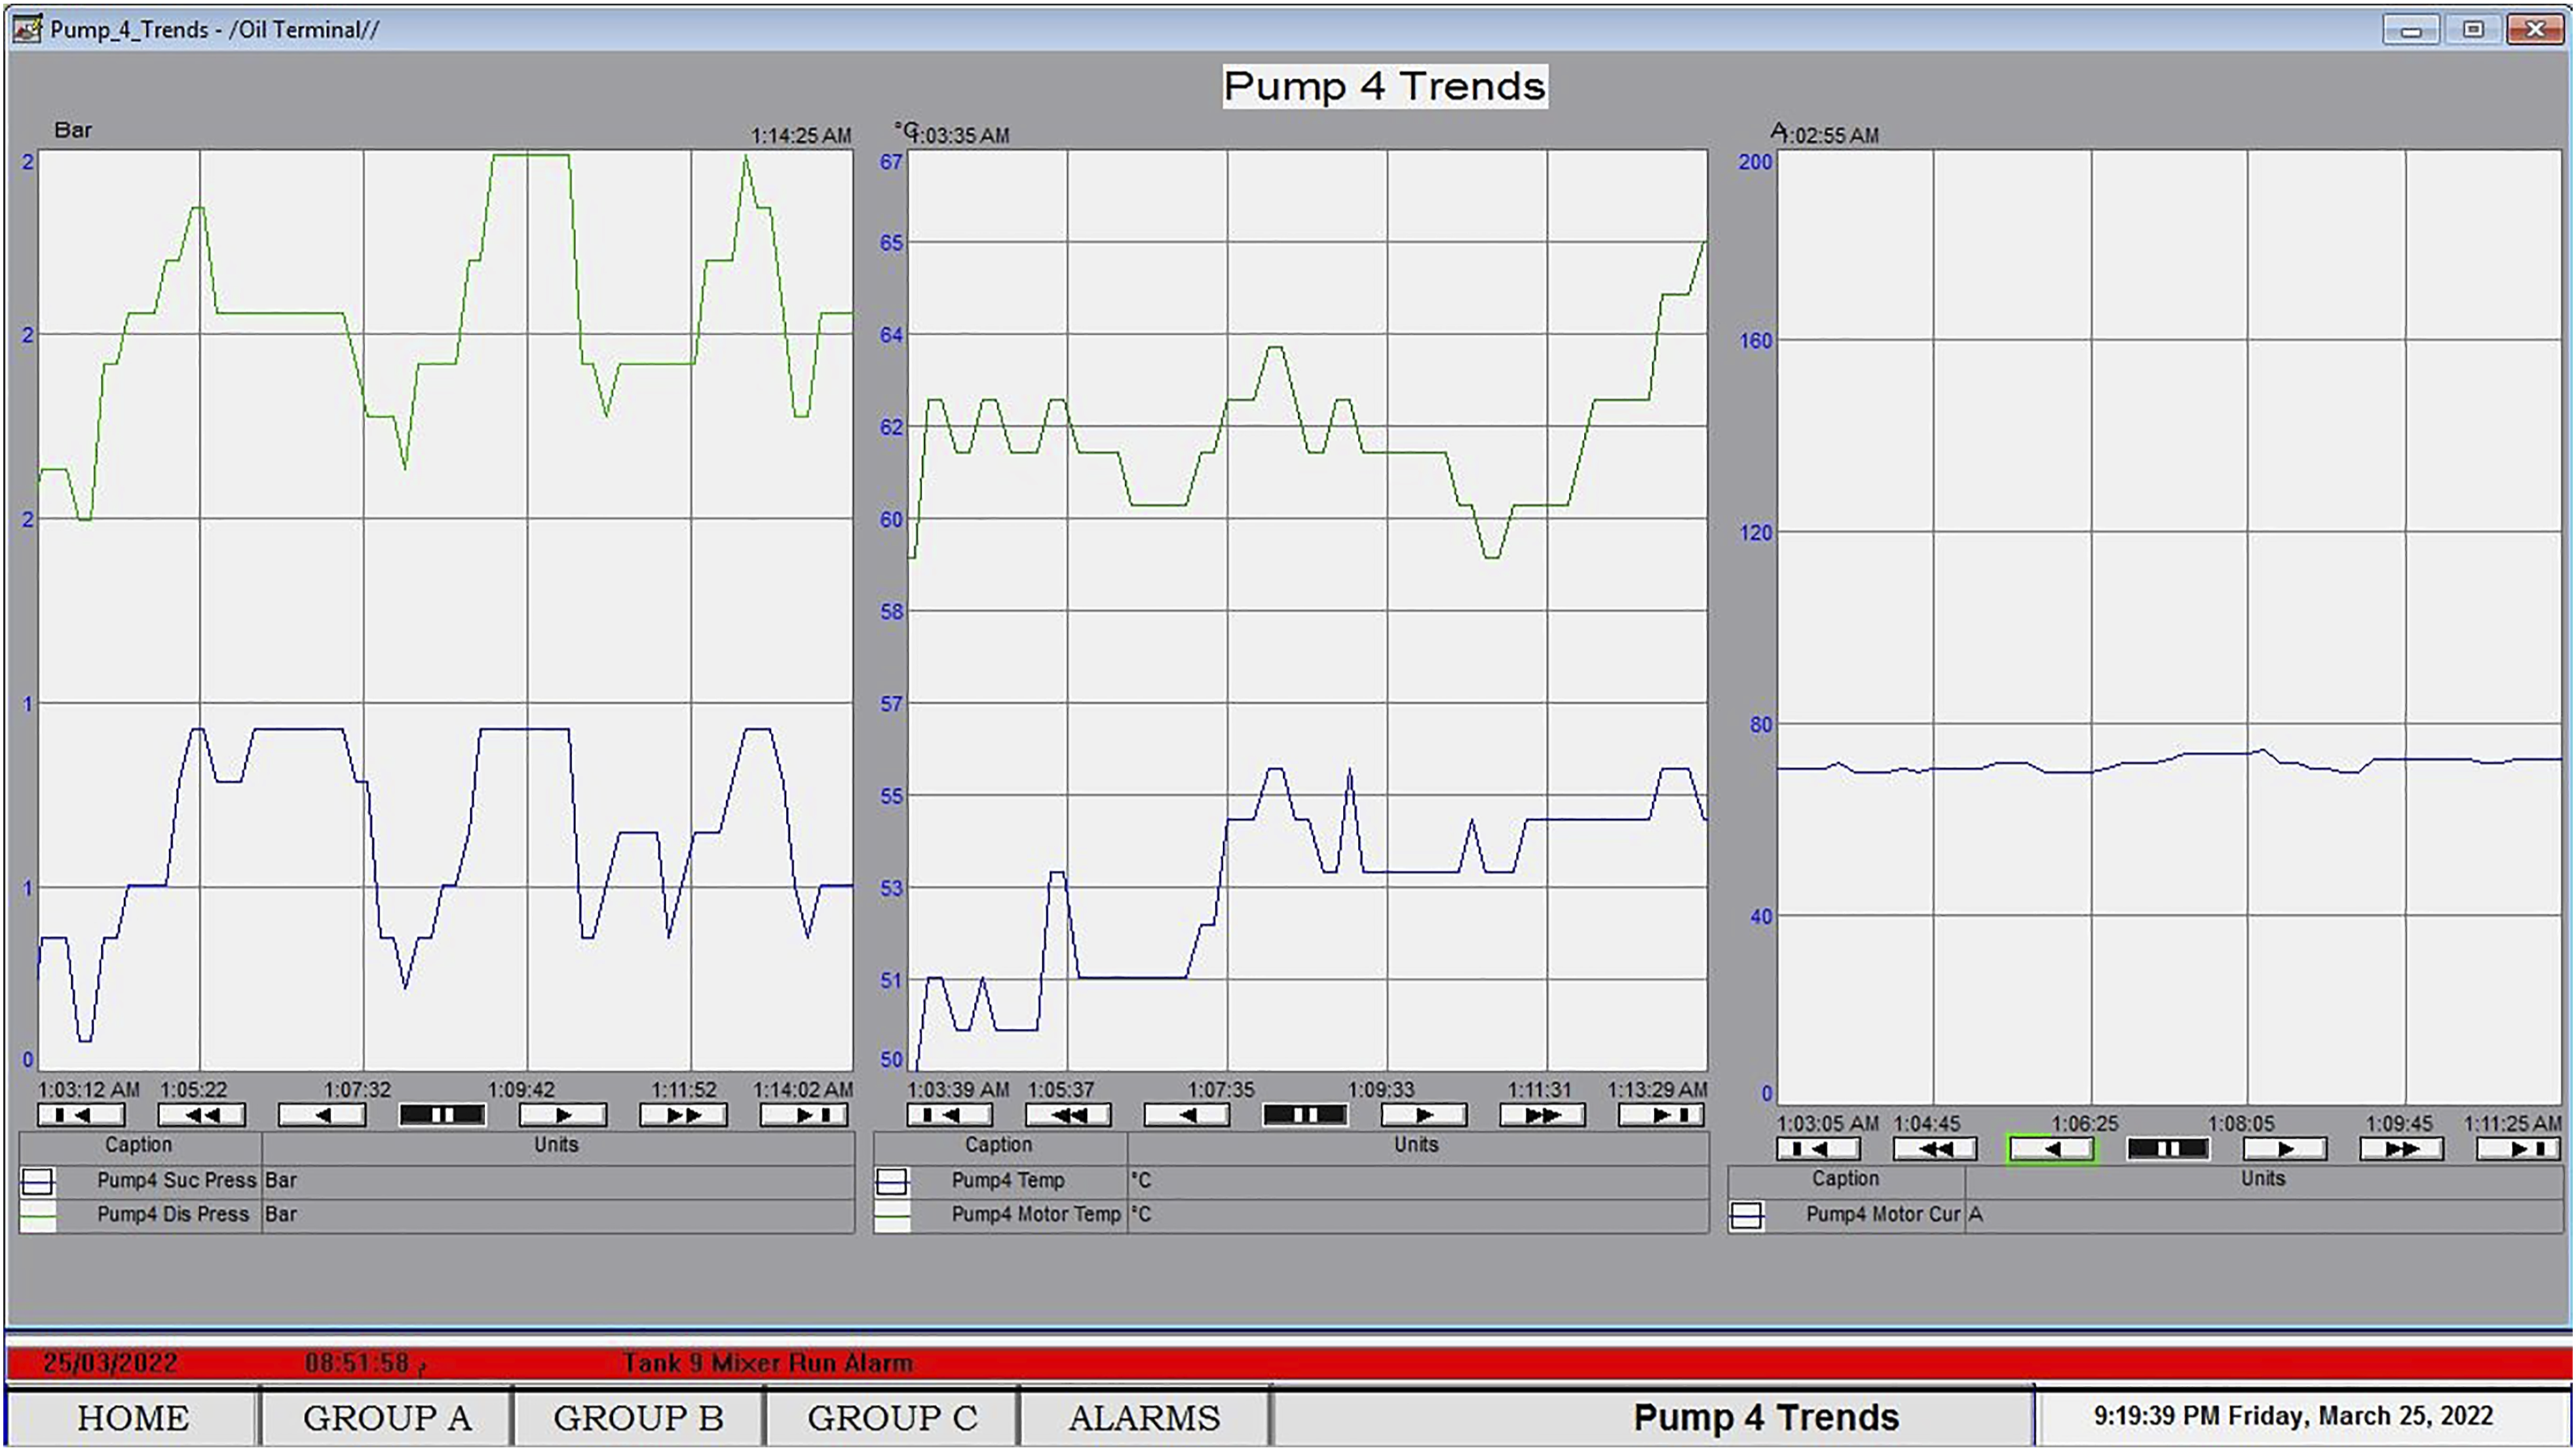
The HMI trend pages are created to show the process reading variation with respect to time. The trend is a visual summary for the process variable readings to facilitate the terminal activities' tracking. On the trending page, the system plots data over time or plots one variable against another to show the relationship. This is very helpful for tracing different process phases or troubleshooting faults and malfunctions. To record a process variable, it is necessary to create a data log file to store readings and then recall them for plotting a graph. Datalog file stores process readings with their happening time. Therefore it is possible to view past trend readings in a past time. 47 Trend pages are created to show tank levels and temperatures. There is a separate trends page for each group of tanks. Each trend page gathers all groups of tanks’ levels in one graph and their temperatures in the other one. Unlike pumps, each pump has its own trend page to plot the graphs related to it. The pump trends page is divided into three sections. One for suction and discharge pressures, the middle trend is for motor and pump temperatures, and the last one is for motor ampere readings.
Group B tank trends are shown in Figure 11. The page is divided into two sections with a trend that collects tank levels in one graph. The other one is for the trend which plots their related temperatures altogether. Each variable reading is presented with different color for each tank. For example, in tank 4, the level and temperature are colored with blue to differentiate them from other tank variables. Figure 12 shows the trends page for pump 4. The page is divided into three portions, one for a trend that collects suction and discharges pressures. The other one gathers both temperatures for the pump and motor. The third one shows the current ampere reading for the motor. Each variable reading is presented with a different color. HMI tank trend page for Group B. HMI pump trends page for pump 4.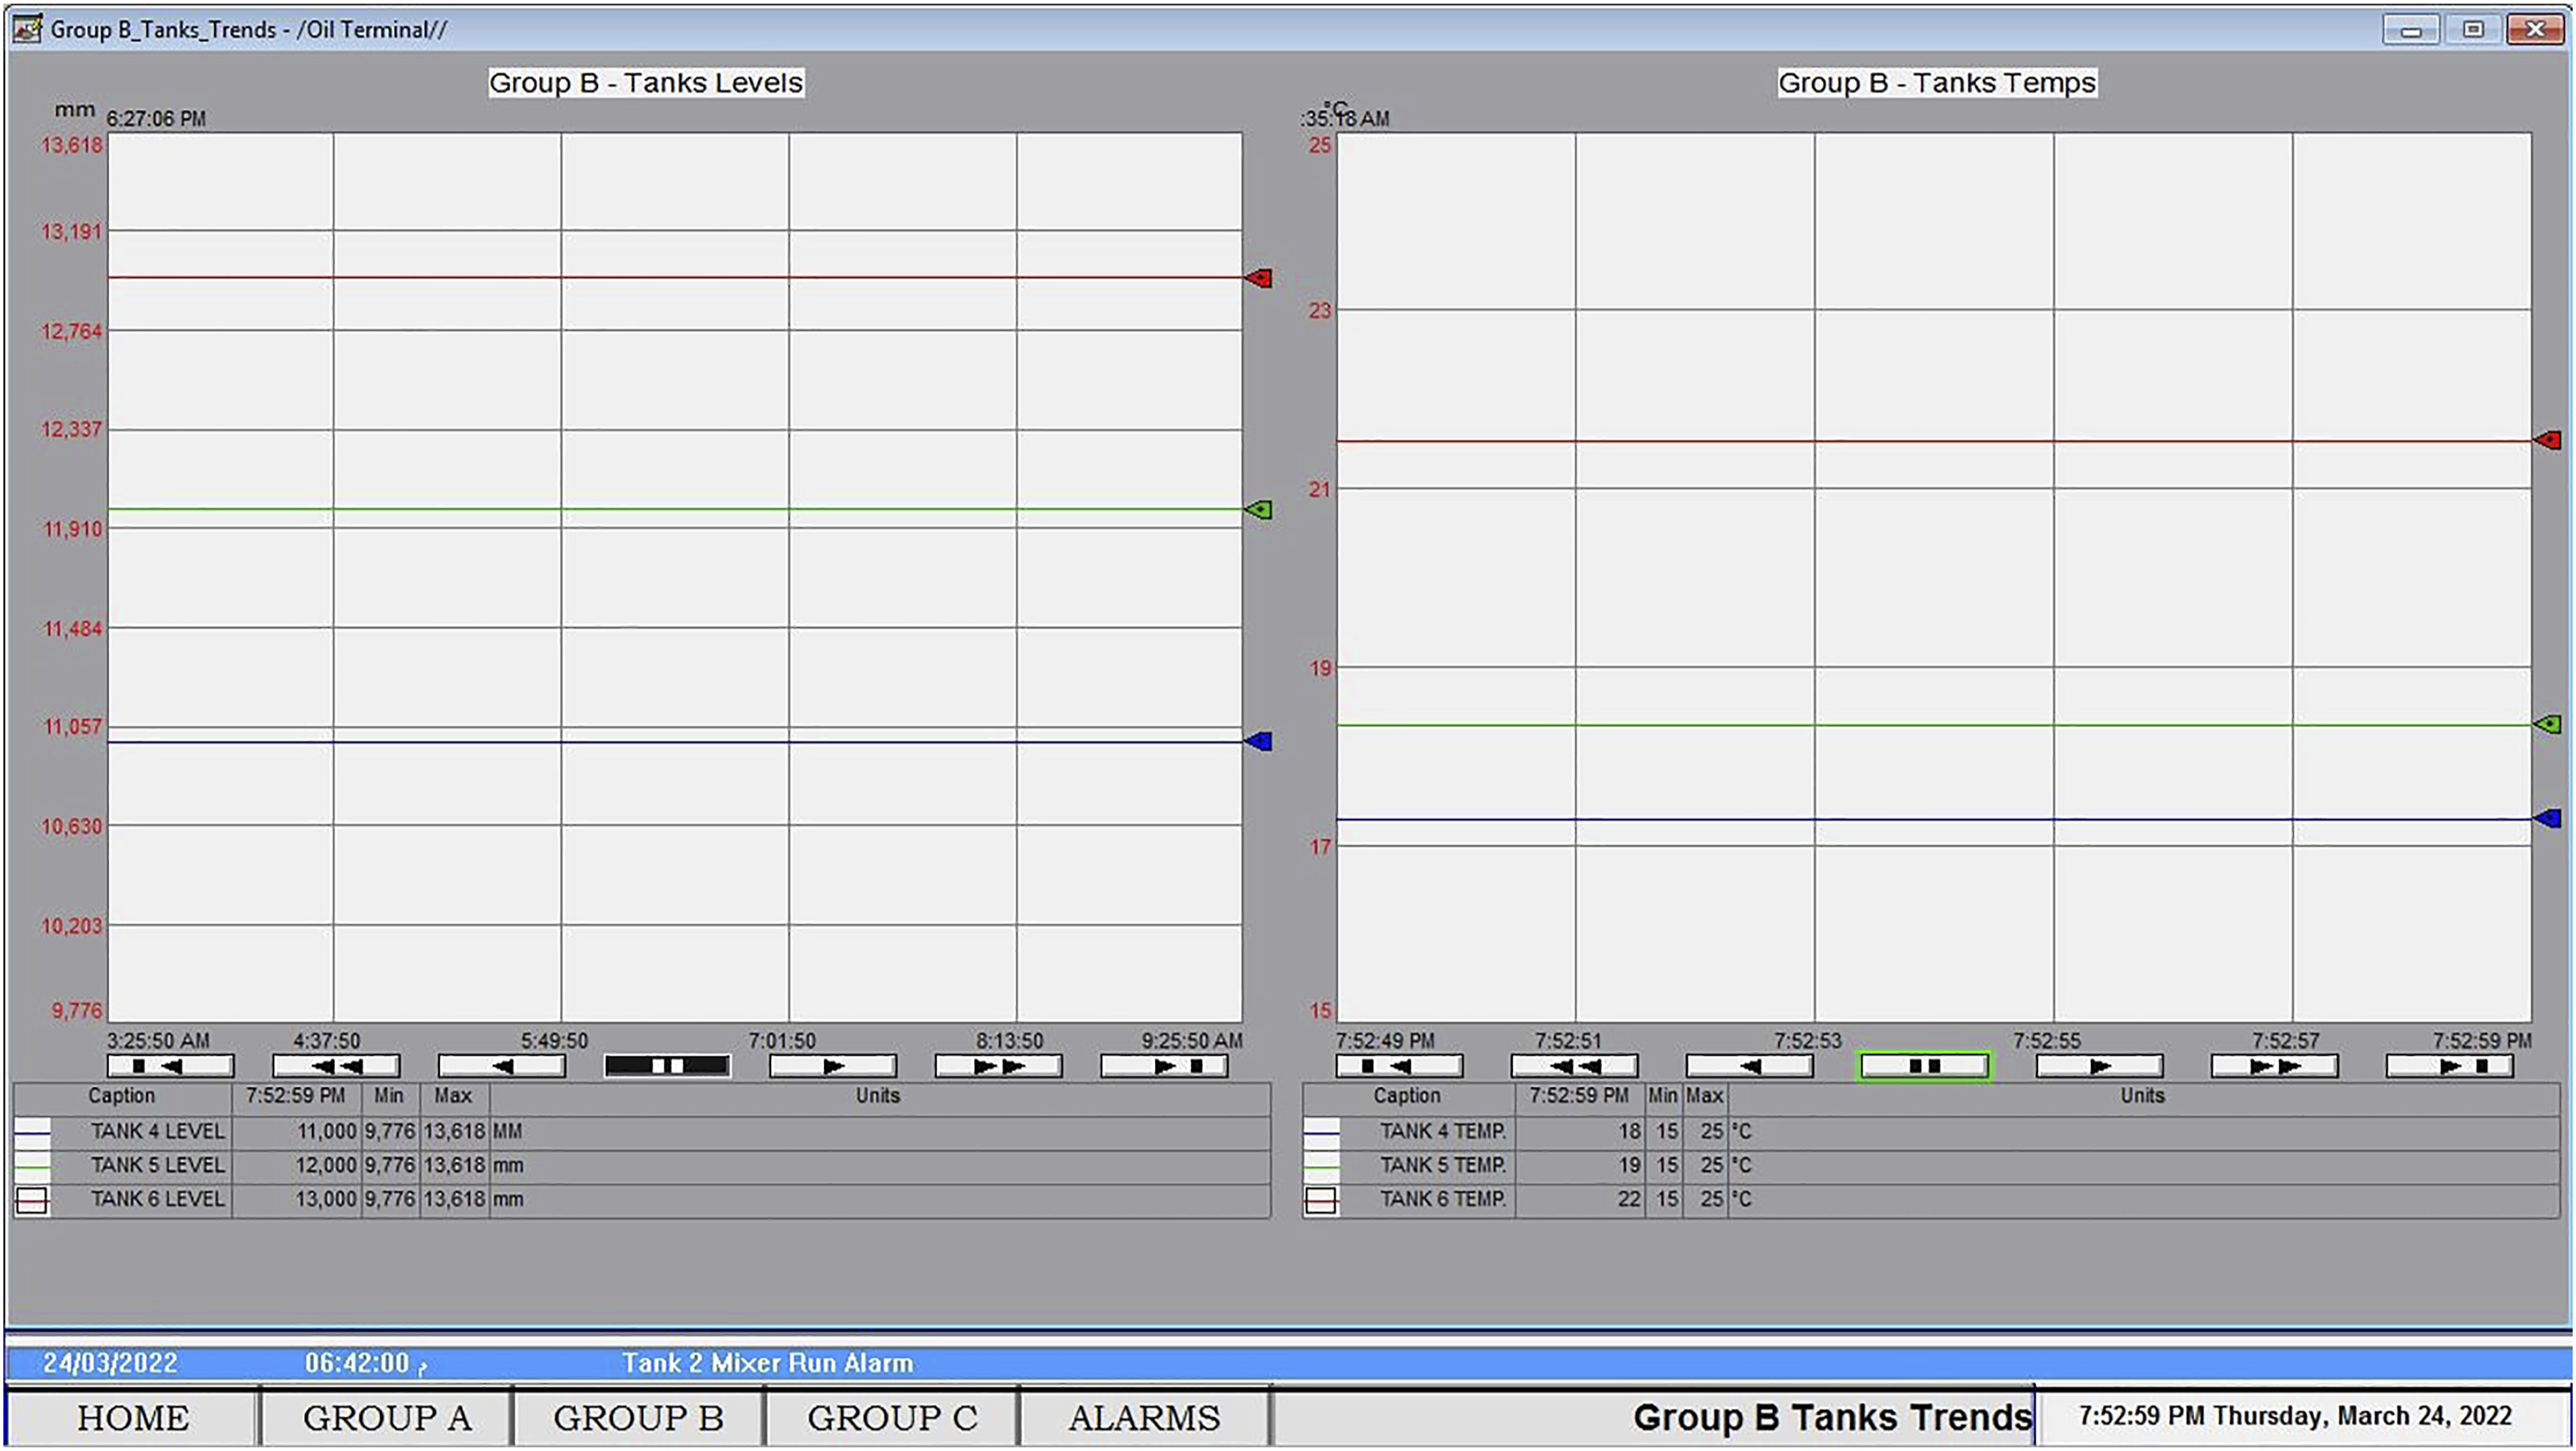
Setup of Experiments
The control system is constructed with Rockwell Automation (RA) software. The main programming language used in applications is ladder diagrams (LD). 45,48,49 The display is built using an HMI software developer. The HMI software program is a Windows-based application that creates display, trend, and alarm pages. The package contains data servers and HMI server functions. Data servers and HMI servers are connected via OPC servers. They may be on the same machine or on different machines. 12 The OPC servers are data servers that provide standards and technologies to allow other vendors’ software and hardware to communicate. It helps in the integration of various control systems and brands into central monitoring and control units. 12,50,51
Programmable logic controller/HMI software tools
Based on IEC61131 standards,
12
Rockwell Automation (RA) simulation tools are used rather than actual PLC programming. However, RA offers PLC family tools such as ControlLogix and CompactLogix that can be used in real applications, rather than simulator software used in the paper. In programming, the add-on instructions are used to speed up the execution time of main programs. Figure 13 illustrates the experiment configuration setup and linkage between the used softwares. Experimental setup block diagram.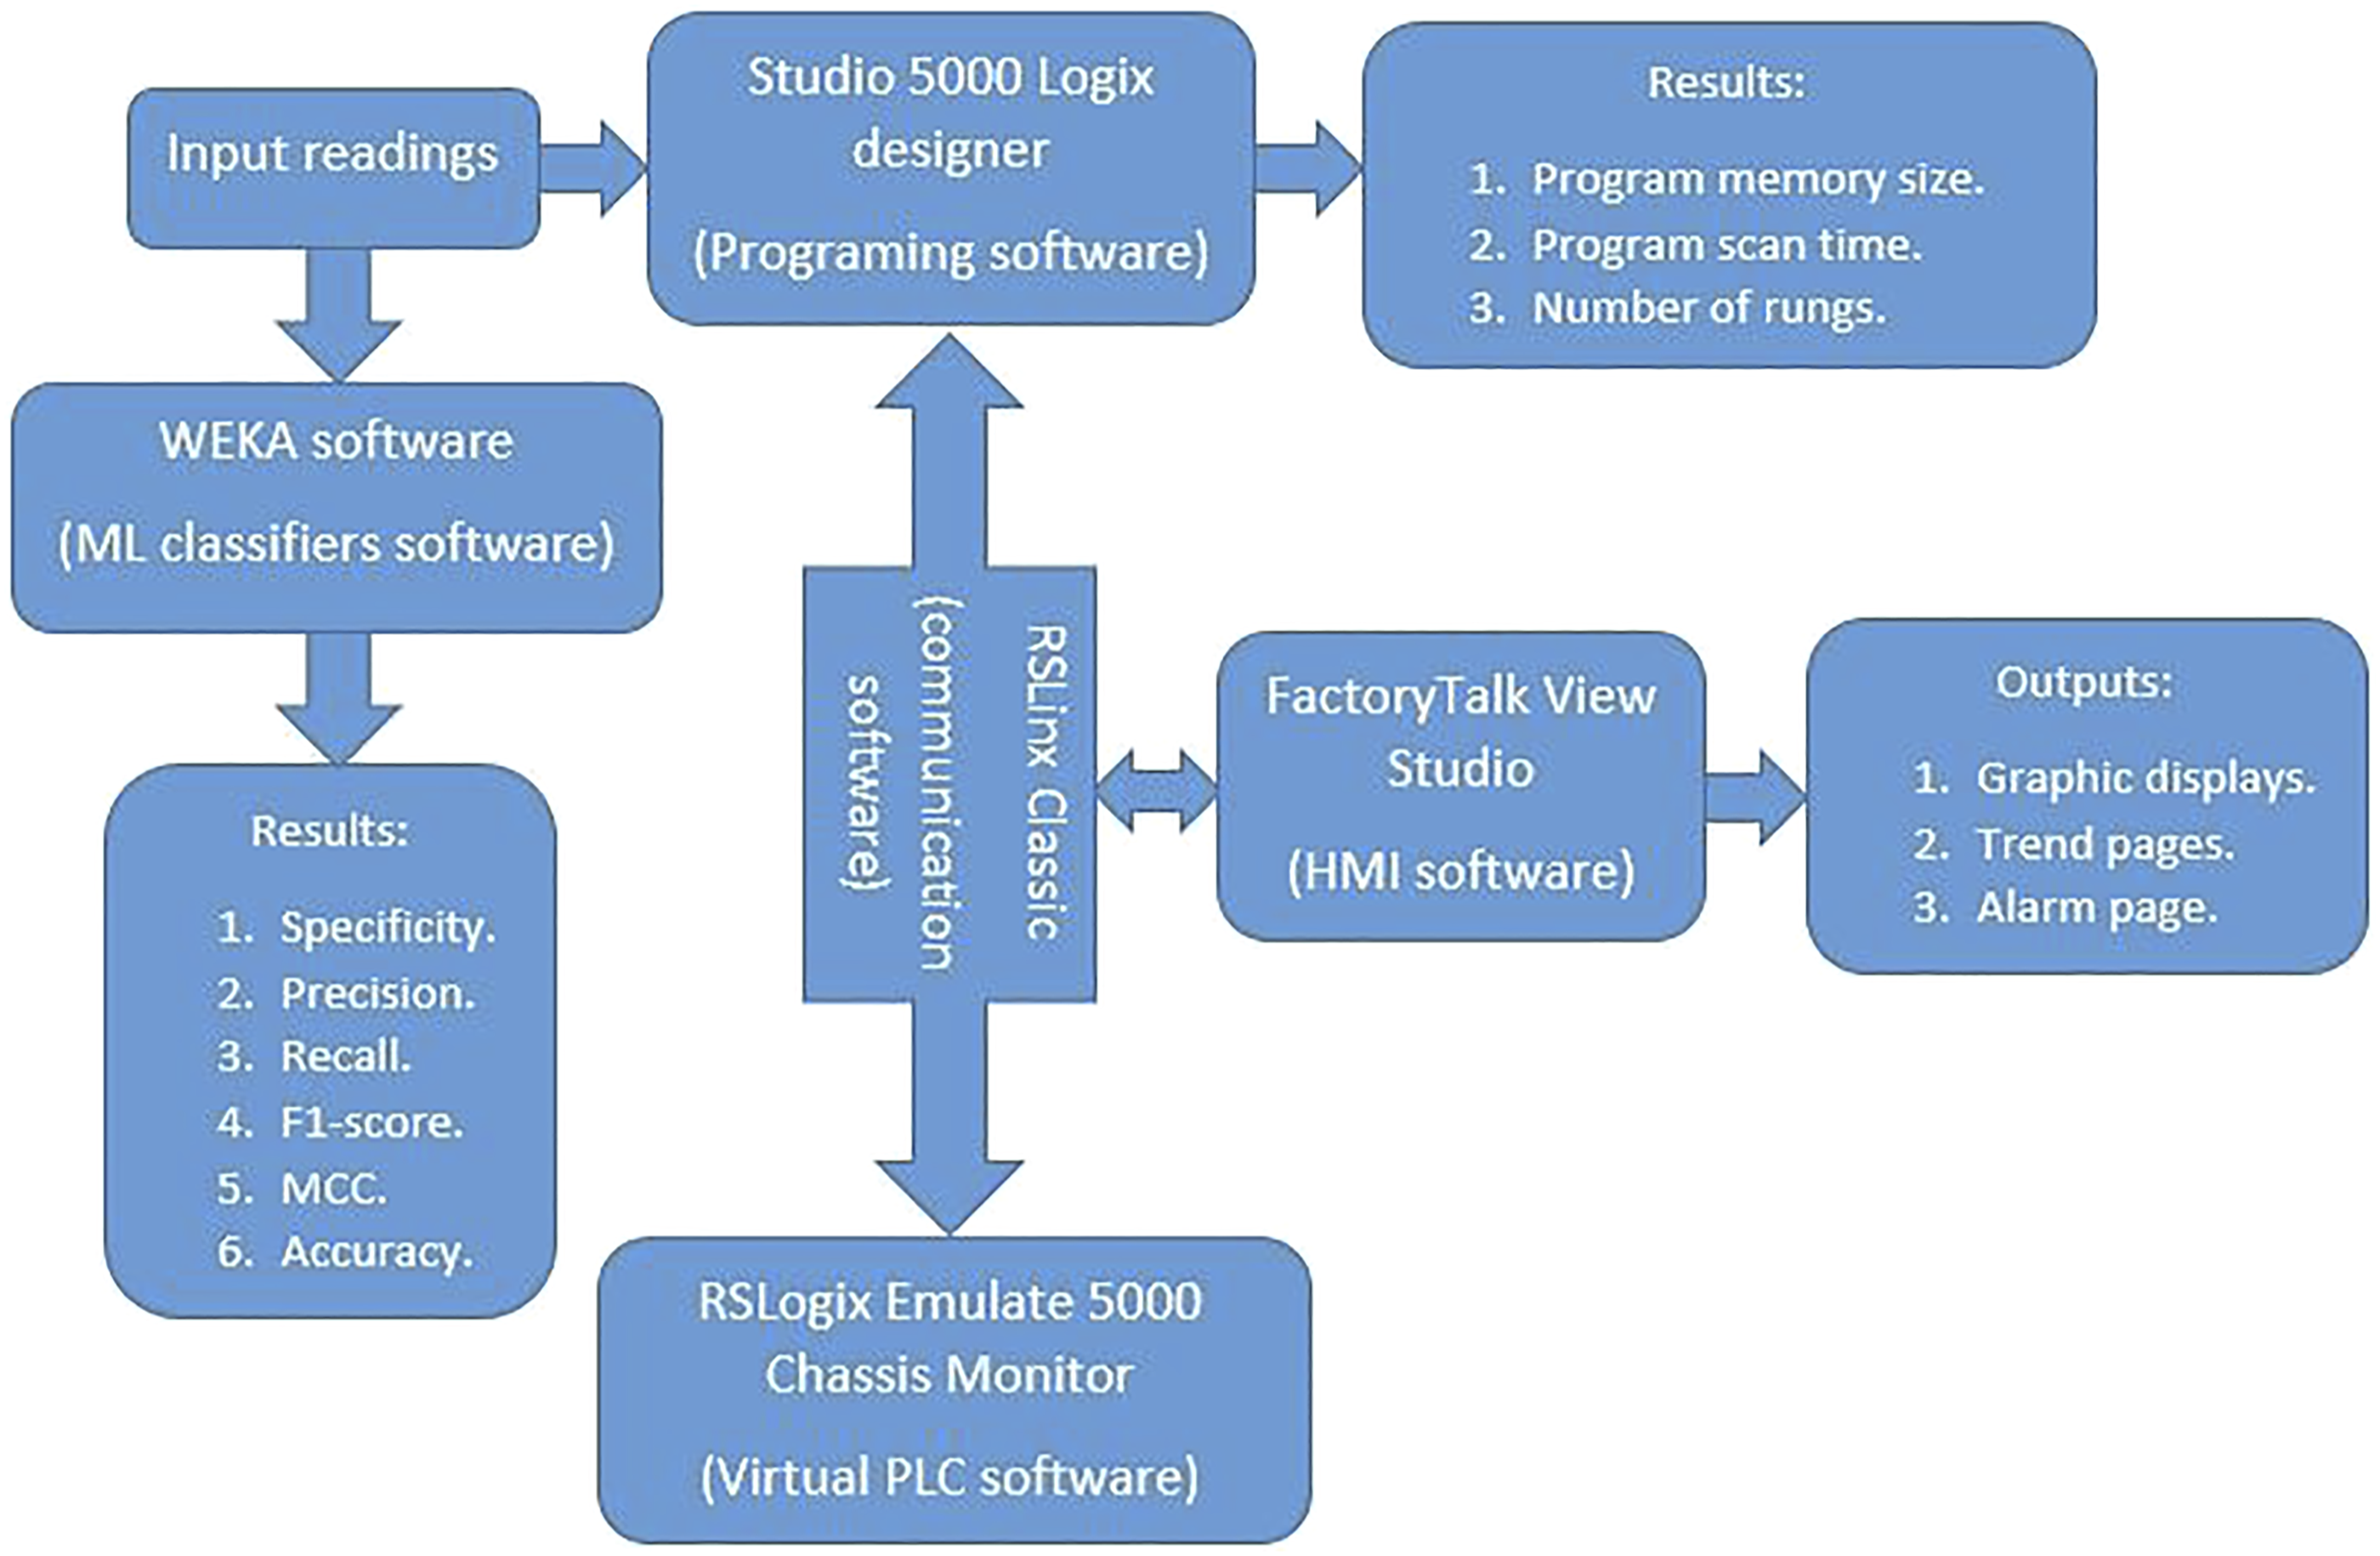
The engineering tools used to design the proposed model are the following.: • RSLinx Classic is a communication Software. The one used in this paper is version 3.71 CPR9 SR7.1. • Studio 5000 Logix designer, version 24.00 is used for Logic design. • FactoryTalk View Studio version 8.10 CPR9 SR7.4 ia a PLC Emulator that contains graphics display builders, data servers, HMI servers, and client applications. • RSLogix Emulates 5000 Chassis Monitor, version 24.00 is used to generate virtual chaises, controllers, and I/O units. Also, it stimulates their behavior and the time of scanning the controller.
The ML classifiers were constructed using the data mining tool: WEKA software, version 3.8.4 5
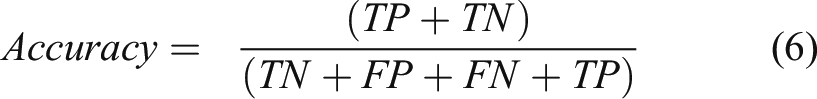
Machine learning evaluation metrics
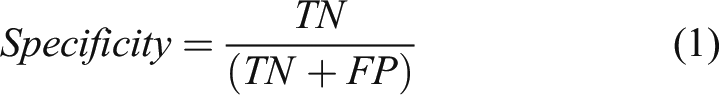
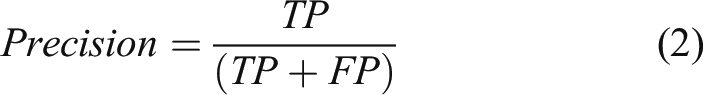
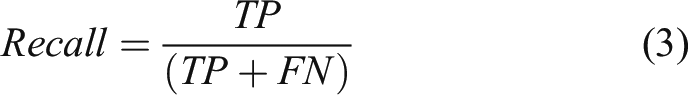
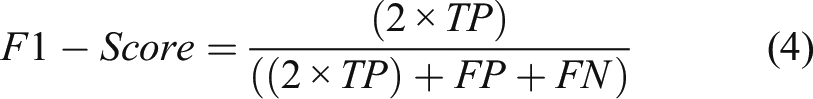
•
•
•
•
•
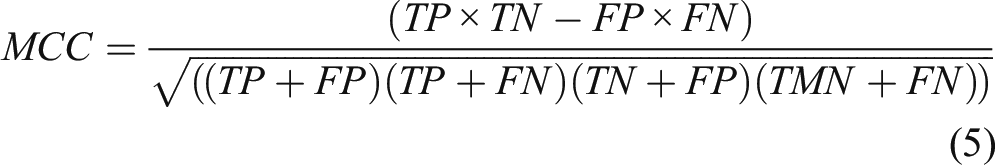
Matthews Correlation Coefficients
Matthews Correlation Coefficient (MCC) gives precise results more than other performance parameters, mainly on datasets with two classes. It provides the most accurate result, even on unbalanced distributed datasets. When the result value is close to 1, this indicates that a precise classification is performed.
56,57
Equation (5) shows how to get MCC using true positive (TP), TN, false negative (FN), and false-positive (FP).
Results and discussions
The paper introduces a PLC/HMI framework integrated with ML classifiers for enhancing the processor performance and adding an automatic detection feature for tank level to achieve maximum usage of processor capabilities and maintain good operational conditions to protect the expensive essential equipment. The proposed approach consisted of two experiments. In experiment I, a ladder program is created in two ways. The first way is the standard and conventional LD method. The second method is the AOI method. AOI method is used to reduce the ladder program’s complexity, program size, and execution time. In experiment II, the actual process readings are pump suction pressure, pump discharge pressure, and flowrates. These readings are applied to ML classifiers to detect tank levels, whether high or low, to protect the operational pumps from cavitation or bad operating conditions, leading to equipment damage.
Experiment I results
Comparison of result parameters between two cases.
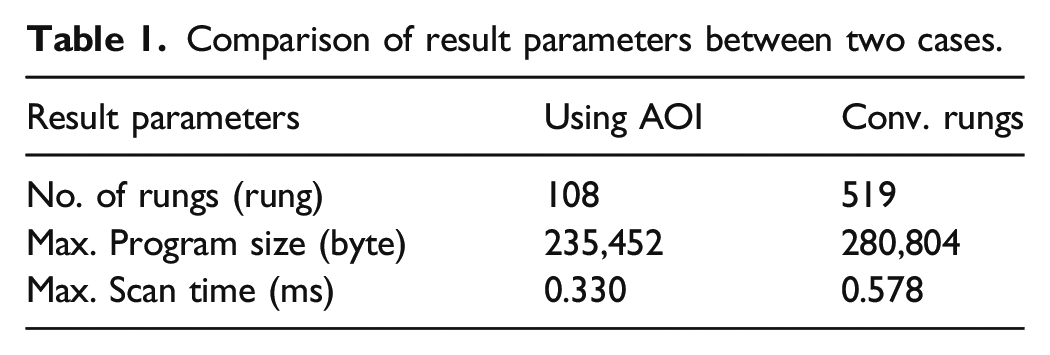
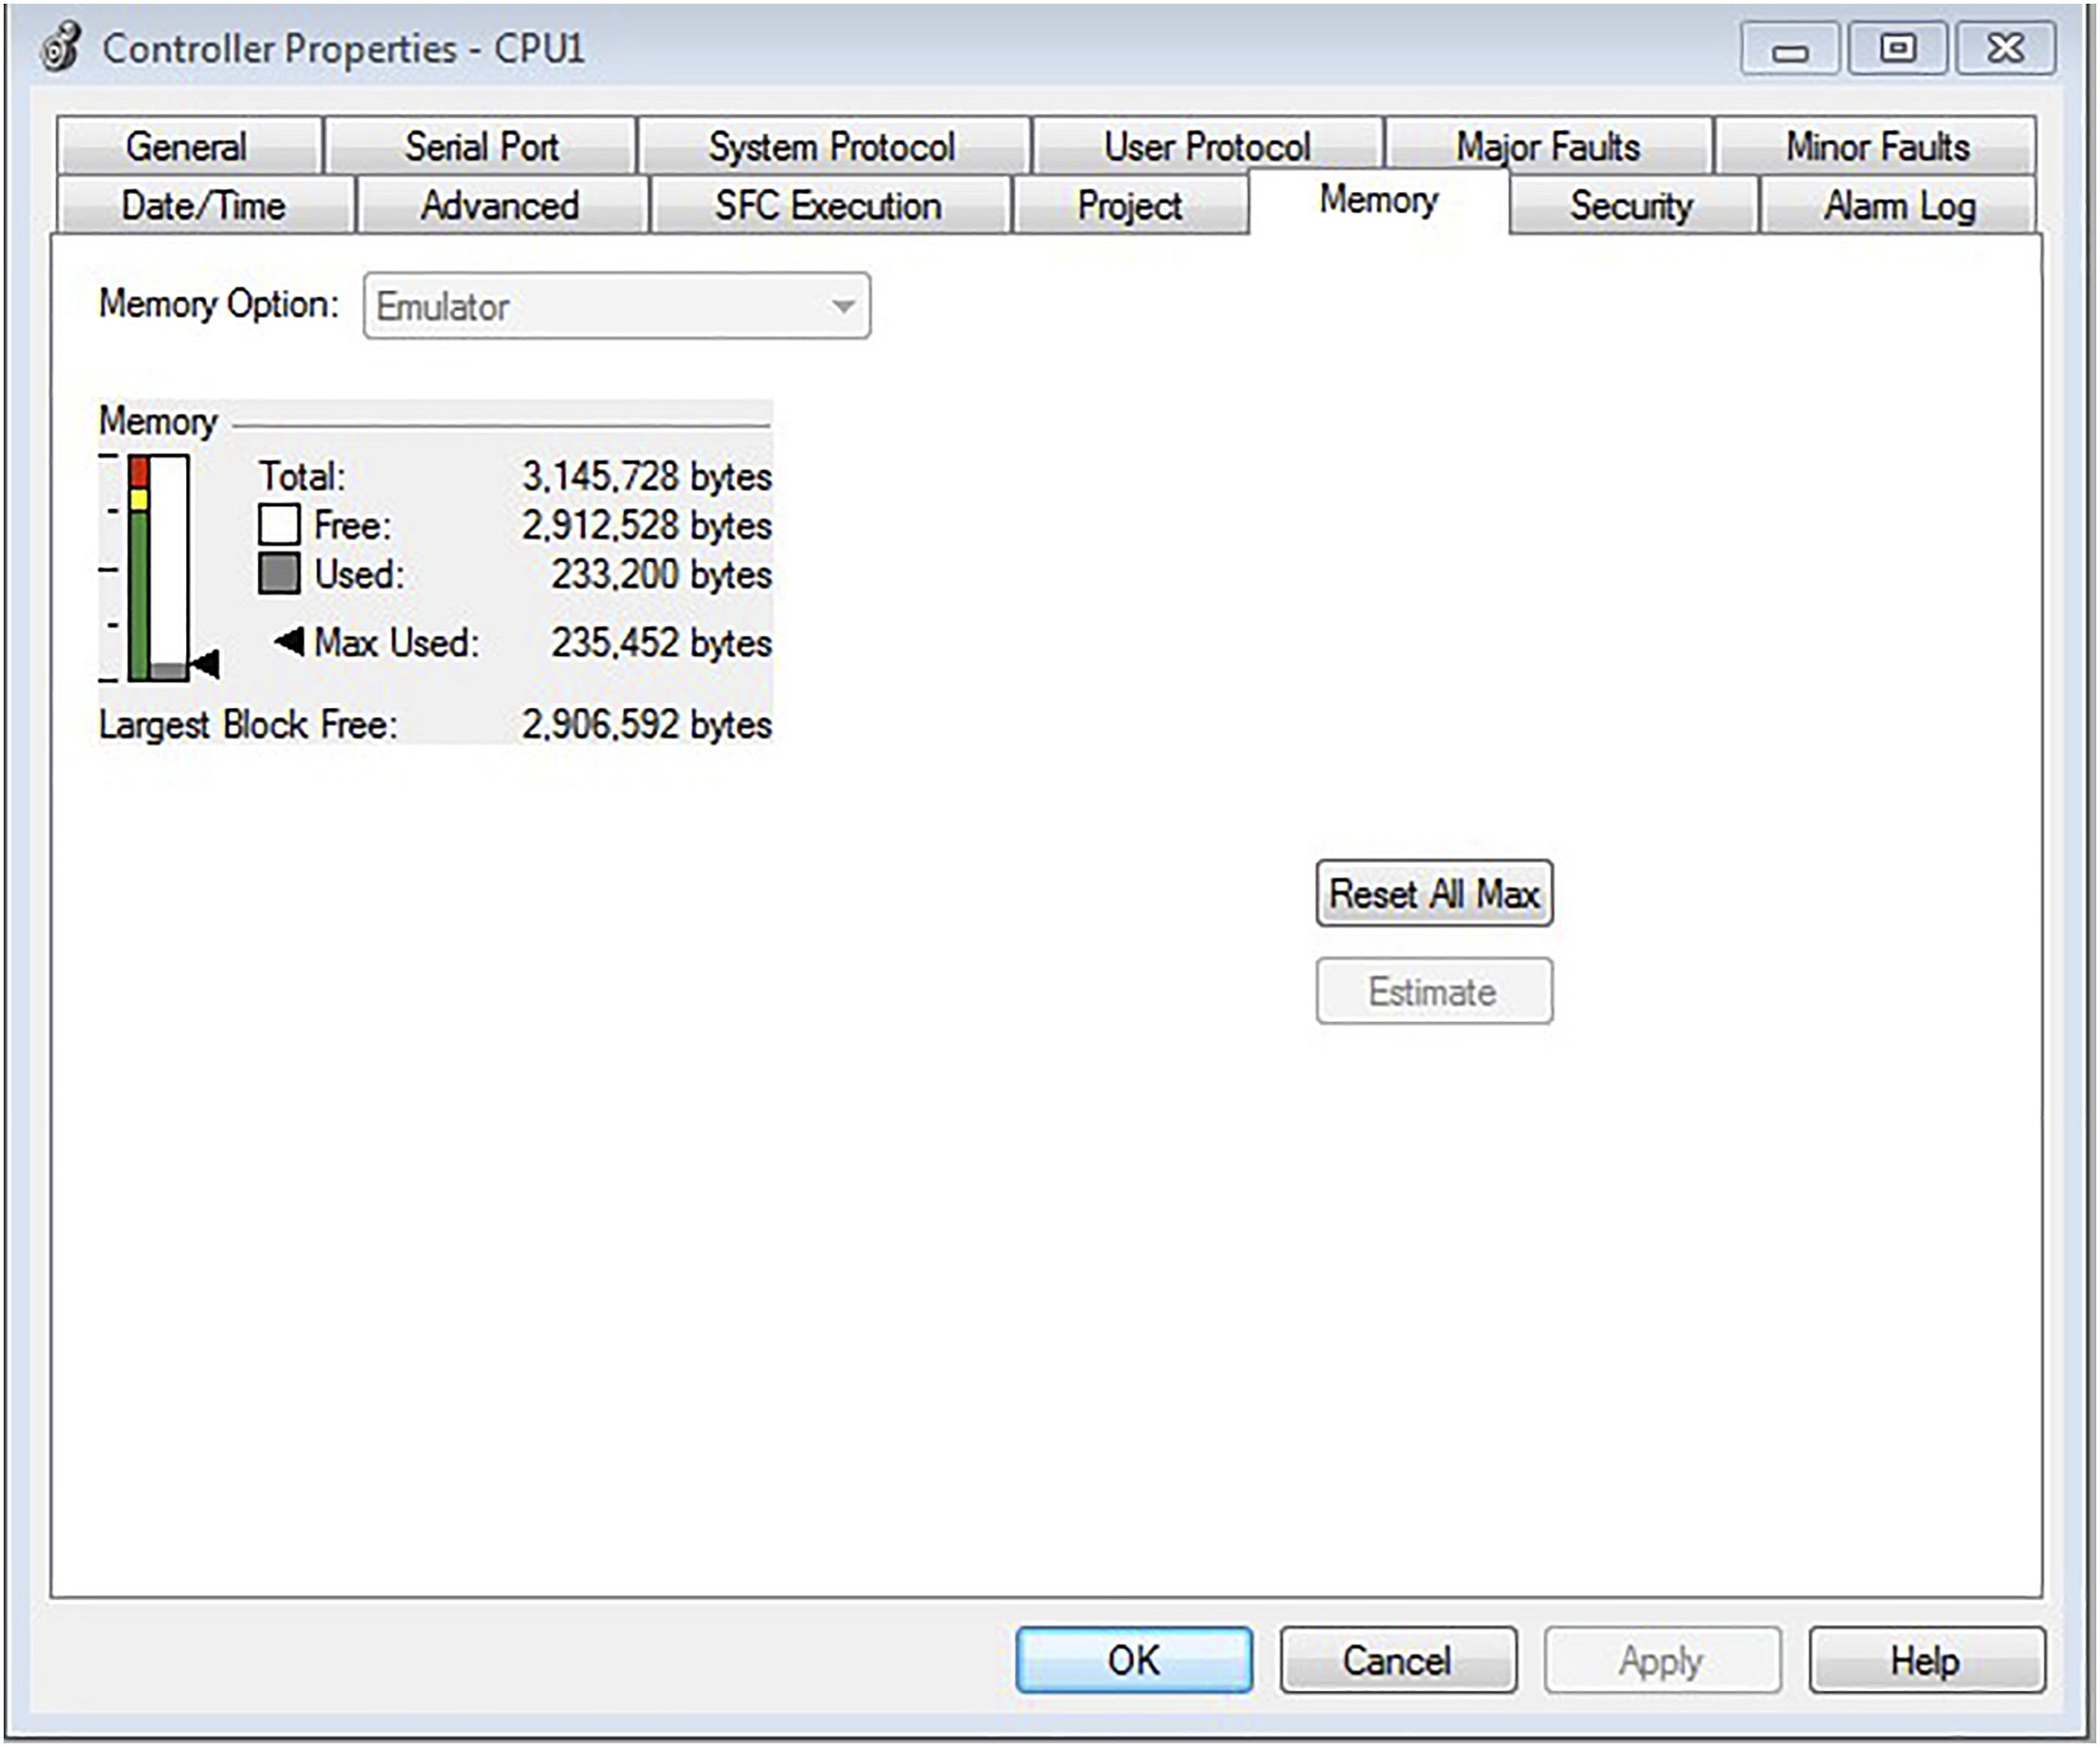
The highest size of the program while AOI is employed.
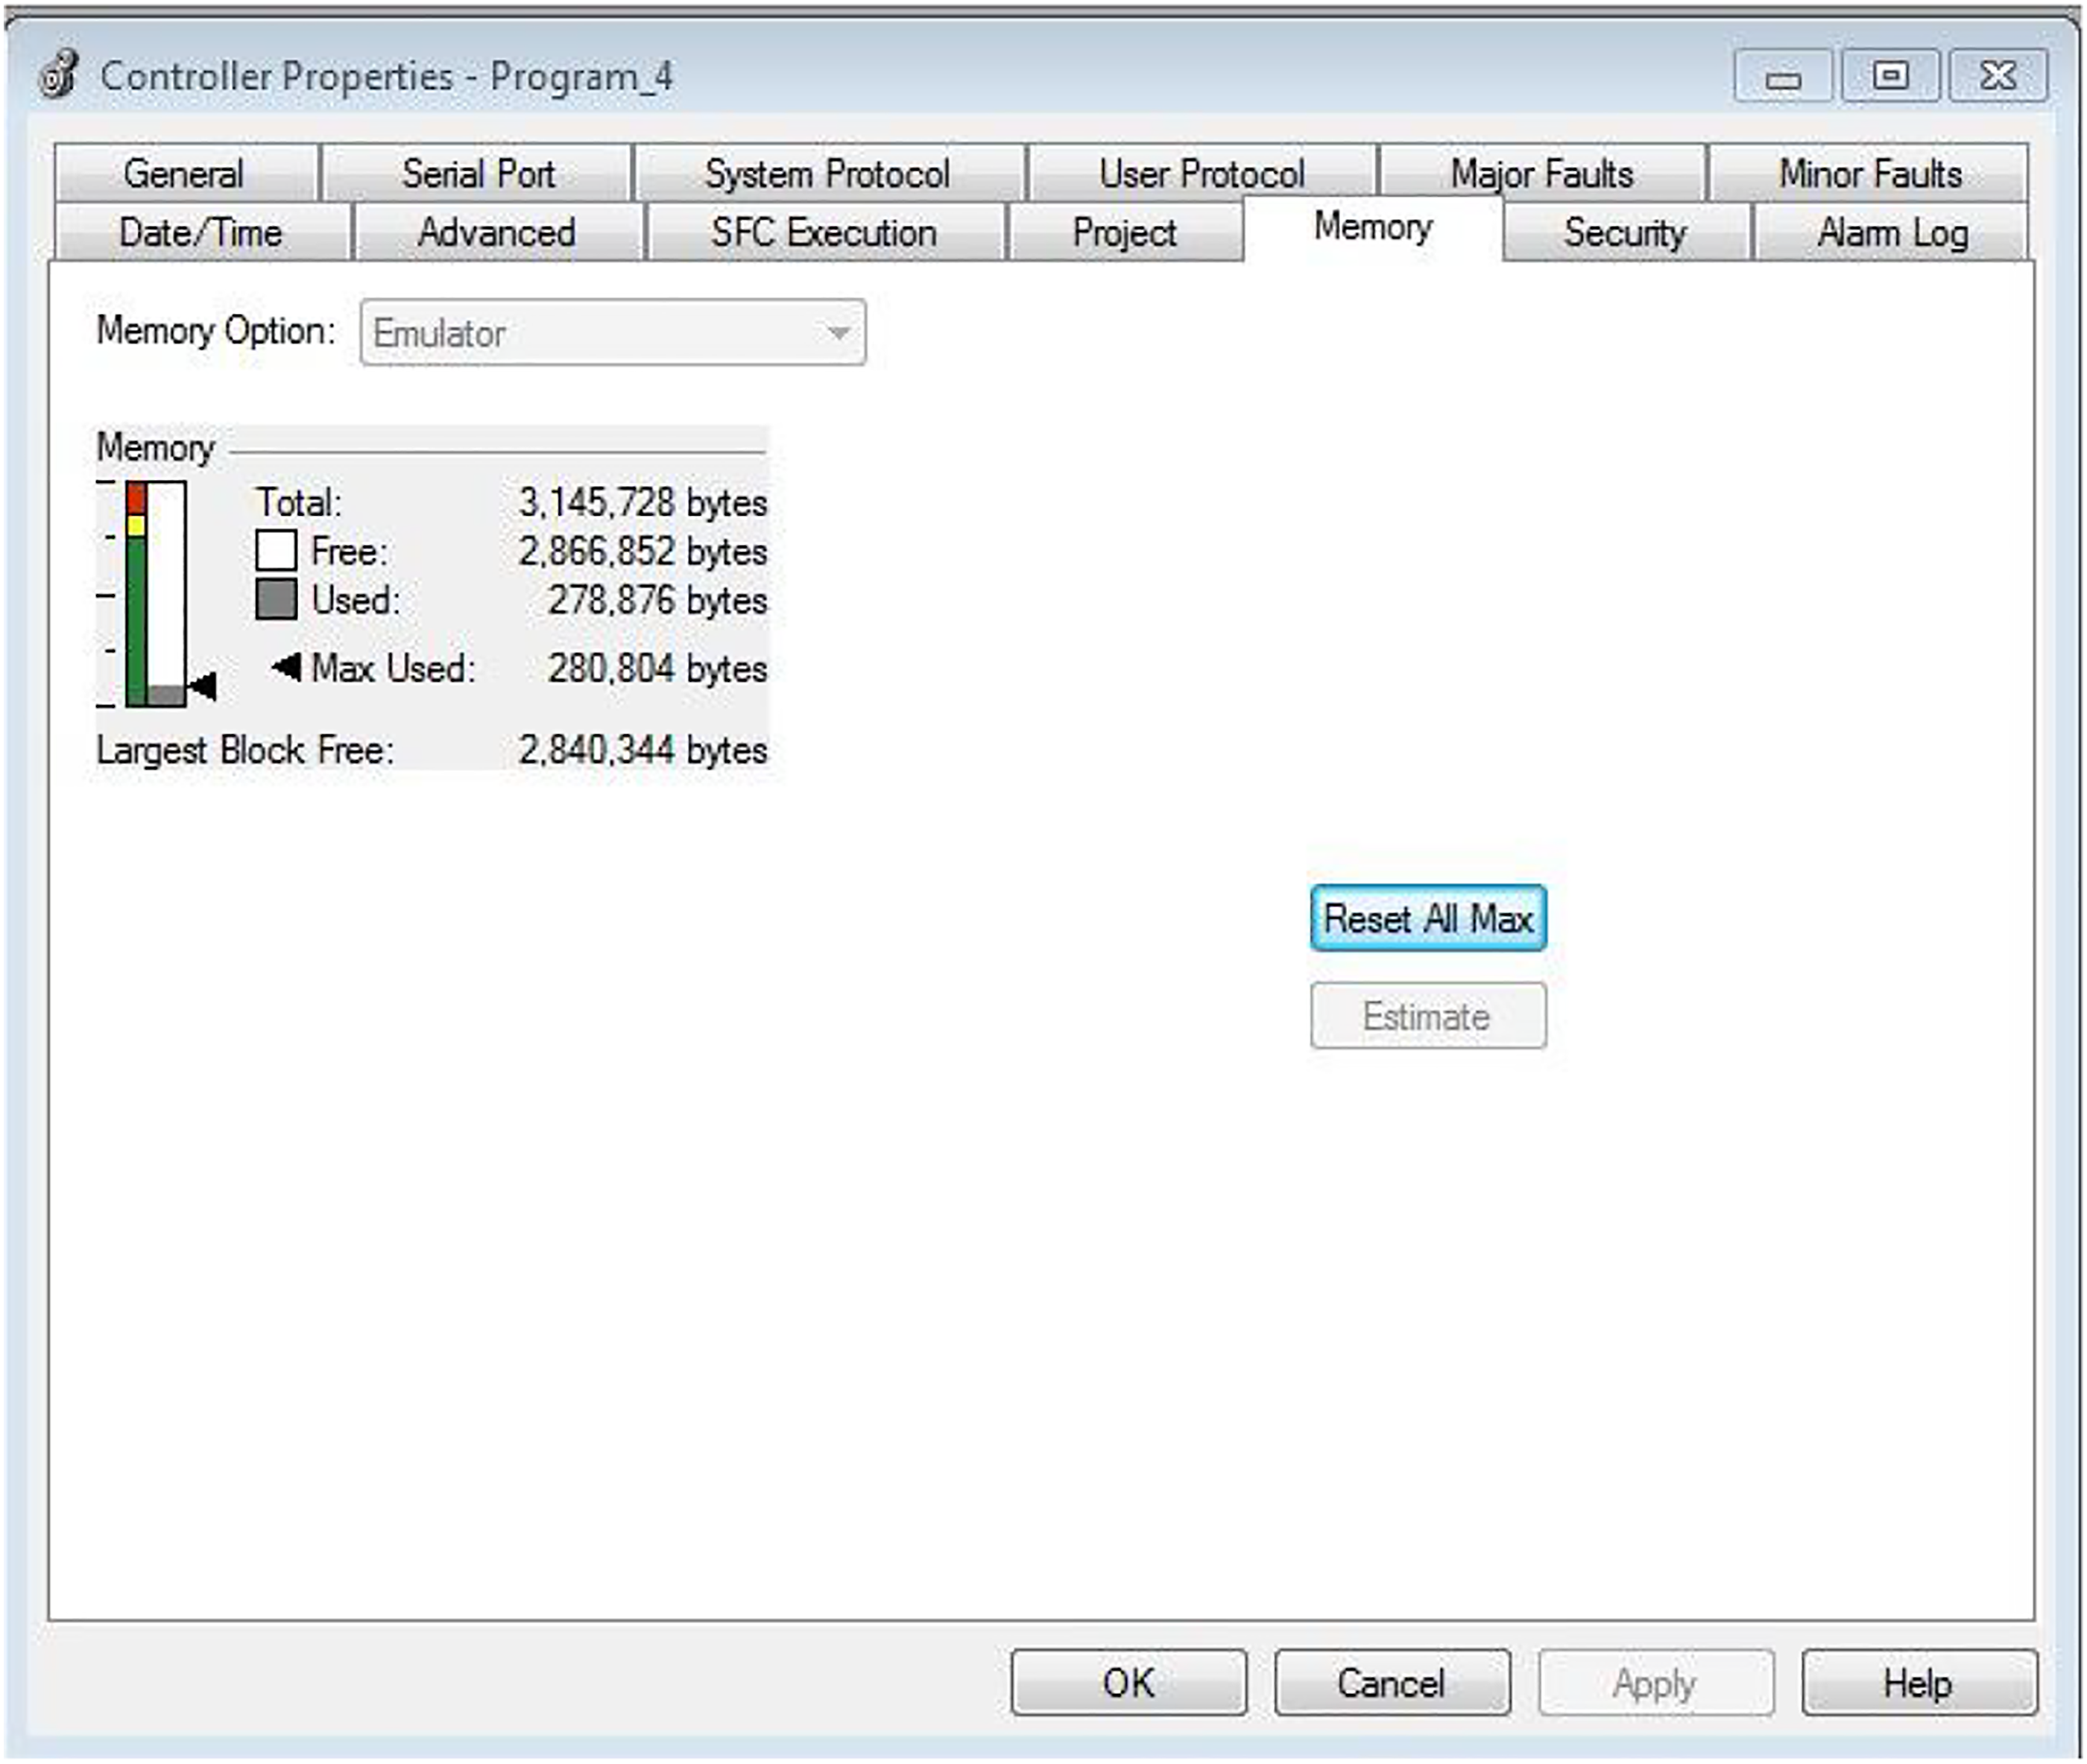
The highest size of the program while LD is employed.
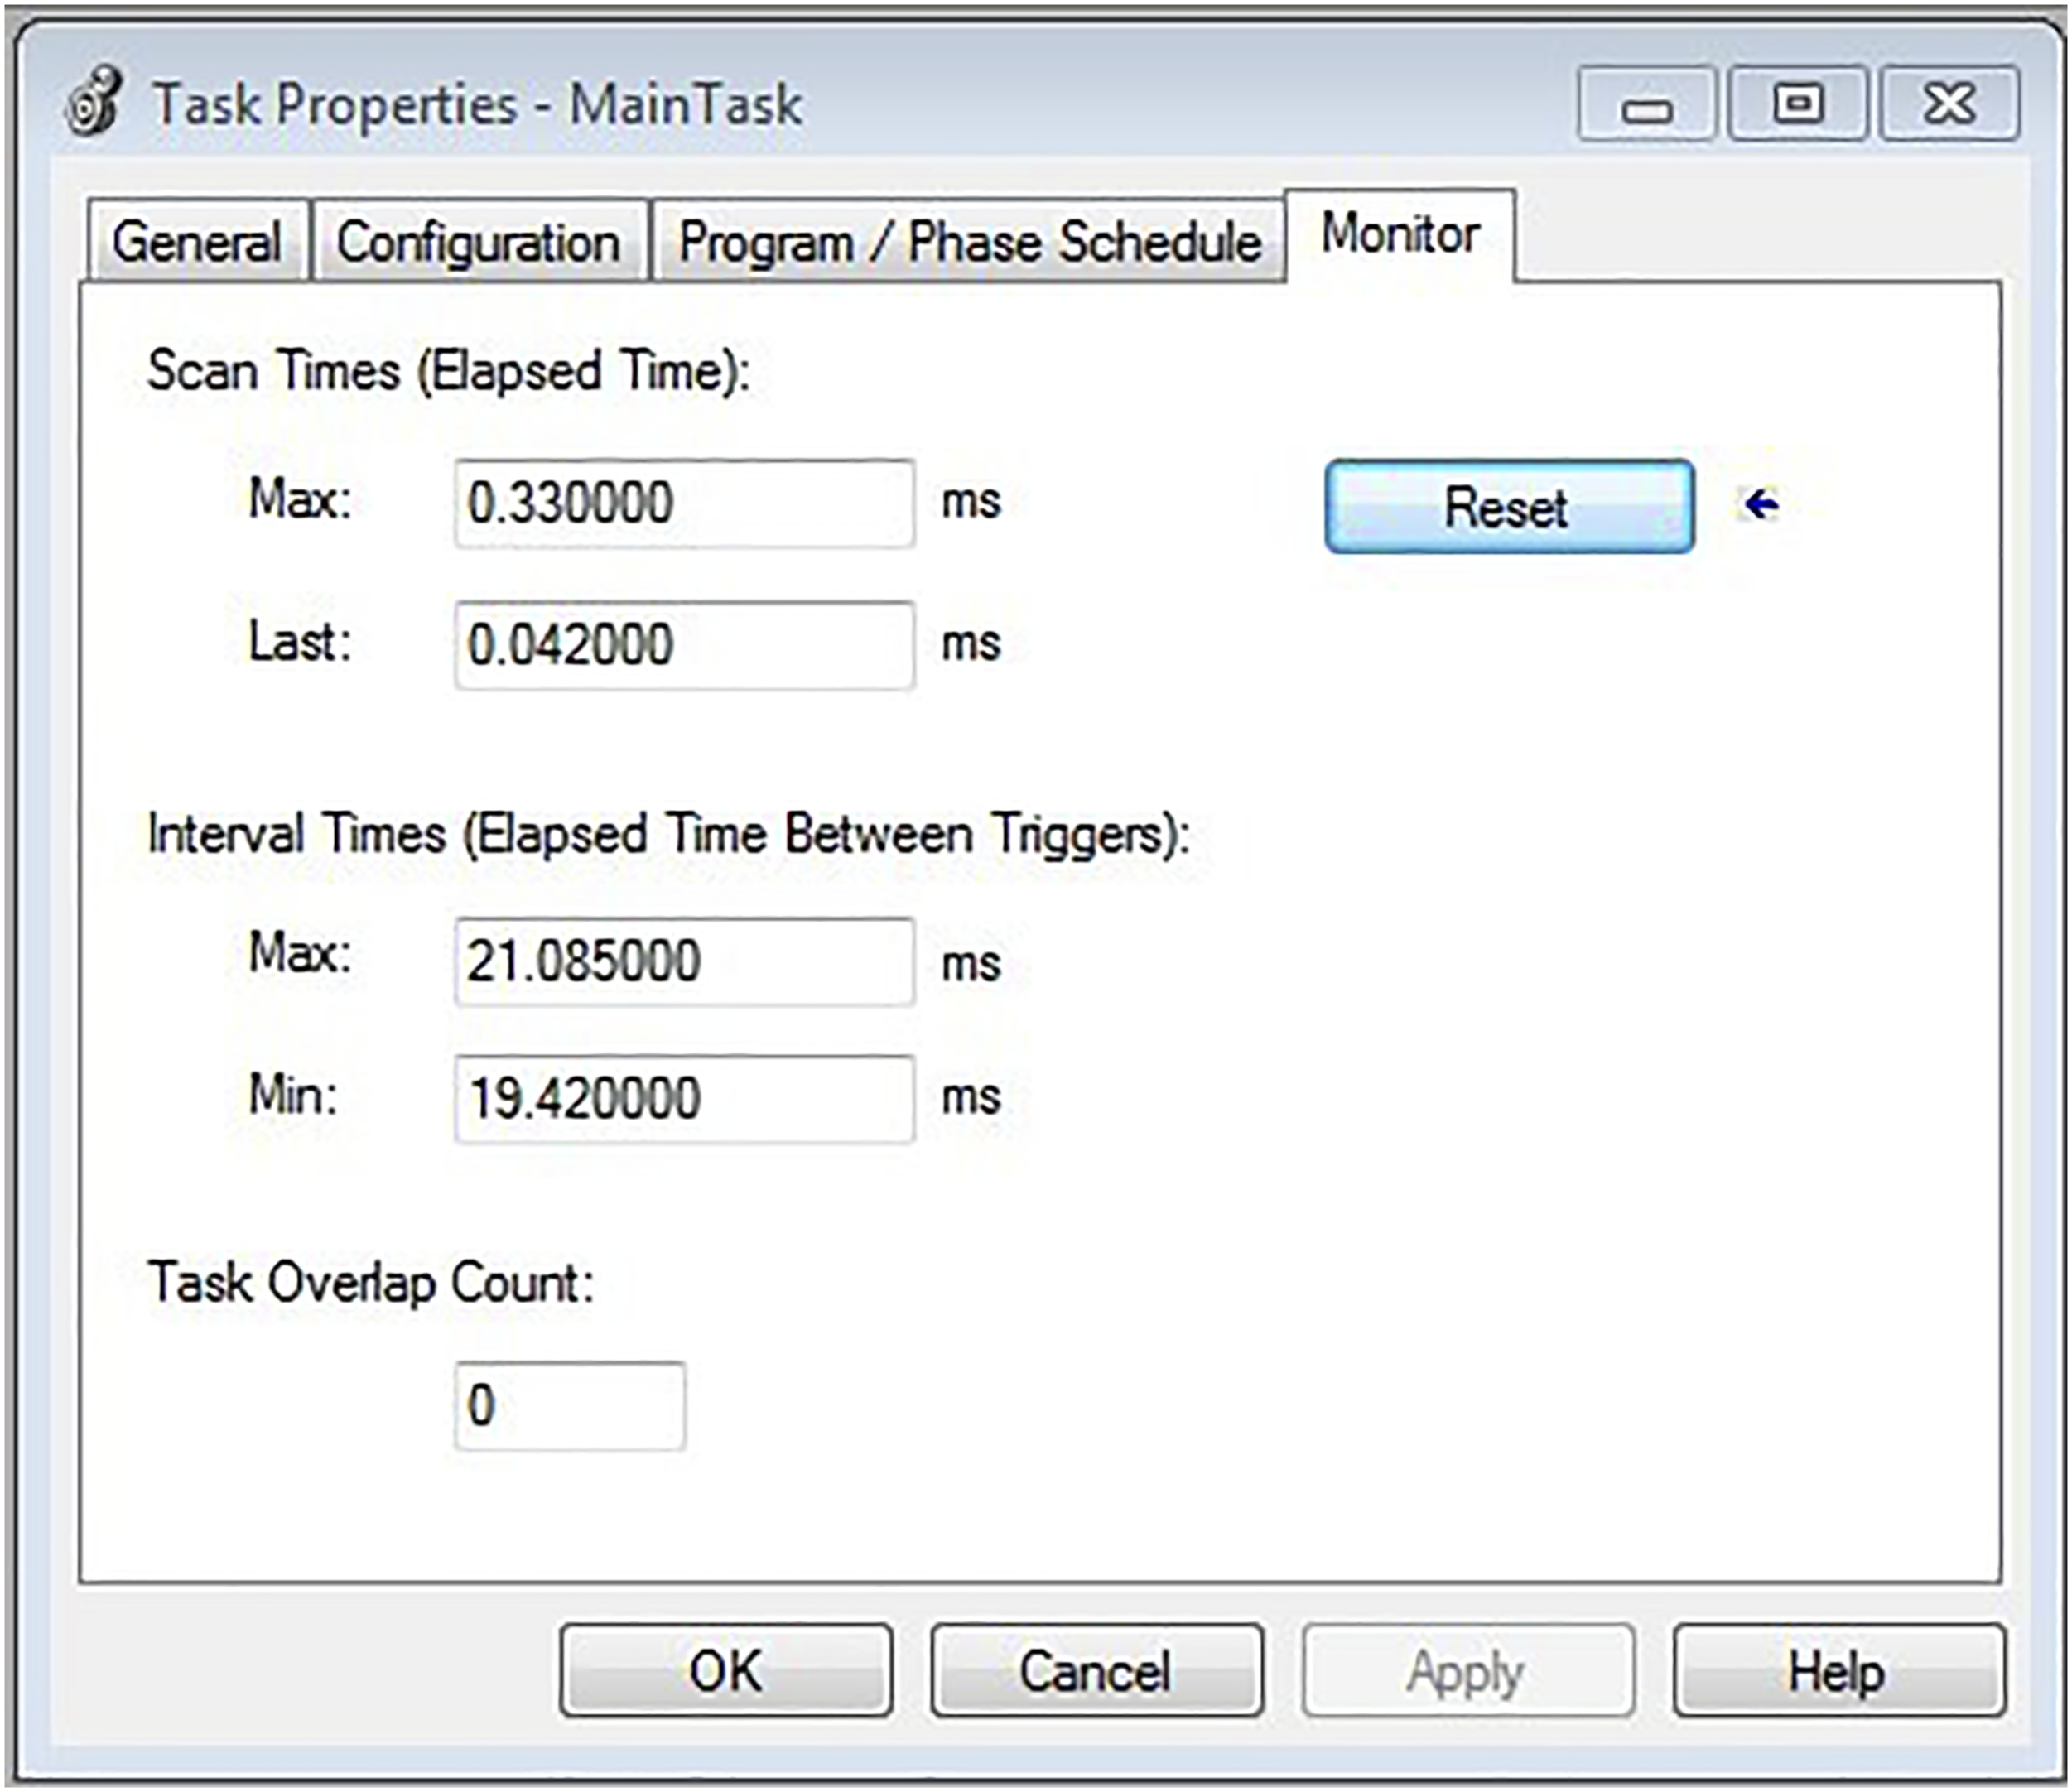
The highest scan cycle when the AOI is employed.
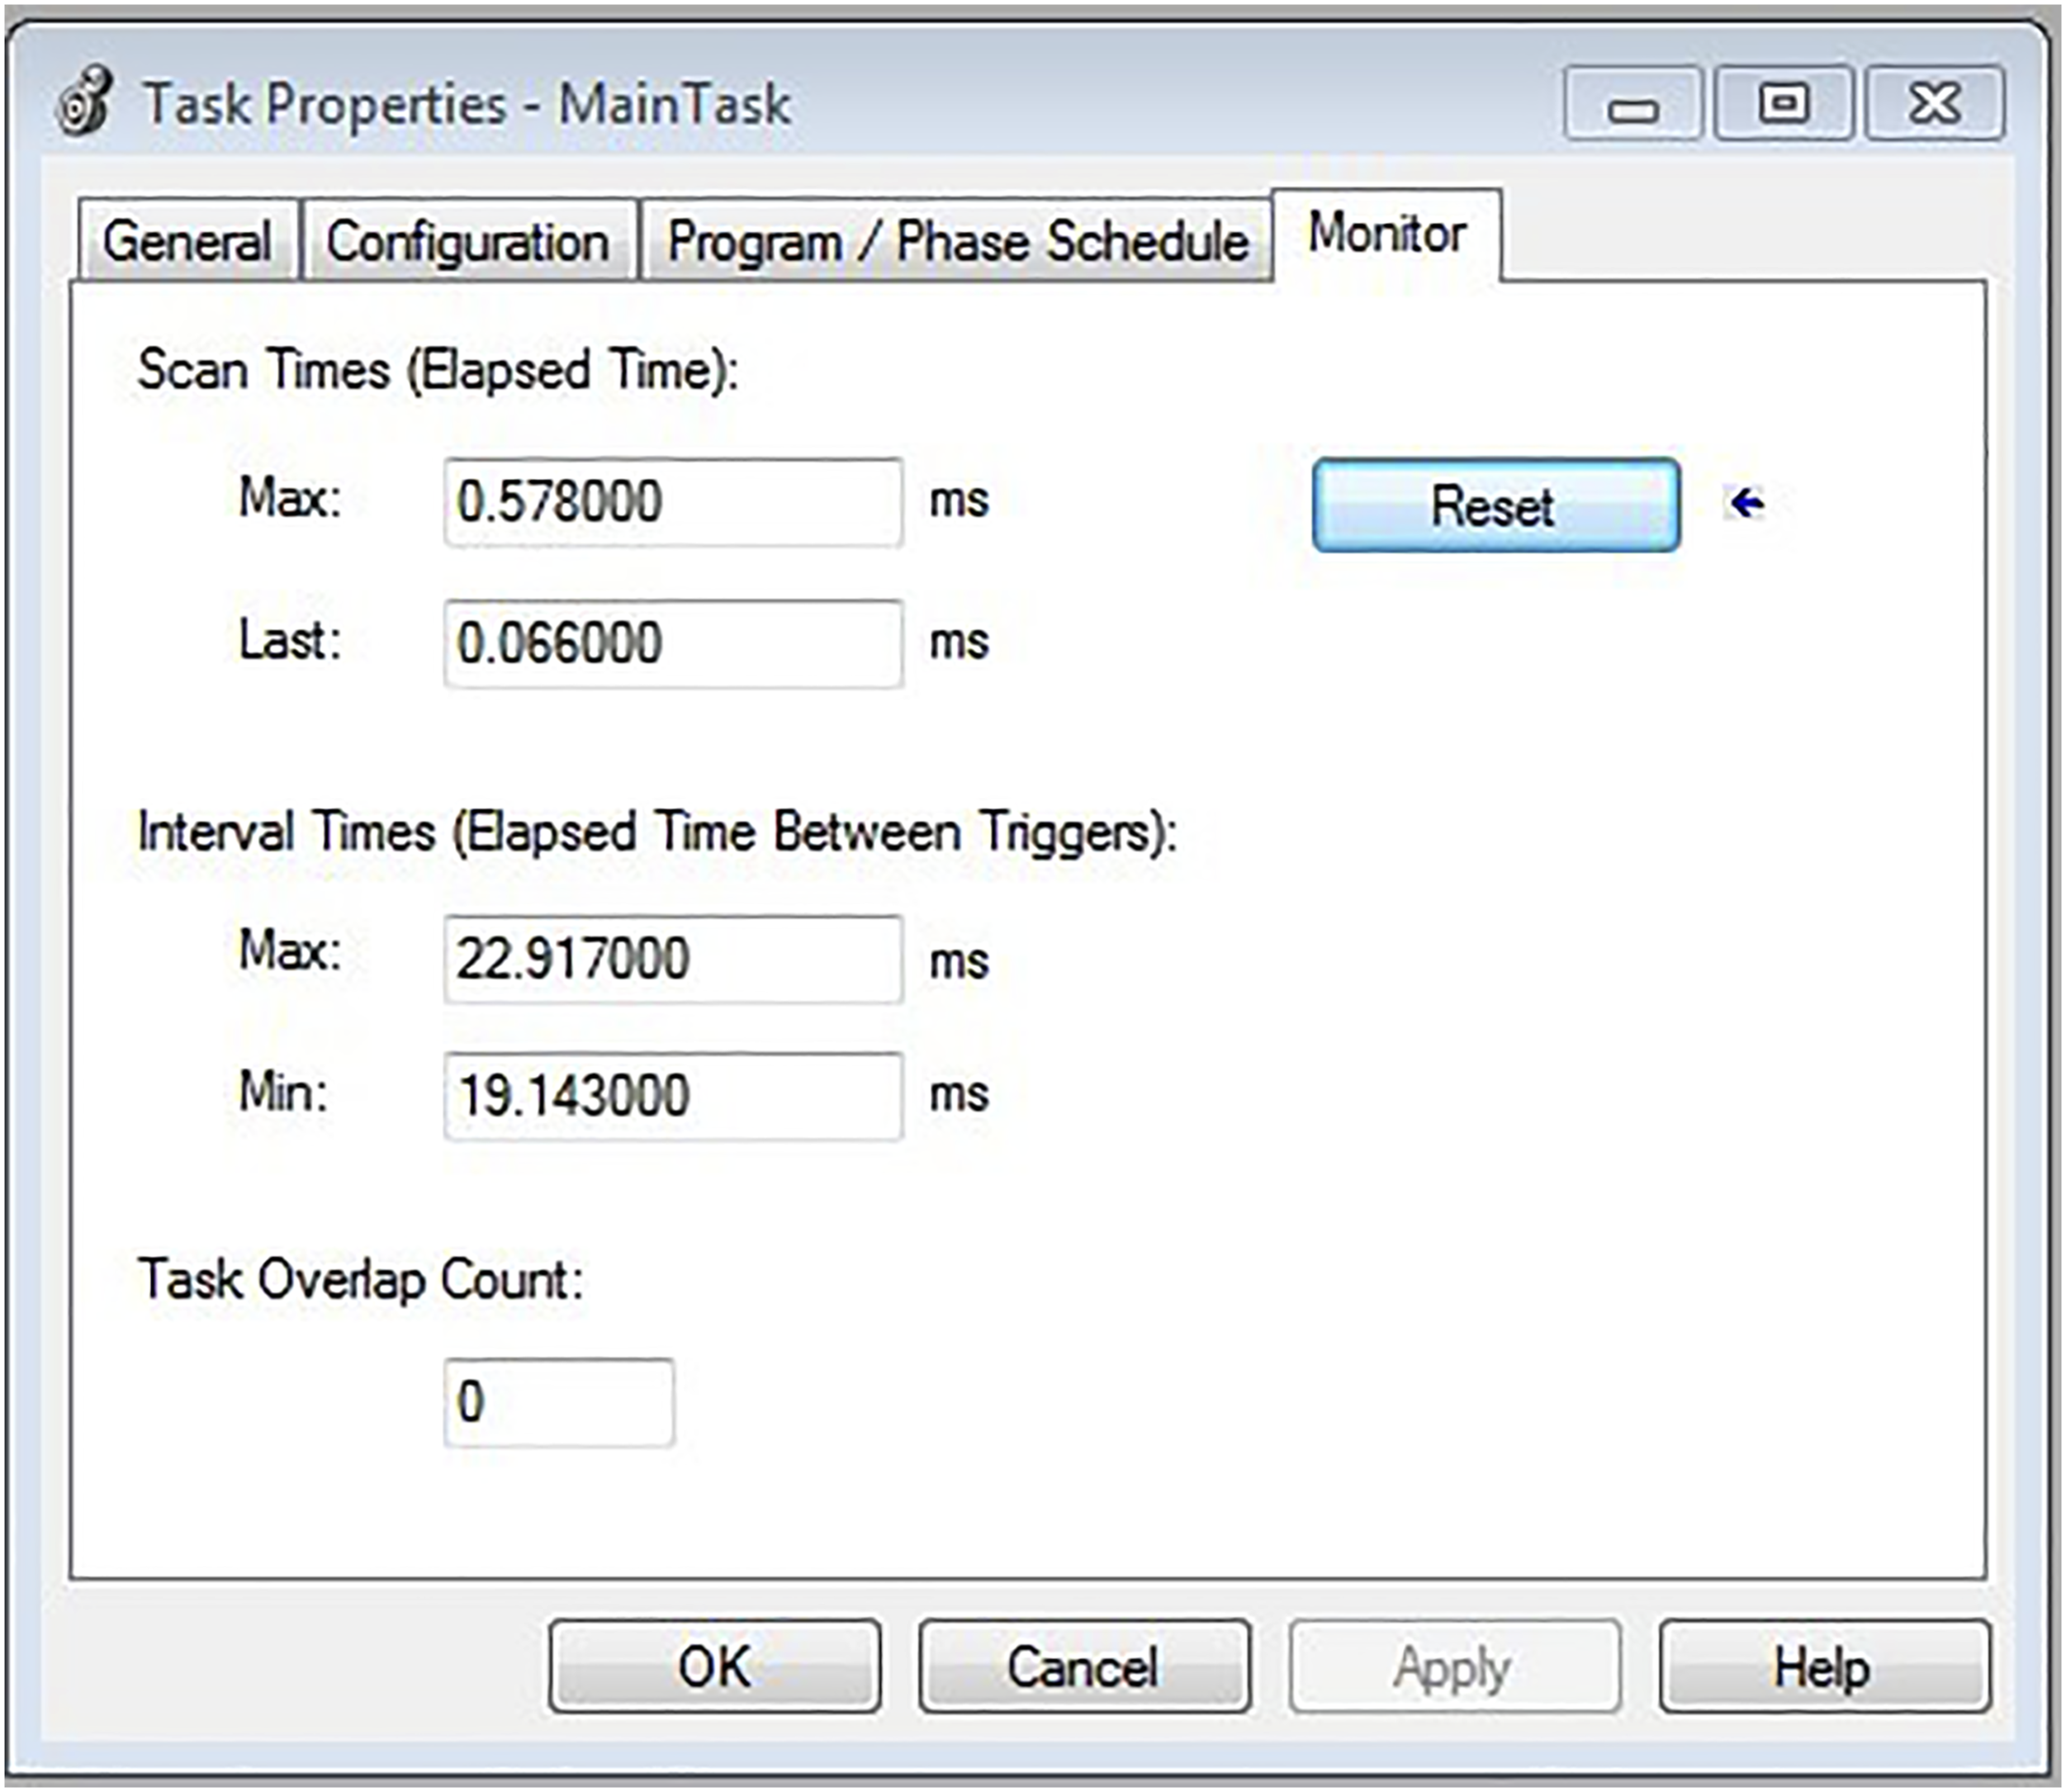
The highest scan cycle when the LD is employed.
Experiment II results
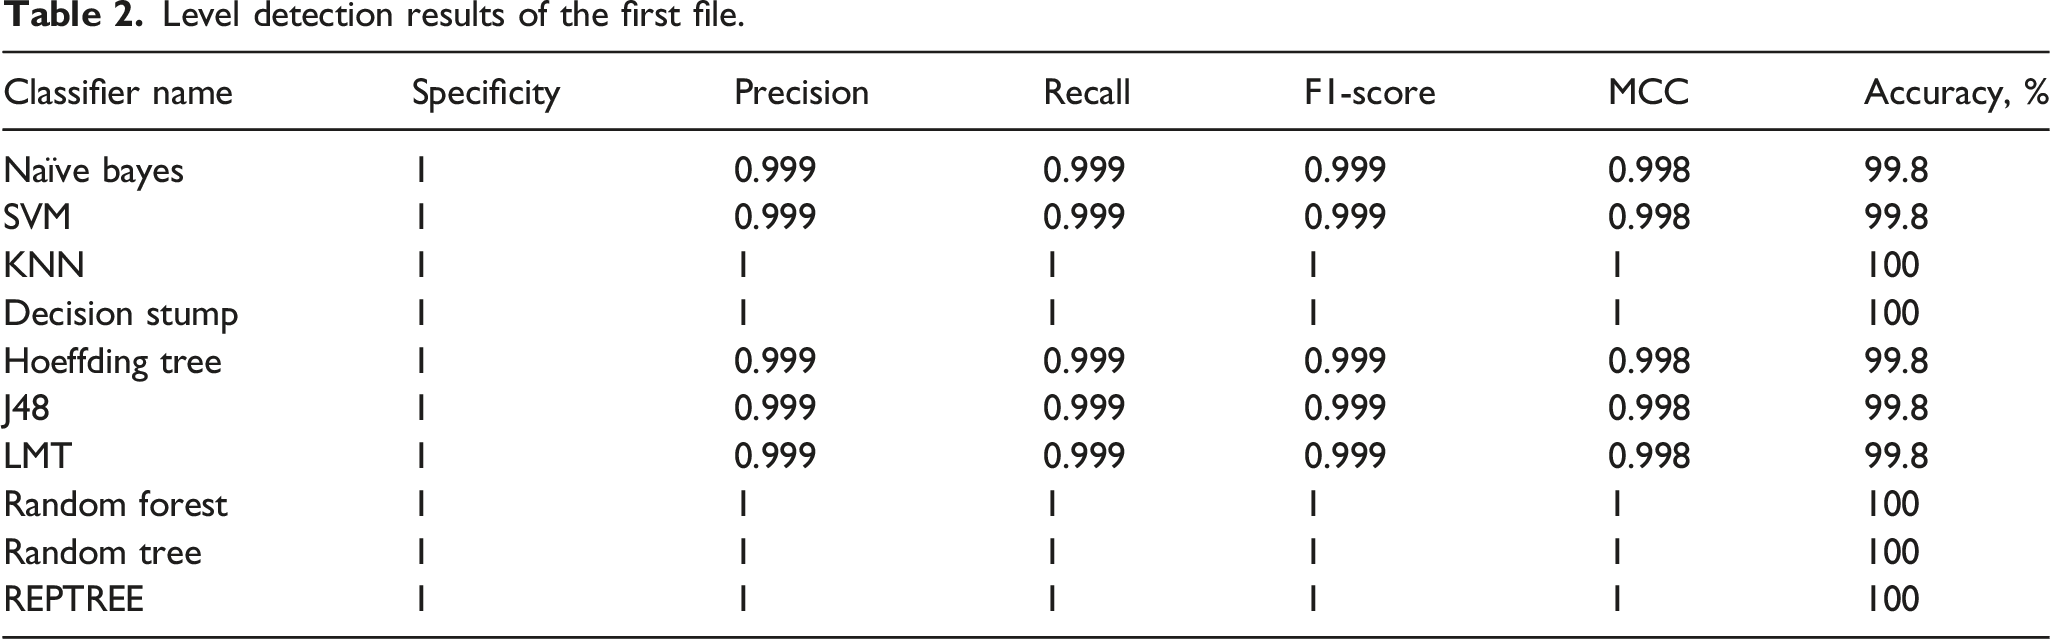
Level detection results of the first file.
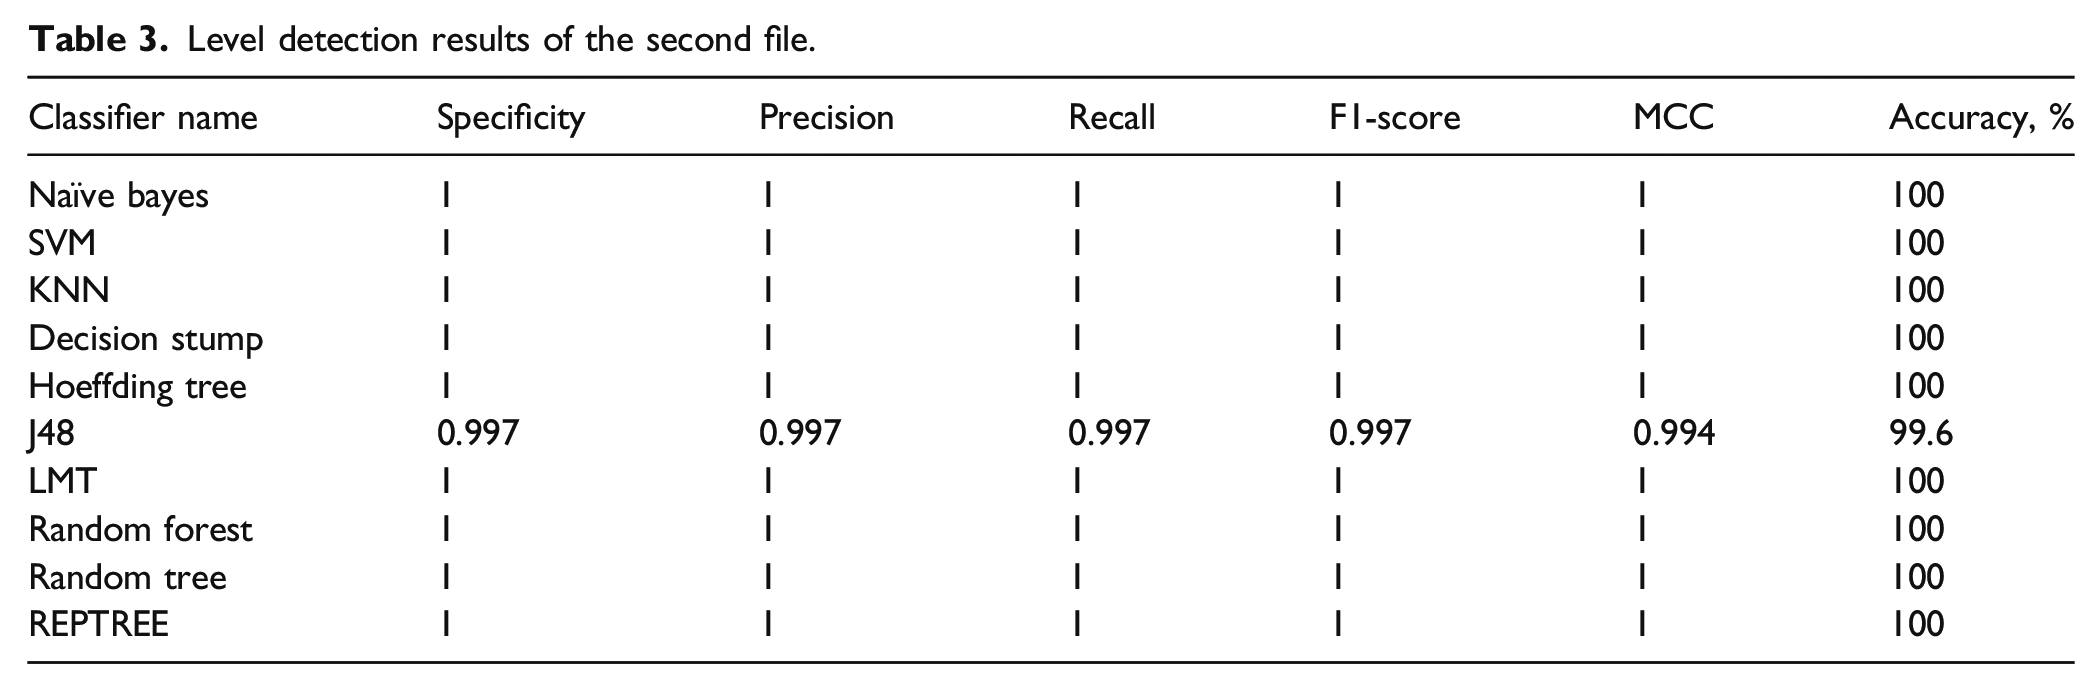
Level detection results of the second file.
Conclusion
The paper is aimed at developing a PLC-SCADA programming method using AOI to create a more easy structure, reduce the number of rungs, reduce the processor memory, and speed up execution time in contrast to conventional ladder diagrams. The problem is that PLC programs used in large-scale applications such as food, oil, and gas industry must easily reach thousands of ladders. This makes troubleshooting very difficult and requires very competent engineers. In order to resolve this problem, AOI is used for ladder programming in combination with traditional ladder commands. The proposed system is expected to have a positive impact on the oil industry’s financial, environmental, and human rights perspectives. It is believed that the construction of intelligent SCADA systems for oil refineries will be of significant importance in optimizing their production and enabling acting workers to achieve a more reliable environment. The same concept of PLC programing in the developed framework could be applied to other PLC manufacturers like Siemens, Honeywell, etc. These controllers could be used in a similar framework. Moreover, the applicability of the developed framework could be applied to other supervisory packages, for example, WinCC or LabVIEW-based SCADA systems could be used in the same framework.
An automated oil products terminal process control with ML capability was introduced. The principal goal of utilizing ML techniques is to add a smart feature to the processor to perform more efficiently and produce a reliable system. The suggested framework outcomes showed that it was capable of detecting the tank levels with good classification results. Therefore, it can be used to eliminate human errors effectively while operating. It can also ease the work planning and operational follow-up management plans and enable operators to manage their plans quickly. This will consequently decrease the chances of errors and enhance the quality of output results. Furthermore, applying ML to such a critical industry will help save more workforce, more employees, and reduce the possibility of environmental disasters, which is the most vital issue. Future work will focus on integrating deep learning architectures with PLC software in one tool. Moreover, collecting more data about systems and appending additional features to the classifier inputs will improve the process of automatic scheduling and further aid in optimizing operating conditions. The proposed framework limits the scope of application to similar programming devices with the same operating purpose. Else, the LD for equipment used for various purposes in the process are better used. Further research could find a solution to this restriction. Although the proposed framework is applied to the petroleum industry, apart from the particular petroleum industry, the developed framework could be framed in the Industry 4.0 field.
Footnotes
Declaration of conflicting interests
The author(s) declared no potential conflicts of interest with respect to the research, authorship, and/or publication of this article.
Funding
The author(s) received no financial support for the research, authorship, and/or publication of this article.