
Abstract
A metering roundabout where traffic is controlled by traffic lights with phase times influenced by queue detector occupancy might be the solution to enhance performance when there are unbalanced traffic flows at roundabouts. There have, however, been minimal studies on how the distance of the queue detector from the stop line affects signal phase time durations and the queuing lengths. This research, therefore, seeks to develop a Cuckoo Search/Local search Algorithm using parameters such as arrival volumes, conflicting volumes, detector distance and phase time to investigate the relationship of signal setting, detector location and queuing formulations. Also, some additional statistical tests were performed for the fitness of the data. In order to conduct solid model calibrations and validations, model output data was compared against the AIMSUN model. The results from the analyses demonstrated that the queue detector distance can affect phase time durations and vehicle queuing lengths on the controlling approach as well as queuing lengths on the metered approach. This study showed that, based on the study for the Old Belair Road roundabout, the total queue length (controlling + metered) will be minimized from 689 to 499 m by the proposed methods when the detector is relocated at 210 m from the roundabout stop line, giving longer phase green times and resulting in decreased intersection queuing lengths.
Introduction
Motivation
Roundabouts, a type of intersections, can experience congestion problems, particularly during peak hours when there are unbalanced traffic conditions.1–5 Delays on one or two approaches can be observed because entering vehicles may be interrupted by rotating vehicles. Thus, in order to form balanced traffic flow conditions and obtain enough gaps between rotating vehicles, the signalized roundabout emerged as a popular alternative, often called a metering roundabout.
The concept of metering roundabout 6 is described in Figure 1. In this roundabout, detectors are installed on the controlling (dominant) approach and the traffic signals on the metered (sub-dominant) approach are differently set up from traditional ones. Stevens, 1 Azhar and Svante, 7 and Mosslemi 8 mentioned that a signal roundabout can be grouped into three categories: traffic flow control, operation time and number of approaches controlled as presented in Table 1.
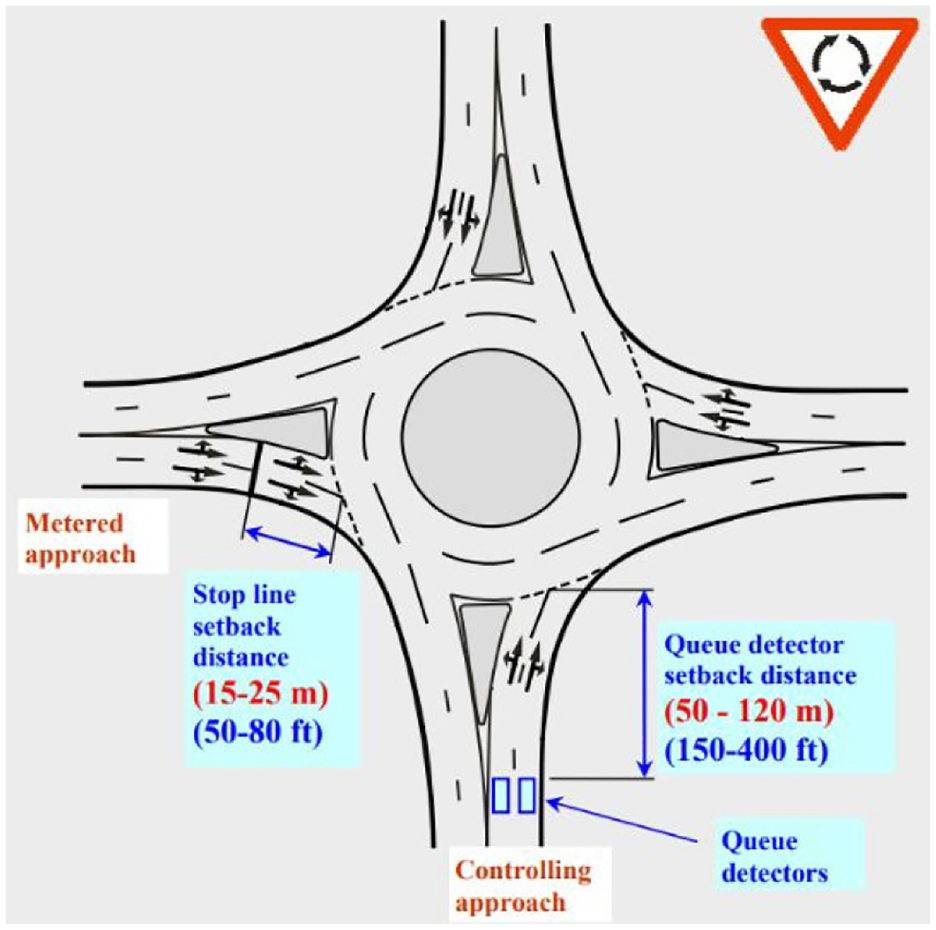
Concept of metering roundabout. 6
Categories of signal roundabout.
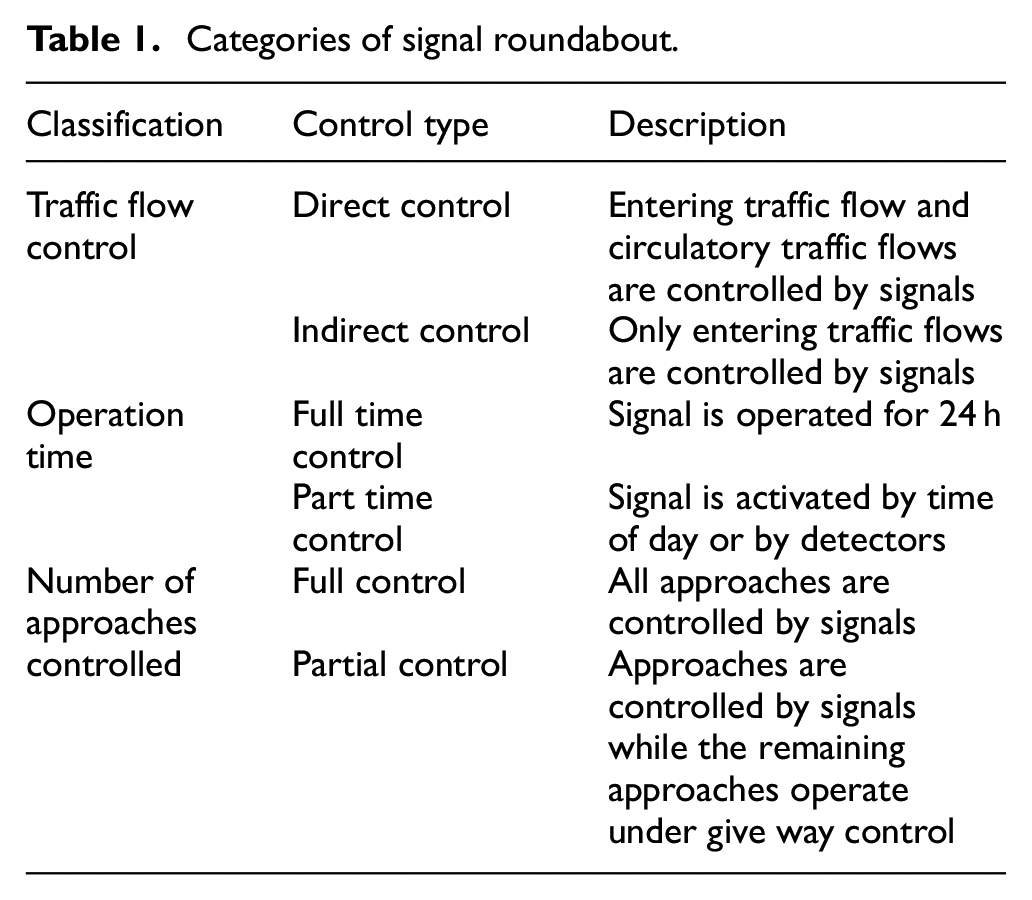
Among the categories of signal roundabouts given in the table above, unbalanced traffic flow conditions usually occur during peak hours, thus, indirect with part-time control is the most appropriate control system.1,3,9,10 In addition, the simple form of a signal metering roundabout has a valuable benefit-cost ratio because it is easy to operate with low installation cost. 11
The operational principle of a metering roundabout is based on queuing length, detector location and signal phase durations. Further, signal phase times can be adjusted when pre-scheduled queue length is detected. However, there are no clear guidelines about how to use traffic signals for roundabouts, and no specific way to determine detector locations.
Literature review
In order to increase intersection or road network capacity, typical artificial intelligent optimization methods are widely used.12–14 These methods try to find minimum delay time, queuing length or the number of stops through the adjustment of cycle length and signal phase duration.
Sergey et al. 15 analyzed the associated characteristics of traffic signal control and dynamic guidance systems, using intelligent technology and fusion technology to study its intelligent collaboration, and proposed a structural framework for urban traffic signal control and traffic guidance system intelligent collaboration, which is controlled by traffic signals. Yu et al. 16 discussed the problem of traffic demand balance under the condition of limited environmental capacity of road sections using mathematical programing methods to describe the continuous network balance problem of demand changes in the waiting situation. However, the impact of urban traffic signals on the passage capacity of road sections at intersections and how to meet the increasing traffic demand by traffic signal timing was not considered.
Brederode and Verlinden 17 considered how to increase network traffic demand under traffic signal control conditions using a bi-level optimization framework. Lin et al. 18 studied the user balance distribution problem and the system optimal distribution problem based on emissions. Ding et al. 19 discussed the generalized user optimal equilibrium assignment problem and the generalized system optimal equilibrium assignment problem. Fontaine and Minner 20 combined the road environment capacity limitation, the optimal traffic signal setting problem and the urban traffic discrete network design problem. However, the construction of new road sections maximizes the traffic demand to meet the growing traffic demand in the city and the maximum demand of the transportation network can meet the requirements of modern urban environmental protection through the restriction of road environmental capacity. In addition, the optimization methods concept such as particle swarm optimization and multi-objective optimization show the successful application in many fields.21–23 Also, Brits et al. 24 and Naves et al. 25 conducted studies to find the best traffic signal durations using these methods. However, these studies only focused on the signalized intersections and signal phase time resulting different performance. Moreover, the optimization methods did not apply to the metering roundabouts to find the best detector location.
With regard to the metering roundabout studies, several researchers attempted to make a definition of unbalanced traffic conditions using the origin-destination factor, which is able to enhance metering roundabout capacity.9,26 According to past studies, the operational performance on a roundabout can be exacerbated by unbalanced traffic conditions. In such cases, an effective solution is the metering roundabout leading to a decrease in queues or delays. In addition, past studies explained that vehicle movements on a roundabout and T-junction are similar and they operate individually. Another studies,9,27 however, gave a definition with respect to unbalanced conditions with the prerequisite that ingressing vehicles from one approach might affect the vehicle movements on other approaches at roundabouts.
According to Akçelik,6,10 the distance of the queue detector from the give-way line should be in the range of 50–120 m using the probability of the blockage parameter that is used when a road has limited queue storage. The parameter describes how downstream traffic flow affects upstream congestions. Fortuijn, 28 a study of the queue detector distance from the stop line is important because signal phase durations are greatly influenced by detector occupancy rates with respect to the metering roundabout. Fortuijn, 28 also tried to find the queue detector distance (demand detector) using the Pollaczek-Khinchine M/M/1 waiting-time formula. However, this study was based on a different type of control metering roundabout (turbo roundabout) which had the queue detector installed on the dominant approach and a delay detector on the sub-dominant approach.
Contribution and organization
At present, many researches on the optimization and control of urban traffic are mostly based on the optimization of traffic flow distribution in the urban transportation network, or the optimal control based on the shortest time between the traveler’s starting points, or the largest urban capacity. Optimal control of traffic flow distribution optimizes for the signal period or signal time interval mostly using conventional optimization methods. Indeed, there have been minimal studies on the determination of detector location affecting queuing length at metering roundabouts. Consequently, when a metering roundabout is planned, no guideline for the determination of optimal detector location is provided and majority of studies relies on the use of existing analysis software. There is no research to reveal a relationship between the detector location and signal phase duration at metering roundabouts. Furthermore, there are still relatively little research to investigate detector locations, which is an important parameter affecting the entire performance of the roundabout.
Therefore, this study investigates not only the optimal detector position but also a relationship between the detector locations and signal phase duration at metering roundabouts using the Cuckoo Search/Local search Algorithm. The detail of detector locations and the queuing length on major (controlling) approach and minor (metered) approach presented in detail. The proposed method simulated using Matlab software and compared with microscopic simulation model AIMSUN. To achieve this purpose, drone footage data will be used in the process of CS/LS algorithm, and AIMSUN model development, calibration and validation. Furthermore, Geoff E. Havers (GEH) tests will be performed to assess the fitness of the model in AIMSUN.
Research background
The metering roundabouts model
It is the case that the metering signal phase lengths can be determined by the position of the approach detector. An et al. 29 applied the concept and formulated the queuing length models at metering roundabouts in order to estimate the queuing length based on detector locations and signal phase times. In their study numerical models were formulated with six main parameters that significantly affect the formation of queuing length for each approach. Three variables (i.e. arrival volume, conflict volume and vehicle space) commonly have a positive relationship to queuing length. However, detector location on the controlling and metered approaches, vehicle presence time on the controlling and metered approaches, and signal phase green and red time duration can be differently applied. Therefore, the queuing length estimation model in controlling and metered approaches can be expressed in equations (1) and (2). 29
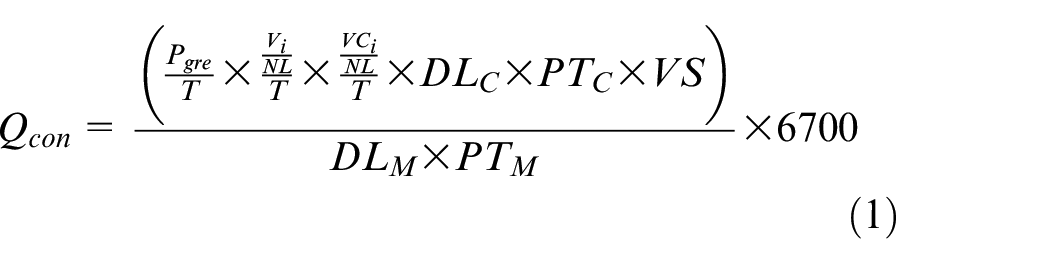
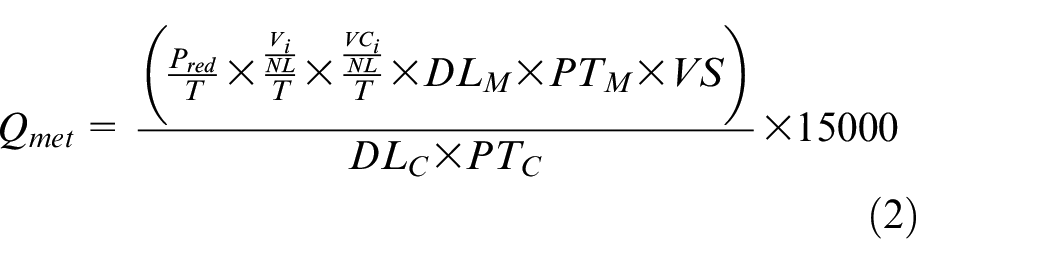
The phase green and red times can vary theoretically by up to 300 s (5 min). To explain in detail, in a cycle of 300 s, the green and red time may take a share of the cycle time. Thus a relationship between Pred and Pgre is presented in equation (3).

Where, Qcon is the queuing length of the controlling approach (m), Qmet is the queuing length of the metered approach (m), Pgre is the green time (s), Pred is the red time (s), NL is the number of the lane, Vi is the arrival volume of subject i approach (vehs), Vci is the conflict volume against subject i approach, DLC is the detector location on the controlling approach (km), DLM is the detector location on the metered approach (km), VS is the vehicle space (m), PTC is the vehicle presence time on the Detector C (s), PTM is the vehicle presence time on the Detector M (s), and T is time.
The Old Belair Road roundabout has no detector on the metered approach, thus, constant “1” was applied for the cases (i.e. DLM = 1 and PTM = 1).
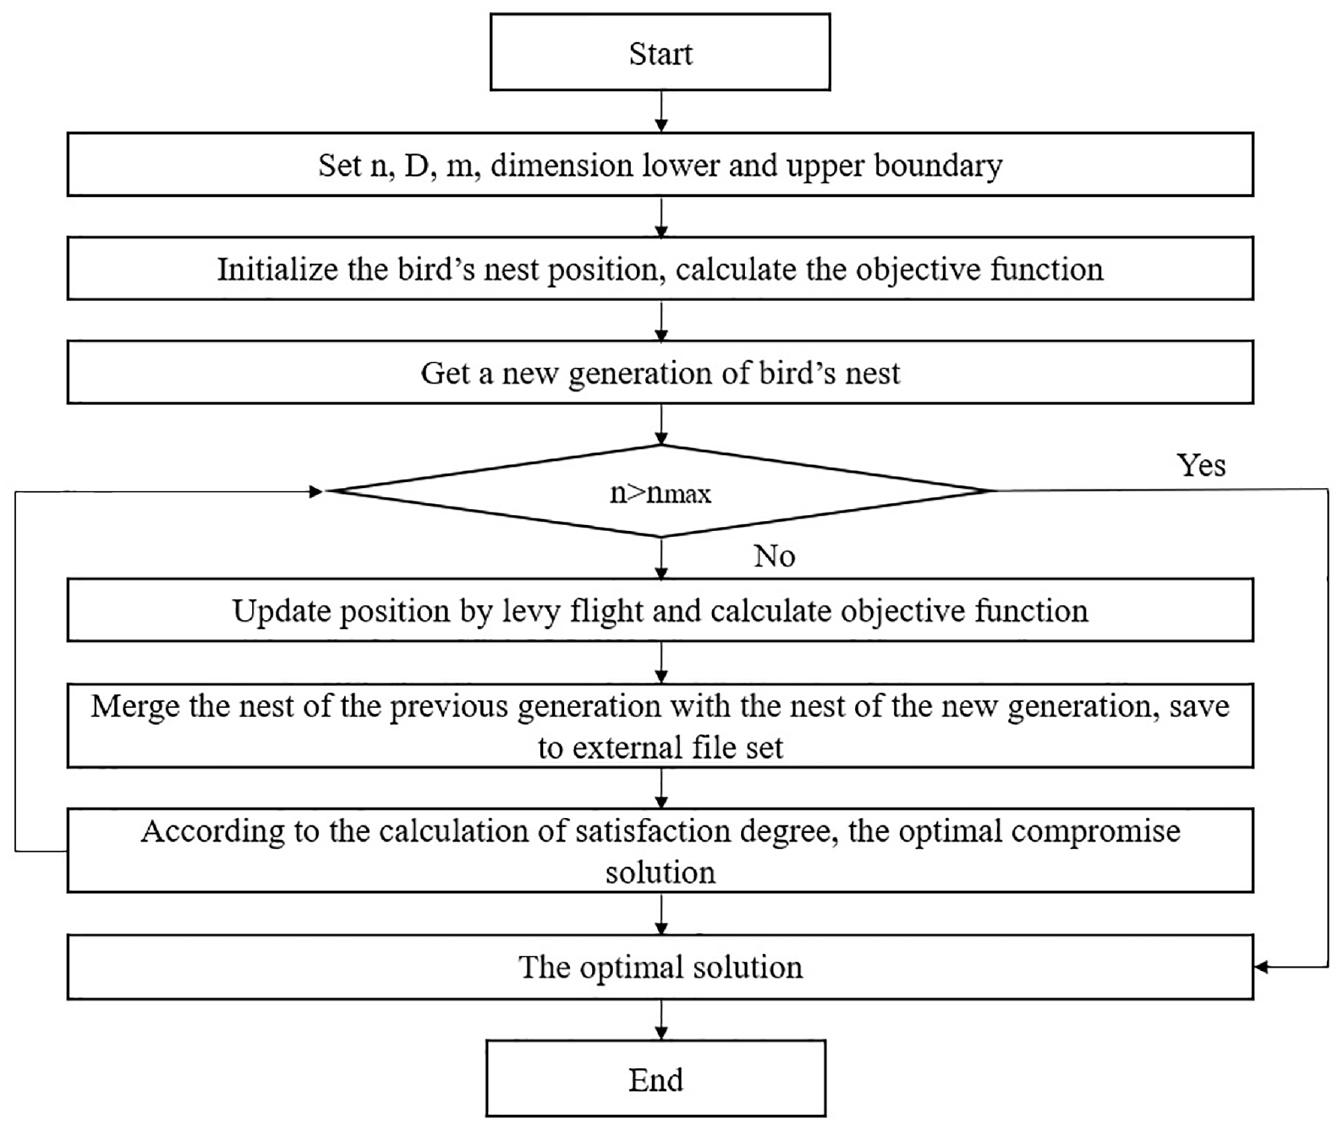
The cuckoo algorithm
The cuckoo search (CS) algorithm is an emerging algorithm that combines the common cuckoo breeding mechanism with the local search (LS) method.30–32 The CS algorithm has a good initial search ability, but poor optimization ability in the later periods, low search accuracy and slow convergence speed, so it needs to be improved for multi-objective optimization.
For a 1-dimensional optimization problem, d variables are needed:

The Levy Flight location update formula is:


Where:
If the parasitic nest’s communication threshold is δ, the current optimal parasitic nest position is

In the formula:

Where:


Where, M is the number of solution vectors;
Where,
The local search
In order to improve the solution quality, a LS scheme was carried out, in which it explored the area less congested in the current archive which may obtain more non-dominated solutions.33,34 The general operation of the scheme is described in the following steps.

Where,
Although the number of trials

Where,

Point

Where, λ is the step length, which could be taken as λ = 1.
Data collection and proposed methods
Data collection
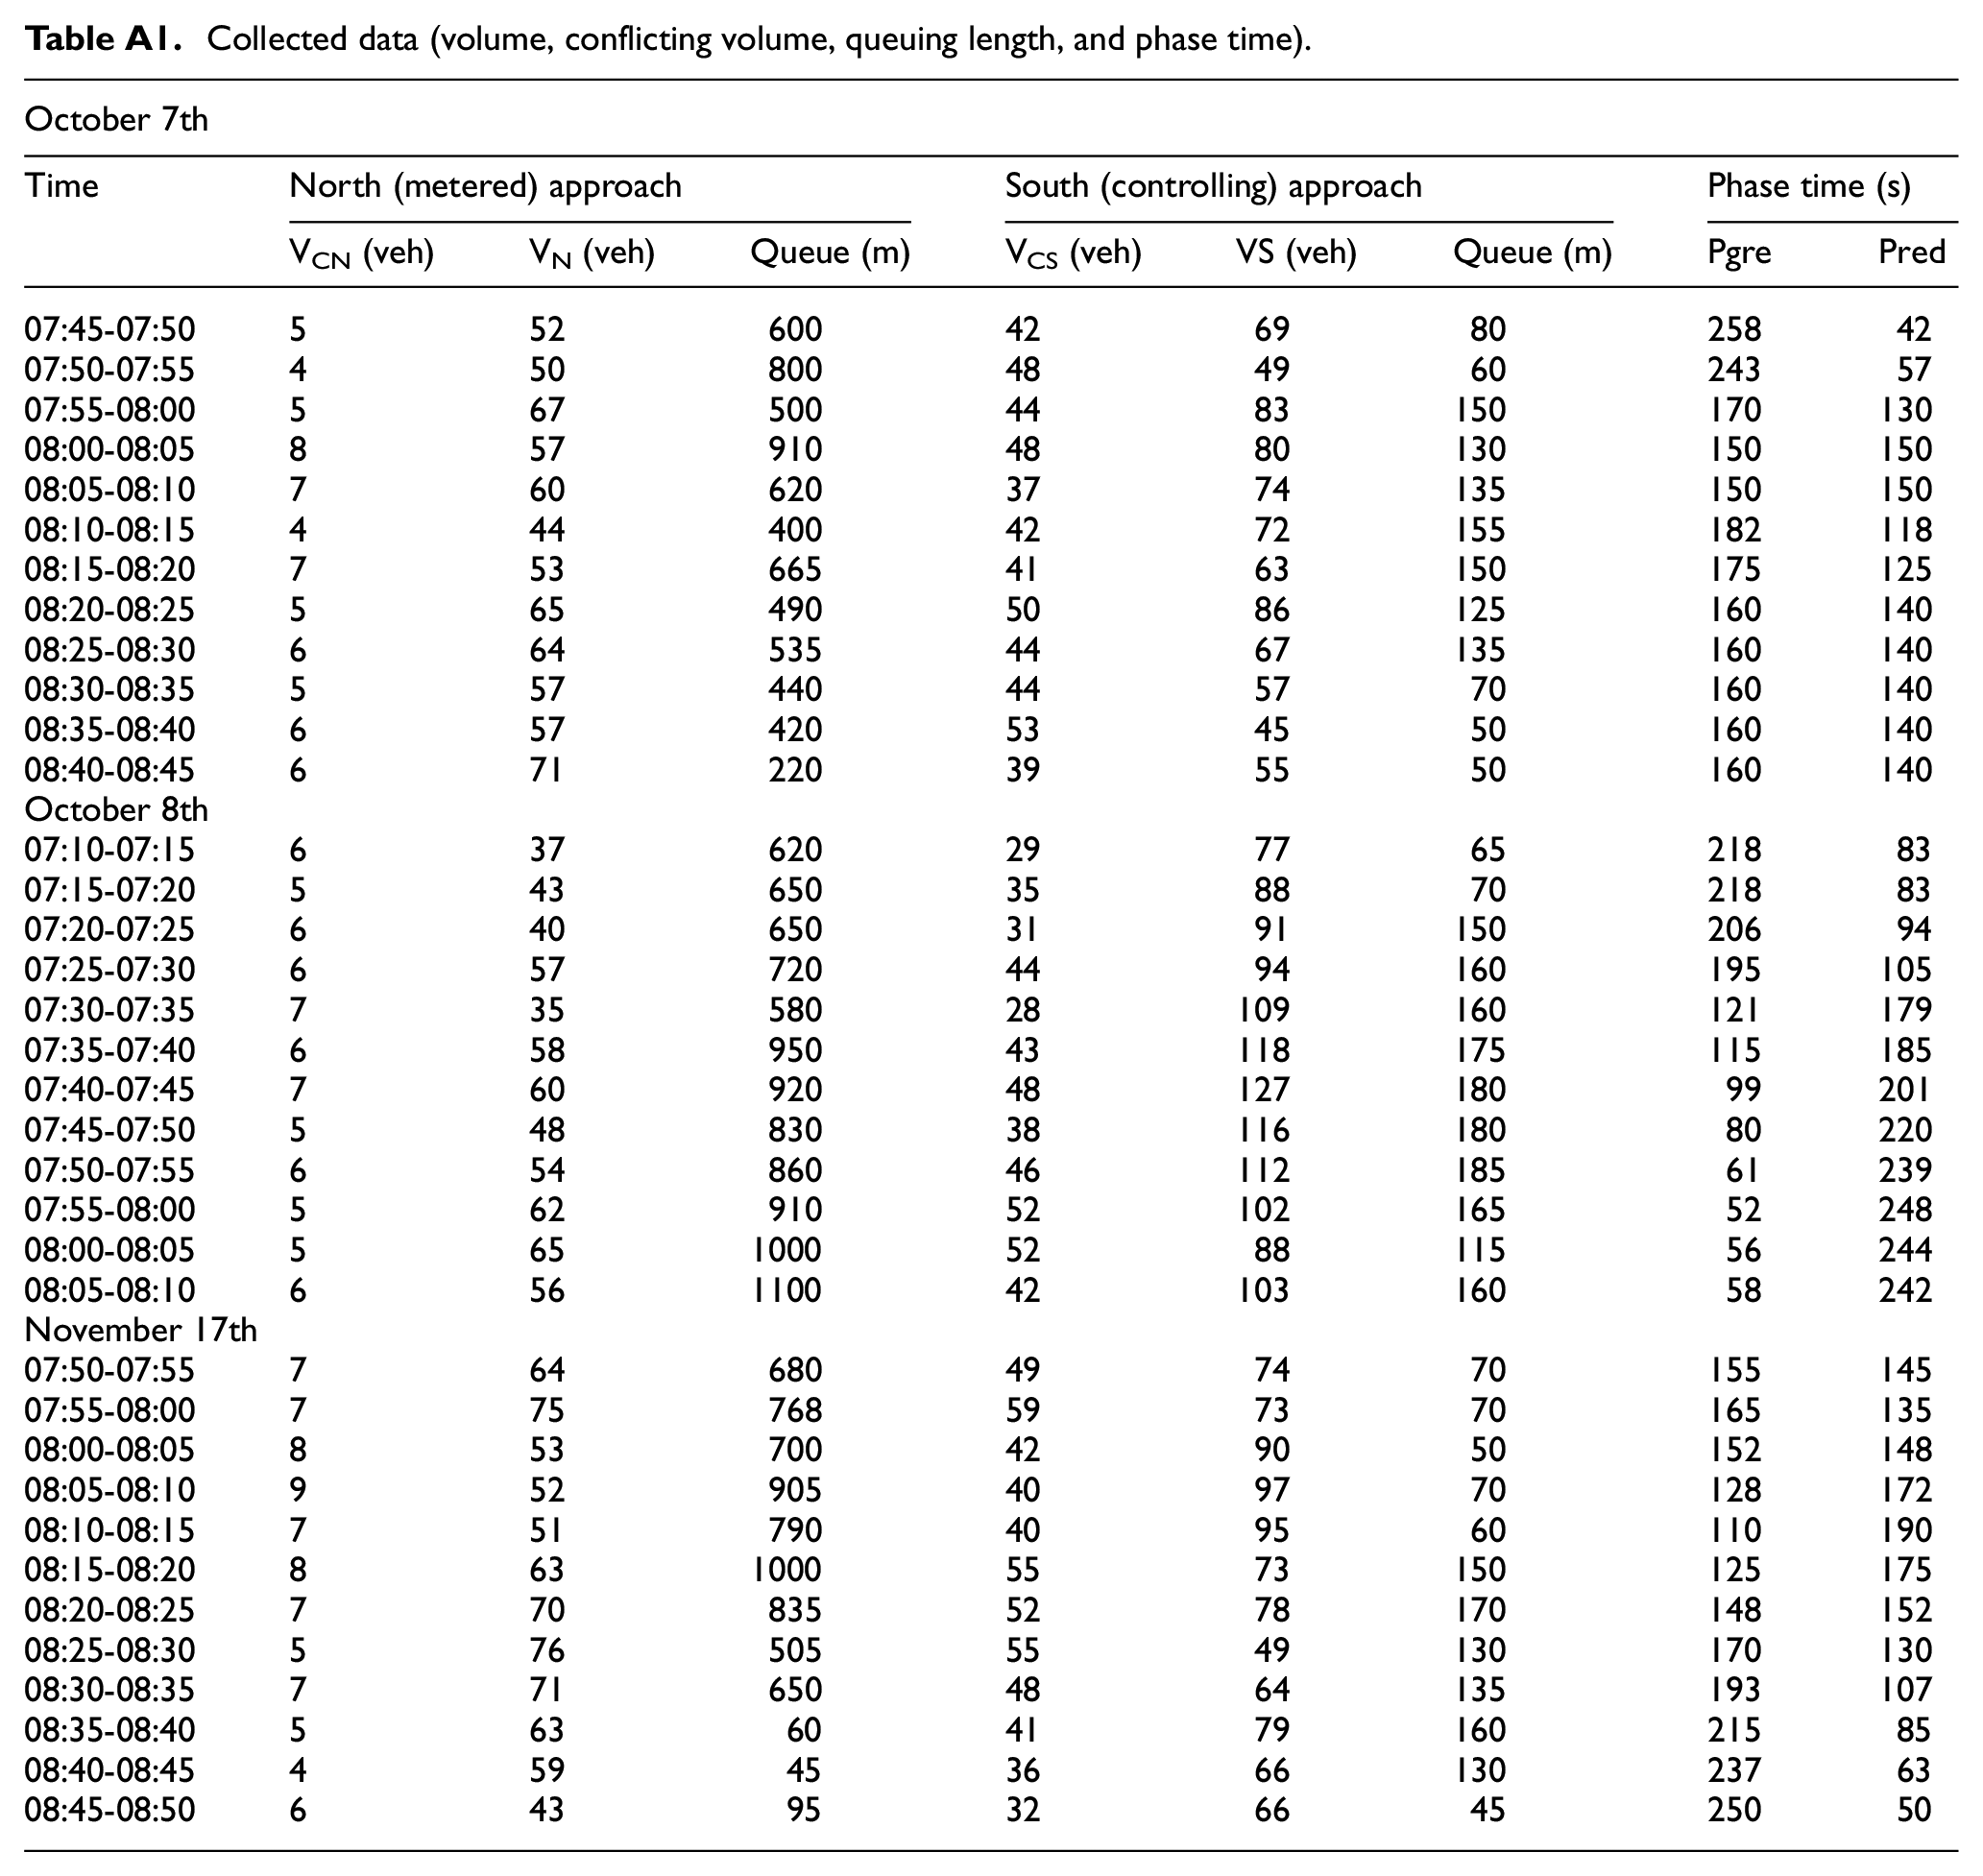
This research selected Old Belair Roundabout in Adelaide, South Australia, for data collection. The roundabout is operated by one detector (115 m prior to the stop line) on the southern approach and traffic signal is located on the northern approach during morning peak hours. One hour during peak period was carried out as below:
– 1st survey: October 7, 2015 between 07:45 and 08:45 (Wednesday)
– 2nd survey: October 8, 2015 between 07:25 and 08:25 (Thursday)
– 3rd survey: November 17, 2015 between 07:50 and 08:50 (Tuesday)
There are six major parameters for calculating queuing length on each approach, and data were collected from three sources: field survey using drones, Sydney Coordinated Adaptive Traffic System (SCATS) and South Australian Department of Planning, Transport and Infrastructure (DPTI) documents, as presented in Table in Annex. For traffic volumes and signal phase time data, SCATS data were used. The SCATS, developed in Australia, is now used internationally as an adaptive traffic signal control. 35 SCATS obtains traffic information from detectors located behind the stop line on each lane. Traffic data information from SCATS includes two types, traffic count data (SCATS VS) and traffic signal operation data (SCATS SM). All these counts are detector based, further, this data is stored in a NEXUS database managed by DPTI at the Barbara Hardy Institute, University of South Australia, and the use of historical data is also available. 36 SCATS VS data can be extracted from a selected period of a minimum of 5 min using Traffic Reporter.
Proposed methods
In a metering roundabouts system model, the typical transfer function can be considered as shown in Figure 2. The optimal detector location and traffic signal of the roundabout model is based on ensuring the minimum queuing length load, while satisfying the dual-objective with minimum queues on controlling and metered approaches. In the roundabout model, the constraint conditions of the objective function are as follows.
(1) The controlling approach objective:

Block diagram of optimize queuing length.
Where,
(2) The metering approach objective:

Where,
(3) The total queuing goals:
Integrating the two objective functions, the objective function used to identify the function of metering roundabouts system can be calculated as:

The optimization process is to extract the optimal parameters Pgre, Pred, NL, Vi, Vci , Vs, and DLC, which makes for minimum queue (see Appendix Table A1). Where, the searching area of the coefficients is set according to the experience, Pgre= 160–258 s, Pred = 43–150 s, VN = 35–71 vehs, VS = 45–116 vehs, VcN = 4–9 vehs, VCS = 28–59 vehs, Vs = 7 m, DLC = 50–250 m, PTC = 4 s, and PTm = 3 s, NLcon = 2 lanes, NLmet = 1 lane.
Modeling, calibration, and validation
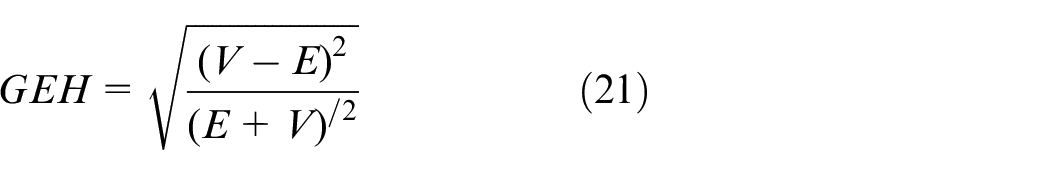
This section presents model verification using AIMSUN7 software to compare the optimum detector locations between cuckoo search/local search algorithm and AIMSUN results. In order for metering roundabout modeling, three procedures including modeling, calibration and validation were implemented. Moreover, in order to fit AIMSUN model output to the field data, the GEH statistical test was performed. The GEH statistic, as shown in equation (21), is a type of chi-squared statistic and used for goodness-of-fit in transport engineering.37–39 If the GEH value is less than five, the model results fit with the observed data well.40,41
where,
Modeling of Old Belair Road metering roundabout
For the layout modeling, the Old Belair Road roundabout was extracted using the function “template create” in AIMSUN 7 as presented in Figure 3. The current detector was installed on the southern approach at a distance of 115 m with a traffic signal used on the northern approach for the peak periods.
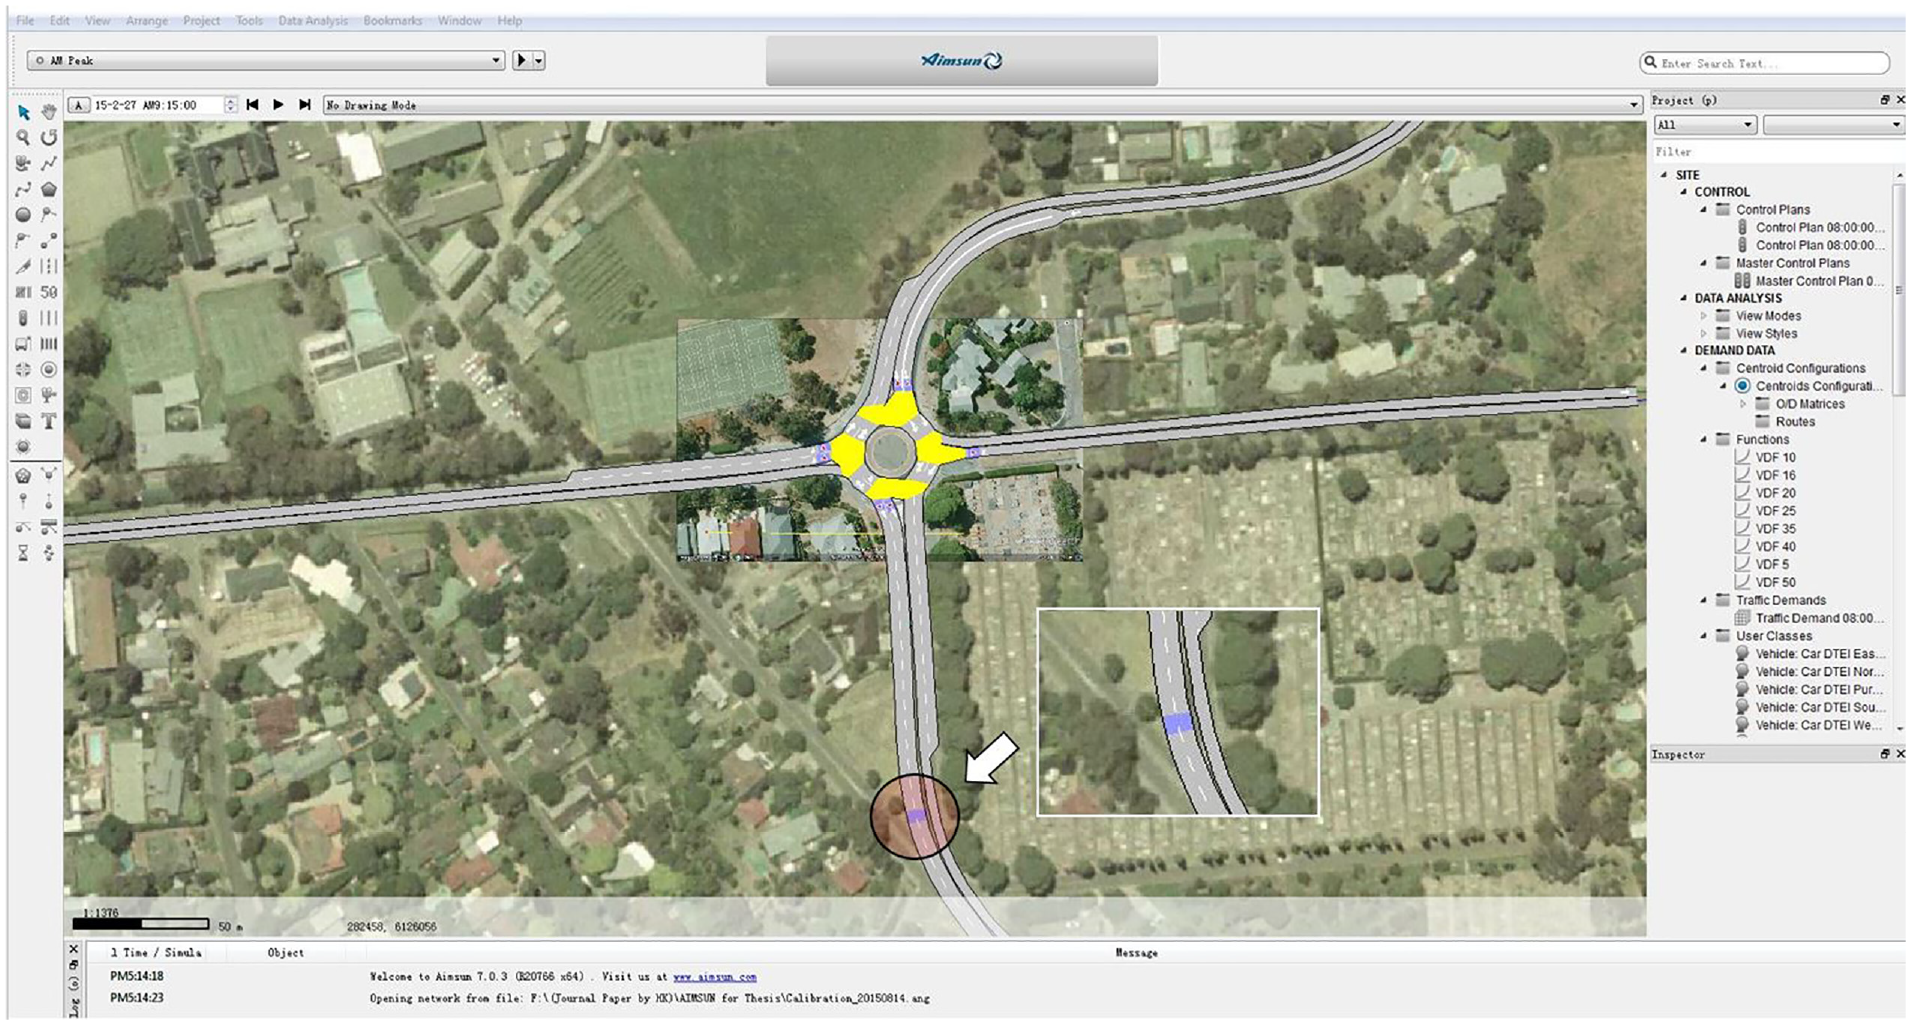
Old Belair Road metering roundabout in AIMSUN 7.
Queuing lengths on each approach were collected using drones in 5-min intervals in this study and traffic volumes in Table in Annex on each approach (Northern approach: VN, Southern approach: VS, Western approach: VW, and Eastern approach: VE) was input for performance evaluation. In order for more precise analysis, 20 min of warm-up and cool-off periods were applied before and after the 1-h modeling durations.
The metering system was set with control strategies under the “traffic management” function in AIMSUN 7, which creates a connection between the installed traffic light and detectors for operating the metering system according to queuing length on the controlling (northern) approach. Start and stop triggers were specified for monitoring the occupancy time in the queue detector zone.
In addition, the occupancy value can be defined as the “percentage of cycle time that the detector detected presence in the last cycle,” as shown in equation (22).
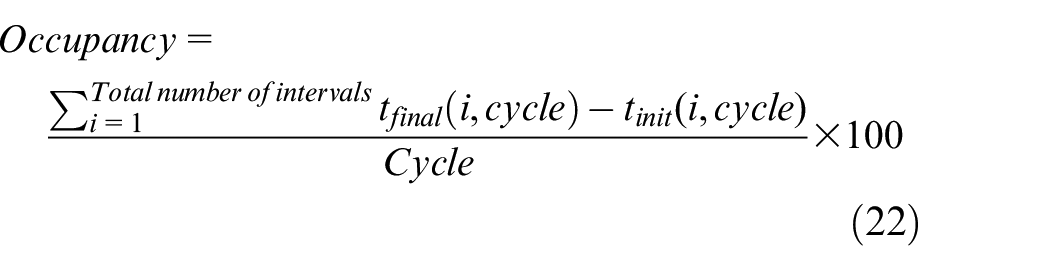
Where,
This study input 55 occupancy value as starting detection and a value of 20 was specified for detection end.
In order to duplicate the real-life signal phase timing and double cycle, two control plans were applied as follows:
– Control Plan 1: Queuing length is shorter than detector location
– Control Plan 2: Queuing length is longer than detector location
Control Plan 1 is for normal conditions which is that vehicle queues did not reach the detector on the controlling approach. In this case, maximum green time (90 s: 45 + 45 s) and minimum green time (42 s: 21 + 21 s) were input. Control Plan 2 is used during metering system activation and if the detector detects the queues on the controlling approach for 3 s, AIMSUN 7 will switch to Control plan 2. When the detector occupancy is cleared, Control plan 1 would be activated automatically.
Model calibration and validation
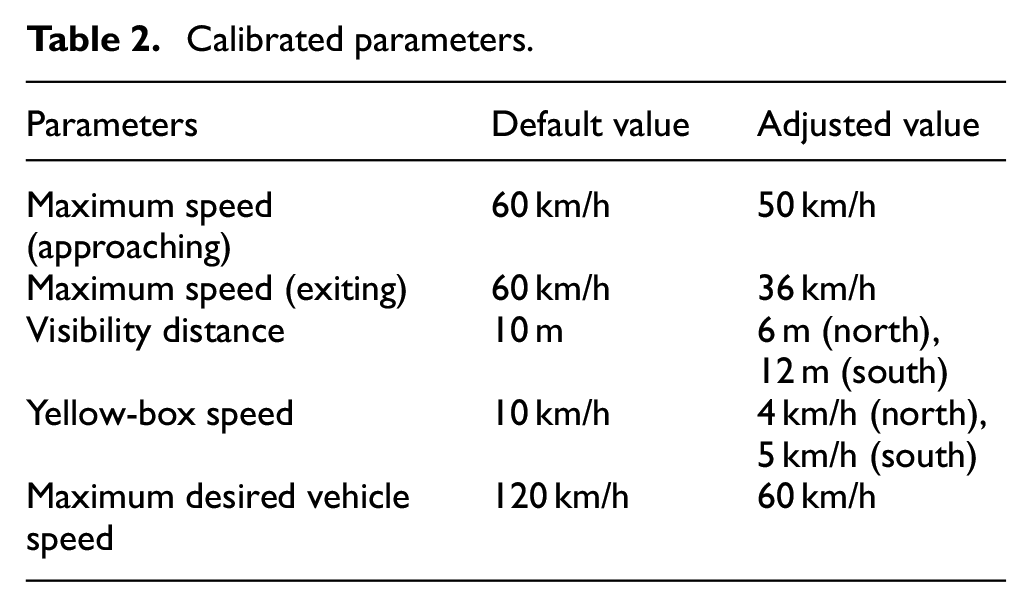
After modeling, parameter calibration is necessary for matching the queuing length from the drone data. This study compared 2 days queuing length data for the model calibration on October 7th and 8th, and November 17th data was compared for the model validation. Maximum speed (approaching approach and exiting approach), visibility distance, yellow-box speed, maximum desired speed (vehicle) were adjusted as shown in Table 2.
Calibrated parameters.
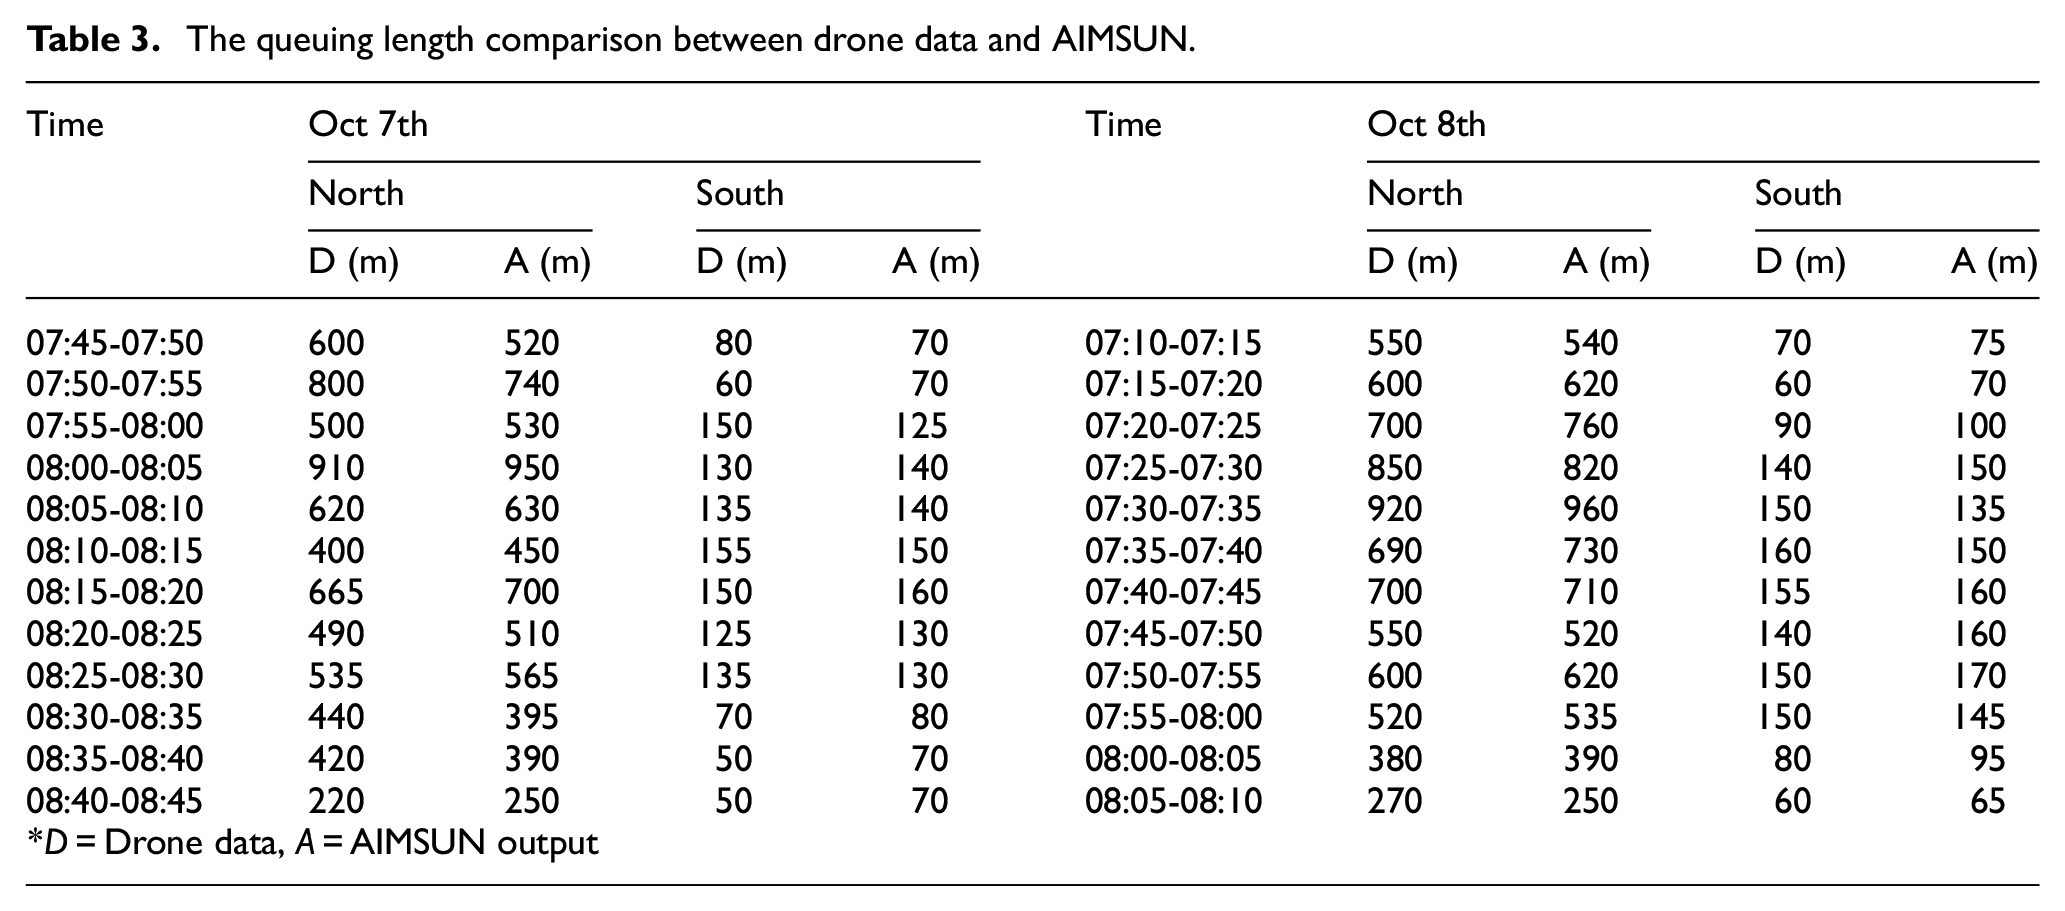
With the adjusted values in AIMSUN, the queuing lengths on the controlling and metered approaches were compared in Table 3. It can show that the queuing length of AIMSUN outputs are closely matched to the field data on the north and south approaches during the peak hour.
The queuing length comparison between drone data and AIMSUN.
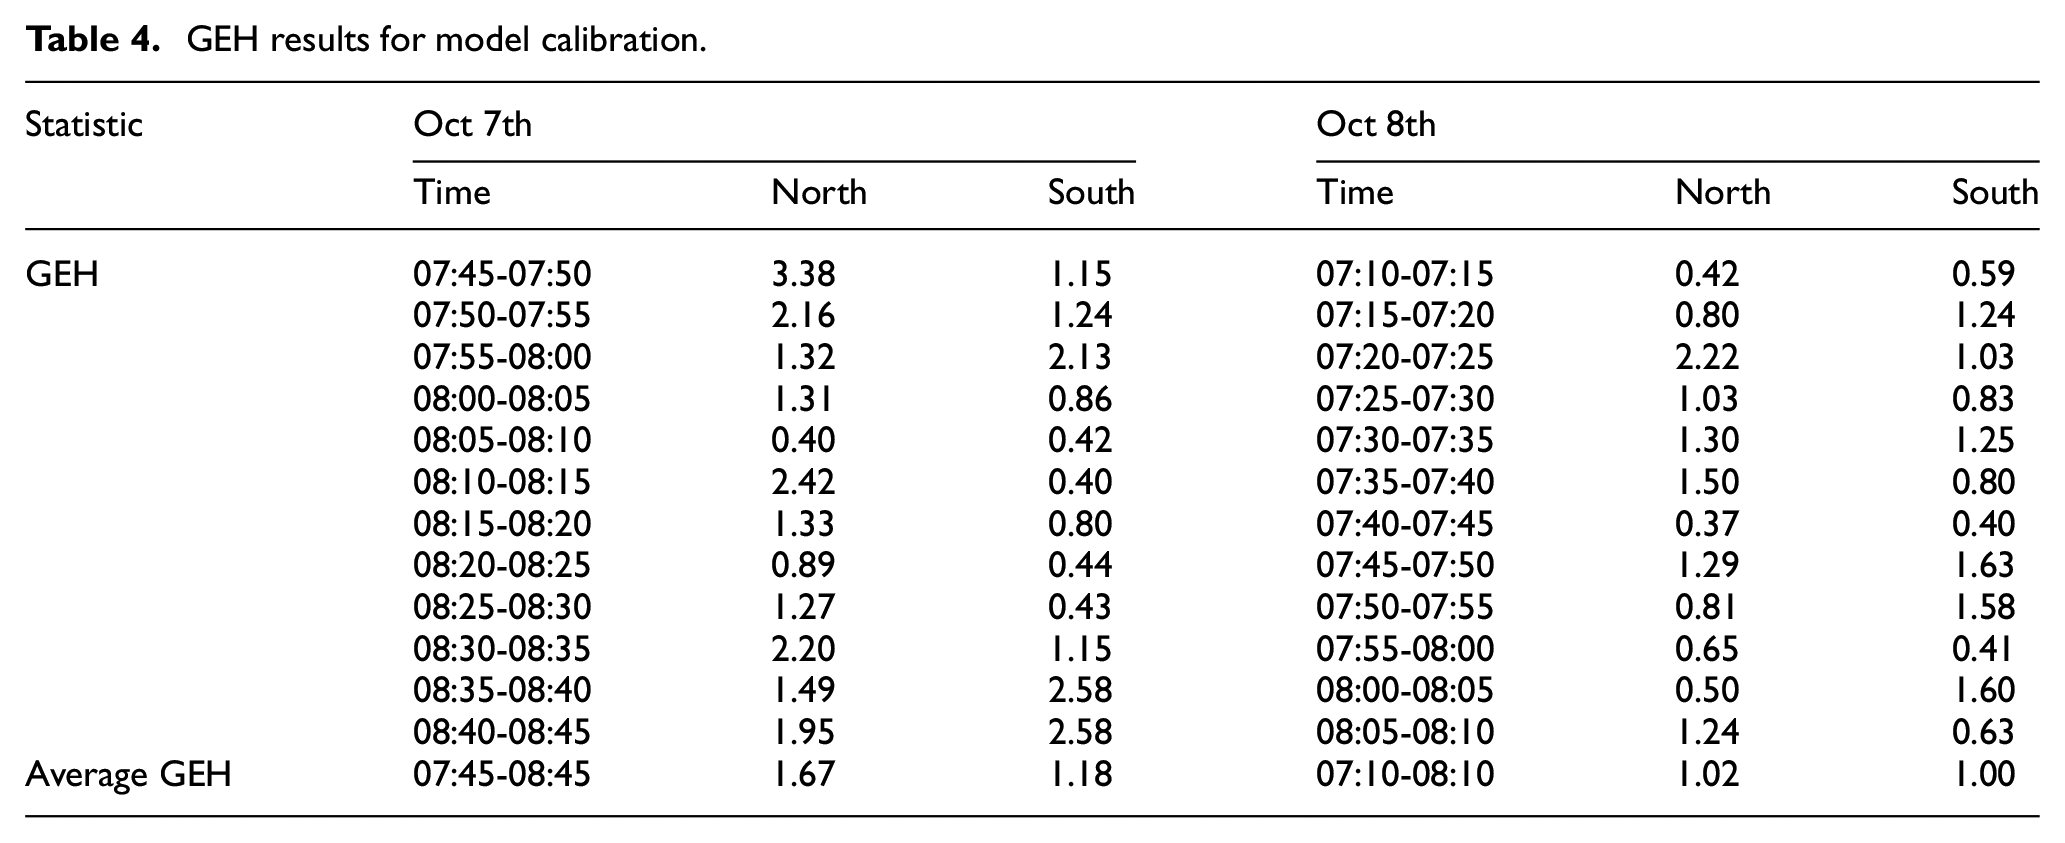
In addition, the GEH test was conducted for model calibration between the drone survey and AIMSUN output. Twodays’ data (October 7th and 8th) were used as presented in Table 4 and the GEH values were less than five in all periods. Thus, it can be seen that AIMSUN results fit with drone data well and model calibration was successfully conducted.
GEH results for model calibration.
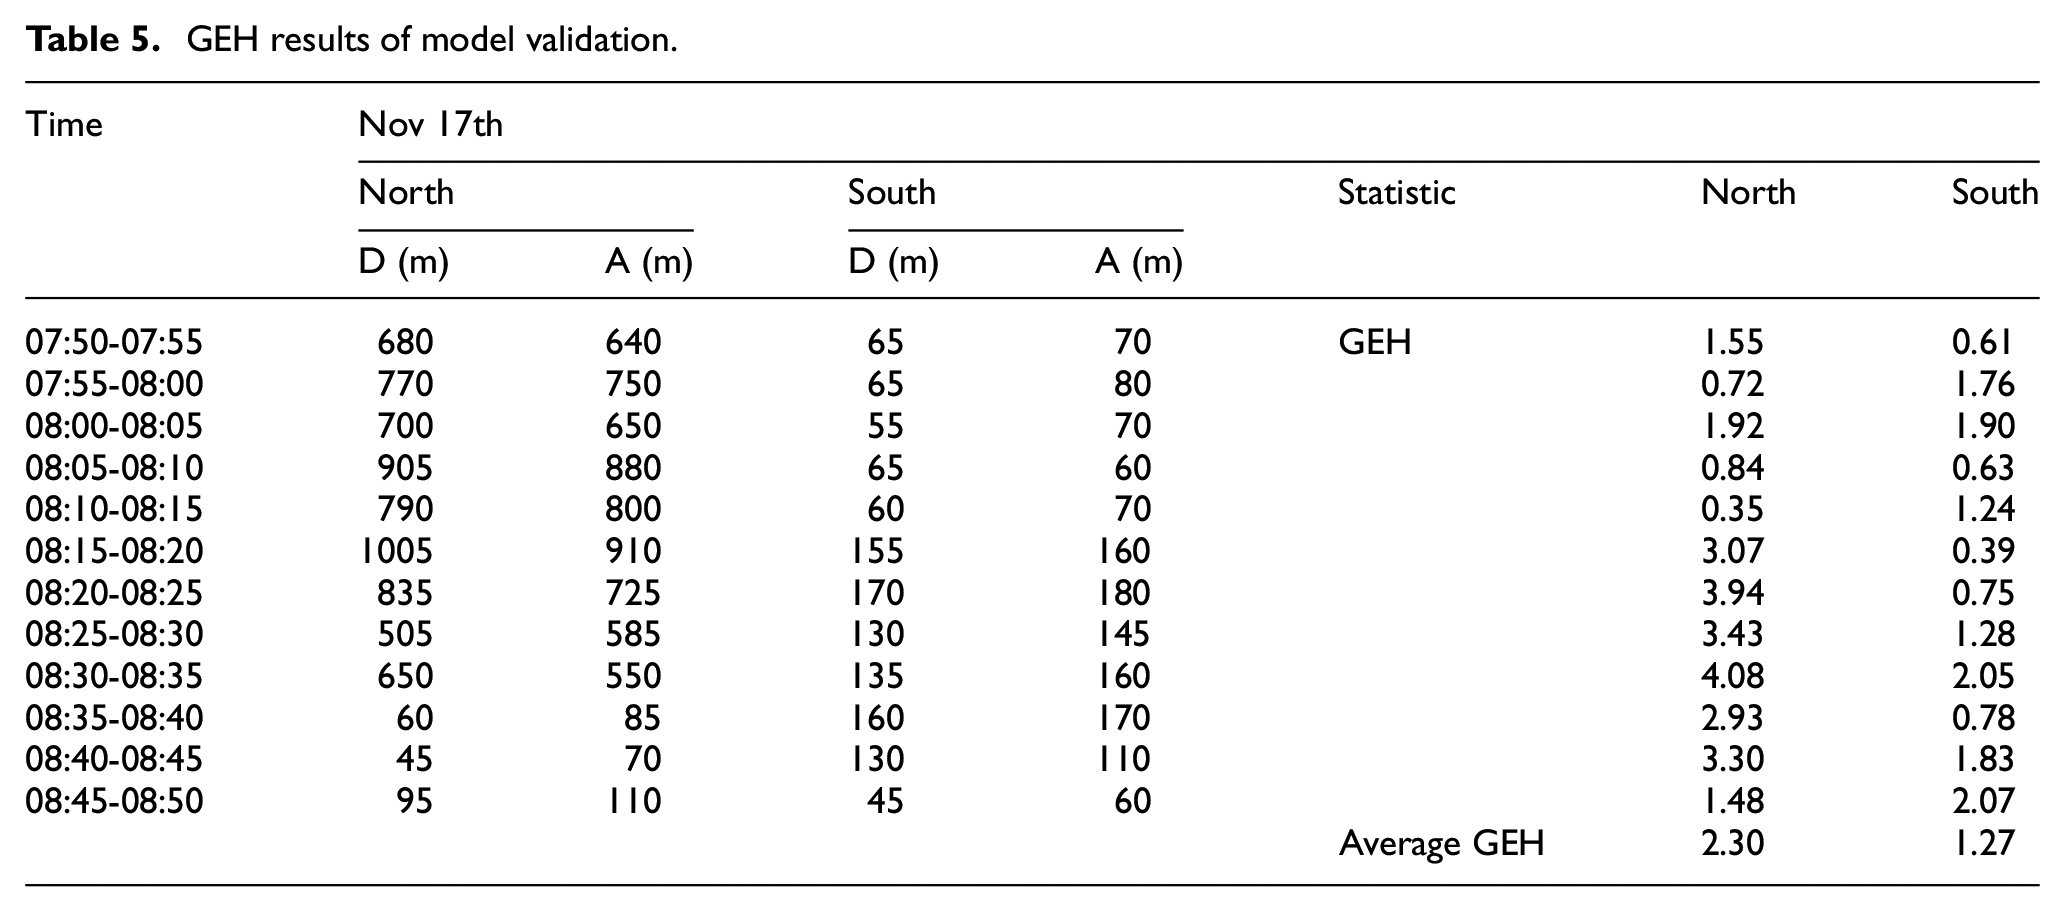
For model validation, November 17th data was used. Table 5 shows the queuing length of drone and AIMSUN on the north and south approaches in 5-min periods, and the GEH values. Similar to model calibration, the queuing length on the north and south approaches match well and the GEH values are all less than five. Thus, it can be seen that the AIMSUN outputs are reliable.
GEH results of model validation.
Result and discussion
Optimal detector location in AIMSUN
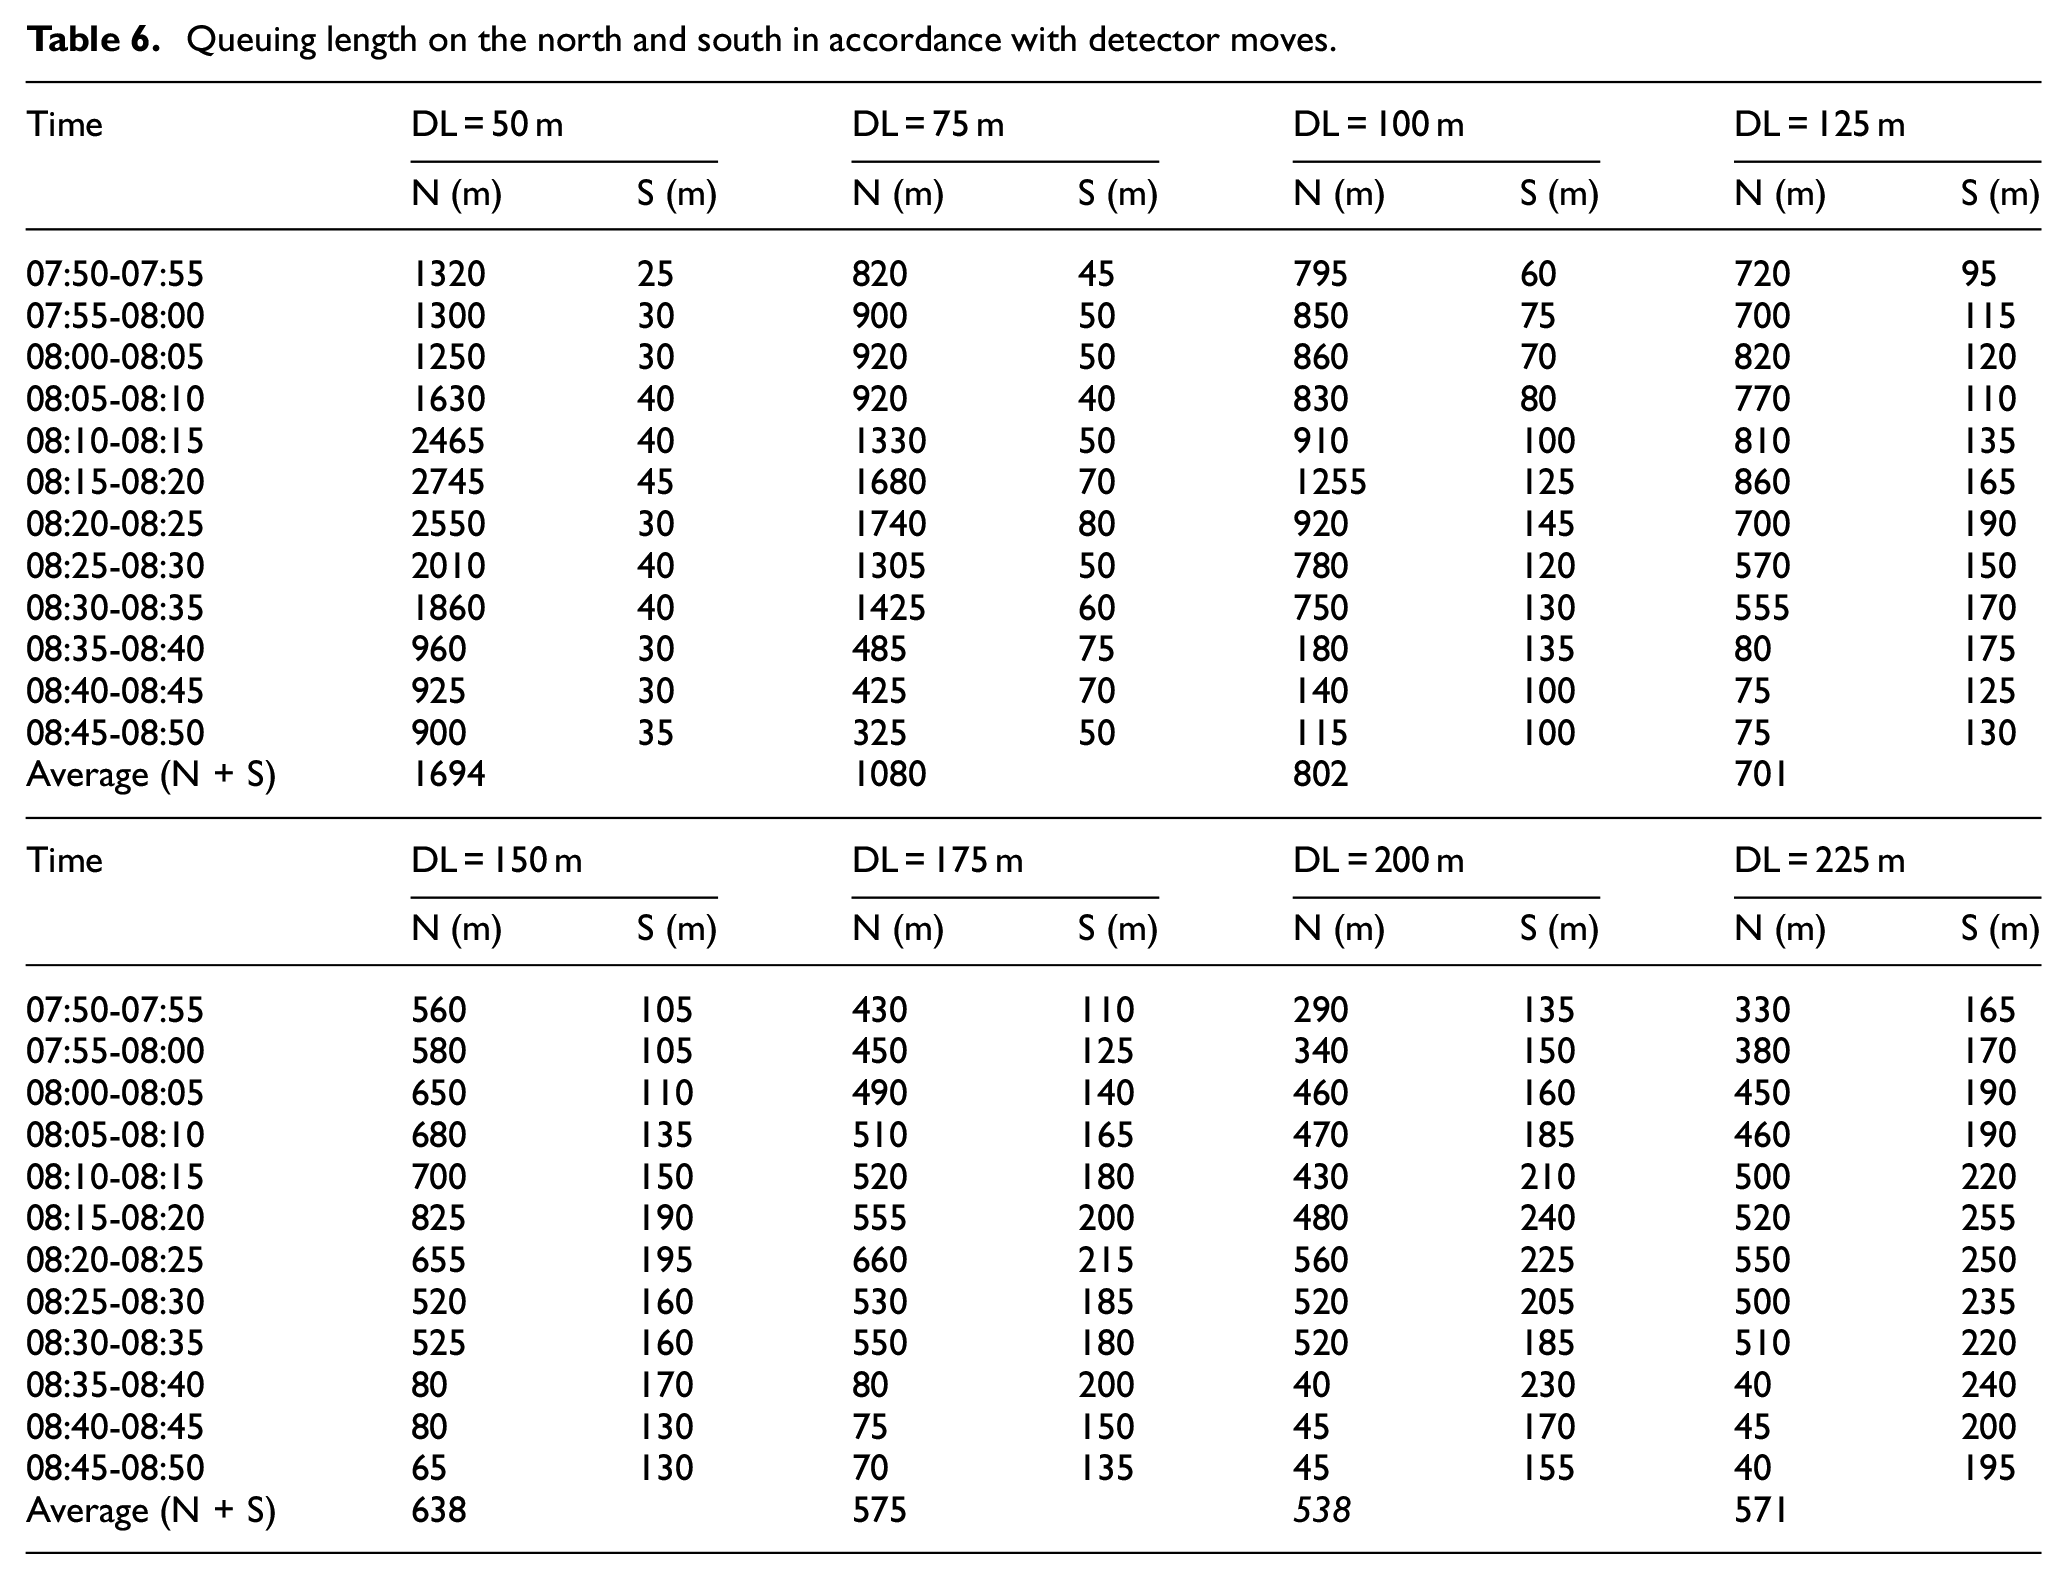
In order to find the optimum detector location on November 17th, the detector on the controlling approach was moved in 25-m increments between 50 and 225 m in AIMSUN. Then, the total queuing length (north + south) from 10 replications for peak hour is presented in Table 6.
Queuing length on the north and south in accordance with detector moves.
The optimum detector location reflects the minimum queuing length considering both (controlling and metered) approaches. Figure 4 illustrates the queuing length results in AIMSUN based on detector location changes.
Queuing length (North + South).
When the detector location is at 50 m, queuing length of two approaches was at the maximum of 1694 m for 1 h. Thus, the detector location of 50 m is the worst distance. When detector was located between 50 and 100 m from the stop line the queuing length reduced significantly. Detector location at 100–200 m decreased the queuing length slightly. When the detector location is at 200 m, the sum of both approaches was on average 538 m. In this case, queuing length can be decreased by around 1156 m for peak hour.
Best detector location in cuckoo search/local search algorithm
In order to verify the proposed optimization algorithm to determine the detector location in accordance with arrival volume and conflicting volume, the two signal timing schemes are obtained by using equation (3), which are respectively recorded as optimize equations (1) and (2). Furthermore, the tuning parameters for the CS/LS proposed algorithm, Levy exponent (β) = 0.25, number of iterations = 50, number of nests = 10 were set in order to get accurate results.
Table 7 shows that each iteration indicates different queuing lengths on the controlling and metered approach in accordance with a relationship between detector locations and phase green time. Total queuing length (controlling + metered approaches) looks steady after 40th iteration, which means 210 m of detector location is the best detector location.
Effect of detector location and signal time.
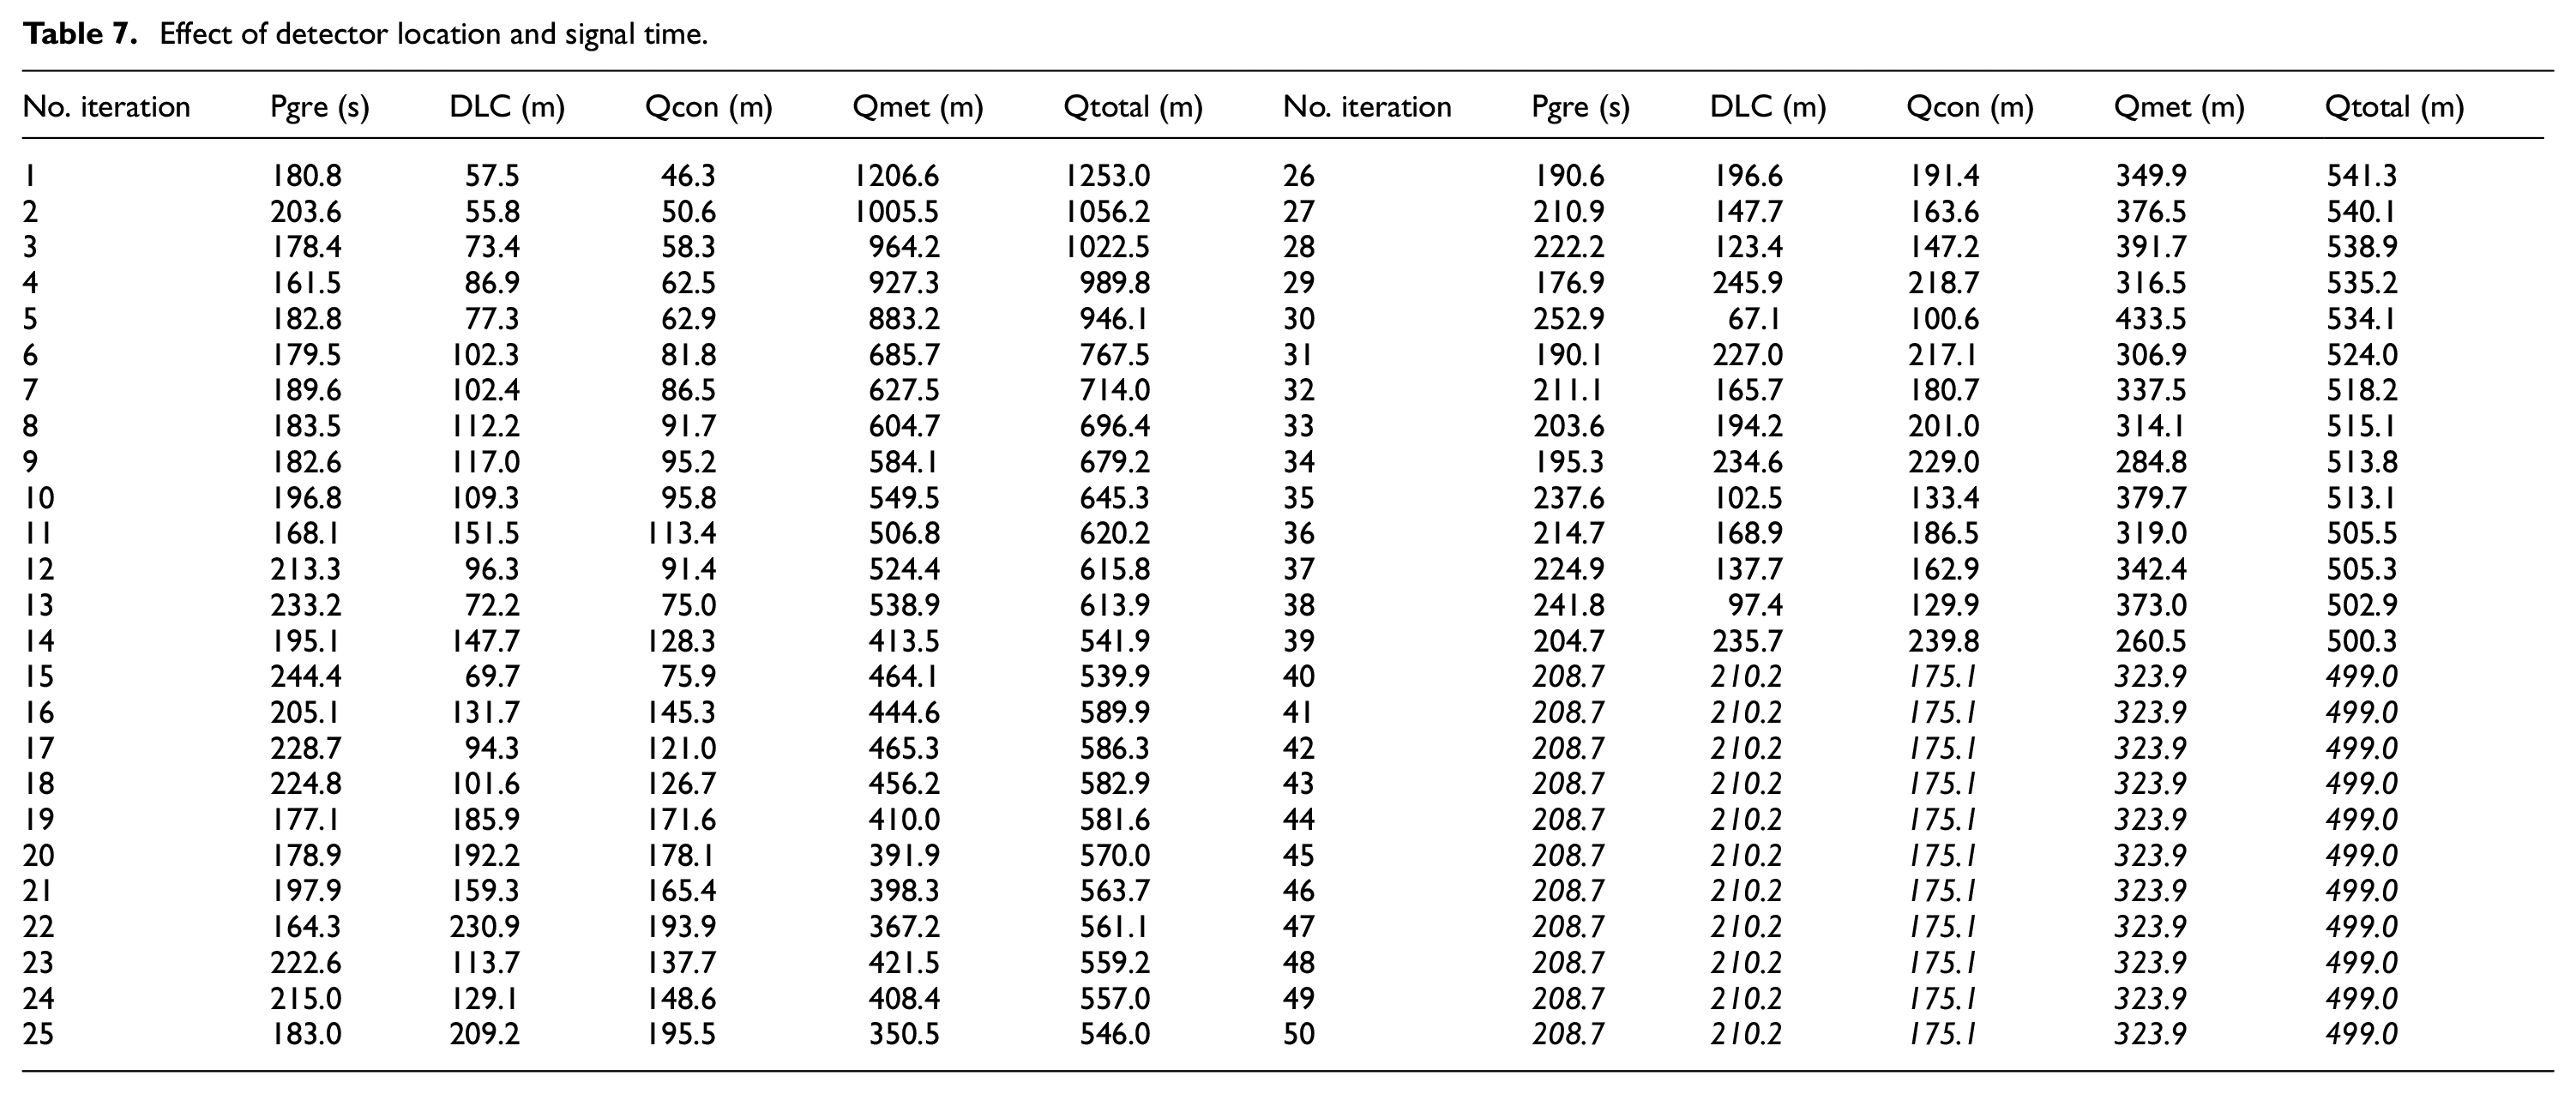
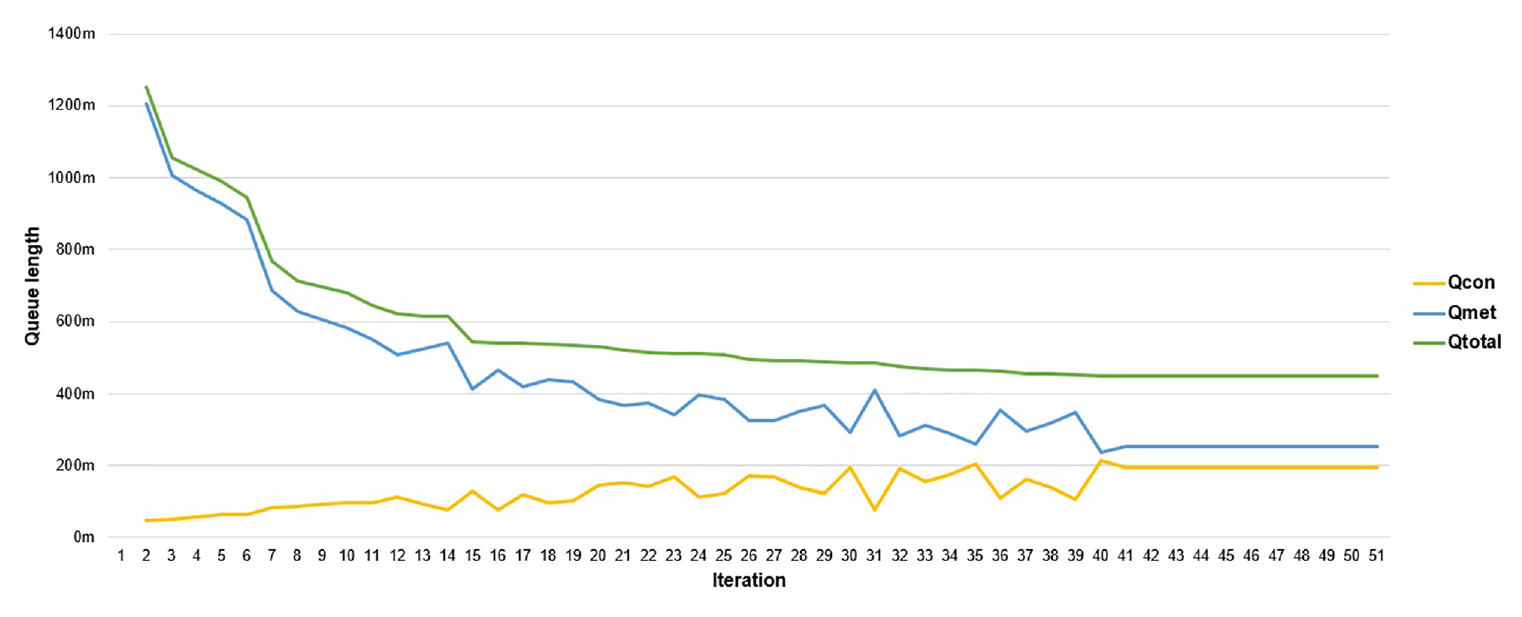
Figure 5 shows the total queuing length for optimization arrived at for different detector locations and signal times. Optimizations from equations (1) and (2) are calculated based on collected traffic flow. From the 1st to 13th iteration, the queuing length on metered approach is decreased dramatically by 55.3% (from 1206 to 539 m). The queuing length on the controlling approach, however, is slightly increased by 30 m. Thus, the total queuing (controlling + metered) length is 613.9 m for 1 h (51% decrease). On the other hand, there is not much difference between the 14th and 40th iterations and the gap in the total queuing length is only 42.9 m an hour. It can be seen that as the iteration is repeated, the queuing length on the controlling approach is increased while the queuing length on the metered approach is decreased. The total queuing length cannot be changed after the 40th iteration by CS/LS algorithm, which means detector location at 210 m is the optimal queuing length on the controlling and metered approaches.
Optimizing the location and green time signal of total queuing length.
Figure 6 illustrates a relationship between detector location and signal green time with iteration increases in CS/LS algorithm (left-side y axis is detector location and right-side y axis is signal green time). Each iteration finds the best phase green time to minimize the queuing length on the controlling and metered approaches. The 30th iteration indicates that the maximum green time, detector location and total queuing length are 252 s, 67 m and 534 m respectively. In addition, 209 s of phase green time, 210 m of detector location indicate the optimal roundabout operation.
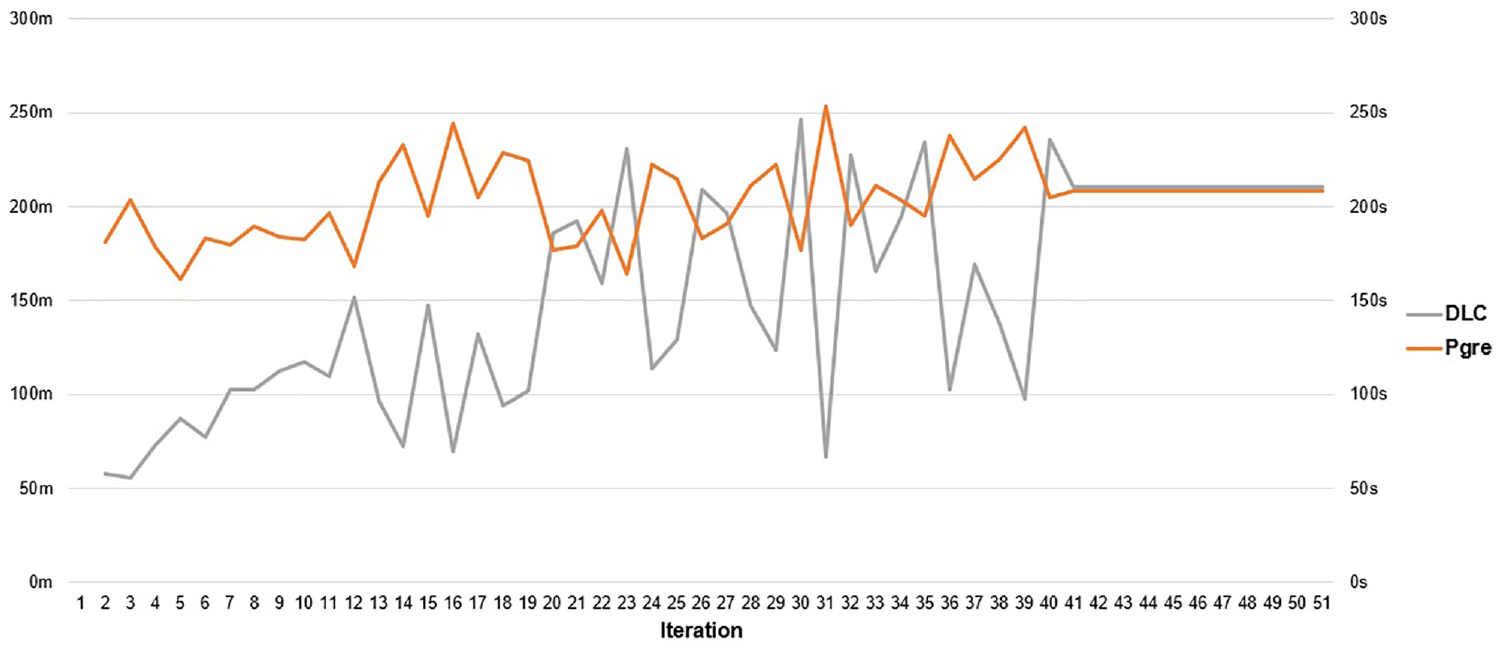
Relationship between detector location and signal green time.
Comparisons
The optimum detector under a variety of traffic conditions at a metering roundabout is calculated and simulated by CS/LS algorithm and AIMSUN software based on November 17th data. Table 8 shows that the result of the proposed algorithm obtained by adopting the best detector location makes the total queuing length decrease by 6.8% compared to AIMSUN. The best detector location attained from the CS/LS algorithm is 210 m and the total queuing length is 499 m, whereas, AIMSUN simulates that 200 m of detector location can minimize the total queuing length by 538 m. In addition, phase green time, average queuing length on the controlling approach, average queuing length on the metered approach match 90.3%, 91.7%, and 96.1% respectively between the two models.
Comparison of proposed method.
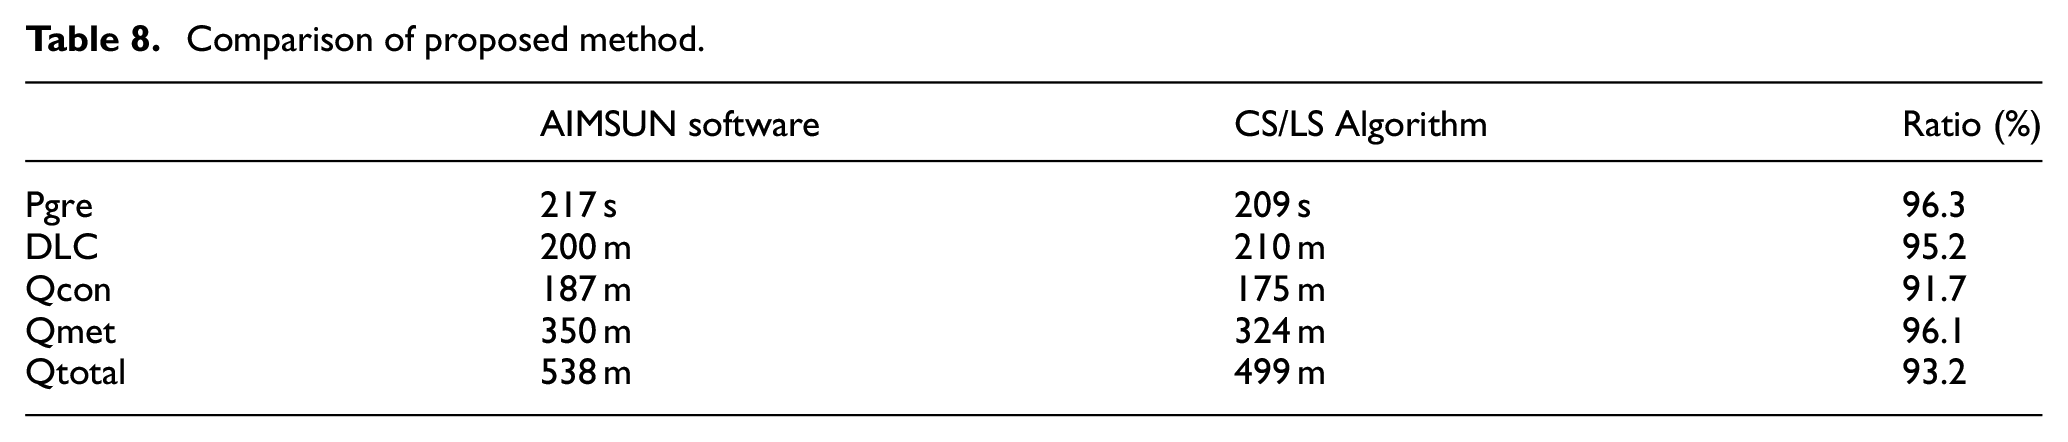
The research result indicates that there is not much difference in detector location between CS/LS algorithm and AIMSUN software.
Conclusion
Due to the increasing number of roundabouts in urban areas, there has been growing interest in their operational performance evaluation, in particular in the case of unbalanced traffic flow conditions. This interest has motivated studies on metering roundabouts. With no clear guidelines to determine detector location, research to date has used software to quantify metering roundabout performance.
This paper, therefore, attempts to investigate the optimal detector location at the Old Belair Road metering roundabout using CS/LS algorithm in order to minimize the queuing length not only on the controlling, but also on the metered approaches. The outputs were compared with the microscopic simulation model AIMSUN as algorithm verification. The CS/LS algorithm indicated that detector location at 210 m optimizes the queuing length on the controlling approach (175 m) and metered approach (324 m). Moreover, 209 s of average phase green time was calculated for the 1-h morning peak. It is quite similar to the AIMSUN model output and the differences are just 10 m in detector location and 8 s in phase green time. Thus, it can be expected that the CS/LS algorithm model used in this paper would save time for determining the best detector location at metering roundabouts. Furthermore, the proposed model would serve as a platform for studying the relationship between detector locations and signal phase time at metering roundabouts.
Some limitations in the research are recognized, however, and could be enhanced by more comprehensive research. First, a short lane was considered as one lane and the constant “1” was applied to the queuing models, but a specific constant needs to be defined in accordance with the length of the short lane. Second, in order for a more accurate model output, more varied conditions need to be considered such, as different geometry and traffic volume. Lastly, in order to provide proper detector locations and signal phase durations, more intelligent methods need to be compared.
Footnotes
Appendix
Collected data (volume, conflicting volume, queuing length, and phase time).
| October 7th | ||||||||
|---|---|---|---|---|---|---|---|---|
| Time | North (metered) approach | South (controlling) approach | Phase time (s) | |||||
| VCN (veh) | VN (veh) | Queue (m) | VCS (veh) | VS (veh) | Queue (m) | Pgre | Pred | |
| 07:45-07:50 | 5 | 52 | 600 | 42 | 69 | 80 | 258 | 42 |
| 07:50-07:55 | 4 | 50 | 800 | 48 | 49 | 60 | 243 | 57 |
| 07:55-08:00 | 5 | 67 | 500 | 44 | 83 | 150 | 170 | 130 |
| 08:00-08:05 | 8 | 57 | 910 | 48 | 80 | 130 | 150 | 150 |
| 08:05-08:10 | 7 | 60 | 620 | 37 | 74 | 135 | 150 | 150 |
| 08:10-08:15 | 4 | 44 | 400 | 42 | 72 | 155 | 182 | 118 |
| 08:15-08:20 | 7 | 53 | 665 | 41 | 63 | 150 | 175 | 125 |
| 08:20-08:25 | 5 | 65 | 490 | 50 | 86 | 125 | 160 | 140 |
| 08:25-08:30 | 6 | 64 | 535 | 44 | 67 | 135 | 160 | 140 |
| 08:30-08:35 | 5 | 57 | 440 | 44 | 57 | 70 | 160 | 140 |
| 08:35-08:40 | 6 | 57 | 420 | 53 | 45 | 50 | 160 | 140 |
| 08:40-08:45 | 6 | 71 | 220 | 39 | 55 | 50 | 160 | 140 |
| October 8th | ||||||||
| 07:10-07:15 | 6 | 37 | 620 | 29 | 77 | 65 | 218 | 83 |
| 07:15-07:20 | 5 | 43 | 650 | 35 | 88 | 70 | 218 | 83 |
| 07:20-07:25 | 6 | 40 | 650 | 31 | 91 | 150 | 206 | 94 |
| 07:25-07:30 | 6 | 57 | 720 | 44 | 94 | 160 | 195 | 105 |
| 07:30-07:35 | 7 | 35 | 580 | 28 | 109 | 160 | 121 | 179 |
| 07:35-07:40 | 6 | 58 | 950 | 43 | 118 | 175 | 115 | 185 |
| 07:40-07:45 | 7 | 60 | 920 | 48 | 127 | 180 | 99 | 201 |
| 07:45-07:50 | 5 | 48 | 830 | 38 | 116 | 180 | 80 | 220 |
| 07:50-07:55 | 6 | 54 | 860 | 46 | 112 | 185 | 61 | 239 |
| 07:55-08:00 | 5 | 62 | 910 | 52 | 102 | 165 | 52 | 248 |
| 08:00-08:05 | 5 | 65 | 1000 | 52 | 88 | 115 | 56 | 244 |
| 08:05-08:10 | 6 | 56 | 1100 | 42 | 103 | 160 | 58 | 242 |
| November 17th | ||||||||
| 07:50-07:55 | 7 | 64 | 680 | 49 | 74 | 70 | 155 | 145 |
| 07:55-08:00 | 7 | 75 | 768 | 59 | 73 | 70 | 165 | 135 |
| 08:00-08:05 | 8 | 53 | 700 | 42 | 90 | 50 | 152 | 148 |
| 08:05-08:10 | 9 | 52 | 905 | 40 | 97 | 70 | 128 | 172 |
| 08:10-08:15 | 7 | 51 | 790 | 40 | 95 | 60 | 110 | 190 |
| 08:15-08:20 | 8 | 63 | 1000 | 55 | 73 | 150 | 125 | 175 |
| 08:20-08:25 | 7 | 70 | 835 | 52 | 78 | 170 | 148 | 152 |
| 08:25-08:30 | 5 | 76 | 505 | 55 | 49 | 130 | 170 | 130 |
| 08:30-08:35 | 7 | 71 | 650 | 48 | 64 | 135 | 193 | 107 |
| 08:35-08:40 | 5 | 63 | 60 | 41 | 79 | 160 | 215 | 85 |
| 08:40-08:45 | 4 | 59 | 45 | 36 | 66 | 130 | 237 | 63 |
| 08:45-08:50 | 6 | 43 | 95 | 32 | 66 | 45 | 250 | 50 |
Declaration of conflicting interests
The author(s) declared no potential conflicts of interest with respect to the research, authorship, and/or publication of this article.
Funding
The author(s) received no financial support for the research, authorship, and/or publication of this article.