
Abstract
A metering roundabout where traffic is controlled by signals where phase times are influenced by queue detector occupancy may be the solution to reduce queue lengths under unbalanced traffic flows. In the past decades, a number of studies have attempted to evaluate the effectiveness of metering roundabout, especially on the dominant approach. Little studies, however, have been directed on prediction of the queuing lengths, which is essential to determine the detector locations. This paper introduces a queue length estimation model using adaptive neuro fuzzy inference system for unbalanced roundabout traffic flows. The adaptive neuro fuzzy inference system model consists of an input layer representing four parameters as arrival volumes, conflicting volumes, phase green and red time, and output layer with four neuron representing queuing length. MATLAB software and additional statistical tests were used as the tool to develop the models for the data. In order to conduct credible model validations, model output data were compared against the observed data collected using drones. The results from the analysis demonstrated that adaptive neuro fuzzy inference system model is able to estimate the queuing length at metering roundabouts. Thus, it is expected that the adaptive neuro fuzzy inference system model will help practitioners in determining optimal detector locations and will be a foundation research for roundabouts with signals.
Introduction
In regard to a metering roundabout, the determination of the detector location is very important, because queuing lengths on each approach can be affected by when the signal should be actuated and the signal’s green/red time, which is determined by when the queue hits the detector on the controlling approach.1,2
With respect to the metering roundabout, a number of studies have been conducted; however, majority of the studies concentrated on performance evaluations, particularly the analysis of the dominant approach. Carter and Pratt 3 introduce a technical review of all applications and aspects of vehicles automatic detection system. According to past research, unbalanced traffic flow conditions can exacerbate the roundabout operational performance. In such cases, the metering roundabout can be a solution leading to a reduction in vehicle delay times. In addition, many studies suggested that vehicle movements on each approach operate individually as a T-junction. 4 Krogscheepers and Roebuck 5 present a definition with regard to unbalanced conditions with the precondition that entering vehicles from a specific approach may influence the vehicle movements on other approaches.
There has been relatively few research investigating queuing length estimation, which is an important parameter affecting the optimal detector locations at the roundabout. Under unbalanced traffic flow conditions, roundabouts are likely to experience long queuing problems.6–8 The other studies on unbalanced traffic conditions were conducted and the unbalanced flow was defined through the origin–destination factor.9,10 In addition, the origin–destination factor may improve the estimation of roundabout capacity, in particular, with the unbalanced traffic conditions.9,10
The Flannery et al. 11 study performed on queuing estimation at single-lane roundabouts derived a relationship between entering traffic and circulating traffic considering the distribution of time gaps applied into an M/G2/1 queuing model. However, the research did not deal with the queuing length depending on the phase time changes, and the developed model was only for a normal signal roundabout which operational principle is obviously different from a metering roundabout. Fortuijn 12 investigated the detector locations based on a four-leg turbo roundabout with two detectors and one traffic signal based on Pollaczek-Khinchine’s M/M/1 waiting time formula. The author found a linear relationship between entry capacity and the mean queuing length that the precise queuing length estimation is not feasible and an advanced detection system may be required, such as an automatic traffic recorder with three different detectors installed for detecting changeable queues.
Recently, Fuzzy logic and neural networks both play important roles in the modeling of intelligent control in complex systems.13–15 In fact, fuzzy logic is widely used in combination with neural networks to solve difficult problems in classification, identification and system control.16–19 Eric and Finst proposed intelligent transportation system technologies for traffic simulation and management including all methods and components. The intelligent agent system has the ability to respond to any incident urban traffic. 20 However, there are no clear guidelines for finding the optimal detector locations due to the difficulty of definition between the detector locations and phase time changes, in dynamic situations.
Therefore, this study investigates the operation of metering roundabout and then predicts the queuing length on each approach using adaptive neuro fuzzy inference system (ANFIS). To achieve this purpose, data collected by drones are used in the process of model calibration and validation. Furthermore, root-square (R2) and root mean square error (RMSE) tests will be conducted to assess the fitness of the ANFIS model. Finally, the vehicle queuing lengths were calculated from the stop line.
The rest of the paper organized as follows: the “Background” section introduced all related background including the concept of metering roundabout and calibration model using both root-square and RMSE tests. The “Proposed model” section focused on the detail of roundabout model and proposed ANFIS model. The “Data collection using drones” section clearly mentioned the real data collection using drones at Old Belair Road roundabout in Adelaide. Finally, the proposed model structure was optimized and validated using R2 and RMSE tests methods.
Background
Concept of metering roundabout
The concept of metering roundabout is illustrated in Figure 1. In this roundabout, two approaches are configured differently from traditional ones: the first is the controlling approach (dominant) where the queue detectors are positioned with a proper setback distance, and the second is the metered approach (sub-dominant) where a traffic signal is installed near the stop line. The mechanism of the metering roundabout is when queue reaches the detector, the traffic signal changes to red on the metered approach. Vehicles on the controlling approach, then, have sufficient time to enter the roundabout. In terms of dispersing the queue length on the controlling approach, there is an inverse relationship between the controlling and metered approaches, as the vehicles from the controlling approach can enter when the signal is red on metered approach.
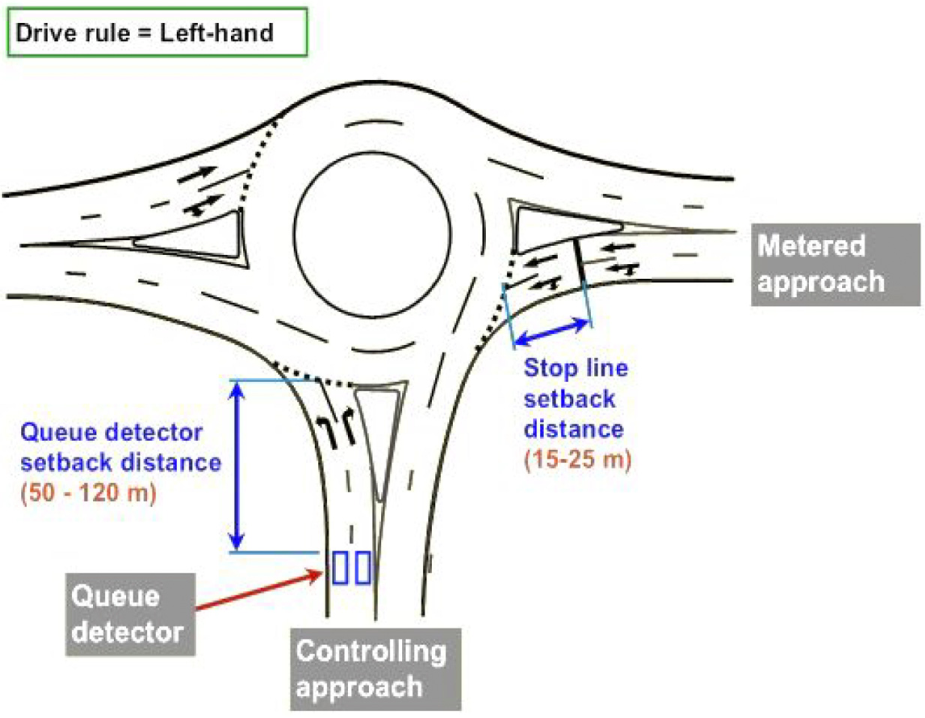
Concept of metering roundabout. 8
When vehicles enter from a dominant approach, they may have fewer opportunities to utilize gaps between circulating vehicles, resulting in longer queues and delays on the busiest approach, and subsequently the entire roundabout carries the expense of the approaches having lower traffic volumes. Thus, a signalized roundabout with traffic signals managing entering vehicle movements from the other approaches is becoming a popular alternative, called metering roundabout. According to previous studies,21–23 a signalized roundabout can be grouped into three categories: traffic flow control, operation time and number of approaches controlled as described in Table 1.
Categories of signalized roundabout.
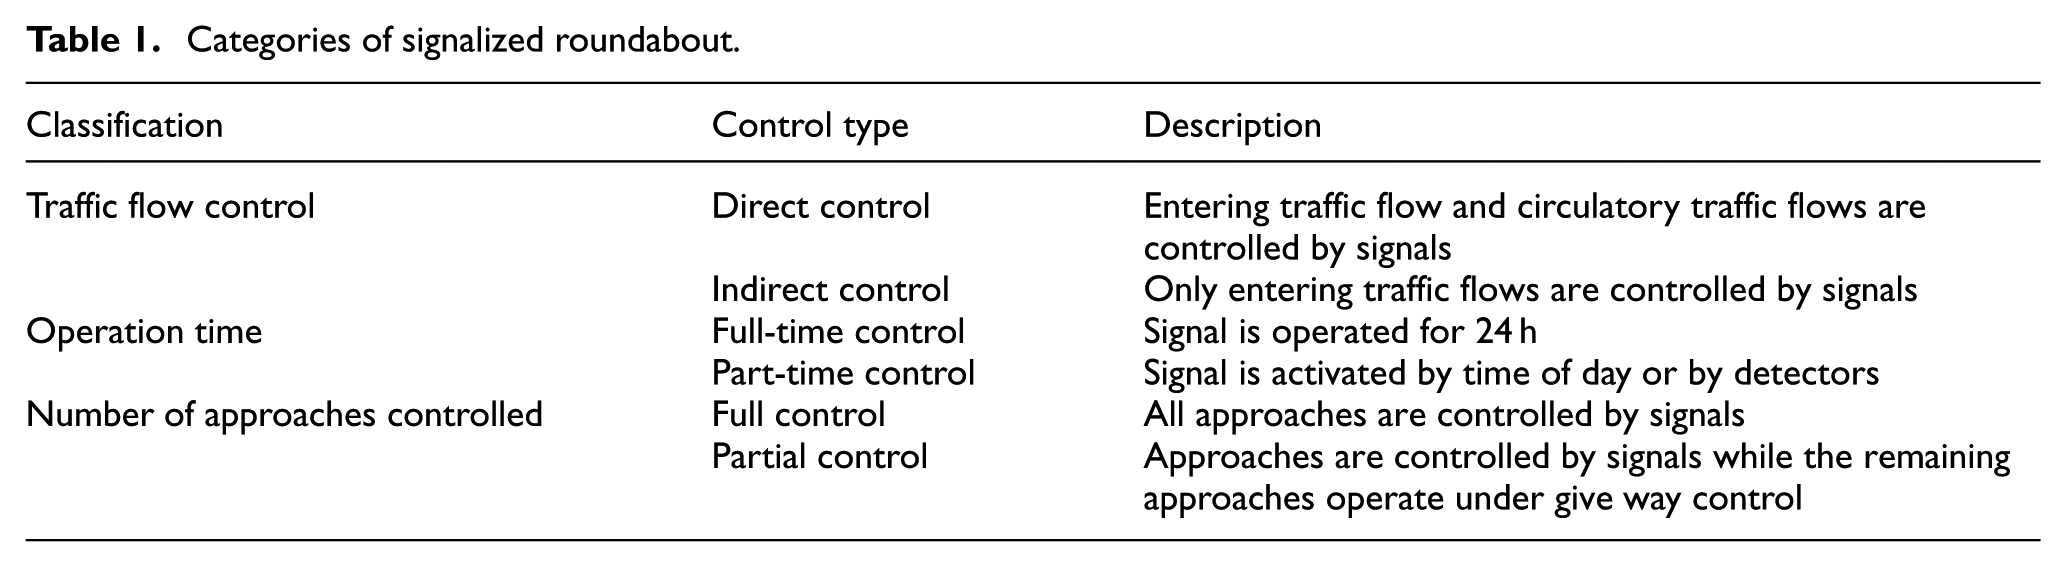
Among the categories of signalized roundabouts given in Table 1, the indirect control with part-time operation is the most suitable method for roundabouts with unbalanced flows during peak hour operations.24,25 In addition, this simple form of metering roundabout has a good cost-benefit ratio due to the low cost of installation. 24 It is also the case that the metering signal phase lengths can be controlled by the location of the approach detector.
The numerical model was formulated using the entering volumes and the circulating volumes as the ratio of imbalance (ρi). Therefore, the Northern approach standard formula is described as below (vehicles drive on the left side of roads condition)
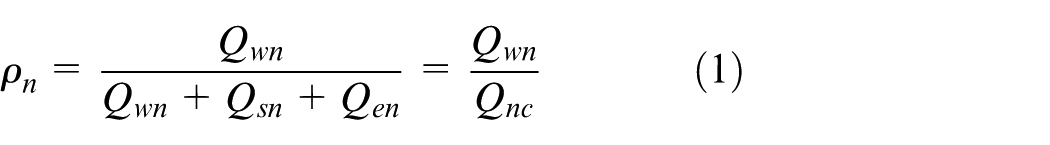
where, ρn is the proportion of the ratio of imbalance for the Northern approach, Qwn is traffic from Western to Northern, Qsn is traffic from Southern to Northern and Qen is traffic from Eastern to Northern.
From field data validation, three important values of
Model calibration and validation with RMSE and root-square tests
This research selected the Old Belair Road metering roundabout as a study site for model calibration and validation based on field data. Two different statistical tests, RMSE and R2 were performed to verify the fitness of the ANFIS. RMSE has been widely used in model comparisons due to its precision including its sensitivity, relationship to decisions and validity 26

where,
Thus, this paper tests another statistical test R2, which is also widely applied for goodness-of-fit measurement between two sets of data.26,27 In addition, the range 0 to 1 represents model fit (i.e. a higher proportion indicates better agreement), as can be seen from Equation (3)
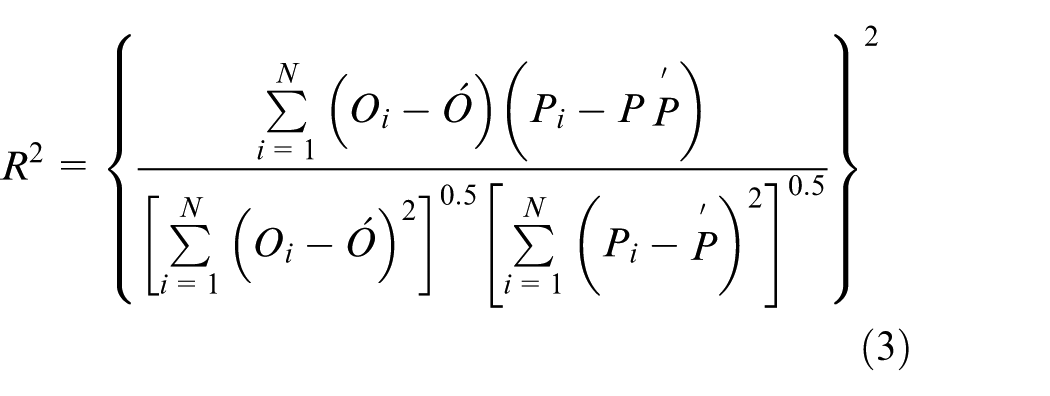
where
Proposed model
In order to predict the queuing length with ANFIS, an essential step is to define the effective model input parameters.
Definition of system parameters
The controlling and metered approaches are considered separately as illustrated in Figure 2, the circular movements are in red and entering movements are in green. This is because, as mentioned earlier, the queuing lengths of the two approaches will be in contrast with the signal phase time. Moreover, this study takes into account the four main parameters into consideration, that is, arrival volumes, conflicting volume, phase green and red time as shown in Figure 2.
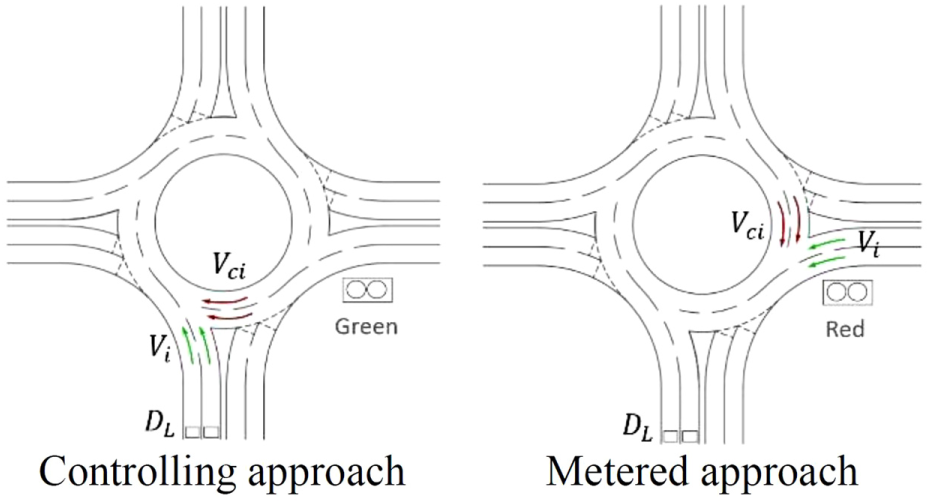
Parameters for the queuing length estimation (drive on the left side of roads).
ANFIS queuing length model
Figure 3 shows the proposed model in which the relation can be drawn as a linking diagram. One line in this figure means the association between one element in set X and one element in set Y = (f). If one element xi is associated with another element yj, there should be one line in the figure; if one element is not associated with another element, there should now be no line in the figure.
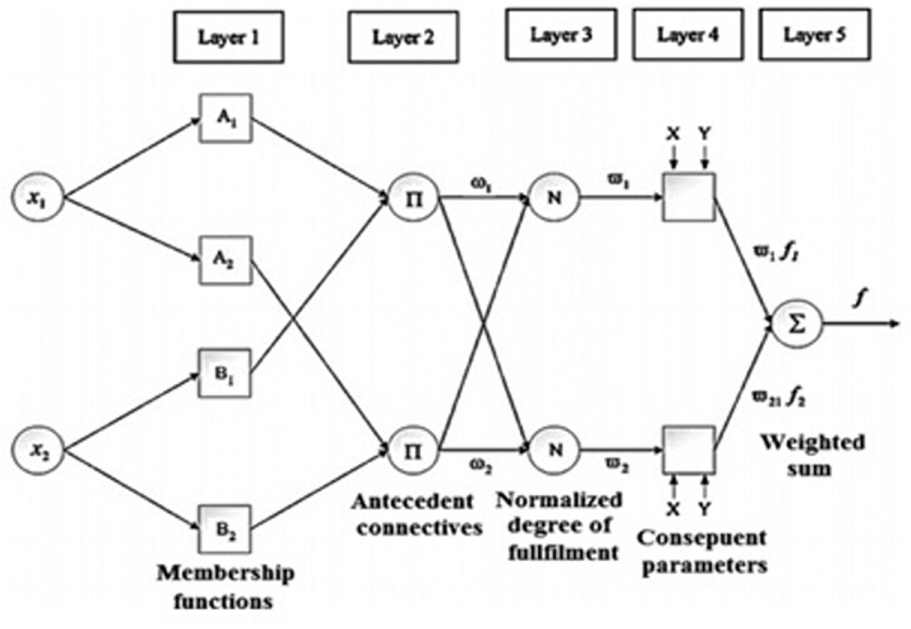
Proposed ANFIS model on the basis of Takagi–Sugeno.
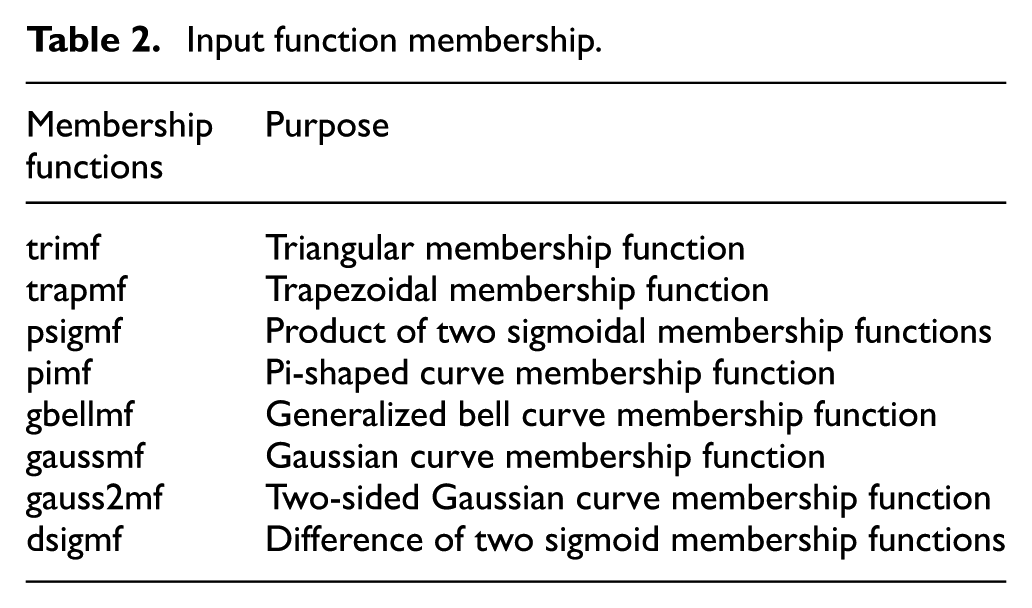
Different input membership functions for ANFIS in this research are tabulated in Table 2.
Input function membership.
Let R be a crisp relation between the two sets X = {arrival volumes, conflicting volumes, Pgreen time and Pred time} and Y = {Queuing length}, such that R: X→Y and R consists of the pairs.
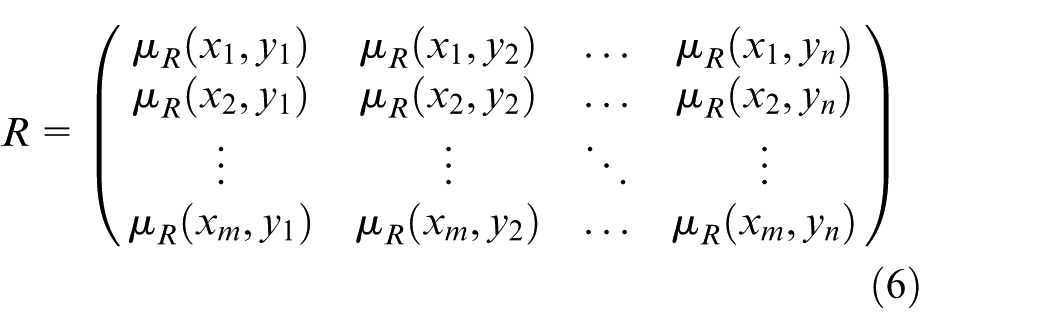
This idea can be extended to define a fuzzy relation R between two sets, X and Y. For each pair (x, y) X Y, a fuzzy relation R can be specified to express a grade of membership (x, y), which is bound to the interval [0, 1]

Thus, a fuzzy relation R can be expressed as a set of pairs, just as the fuzzy set U was earlier

If the two sets are finite, R can be specified as a matrix of
Data collection using drones
The data collection was done in the Old Belair Road roundabout in the Southern part of Adelaide as shown in Figure 4. This roundabout has four legs and is operated by traffic signals (on the Northern and Eastern approaches) and queue detectors (on the Southern approach) during the morning peak periods (06:30–09:30 AM). Detector distance (on the Southern approach) from the stop line is 115 m.
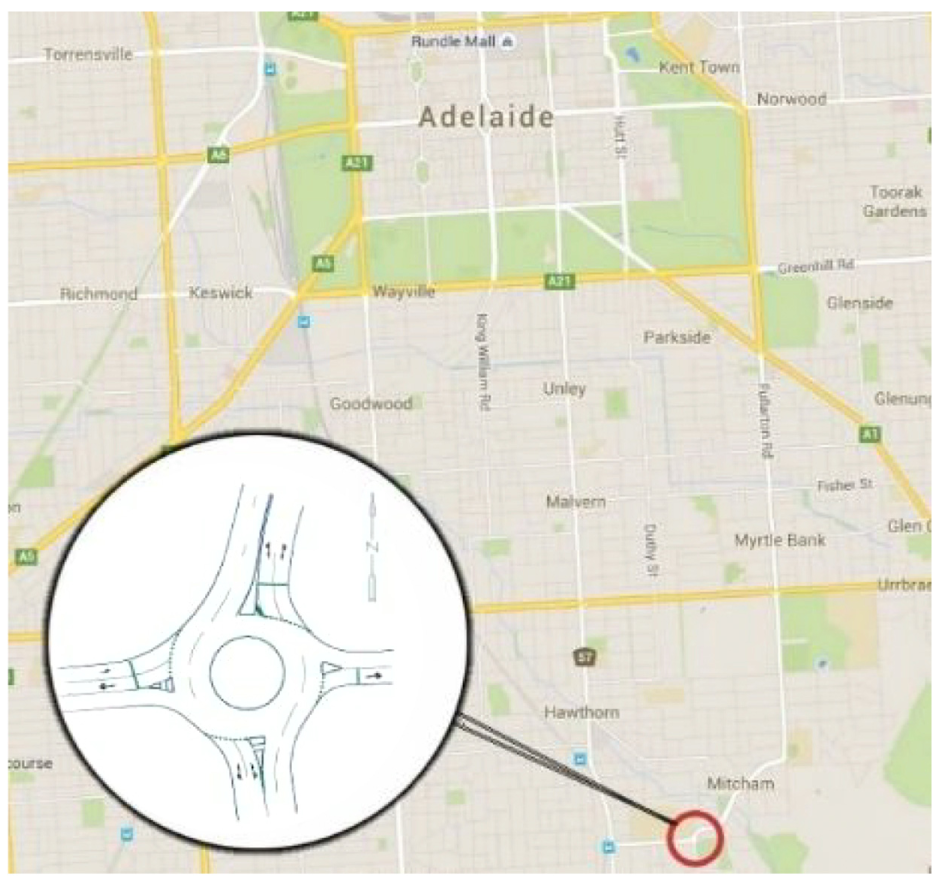
The Old Belair Road roundabout in Adelaide.
The data collection was carried out on 5 days (Monday to Friday in the morning peak periods) for model calibration validation as follows:
First survey: 7–9 October 2015 between 07:45 and 08:45 (Wednesday to Friday);
Second survey: 16–17 November 2015 between 07:50 and 08:50 (Monday and Tuesday).
The main purpose of the exercise was to measure the queuing length variations on each approach at the same time, 5-min (300 s) intervals were used as the observation unit. Although normally video cameras could be used for the vehicle movement recordings, the limited ability to capture entering vehicle movements for all approaches, especially when the queuing lengths are extended to a large distance, has made this method invalid. Therefore, the maximum queuing length of all approaches in this study were recorded using two DJ Phantom2 drones and they can record a full view of the queues for further process, as shown in Figure 5.
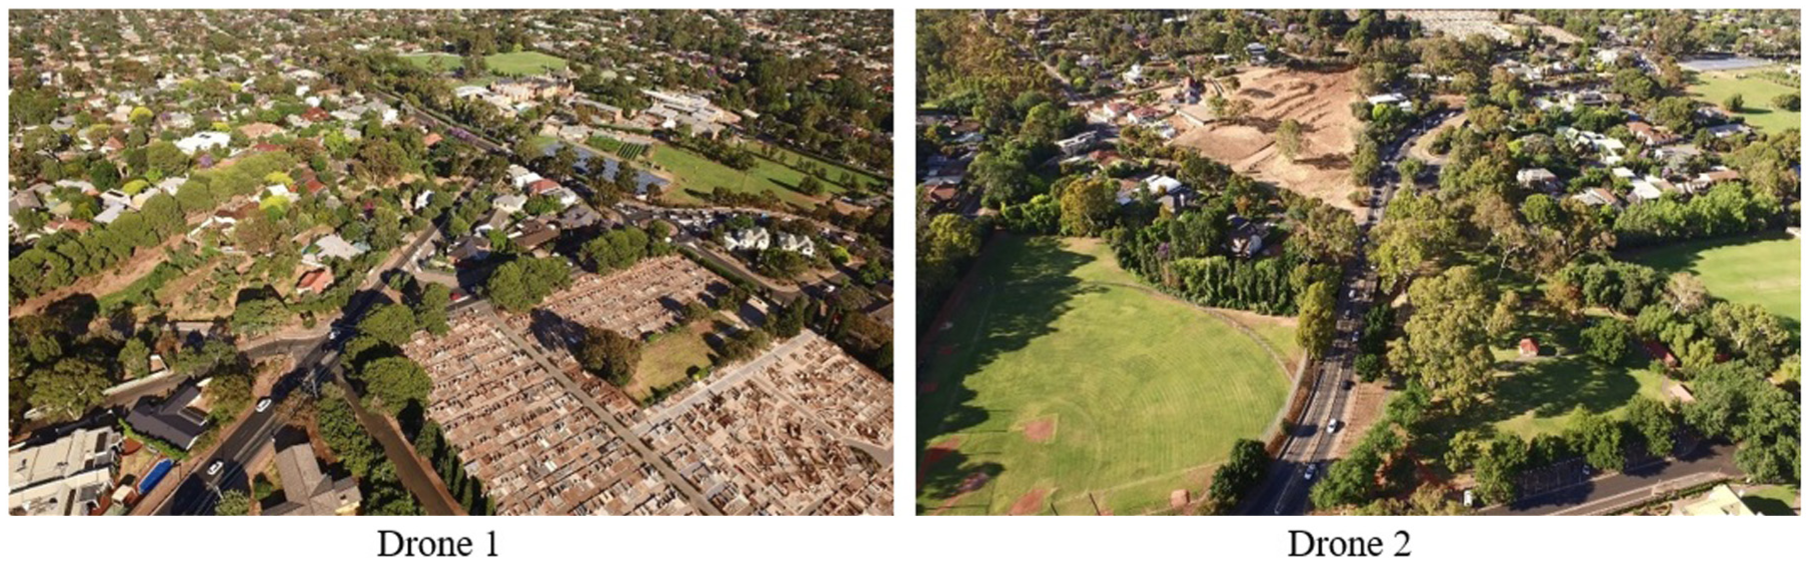
Drone footage.
Table 3 presents that the maximum queuing length on the Southern (controlling) approach, the queuing length on the Northern approach is longer than the other three approaches.
Sample of the maximum queue length on each approach (7 October).
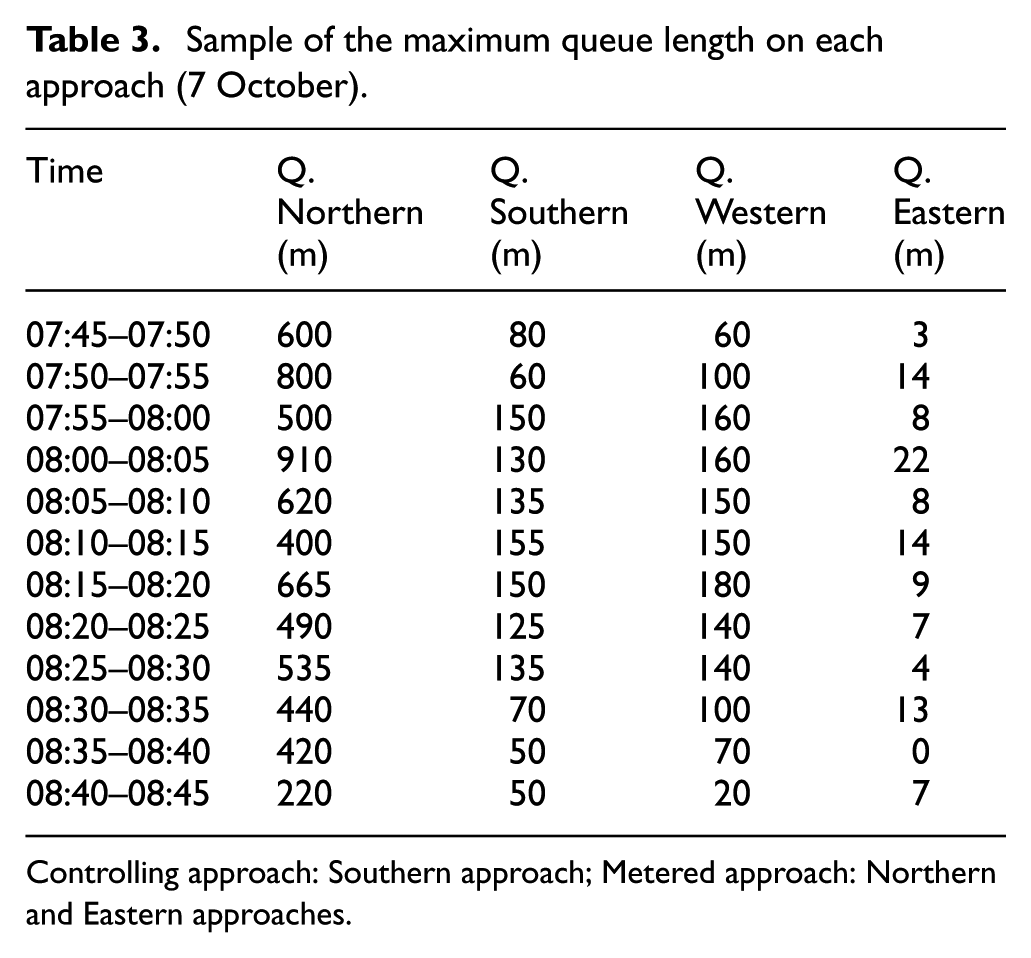
Controlling approach: Southern approach; Metered approach: Northern and Eastern approaches.
Table 4 summarizes the maximum queuing length on 17 November. Similar to above, the longer queuing length (up to 1000 m during 08:15–08:20) was observed on the Northern approach.
Sample of the maximum queue length on each approach (17 November).
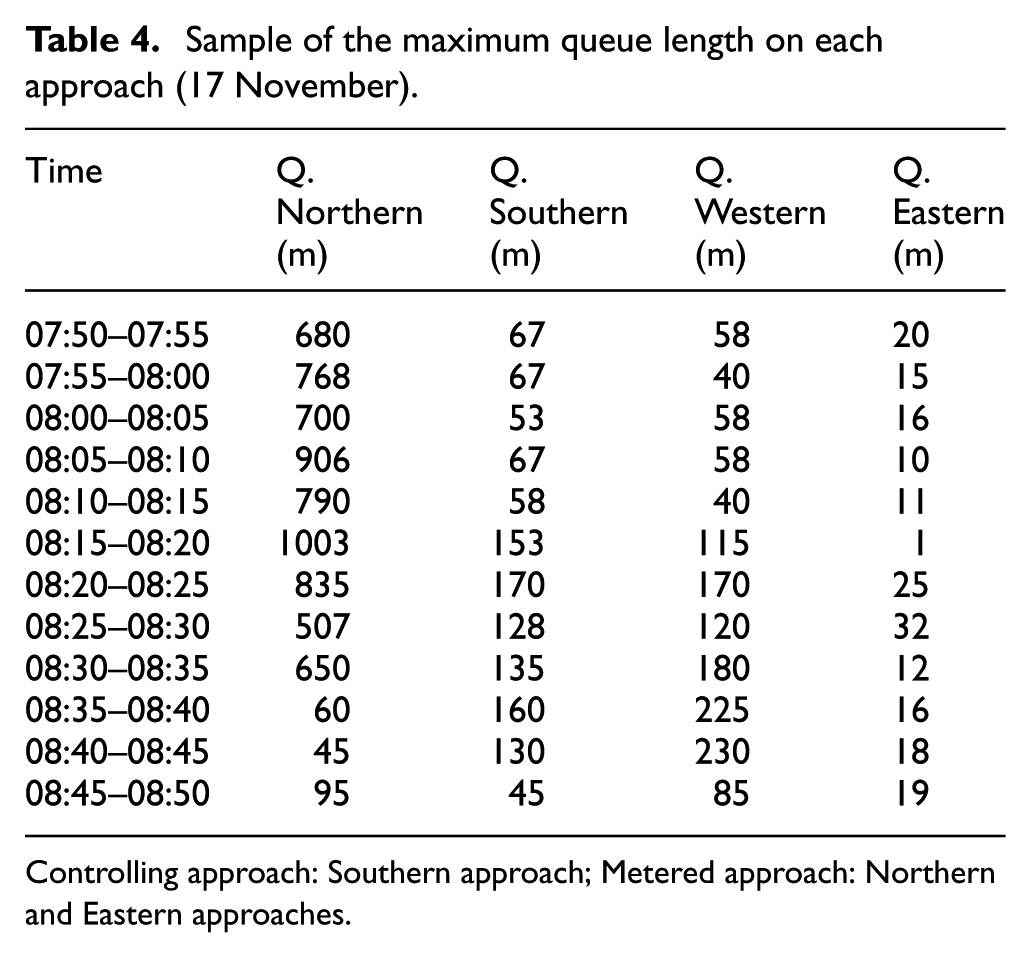
Controlling approach: Southern approach; Metered approach: Northern and Eastern approaches.
In order to perform the model development, Sydney Coordinated Adaptive Traffic System (SCATS) data received from South Australian Department of Planning, Transport and Infrastructure (DPTI), including entering, conflicting volumes and phase durations, were also used as listed in Table 5.
Sample of values of parameters on each approach.
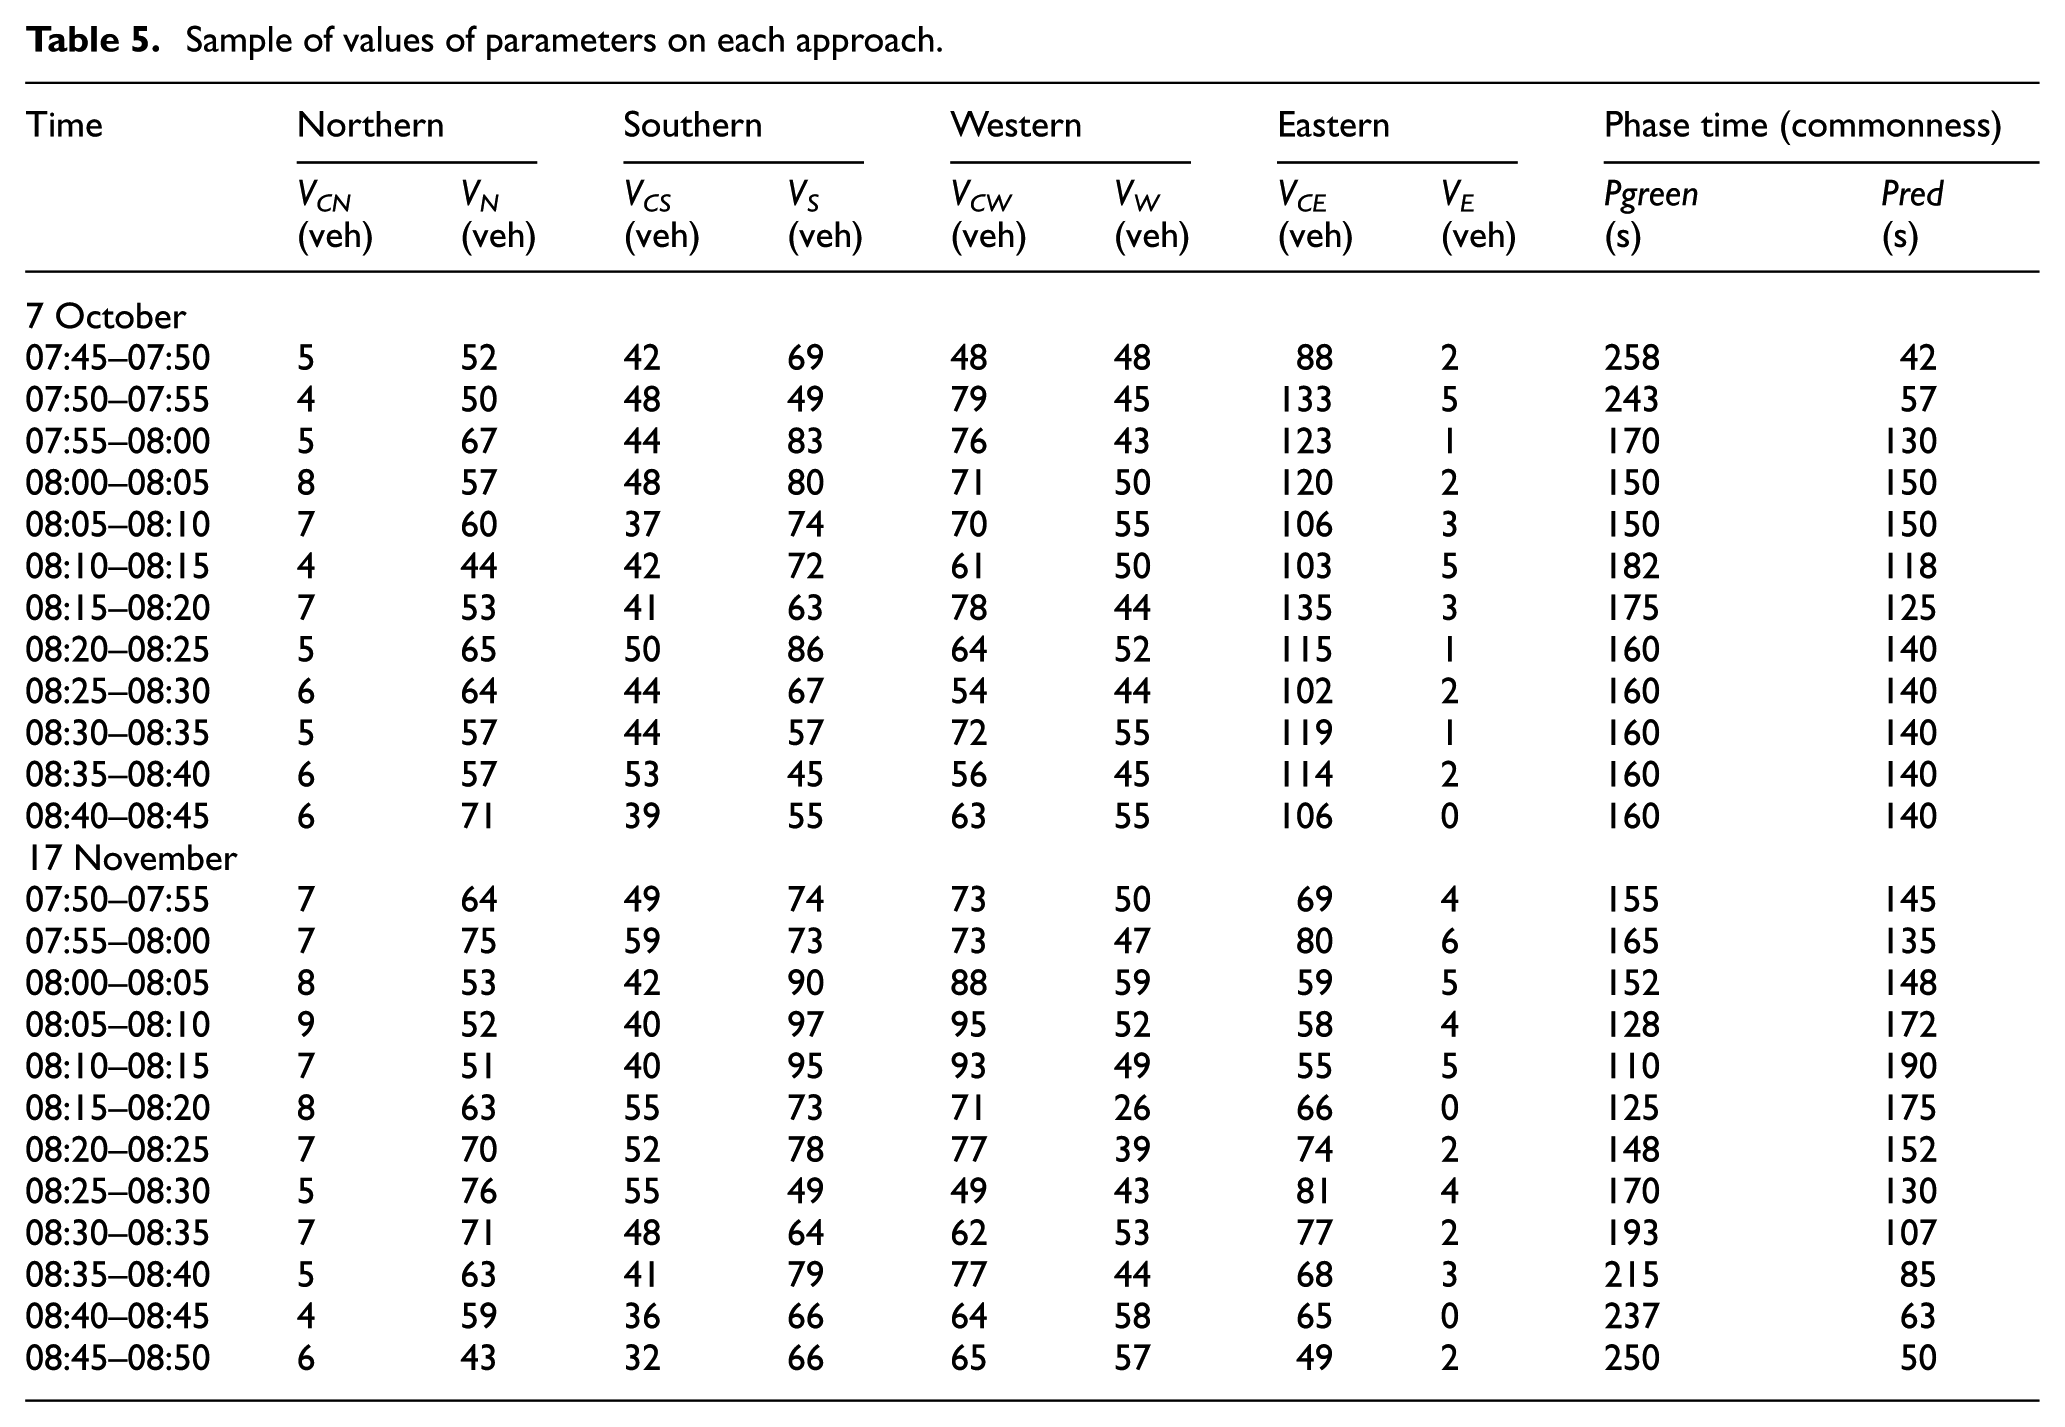
The table shows the parameters as follows:
VCN: conflicting volumes (from Western to Eastern + from Western to Southern + from Southern to Eastern);
VN: entering volumes from Northern approach;
VCS: conflicting volumes (from Eastern to Northern + from Eastern to Western + from Northern to Western);
VS: entering volumes from Southern approach;
VCW: conflicting volumes (from Southern to Northern + from Southern to Eastern + from Eastern to Northern);
VW: entering volumes from Western approach;
VCE: conflicting volumes (from Northern to Southern + from Northern to Western + from Western to Southern);
VE: entering volumes from Eastern approach;
Pred (s): total red time (all approaches use common values);
Pgreen (s): total green time (all approaches use common values).
Result and discussion
The data in Tables 3–5 used for the training and testing were collected by Drone to target for ANFIS model. Sixty samples’ data were used to construct the models of ANFIS. In order to improve the ANFIS model, about 75% of data were used for training and the remainder for testing performance. The optimized structure has been selected as ANFIS, based on the residual error minimum and maximum of 500 epochs. First, the optimized model shown in Figure 6 depicts the convergence characteristics of the training algorithms and training error for constant and linear output membership functions, respectively. Epoch shows the number of iterations.
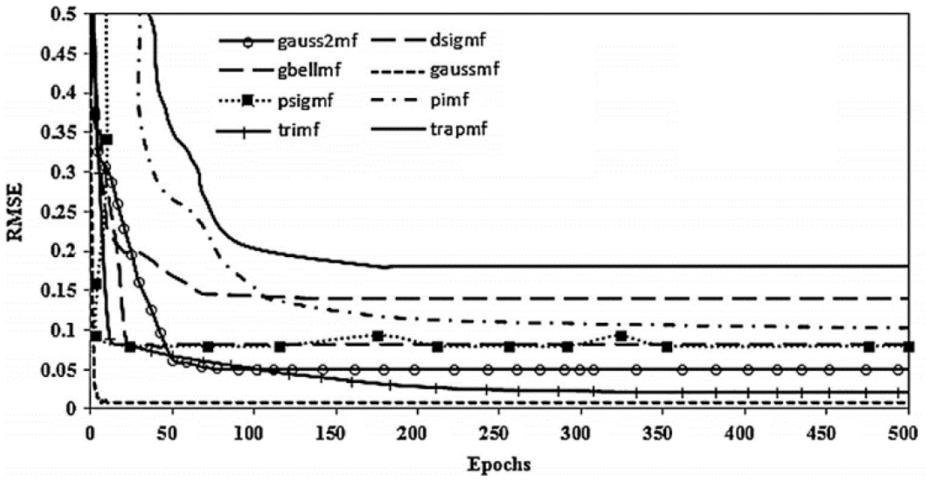
Training error with constant output MF type.
Table 6 compares the convergence characteristics and training error of eight different functions. The table obviously presented the information that “trimf” and “gaussmf” membership functions present the best results and they are accurate enough to estimate the queuing length and its seat but the “gaussmf” has smaller RMSE and is chosen as the best algorithm.
Performance and training error of different algorithm.
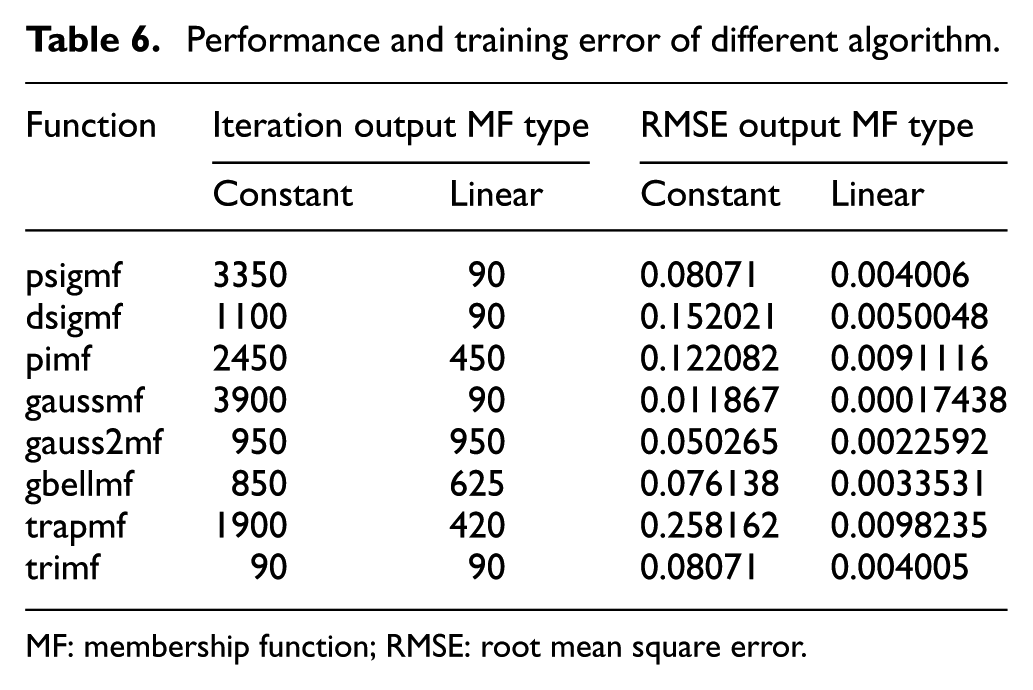
MF: membership function; RMSE: root mean square error.
Table 7 shows the best parameter for the ANFIS model and Figure 7 shows the ANFIS models for training and testing data, where the error (ER) for variable X and the average absolute error (AAE).
ANFIS information of the best models.
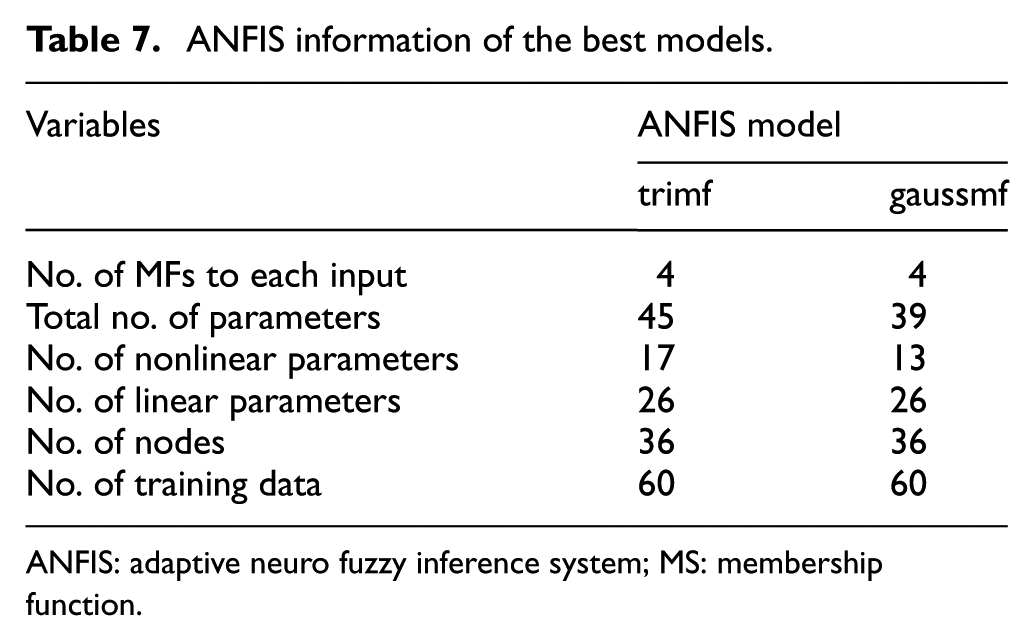
ANFIS: adaptive neuro fuzzy inference system; MS: membership function.
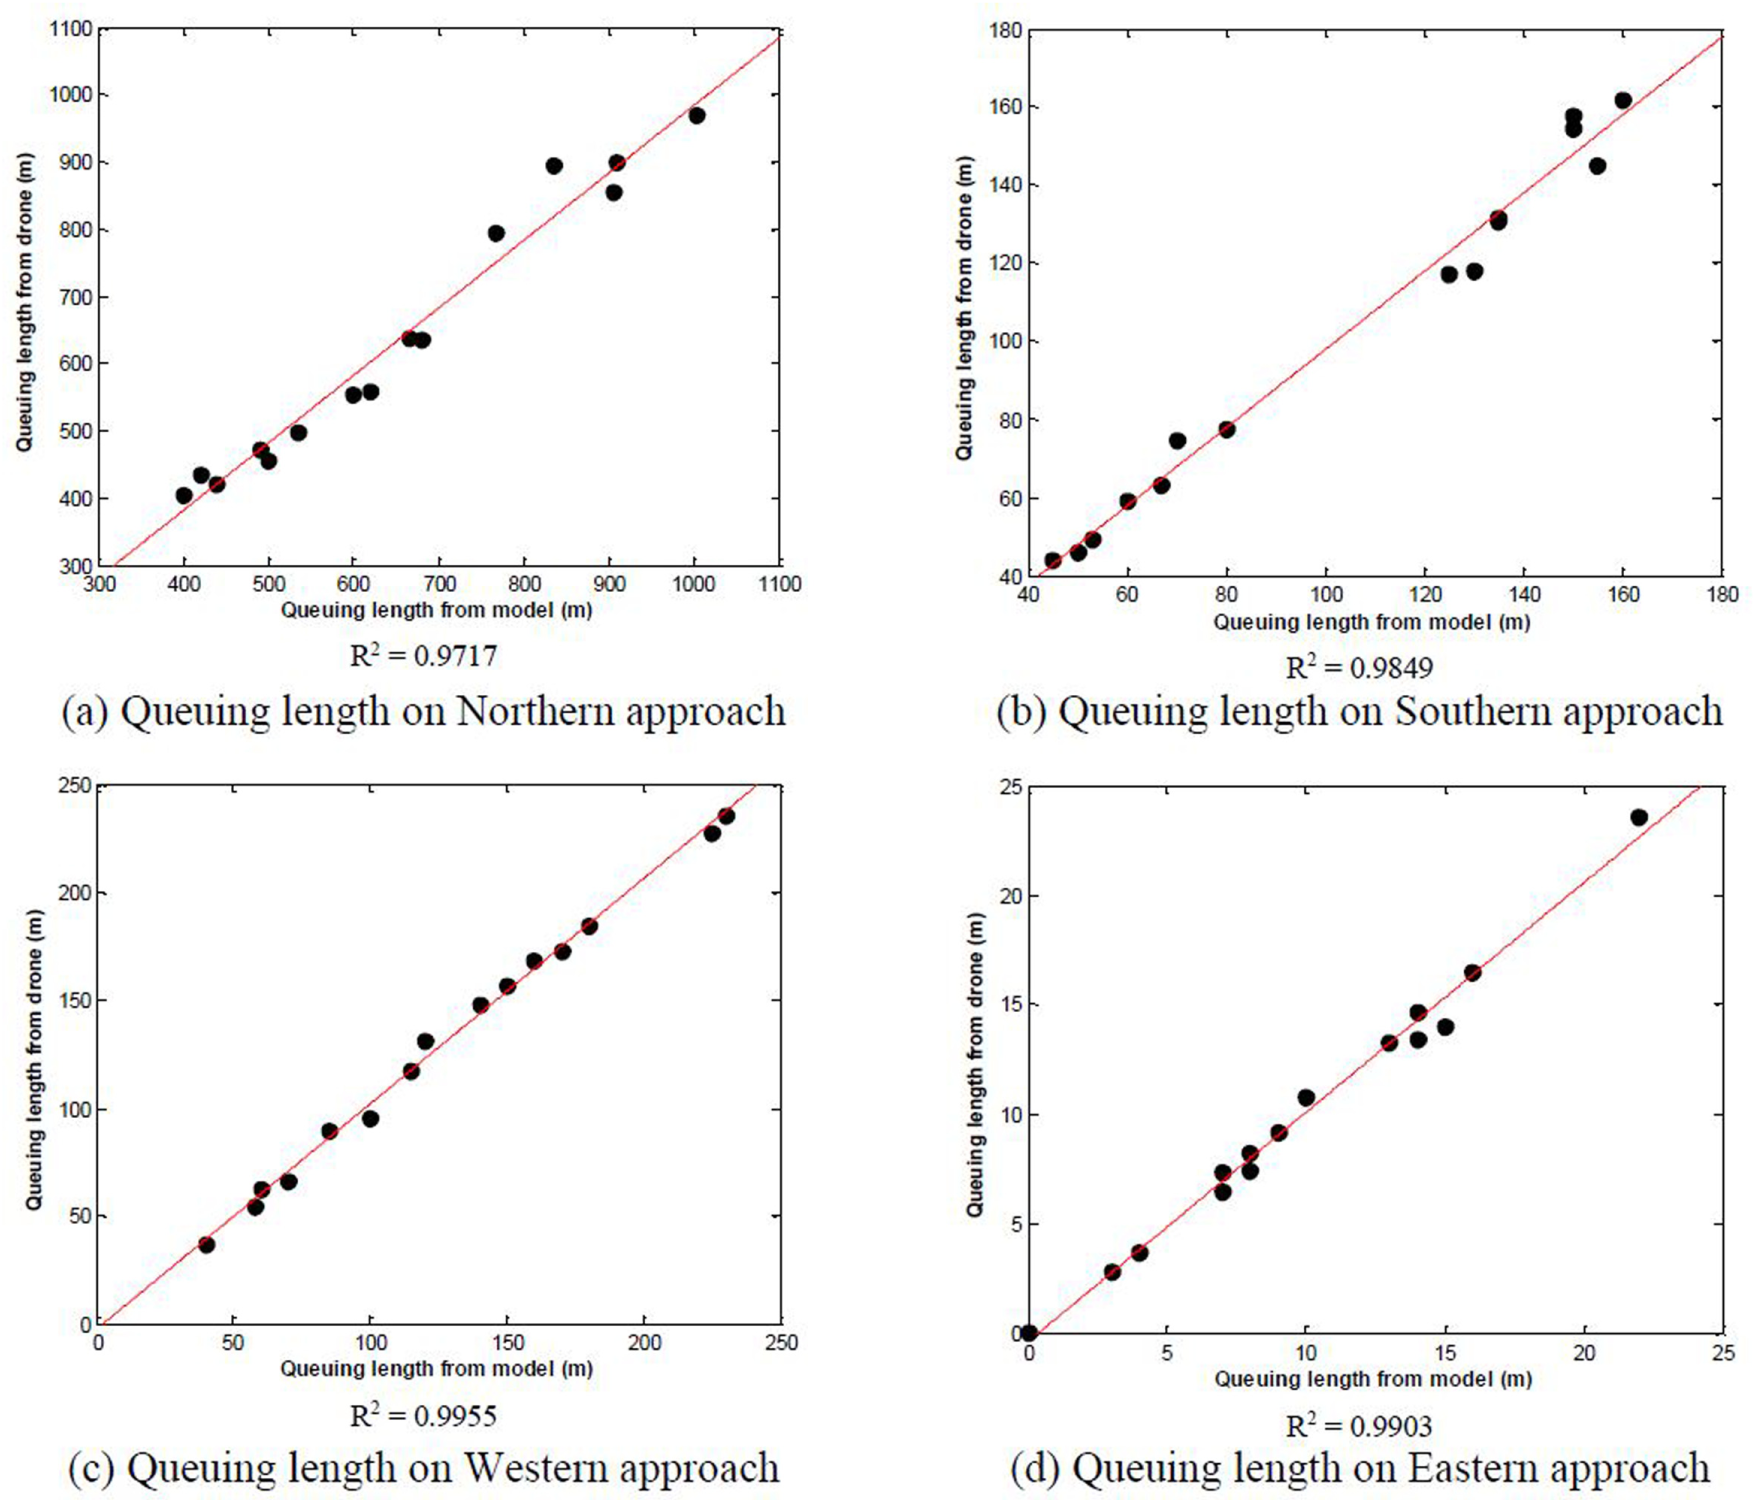
The comparison among the numerical and predicted values of queuing length using ANFIS models: (a) Queuing length on Northern approach, (b) Queuing length on Southern approach, (c) Queuing length on Western approach and (d) Queuing length on Eastern approach.
It can be seen from Table 8 that the ANFIS model predicts queuing length, the maximum error for trained is –9.29% and the range of AAE for all queuing length is 4.61%–5.13%.
Comparison between the drone data and ANFIS model for testing data.
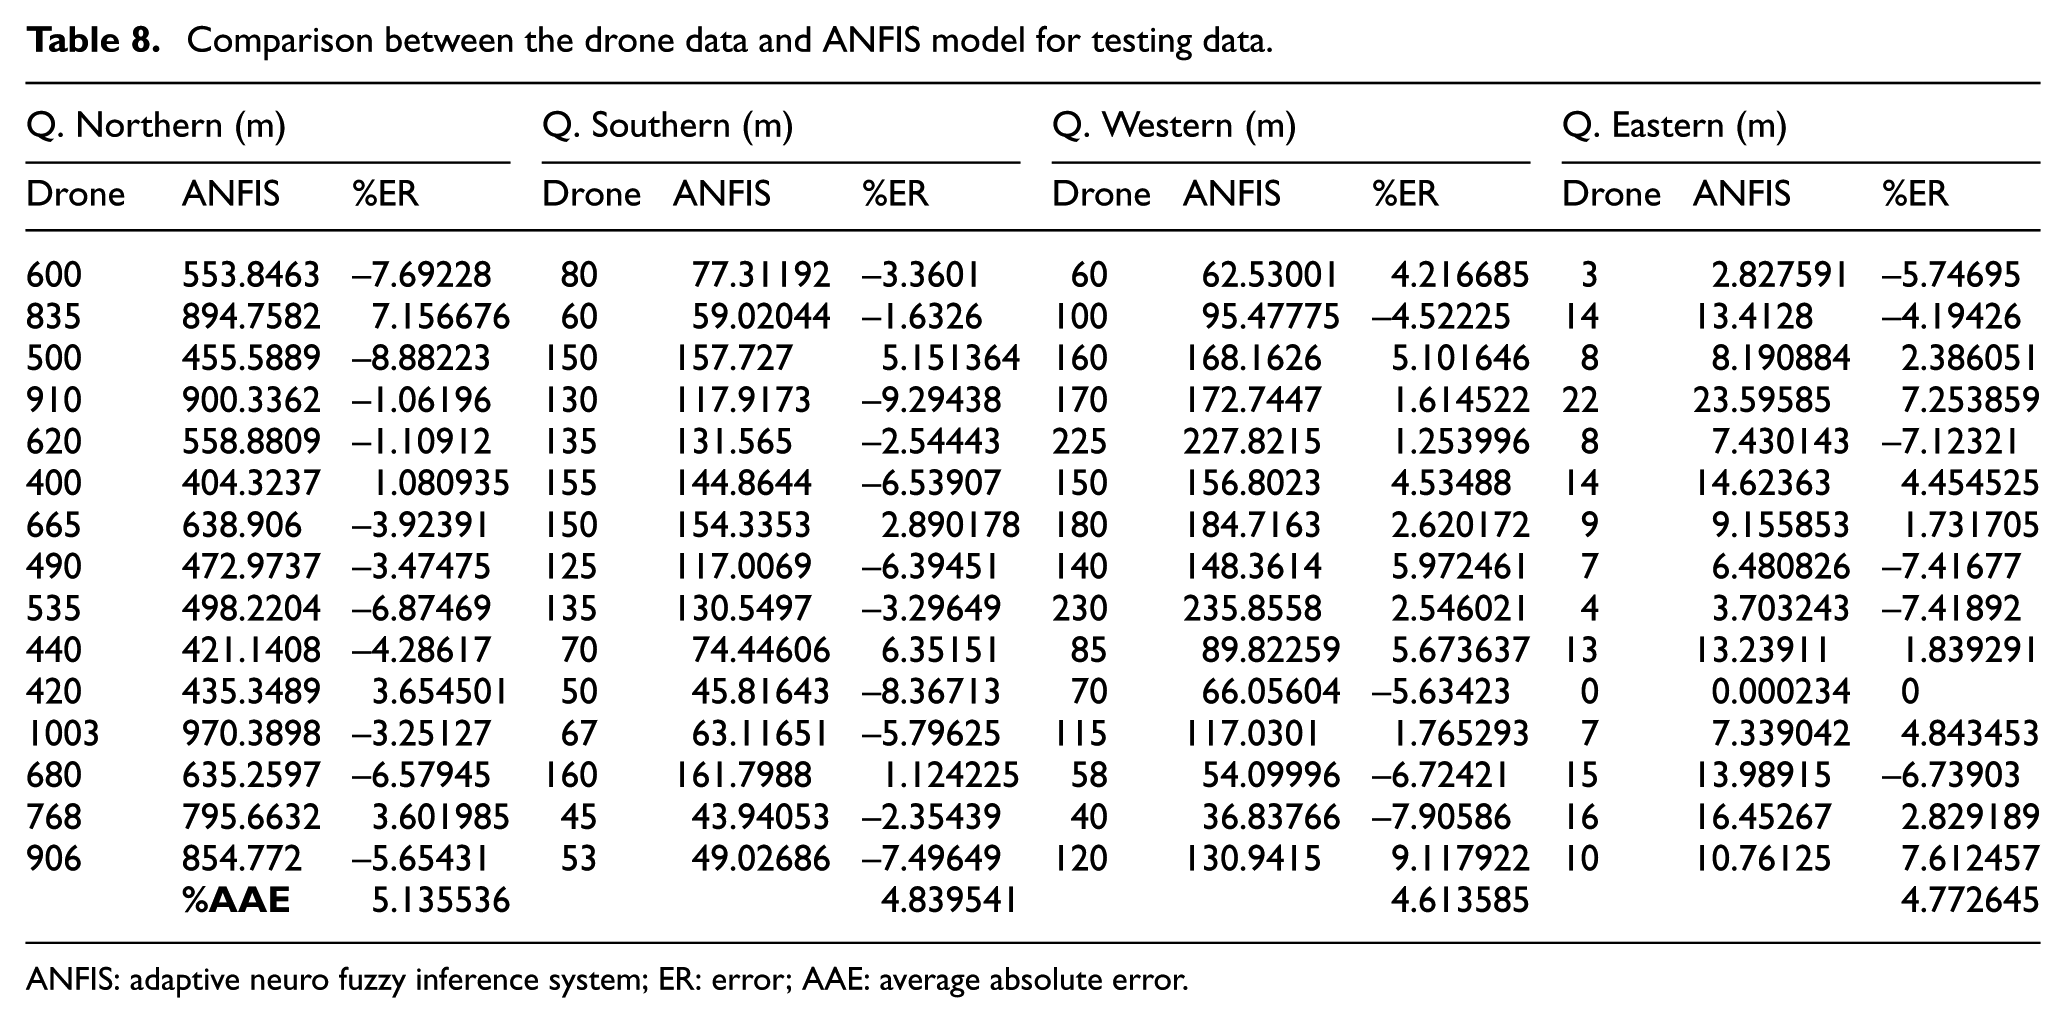
ANFIS: adaptive neuro fuzzy inference system; ER: error; AAE: average absolute error.
R2 and RMSE statistical tests can be conducted for the whole periods for evaluating the goodness-of-fit between ANFIS output and field data for model training (see Table 9 and Figure 7).
R2 and RMSE tests for model training.
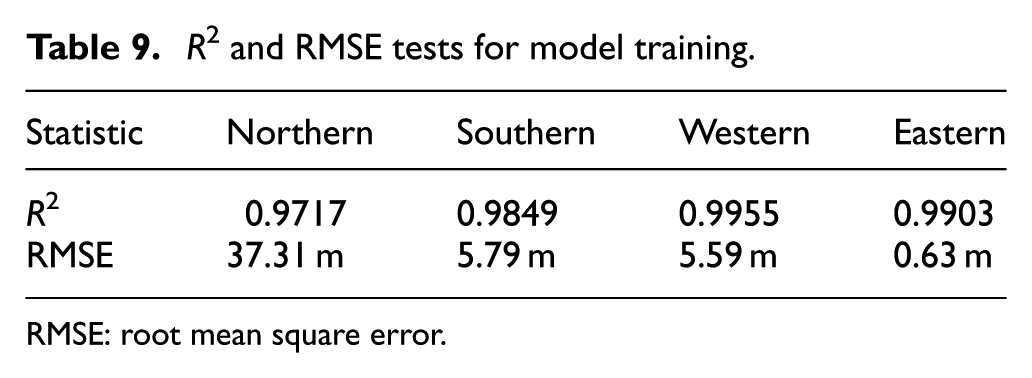
RMSE: root mean square error.
It is observed that the comparison among the drone and predicted values of queuing length (Q. Northern, Q. Southern, Q. Western and Q. Eastern) using ANFIS model are in good agreement with more than R2 value of 98.9%. In addition, values of RMSE are all within 10% (Northern: 37.31 m, Southern: 5.79 m, Western: 5.59 m and Eastern: 0.63 m), which means “acceptable” and “very good.”
Conclusion and future work
This paper attempted to use ANFIS models to predict the queuing length on each approach at metering roundabout based on four parameters, which mainly affect the queuing length on each approach; that is, arrival volumes, conflicting volumes, phase green and red times. The model outputs were compared with the field data from drones with R2 and RMSE statistic tests for evaluation of the goodness-of-fit.
The model results showed that the ANFIS can be used effectively to predict the queuing length on each approach at Old Belair Road metering roundabout. The study results can be summarized as follows:
The prediction of the queuing length with the ANFIS models is in good agreement with the drone data and also has a smaller error.
The ANFIS model is best for predicting the queuing length with comprehensive performance.
It can be expected that the proposed ANFIS model would contribute as a platform for determining the optimal detector locations at metering roundabouts.
This study, however, has some limitations that detector locations which can adjust signal phase times is not considered into the ANFIS models. Thus, in order to determine the optimal detector locations at metering roundabouts for capacity enhancement, the relationship between detector locations and four parameters need to be investigated. In addition, more case studies should be performed in the future based on a variety of metering roundabouts with different geometric designs.
Footnotes
Declaration of conflicting interests
The author(s) declared no potential conflicts of interest with respect to the research, authorship and/or publication of this article.
Funding
The author(s) received no financial support for the research, authorship and/or publication of this article.