
Abstract
The development in both quantity and quality of the system of private universities over the past time has created great opportunities for people to study and improve their qualifications and working skills. It is also challenging for educational managers to find the right university development strategy in today's competitive environment. Therefore, evaluating the effectiveness of using private universities resource to analyze training performance is considered one of the issues. In this study, the Entropy method is used to determine the weight of the criteria. Then the Technique for Order of Preference by Similarity to Ideal Solution (TOPSIS) is used to determine the ranking order of the private universities. Next, Spearman's rank correlation coefficient was applied to evaluate the correlation between rank-ordered variables over the 2 years of analysis selection. Finally, ANOVA was used to compare the criteria between groups of universities. The combination of methods contributes to creating an objective environment in assessing the performance of each university. Thereby, universities can see the important criteria to pay attention to, creating a premise for universities to establish strategies for development and competition. At the same time, educational leaders have the right perspective in choosing key universities to invest in finance and facilities.
Keywords
Introduction
Higher education plays a particularly important role in training high-quality human resources and is a prerequisite for rapid and sustainable development. Moreover, this team stays a pivotal role in technology transfer and scientific research to promote economic growth social development. Hence, the type of private university developed to meet the increasing demand for the high-level study of the people and contribute to the supply of high-quality human resources for the country's development. 1
The recent development in size, quantity, and quality of private universities has created great opportunities for people to study and improve their qualifications and working skills. However, the management of private higher education institutions is still not reasonable. The conditions to ensure stability and improve the quality of teaching and learning of private universities, such as facilities, equipment, the organization, and management of training, the management staff, and the teaching staff are still inadequate. This leads to the poor quality of training, which has not met social needs and development requirements. Moreover, society does not yet trust the training quality of private universities. Some state management agencies and enterprises have not yet acknowledged and believed in the qualifications and abilities of graduates of private universities. 2
State management of higher education still has many shortcomings, especially the current policy of developing private universities is not synchronized and unreasonable. The establishment of universities still lacks thorough investigation and survey; lack of preparation of conditions to ensure the quality of teaching and learning. 3 The system of legal documents on private higher education is not complete and synchronous; the model of a private university, for-profit or non-profit, has not been clearly defined and built.
The state's mechanisms and policies have not really favored the development of private universities; policies on investment in finance, land, and facilities; The policy on developing teaching staff for private universities is still unreasonable and has not created equality between public and private higher education. Therefore, strengthening the state management of higher education and assessing the performance of private universities is necessary to amend and supplement policies to promote the development of private universities. Proper development and investment policies are an urgent requirement in the current period. 4
Previously, many studies on topics related to the problem assessed higher education performance in Vietnam. The well-known non-parametric method widely applied in operations research to estimate performance is mainly Data envelopment analysis (DEA). 5–8 The advantage of DEA is handling multiple outputs and inputs without defining relationships between variables and does not require price information. 5 The studies did an empirical analysis of operational efficiency of Vietnamese higher education institutions, and 7 found a benchmark assessment of Vietnamese universities through teaching and research and revenue performance. In recent publications, other widely used methods to assess the quality of higher education are Analytical Hierarchy Process (AHP), 9–12 Vise Kriterijumska Optimizajica I Kompromisno Resenje (VIKOR), 13,14 Weight Aggregated Sum Product Assessment (WASPAS), 15,16 Technique for Order of Preference by Similarity to Ideal Solution. 17–19 Each method has its advantages and is applied by researchers following their purposes.
Both AHP and TOPSIS can evaluate individual test results, however, the AHP is only applicable when clear quantitative indicators are not available, and it is not objective and rigid. On the other hand, in the TOPSIS method, the decision variables are clearly quantified. In addition, they can be ranked and evaluated based on existing data. Compared to AHP's limitations and the other multi-criteria decision analysis methods, TOPSIS is considered a good MCDM method, Because of its simplicity, fast and ease of understanding of a systematic process. In addition, in its simple mathematical form, this method has good computational power and effectively measures the relative performance for each option. 20,21 However, the TOPSIS method could not obtain the objective weights, so the Entropy was commenced. The coefficient of entropy method construction applies information theory knowledge. The greater the information contained in the indicator, the more critical the data variability (variance). The Entropy weighting method is commonly used to assign weights to indices. 22 It works well in discriminating alternatives due to the diversity with an attribute's susceptibility. This method, therefore, gives importance to the characteristics according to its capture variety. Entropy is a measure of uncertainty and diversity that captures the amount of information provided by an indicator. We normalize the input values in the entropy weight method and then calculate the entropy. 22 So, Entropy could be implemented for objective and accurate assessment of the research object. Therefore, we used entropy and TOPSIS methods to establish a model for evaluating private higher education performance.
The research problem of the study is as follows. Are the resources of private universities being used effectively in training in today's competitive environment, and how effective are private universities in training? Many existing reports synthesize research results of private universities 23 and studies of the private model. 24 In addition, these reports specify many recommendations for developing Vietnamese private universities 25,26 . However, no studies give a specific method or specific quantitative techniques to implement the above solutions. This study aims to evaluate the performance of private sector universities by using the Entropy -TOPSIS method combined with ANOVA (Duncan Post hoc test) in-depth analysis together. First, in the study, the Entropy method is used to determine the weight of the criteria. Then, the TOPSIS is used to find out the ranking order of the private universities. Next, Spearman's rank correlation coefficient was applied to evaluate the correlation between rank-ordered variables over the 2 years of analysis selection. Finally, ANOVA (Duncan Post hoc test) was used to compare the criteria between groups of universities to see the efficiency of criteria or resources of universities. Thus, the study introduced a new combination of methods that contributes to creating an objective environment in assessing the performance of each university. Thereby, universities can see the important criteria to pay attention to, creating a premise for universities to develop strategies for development and competition. Furthermore, with the study, educational leaders can have the opportunity to know the right perspective in choosing key universities to invest in finance and facilities. The applicability of the study can be modified and then applied to other service areas.
The remainder of this study is presented as follows: Part 2 is a preliminary literature review on university performance and assessment methods. Next, part 3 is an analytical model that introduces the main methodology of the paper. Then, in part 4, methods of data collection and analysis are presented. Part 5, discussion and recommendation. And part 6, conclusion with limitations and future studies.
Literature review
University ranking
The ranking of academic institutions based on multidimensional performance indicators and methodology was first performed by US News in 1987. Although previously, the first ranking of educational institutions was based on the perception of university principals. This has prompted several rankings in the field with different themes in different countries. Rankings in these various subject areas have emerged from the press, media, private bodies, professional associations, and governments. 27 There are many methods of ranking universities today. Reputable rankings worldwide all build their own set of criteria, leading to different final results. 28
The first global university ranking belongs to Shanghai Jiaotong University. Shanghai Academic Ranking of World Universities (ARWU) is the world university ranking of Shanghai Jiaotong University. 29 Since 2003, ARWU has introduced the world's top 500 schools annually based on a transparent approach and third-party data. ARWU developed four main criteria, including quality of education (10%), quality of faculty (40%), scientific research (40%), and academic productivity per capita (10%).
Following is the Times Higher Education (THE) QS ranking in 2004. In partnership with Quacquarelli Symonds (QS), Times Higher Education published the joint THE-QS World University Rankings from 2004 to 2009.2010 onwards, THE and QS publish the world university rankings independently. 27 The Quacquarelli Symonds World University Rankings (QS) continues to use a unified methodological framework, compiled using six measures: academic reputation (40%), employer reputation (10%), and faculty/student ratio (20%), number of scientific citations per faculty (20%), international faculty ratio (5%), and international student ratio (5%).
THE is a magazine for news and higher education issues, based in London, England. THE uses 13 calibrated indicators to provide a comprehensive and balanced comparison. The indicators are divided into five groups: teaching (learning environment), research (quantity, income, and reputation), scientific citations (research influence), international outlook (lecturers), students and research), income through knowledge transfer. This ranking is trusted by students, scientists, university leaders, business owners, and governments. Schools are excluded from THE's world rankings if they do not offer bachelor's degrees, or research results are less than 1000 articles between 2012 and 2016 (minimum 150 articles required per year). If 80% of activities do not fall within the 11 fields specified by THE, the school will not be graded. Educational institutions provide data for rankings and must commit to accuracy. In rare cases, the school will use estimates to avoid zero values if not provided by the school. Teaching criteria account for (30%) with metrics like reputation (15%)., faculty/student ratio (4.5%), doctorate/bachelor's ratio (2.25%), doctorate/lecturer ratio (6%), income (2.25%). 30
Although controversial, the research results from these three rankings are all valuable references in the overall assessment of universities in the world. In addition, there are many studies with different university ranking methods, the most popular of which is the MCDM method. Study 31 applies the specific combined multi-criteria decision-making model (MCDM). The author analyzes the hierarchical process (AHP), (VIKOR) ranks 12 private universities in Taiwan. Fernando García suggested using multilevel models based criteria programming targeted to determine objectively the weight of the indicators used to measure the performance of the universities and ultimately to determine their position in the universities ranking. 32 J.M. Conejeroa and et al. used a multi-criteria approach including TOPSIS and a worst-best case scenario approach which was compared with Pearson's well-known global sensitivity analysis technique to rank Vocational and Education Programs in Extremadura (Spain) for 2009–2016. 33 Seyhan Nisel 34 provides a specific multi-criteria model using the VIKOR (Vise Kriterijumska Optimizacija I Kompromisno Resenje) model. This model ranks Turkish universities by academic performance as evaluation criteria such as number of articles, number of articles and citations, number of Ph.D. students, student to faculty ratio. Renuka Nagpal ranks university websites for usability using fuzzy AHP, and fuzzy TOPSIS approaches. 35
The UPM - University Performance Metrics education system developed by Vietnam was announced at the Vietnam National University, Hanoi. This is the first time Vietnam has obtained a ranking system for universities and the Asian region. UPM is an assessment system sponsored by the Ministry of Education and Training of Vietnam to assess the responsiveness of universities in the era of the fourth Industrial Revolution (4IR). UPM is a product made by a research team of Vietnam National University, Hanoi. 36 This system helps higher education institutions identify and manage strategic goals, aiming to reach the top 100 standards of Asian universities. Many criteria are associated with the benchmarks of research-oriented universities specified in Decree 99/2019/ND-CP of Vietnam guiding the Law on Higher Education implementation. 37
Currently, the quality of higher education in Vietnam is of great concern to the whole society. In the rankings of leading universities globally and in Asia, there are almost no Vietnamese universities. By Times Higher Education magazine's 2018 Asian university quality rankings, Vietnam does not have a representative. On 7 June 2018, the British university ranking organization Quacquarelli Symonds (QS) announced the QS world ranking 2020. Vietnam National University 38 Ho Chi Minh City is in group 701,750, while VNU is 701,750. Hanoi belongs to groups 801–1000. Higher education institutions in Vietnam have received this result with different attitudes, but it is certainly a good sign for the higher education system in Vietnam. However, the current problems in higher education in Vietnam are still limited and affect the output quality of universities. 39
Status of private universities in Vietnam
Vietnam's private higher education system plays a particularly important role in training human resources, contributing to economic growth and social development. The development of private universities reduces the pressure on state budget expenditure and contributes to diversifying the education system to meet the increasing learning needs of society. In recent years, private universities have achieved impressive growth. If in 1993, Vietnam had the first private university, by the end of 2020, there were 61 schools (out of a total of 236 universities). Private universities account for about 26% of the total universities number in the country and are distributed in 29/63 provinces and cities. 40
Firstly, in terms of scale: The network of higher education institutions in general and non-public universities, in particular, has been expanded and developed partly to meet the learning needs of the people and socio-economic development requirements of the country. The network of private universities has covered seven regions of the country, in line with the state's university development planning orientation, contributing to the rapid development of the scale of higher education. Compared with public universities, the number of private universities also increases every year and currently accounts for about 25.5% of the total number of universities in the country. The number of students is over 253 thousand (accounting for 13.16% of university students nationwide), the teaching staff is 20,500 people. 41
Secondly, in terms of international rankings for higher education institutions and training programs, only a few private universities were evaluated such as: in 2019, Duy Tan University was the first private university in Vietnam to be awarded which ranked in the 500 best universities in Asia; Nguyen Tat Thanh University is ranked fourth by QS Accreditation Organization; FPT University has one major that meets Accreditation Council for Business Schools and Programs - ACBSP (FPT University was rated five stars by QS for four important criteria in 2015).
Thirdly, about scientific research: the qualitative change in research and publication of scientific results at the international level has raised the position and ranking of many universities on the regional university rankings and in the world, such as Duy Tan University was ranked for the first time by the World University Rankings by Academic Achievement (URAP) 41 ; However, the reality shows that the implementation of training at private universities is still limited. Quite a few private universities have low-quality admissions. Many private universities have a lower number of permanent faculty members than visiting faculty. For the academic year 2019–2020, many private universities did not recruit enough targets, which has affected the stability and development of private universities. The teaching staff of private universities is both lacking and weak. Full-time teachers with university degrees still have a large influence on the quality of training. Although many private universities cannot arrange enough permanent teachers, the number of visiting lecturers still accounts for a large proportion. 42
State-issued private university development policies have not been synchronized and consistent, not timely, have not fully developed and concretized standards. The conditions and capacity to ensure training quality have not created a driving force for the development of private universities. Meanwhile, the public higher education system is prioritized by the state. The private university system has not received adequate attention from the state. 38
In general, the growth in both quantity and quality of the private university system over the past time has created great opportunities for people to study to improve their qualifications and working skills. However, the management of private higher education institutions is still not reasonable. The conditions to ensure stability and improve the training quality of private universities are still inadequate. Moreover, commercializing private higher education is posing concerns to society that require solutions to perfect private universities in the future. To do that requires managers and administrators of private universities to have a clearer view of private universities' strategy formulation and development. 43
Application of entropy, TOPSIS method in MCDM
Different methods for decision-makers provide different information. Therefore, by combining these methods, we can make more refined decisions. Over the past decades, research and development in the field of Multi-Criteria Decision Making (MCDM) involving both quantitative and qualitative factors have accelerated and appears to continue to evolve. MCDM methodology is applied in many fields, including energy, 20,44–46 supply chain, 47–49 quality assurance, transportation, 50 information and communication technology, human resources, 51 education 18,19 and so on.
In recent publications, much attention has been paid to problem-solving evaluation weighting criteria. One of the most well-known approaches to determining the target attribute weights is the entropy-based approach. In MCDM, the larger the value of Entropy, a general measure of uncertainty, corresponds to the smaller the attribute weight, the less discriminating power of that attribute in decision making. 52
Many models use methods such as TOPSIS, Fuzzy DEMATEL, COPRAS, ARAS combined with Entropy weights. For example, Goswami 53 integrates Entropy with Additive Ratio Assessment (ARAS) and Complex Proportional Assessment (COPRAS) MCDM techniques that solve problems in selecting of material handling equipment. On the other hand, HaiLi's study proposes a machine tool selection method based on a new hybrid MCDM model. 54 The study uses a comprehensive weighting technique that integrates subjective weights, obtained using the fuzzy decision-making evaluation and testing laboratory (FDEMATEL) with weights objective is obtained by entropy weighting (EW). The author then uses the later defuzzification VIKOR (LDVIKOR) given to rank the optional alternatives.
In another study, 51 Krylovas, in selecting human resources, the Entropy - KEMIRA method was proposed to rank the criteria and determine the weight when solving the problem of Multiple Criteria Decision Making (MCDM). Morteza Yazdani and colleagues 44 used the integrated Shannon Entropy and EDAS model in the renewable energy assessment to analyze the conflict of five resources renewables to choose the optimal energy source. Shannon Entropy determines the importance of the criteria and assessment based on the Distance from Average Solution (EDAS) application to prioritize renewable energy sources.
Compared with other multi-criteria decision analysis methods such as MABAC, MAIRCA, RAFSI, VIKOR, COPRAS…, TOPSIS has some advantages, such as adequate raw data information and no strict restrictions on the number of indicators. 55 TOPSIS is a ranking method that attempts to choose alternatives that simultaneously have the shortest distance from the positive ideal solution and the farthest distance from the negative ideal solution. 56 TOPSIS makes full use of the attribute information and provides a cardinal ranking of the alternatives. 57 The TOPSIS method is based on the closeness of a limited number of evaluation objects to the ideal solution. There are two ideal solutions, one is the positive ideal solution, and the other is the negative ideal solution. The best object should be the closest to the positive ideal solution and the farthest from the negative ideal solution. This study calculates the relative closeness to the ideal solution based on TOPSIS. In general, the advantages for TOPSIS include (i) simple, rationally comprehensible concept, (ii) good computational efficiency, (iii) ability to measure the relative performance for each alternative in a simple mathematical form. 58,59
Because of its advantages, TOPSIS is considered a good MCDM method. In addition, in its simple mathematical form, this method has good computational power and effectively measures the relative performance for each option. 20,21 In study, 60 the best feature of the entropy method and the TOPSIS method was applied for probabilistic linguistics in multiple attribute group decision-making (MAGDM) in selecting industrial machinery and products suppliers. The other study 61 used adjusted entropy and TOPSIS to prioritize patients. The integrated method helps prioritize patients with COVID-19 and can detect the health status of asymptomatic carriers. With more diverse applications, the author compared different coatings (carboxymethyl cellulose (CMC), Persian gum (PG), low methoxyl pectin (LMP), and tragacanth gum (TG) coating) to improve shelf-life utilization of strawberries using TOPSIS entropy.
The application of the entropy and TOPSIS method in education studies will be mentioned in the next section.
University performance evaluation
Evaluating the performance of higher education has many studies with different methods around the world. 62 John M. LaVelle ‘s view holds that evaluators and evaluators have an important role in serving positive global ideals, especially in education. Using online search and curriculum analysis, the author provides a quick look at assessment education at the end of 2017 as well as a retrospective analysis of the advanced degrees in the assessment offered at universities through the ages. Simon Cadez, Vlado Dimovski and Maja Zaman Groff use a model that has been tested with multiple linear regression analysis to evaluate performance based on comparing the relationship between research and teaching effectiveness. The results show that research positively affects teaching quality, which alleviates concerns about the impact of detrimental research on teaching when assessing performance. 63
Lan Ding and Yao Zeng used the same order prioritization techniques with ideal solution 17 combined with information entropy weight (IEW) to investigate the performance of 68 Chinese universities under the Ministry of Education (MOE) from 2002 to 2011. With this study, the author points out the inadequacy of schools' financial allocation mechanism in China. Compare the performance of schools in different regions based on three-way analysis, teaching, research, and development. 29 Shyh-Hwang Lee develops an intellectual capital (IC) assessment model to evaluate the performance of universities in Taiwan. A fuzzy approach integrated with the hierarchical analytical process (AHP) method is applied to build and prioritize metrics (IC) to build evaluation models (IC). A conceptual framework combining IC with university assessment programs in Taiwan is proposed to develop IC components as a central intangible resource of universities focusing on its relationship with university performance. 64 Another study involved a combination of DEA and TOPSIS, to compare and rank effective units, the author evaluated the distance education of 56 public schools in Turkey, with six input variables and four output variables. 19 The Fuzzy Vikor technique (VlseKriterijumska Optimizacija I Kompromisno Resenje) is also used to evaluate the teaching management system in higher education. The method is applied to generate the criteria from the learning management system proposed in Saudi Arabian universities. 14
In recent years, in Vietnam, the evaluation of the performance of universities has received more attention. The quality assurance and accreditation of higher education in Vietnam are marked by establishing the Department of Examinations and Accreditation (now the Department of Quality Management). The evaluation of quality universities is based on the criteria issued by the Ministry of Education and Training in Decision No. 65/2007/QD-BGDDT dated 1 November 2007. Accordingly, this assessment will be based on ten standards with 61 criteria, including mission and goals of the university; organization and management; education program; training activities; management staff, lecturers and staff; learner; scientific research, application, development, and technology transfer; international cooperation activities; libraries, learning equipment, and other facilities; finance and financial management. 65
In addition to the Ministry of Education and Training's accreditation and training quality assessment activities, studies are also discussed by the authors. Carolyn-Dung. T. T. Tran and Renato A. Villano 2016 propose an empirical study on the performance of educational institutions in Vietnam by applying a two-stage semi-parametric data envelopment analysis method. The authors used this method to estimate the efficiency of educational institutions, including universities and colleges, besides examining the influence of factors affecting the performance of schools. 5 The authors continued evaluating the performance of Vietnamese private universities by using DEA with the bootstrap gap approach. 8 Phung Phi Tran et al. used DEA as an application to evaluate the resource allocation of universities, including teaching and research efficiency. The authors apply the elasticity of scale to distinguish the leading benchmark among Vietnamese universities. 7 Our recent research has used cluster analysis in assessing the operational performance of the public universities in Vietnam. By cluster analysis, clusters with the same concert are grouped and help the author compare and find the field cluster that is the benchmark against other collections. In addition, combined with ANOVA analysis, the author evaluates the criteria affecting the performance of university groups. 66 Xian-Bei Liu et al. extracted 11 criteria and built a model through TOPSIS and Entropy method to establish a comprehensive higher education evaluation system. Then classify based on the development score, apply Hopfield neural network to evaluate the accuracy of the classification. This study has applied the model to many countries, and especially for in-depth analysis, the authors chose Vietnam for implementation. 18
In the above studies, the indicators showing the university's resources were used to evaluate the performance, but there was no comparative analysis between the criteria of the universities. Benchmarking must find out which criteria are met as benchmarks. Furthermore, before the resource analysis, the analysis criteria have not yet built the weights. One issue that needs to be mentioned is that there should be a classification between the universities to group the analysis. With the advantage of classifying good universities with high rankings, based on the criteria collected in this study, the author uses the Entropy method to determine the weights of the criteria. Then TOPSIS is used to find the ranking order of private universities. The results of the ranking analysis, based on the analysis of the requirements of teaching effectiveness. Spearman's rank correlation coefficient was applied to determine the degree of correlation between the 2 years of study. Finally, using ANOVA in-depth analysis to assess the influence of the criteria on the performance of the training activities of private universities.
Methodology
The Technique for Order of Preference by Similarity to Ideal Solution 17 method is one of the multiple-criteria decision-making (MCDM) - model methods. This model is based on fuzzy set theory to solve complex selection problems with many criteria and many choices. Besides, the MCDM method will quantify these standards, calculate the total score of the assessment participants according to the weight of each criterion and help decision-makers have a more solid and accurate basis. Many studies have applied MCDM with methods such as TOPSIS, AHP, DEA, ANP, etc.
TOPSIS method of Hwang and Yoon
67
is a popular tool to solve decision-making problems with MCDM multi-standards. The main content of TOPSIS is to evaluate options by simultaneously measuring the distance from the options to the positive optimal solution (PIS) and the negative optimal solution (NIS). The selected alternative must have the shortest distance from the PIS and the furthest distance from the NIS. . TOPSIS is built on Entropy weights. This weight is based on probability theory to evaluate the probability of an event occurring, limiting the subjective effects that other methods have, such as the Delphi method and the Analytical Hierarchical Process (AHP). The process of the model is presented in the following steps (Figure 1): Research model.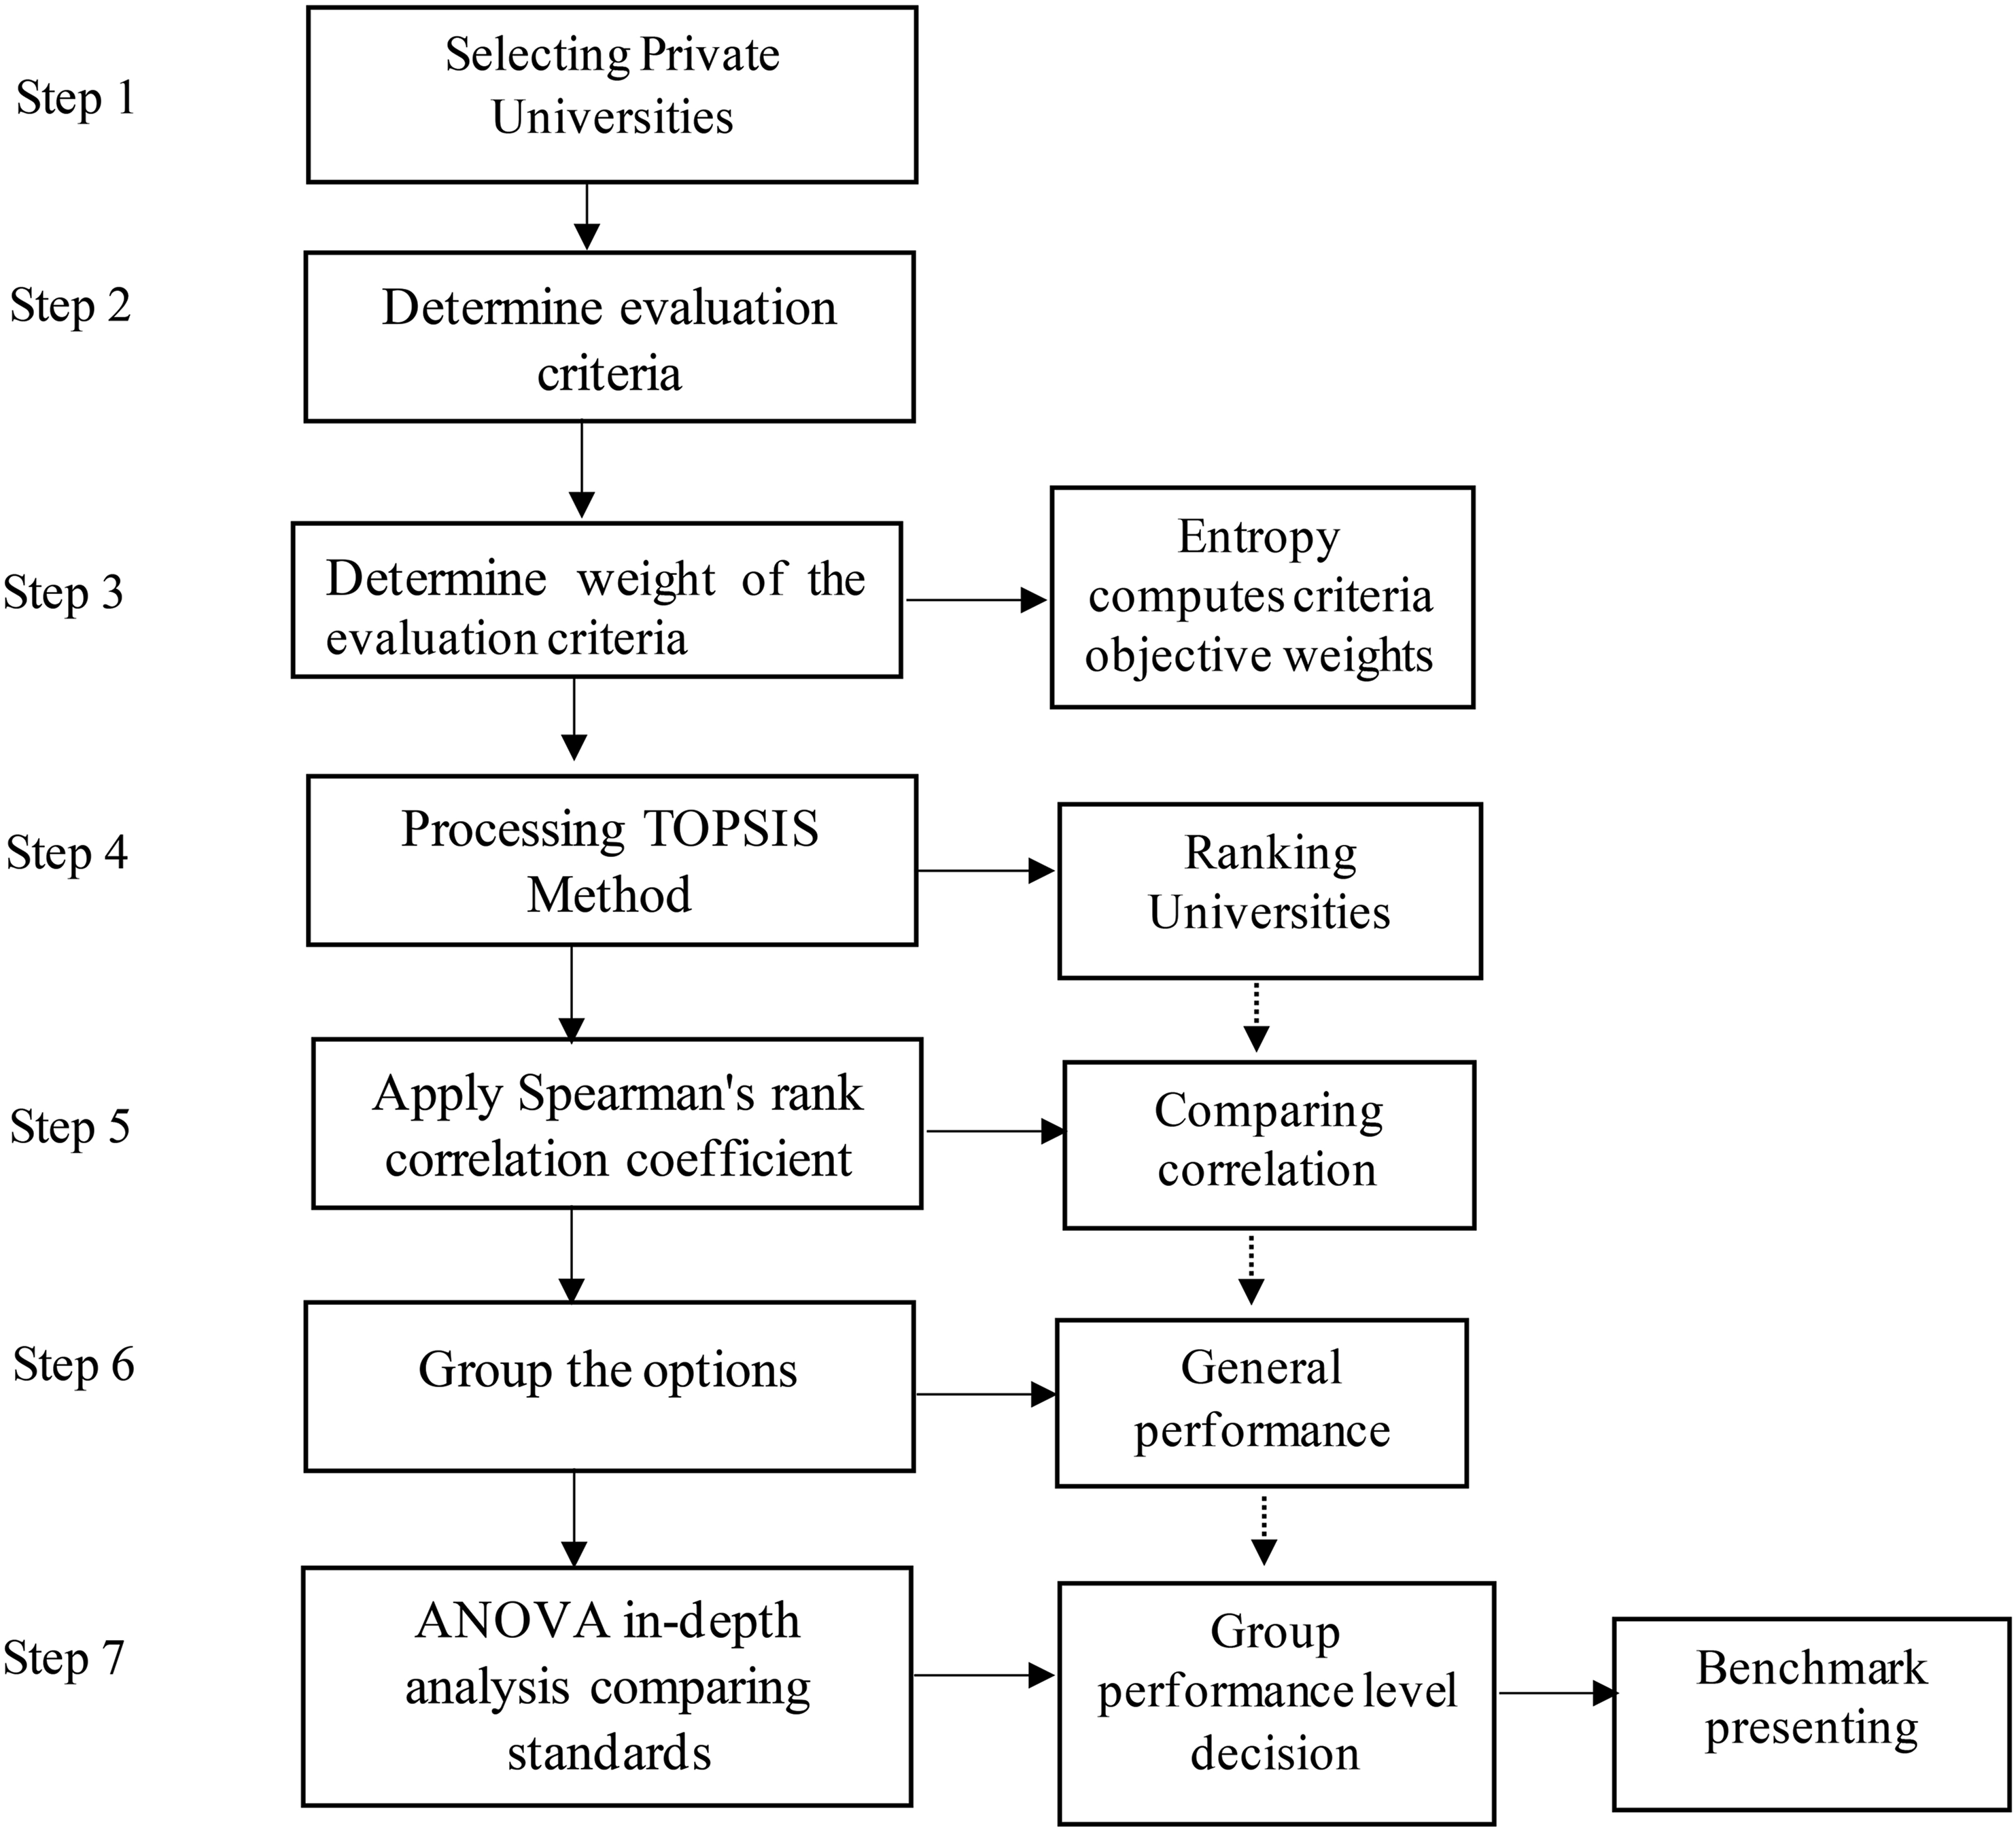
Selecting the objects.
Determine the evaluation criteria.
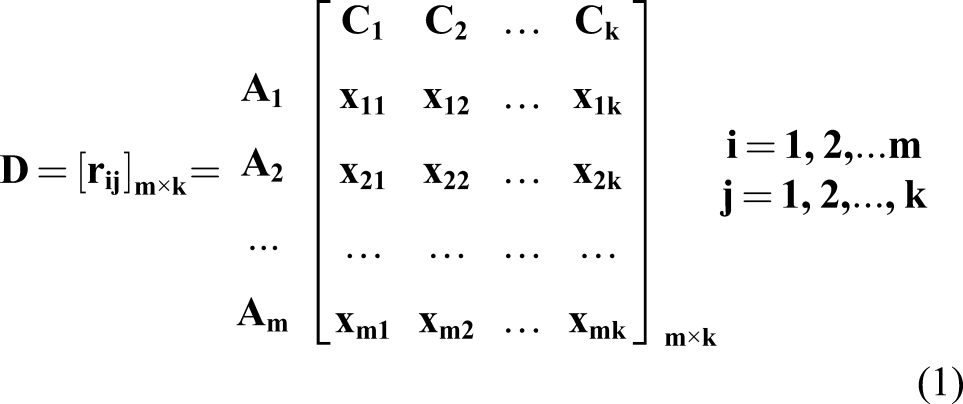
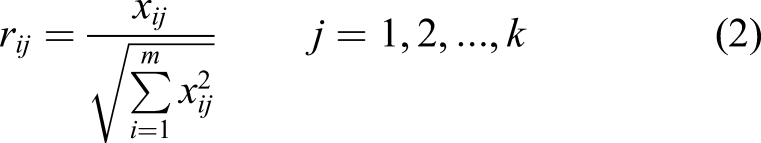
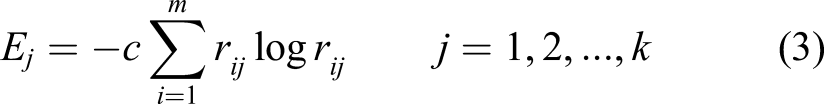
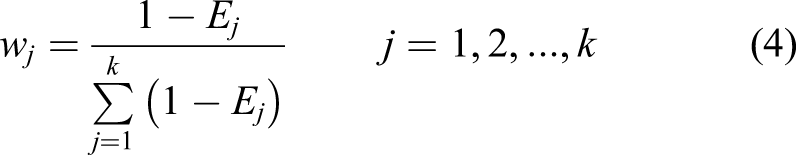
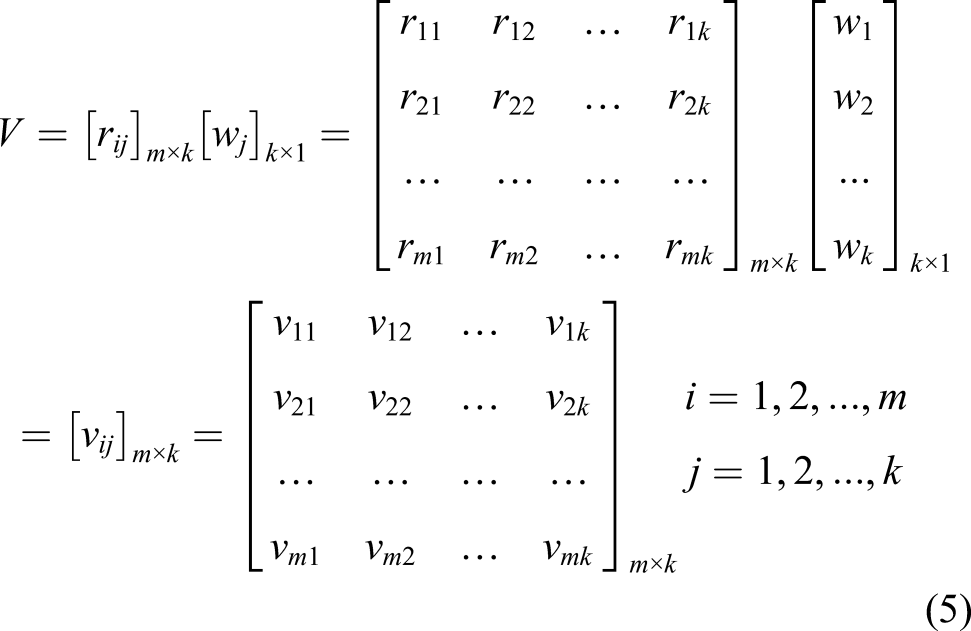
Determine the weight of the evaluation criteria. a. The general expression of the evaluation matrix is as follows. Suppose there are m objects, k criteria for evaluation. The evaluation criteria of the objects are presented as a matrix D = [rij] m.k b. Normalization of research data. Value rij is calculated as. c. Calculate the Entropy value The attributes weights consider the relative importance in the decision-making process in a typical multi-criteria decision-making (MCDM) approach. We cannot assume that each evaluation criterion is of equal importance because the evaluation of criteria includes many different opinions and meanings 68. Therefore, there are two weighting methods: subjective and objective. The subjective methods are to determine the weights only according to the whim or judgment of the decision makers. Then apply some mathematical techniques to calculate the overall rating of each decision-maker. Some popular subjective weighting methods are pairwise-comparison-based SWARA, KEMIRA, SIMOS, FUCOM, and DEMATEL, etc. However, although the subject method has the advantage of integrating information from experienced decision-makers, such communication may sometimes favor a specific criterion because of the decision maker’s past belief, thus leading to biased results.
69
A part from this, decision-makers who do not have complete knowledge about the decision problem under consideration may not furnish the needed initial information.
70
Besides, the process of delivering such information may become complex when the MCDM problem involves many criteria. Difference from subjective methods, objective methods do not require initial information or judgment from the decision-makers
71
; they merely assess the structure of the data available in the decision matrix to determine the weights.
72
These methods eliminate possible bias associated with subjective evaluation, thus increasing objectivity.
73
The objective methods determines weights by solving mathematical models automatically without any consideration of the decision maker’s preferences, for example, the entropy method, multiple objective programming, etc. To ensure that the evaluation result will be affected by the weighting approaches, subjective weighting and objective weighting methods are both utilized in the comparison. The use of subjective weighting is based on decision maker’s expertise and judgment, nevertheless the objective weighting is based on mathematical computation. The approach with objective weighting is particularly applicable for situations where reliable subjective weights cannot be obtained.
74
Researchers have proposed many objective weighting measures. Shannon’s entropy concept
75
is well suited for measuring the relative contrast intensities of attributes to represent the average intrinsic information transmitted to the DM. The criteria weights are not estimated to ensure that each criterion's inter-dependence is not affected by the evaluation results. Shannon's entropy analysis is known as a measurement tool to calculate the criteria weights and measures uncertainty in knowledge formulated in probability theory.
76
Wang et al. extend Shannon’s concept of using entropy measure as the weighting calculation method. Entropy weight is a parameter that describes how much different alternatives approach one another regarding a particular attribute. The greater the entropy value, the smaller the entropy weight, the smaller the other options in this specific attribute, and the less information the distinguishing feature provides, and the less important this attribute becomes in the decision-making process. The evaluation criteria of this research are quantitative measured data. Therefore, objective weighting methods, namely, Entropy is used to determine evaluation criteria weights. Refer to the Entropy concept to calculate the weight of each criterion; Entropy is expressed as (the Entropy value of the criterion) d. Calculate the Entropy weight.
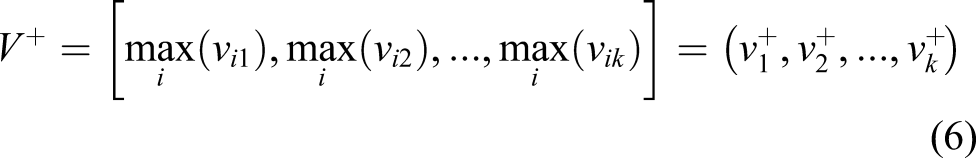
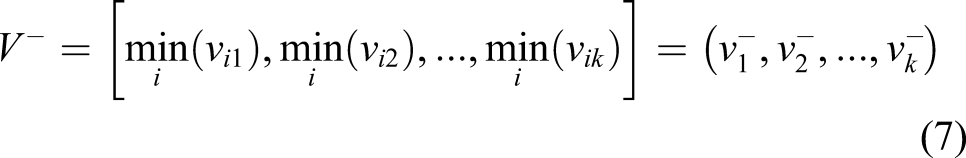
Processing TOPSIS Method a. Constructing standardized weight matrix b. Seek positive ideal solution and negative ideal solution. The positive ideal solution (PIS) V+ is presented as. The negative ideal solution (PIS) V- is presented as. c. Calculate the separation measure positive-ideal one d. Calculate the relative closeness coefficient to the ideal solution e. Rank the preference order according to the descending order of So based on CCi to rank the research objects, the object with the larger Ci is better.
where
Apply Spearman's rank correlation coefficient
Spearman rank correlation formula. Depending on whether or not there is a relationship in the rank (the same rank is assigned to two or more observations), the Spearman correlation coefficient can be calculated using one of the following formulas.
Group the options. Based on the ranking results, we group the fields to get groups of values compatible.
ANOVA in-depth analysis comparing standards
Data collection and analysis.
Methods of data collection
List of 45 private universities.
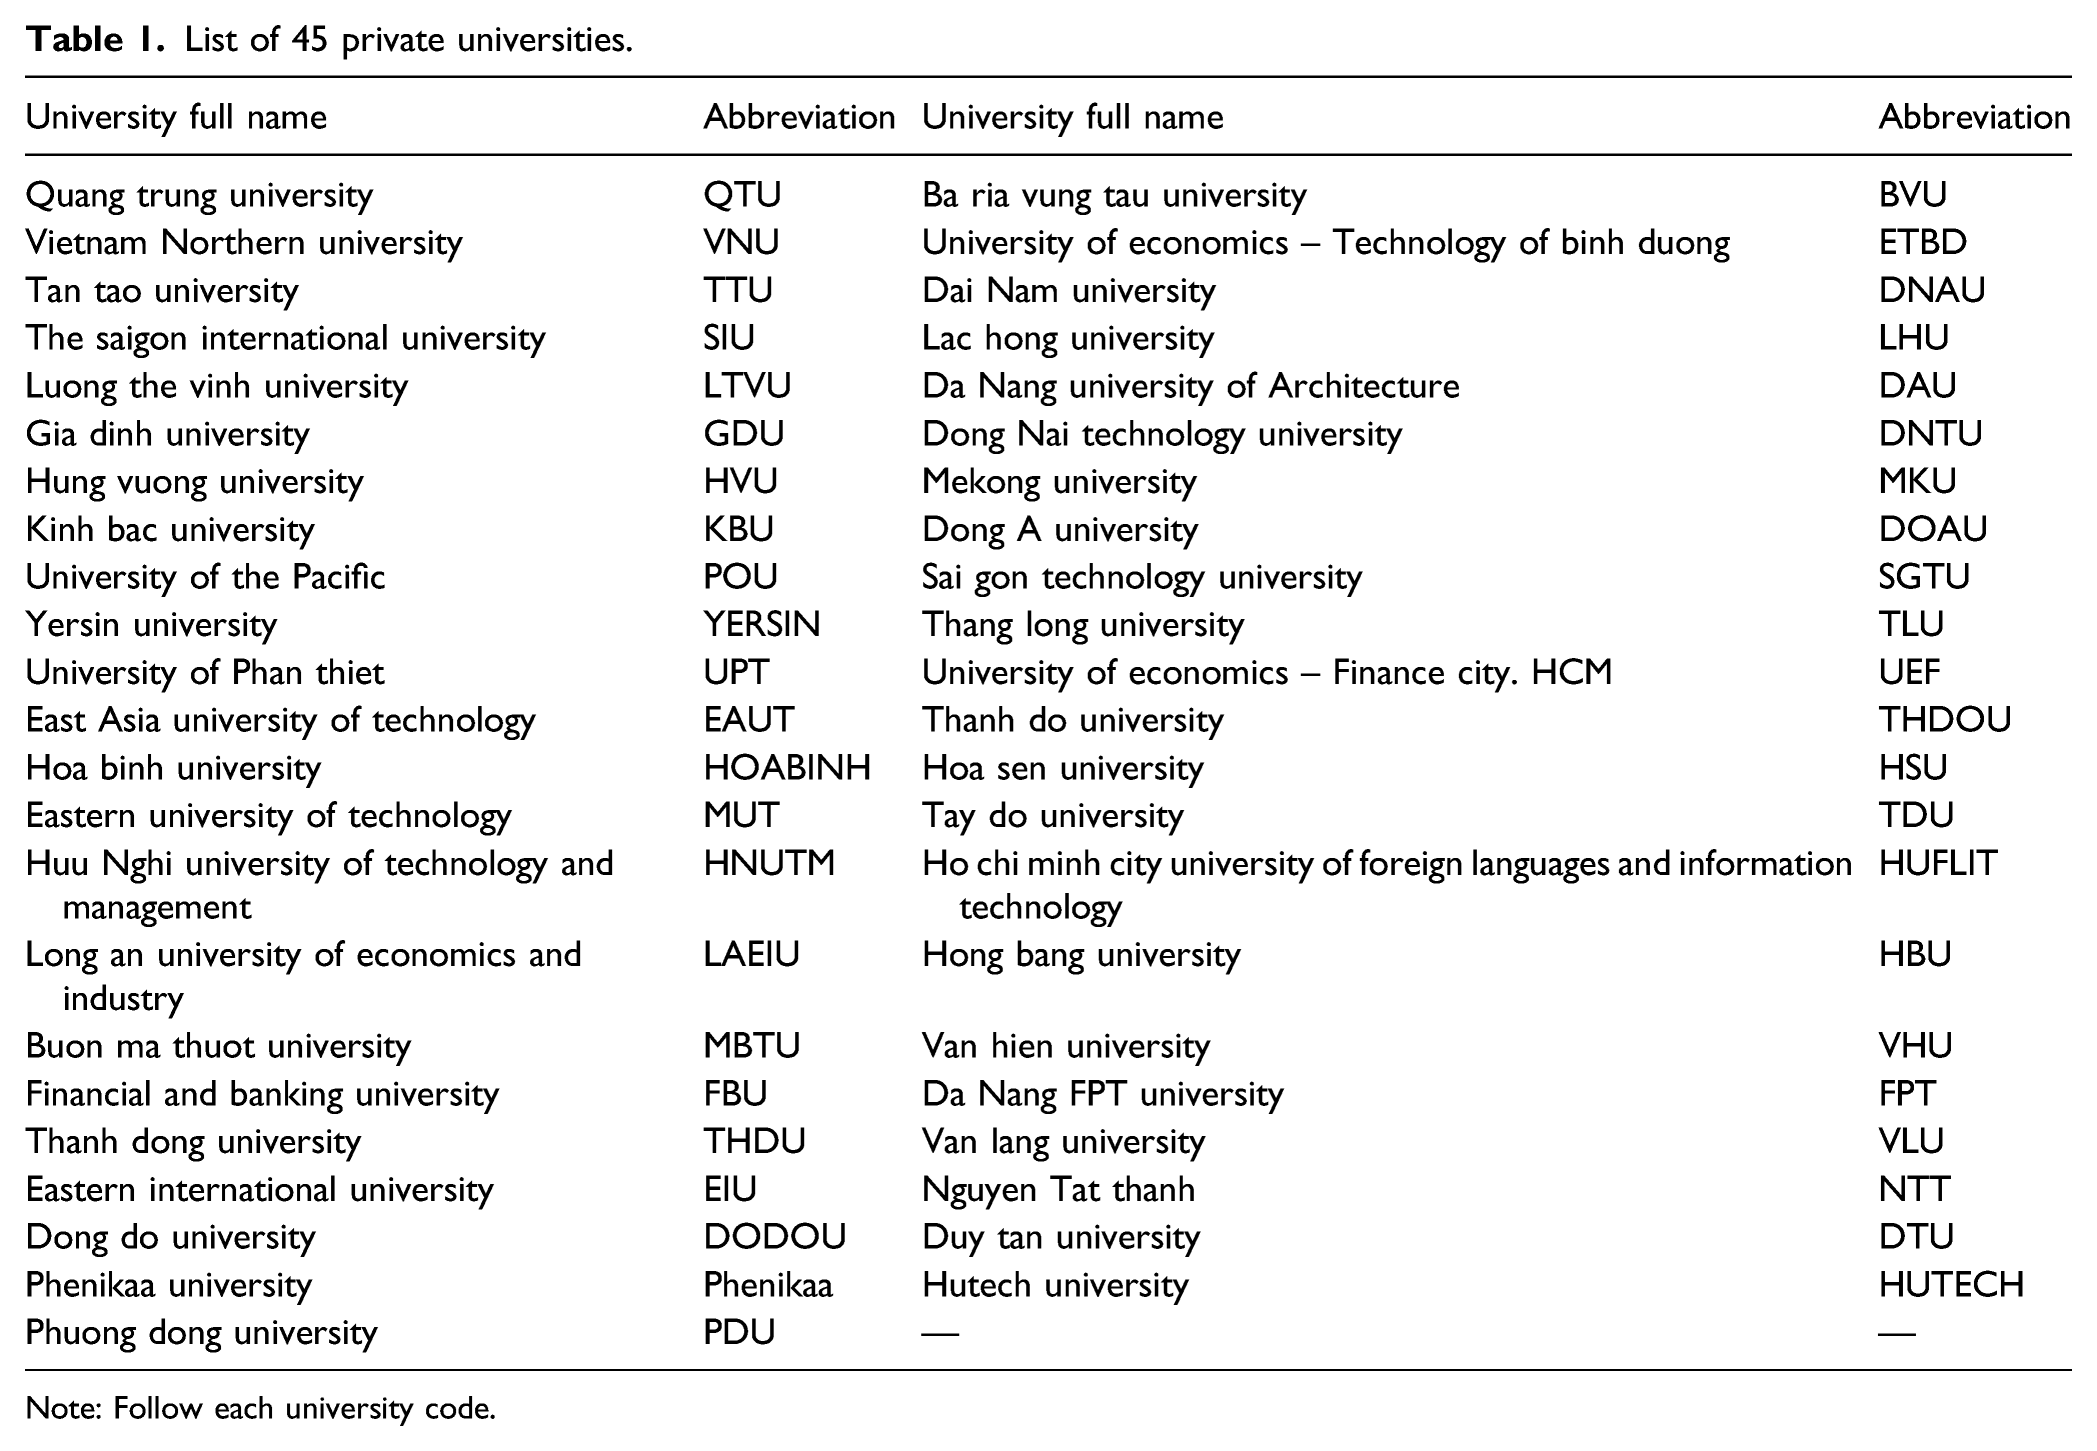
Note: Follow each university code.
Selecting Private Universities In this study, the proposed model is applied to select, group, and evaluate 45 private universities in Vietnam. The private universities in Vietnam are gradually changing and developing to meet learners' needs and benefit society. Therefore, the evaluation and appropriate strategy for the educational leaders will be necessary to overview each school's operation and training organization.
Define the evaluation criteria The research data are collected through public school reports to the Ministry of Education and Training annually. Based on the publicly available standards, data in the report combined with the set of 10 higher education quality assessment standards issued on 1 November 2007, the Minister of Education and Training signed the Regulations on standards for assessing the quality of higher education,
77
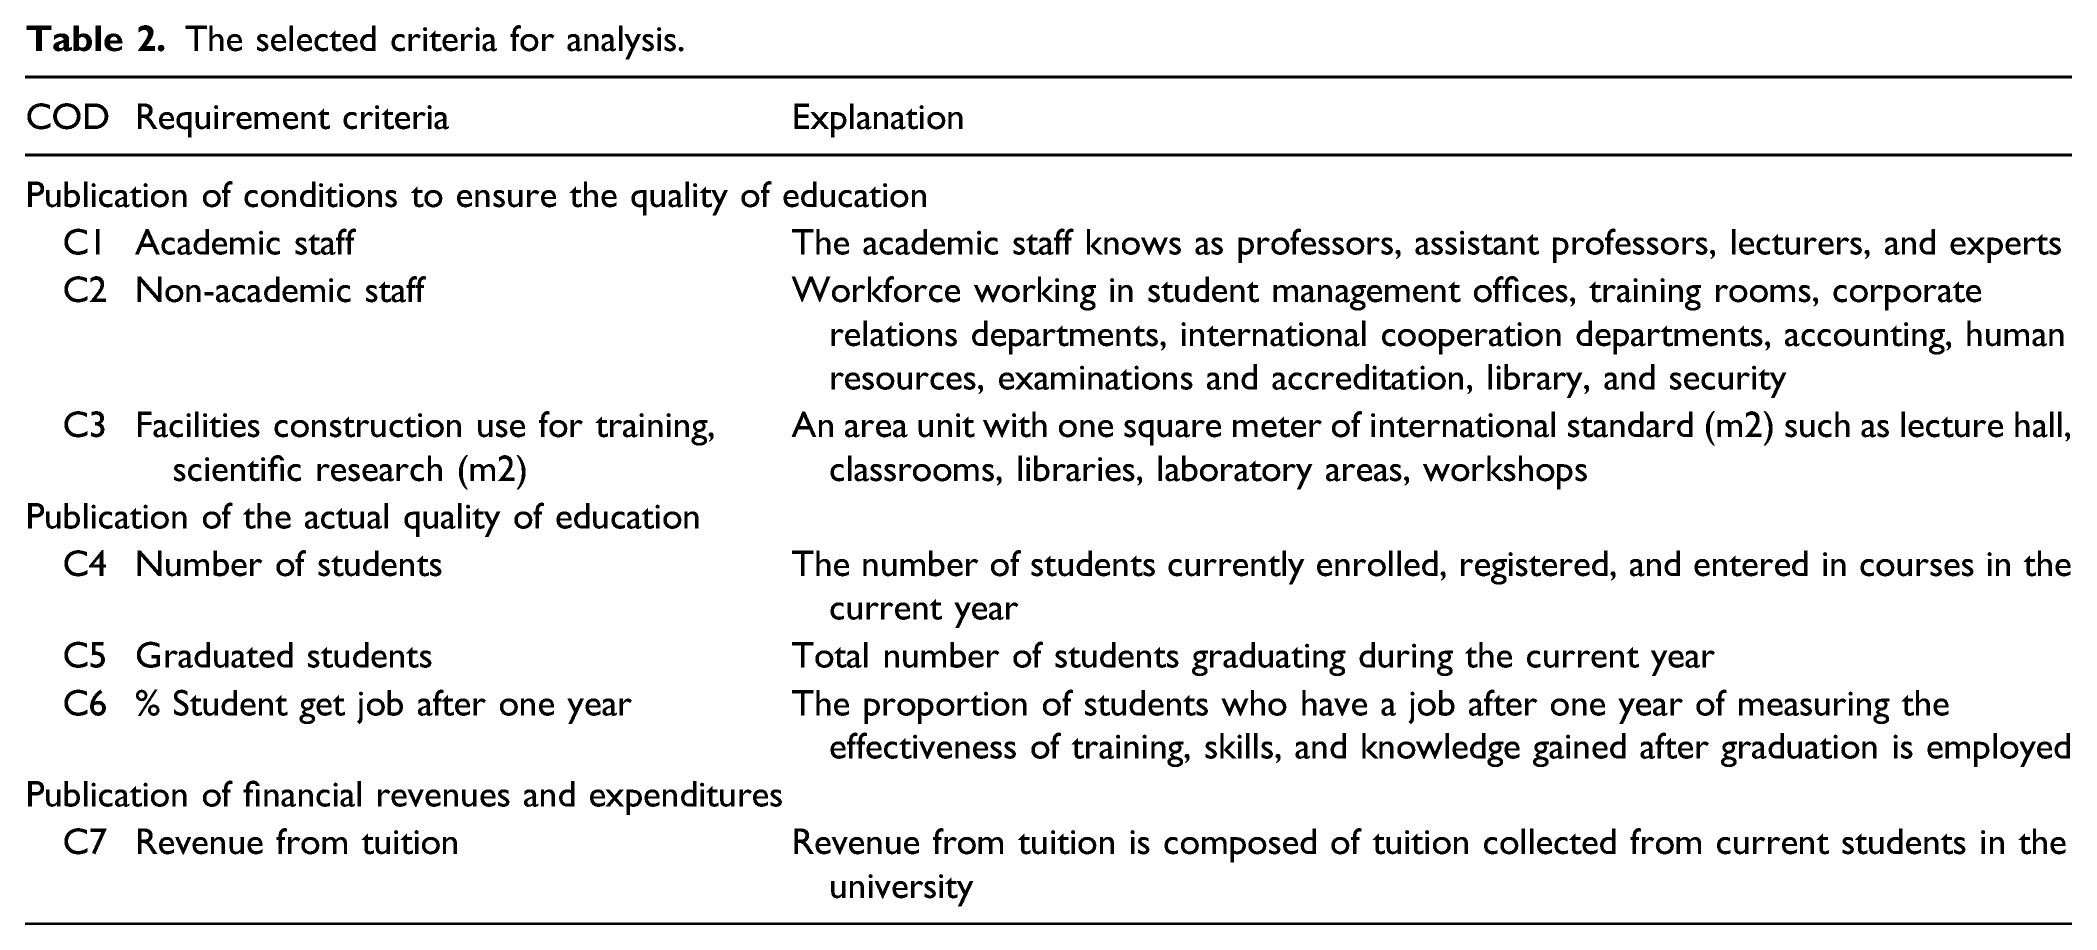
the group of authors choosing standards in the evaluation process include: Academic staff (C1), Non-academic staff (C2), Facilities construction use for training, scientific research (m2) (C3), Number of students (C4), Graduated students (C5),% Student get job after one year (C6), Revenue from tuition (C7). See Table 2 for details. This study selects the criteria suitable for the operational model process: teaching effectiveness and revenue efficiency.
7,66
For teaching effectiveness, the input of this activity is Academic staff, Non-academic staff, and Facilities. The output is three factors: number of students enrolled at the school, number of graduates, and % of students having a job. These three factors are also inputs to the university's revenue efficiency, see Figure 2.
The selected criteria for analysis.
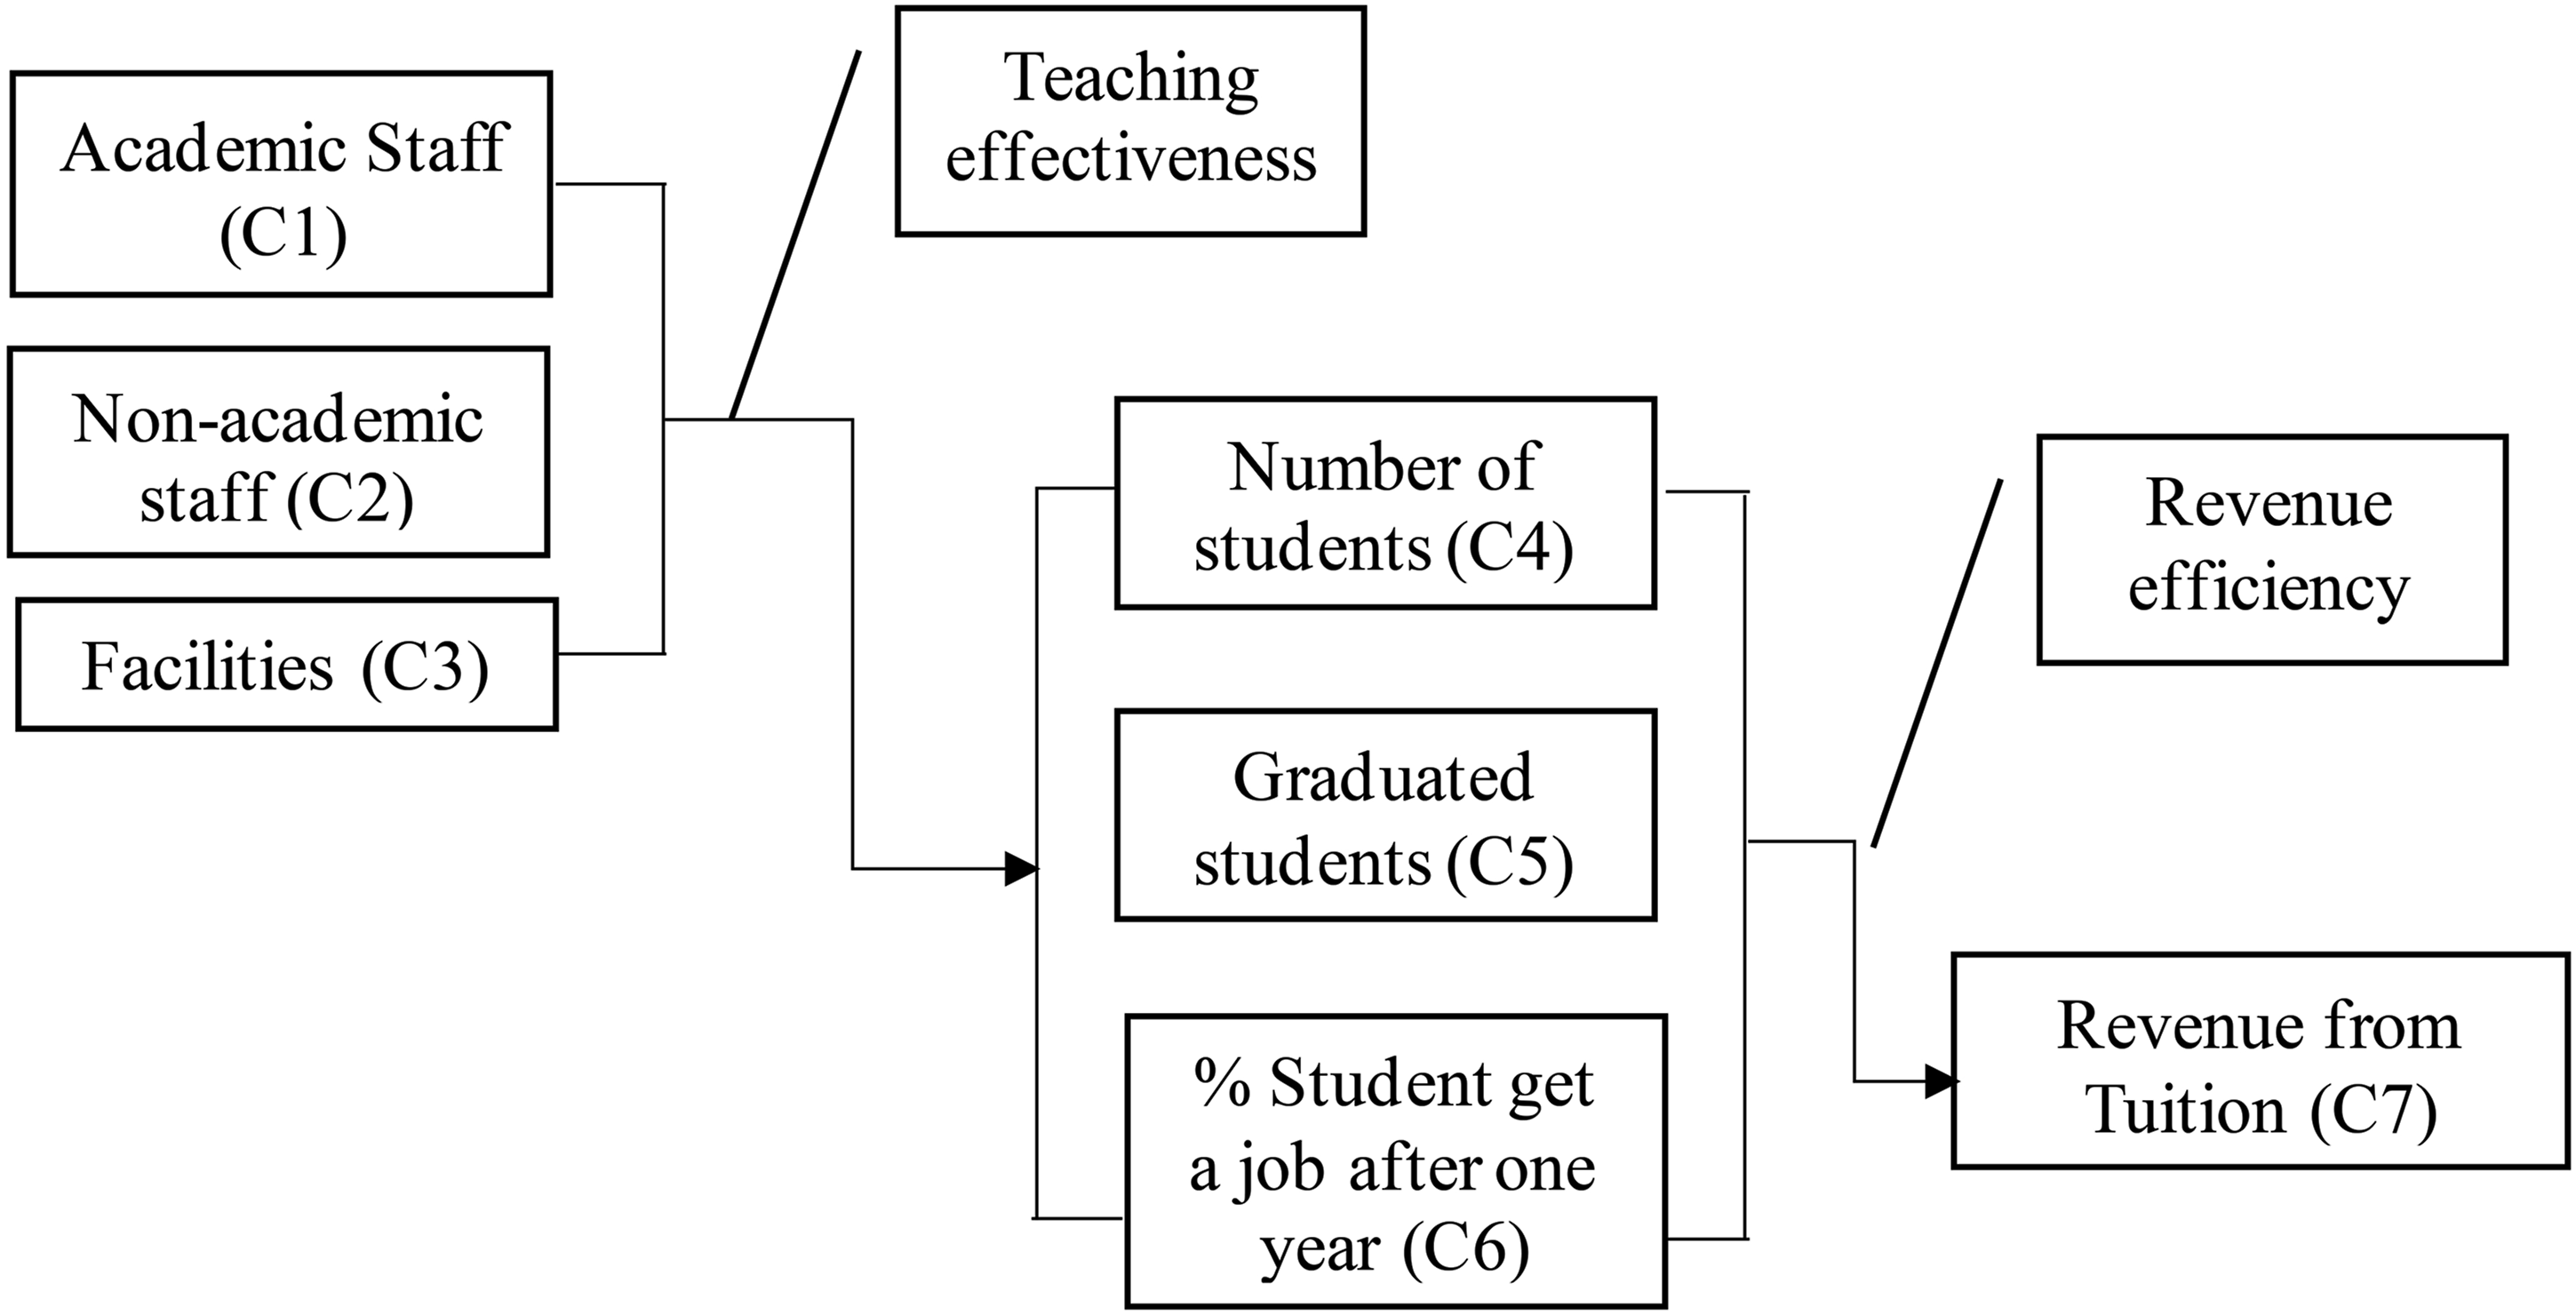
Teaching effectiveness and Revenue efficiency.
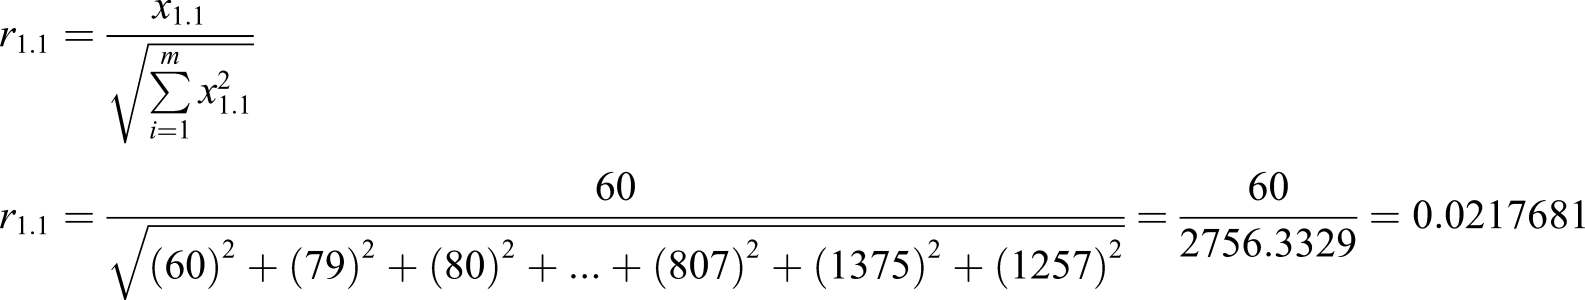
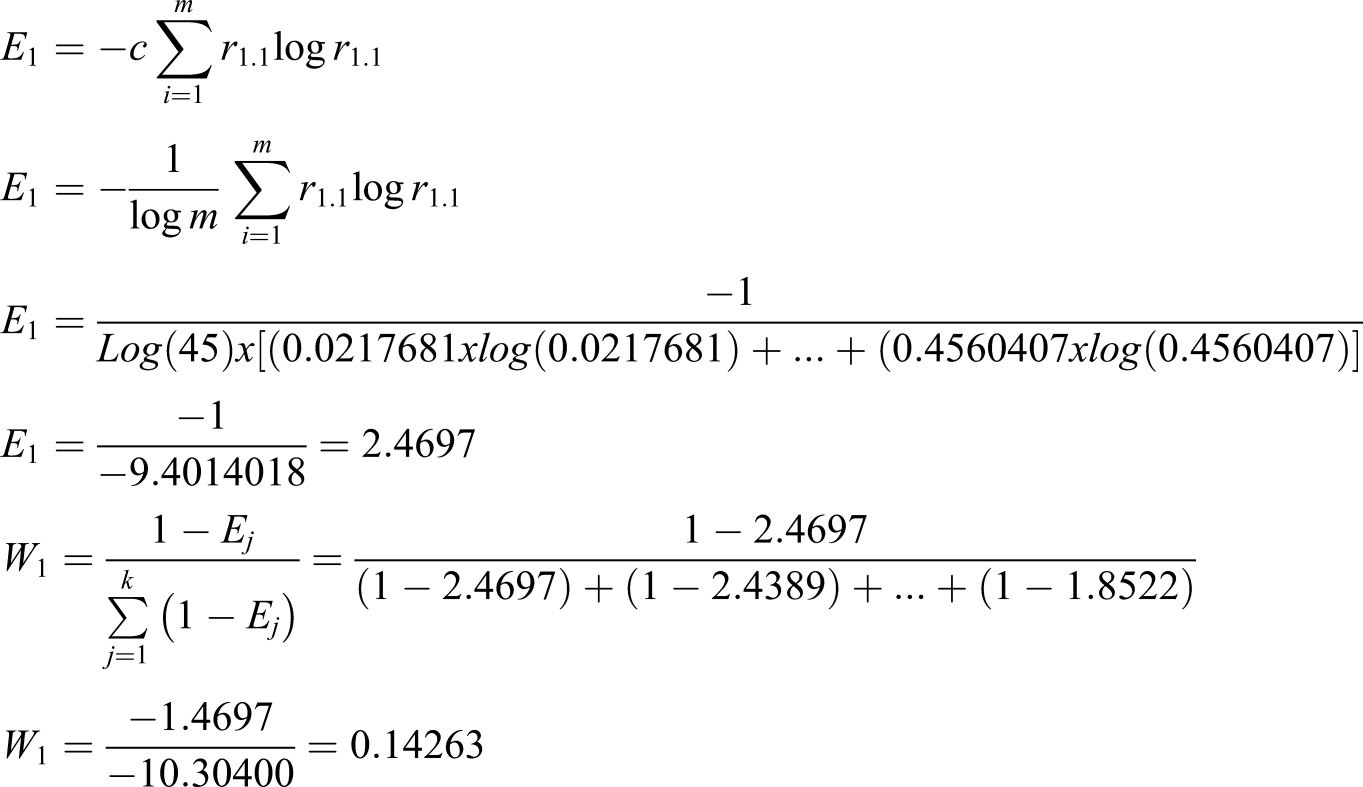
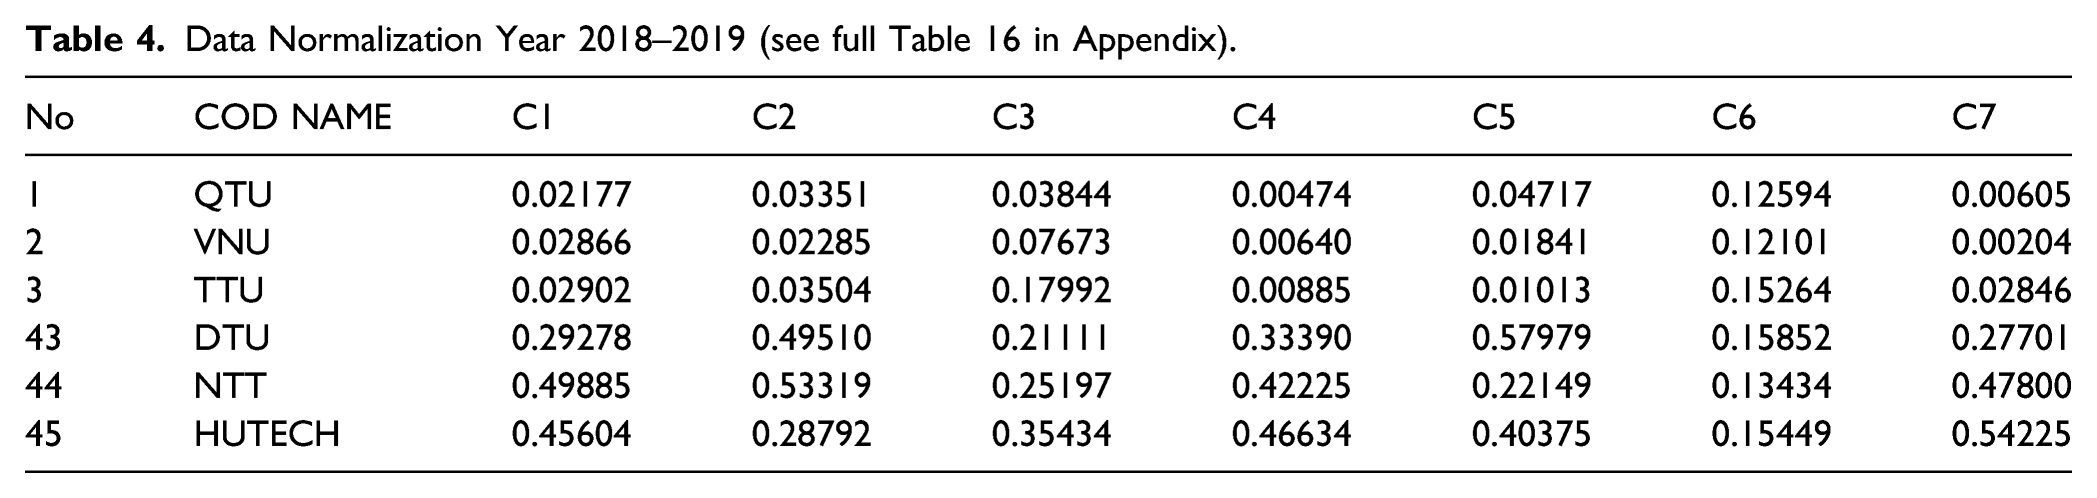
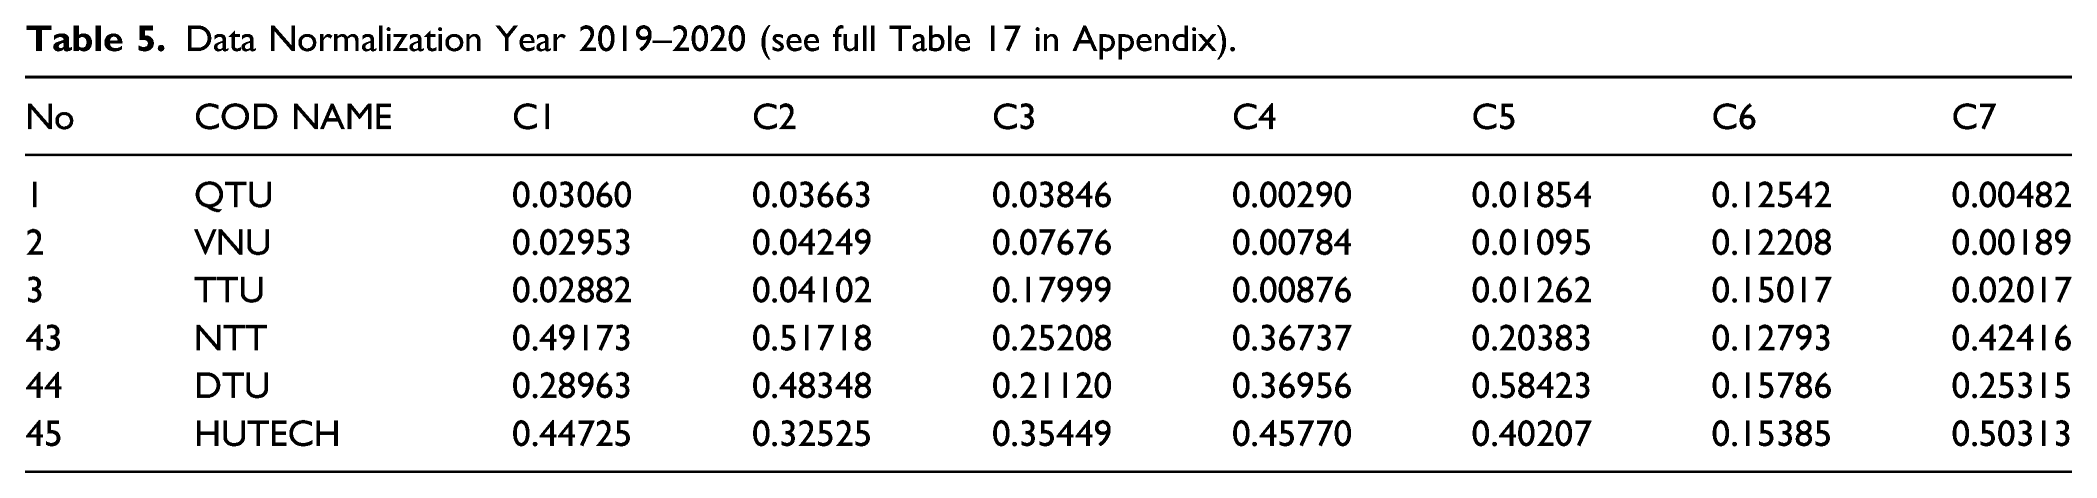
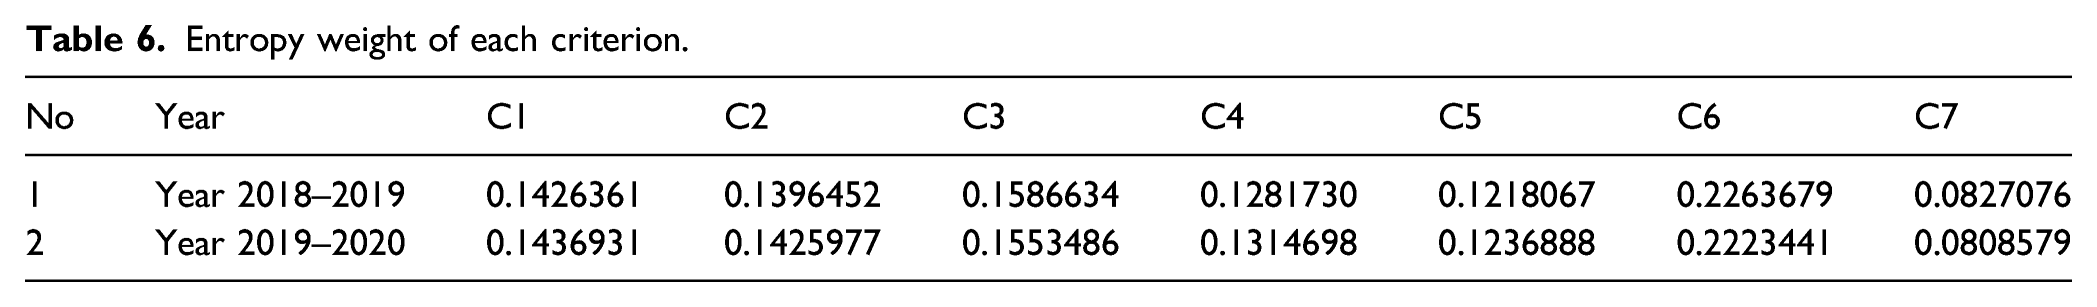
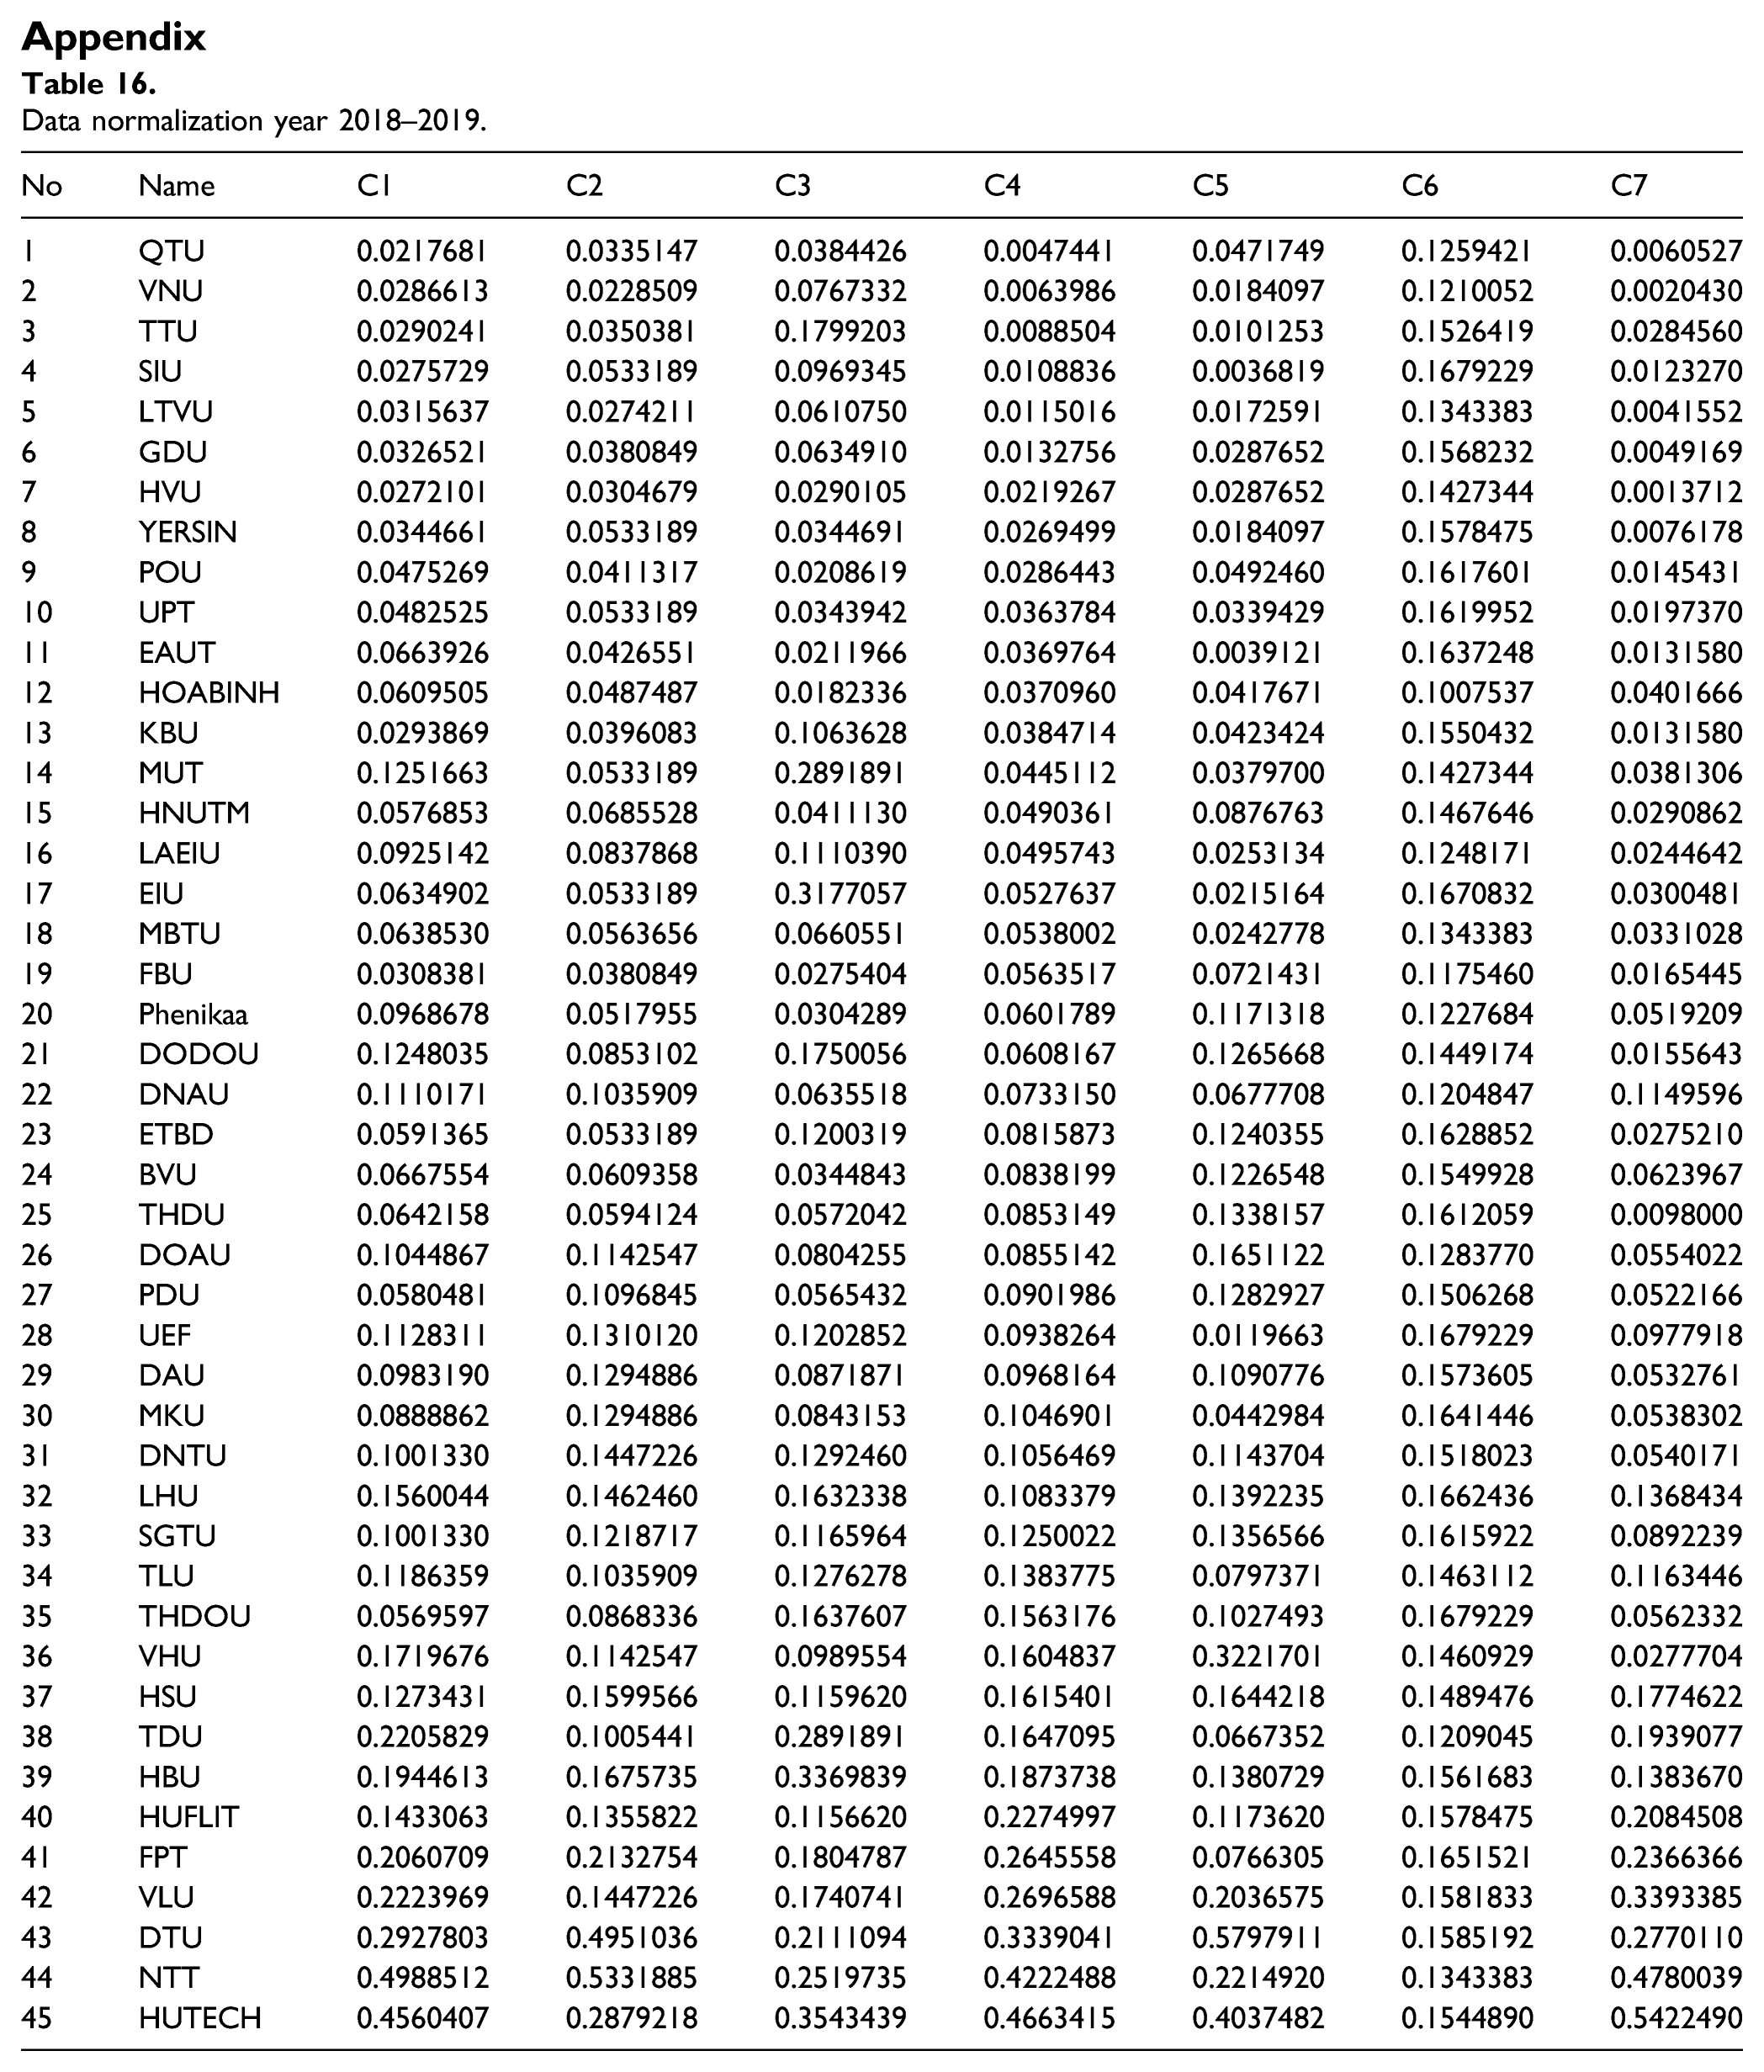
Determine the weight of the evaluation criteria. a. Present the original decision matrix. In this study, there are 45 universities (alternatives: Ai, i= 1, 2, 3…45), seven criteria (criteria Cj, j=1, 2, 3…,7) for evaluation. The original matrix is set in Table 3 for 45 universities and seven criteria. b. Normalization of research data. Each criterion has its heterogeneous unit that can be used for a general analysis. In applying TOPSIS, it is characteristic that the raw data normalization is suitable for eliminating outliers with different units of measure and scale in several statistical analysis methods. The initial decision matrix should be standardized using equations (1) and (2), and the normalized matrix is shown in Table 4 for the academic year 2018–2019 and Table 5 for the academic year 2019–2020. For further clarification, an instance is shown as follows According to equations (3) and (4) we can calculate the Entropy weight. Looking the Table 6 to see the Entropy weight of seven criteria and example as below
Performance of 45 private universities.
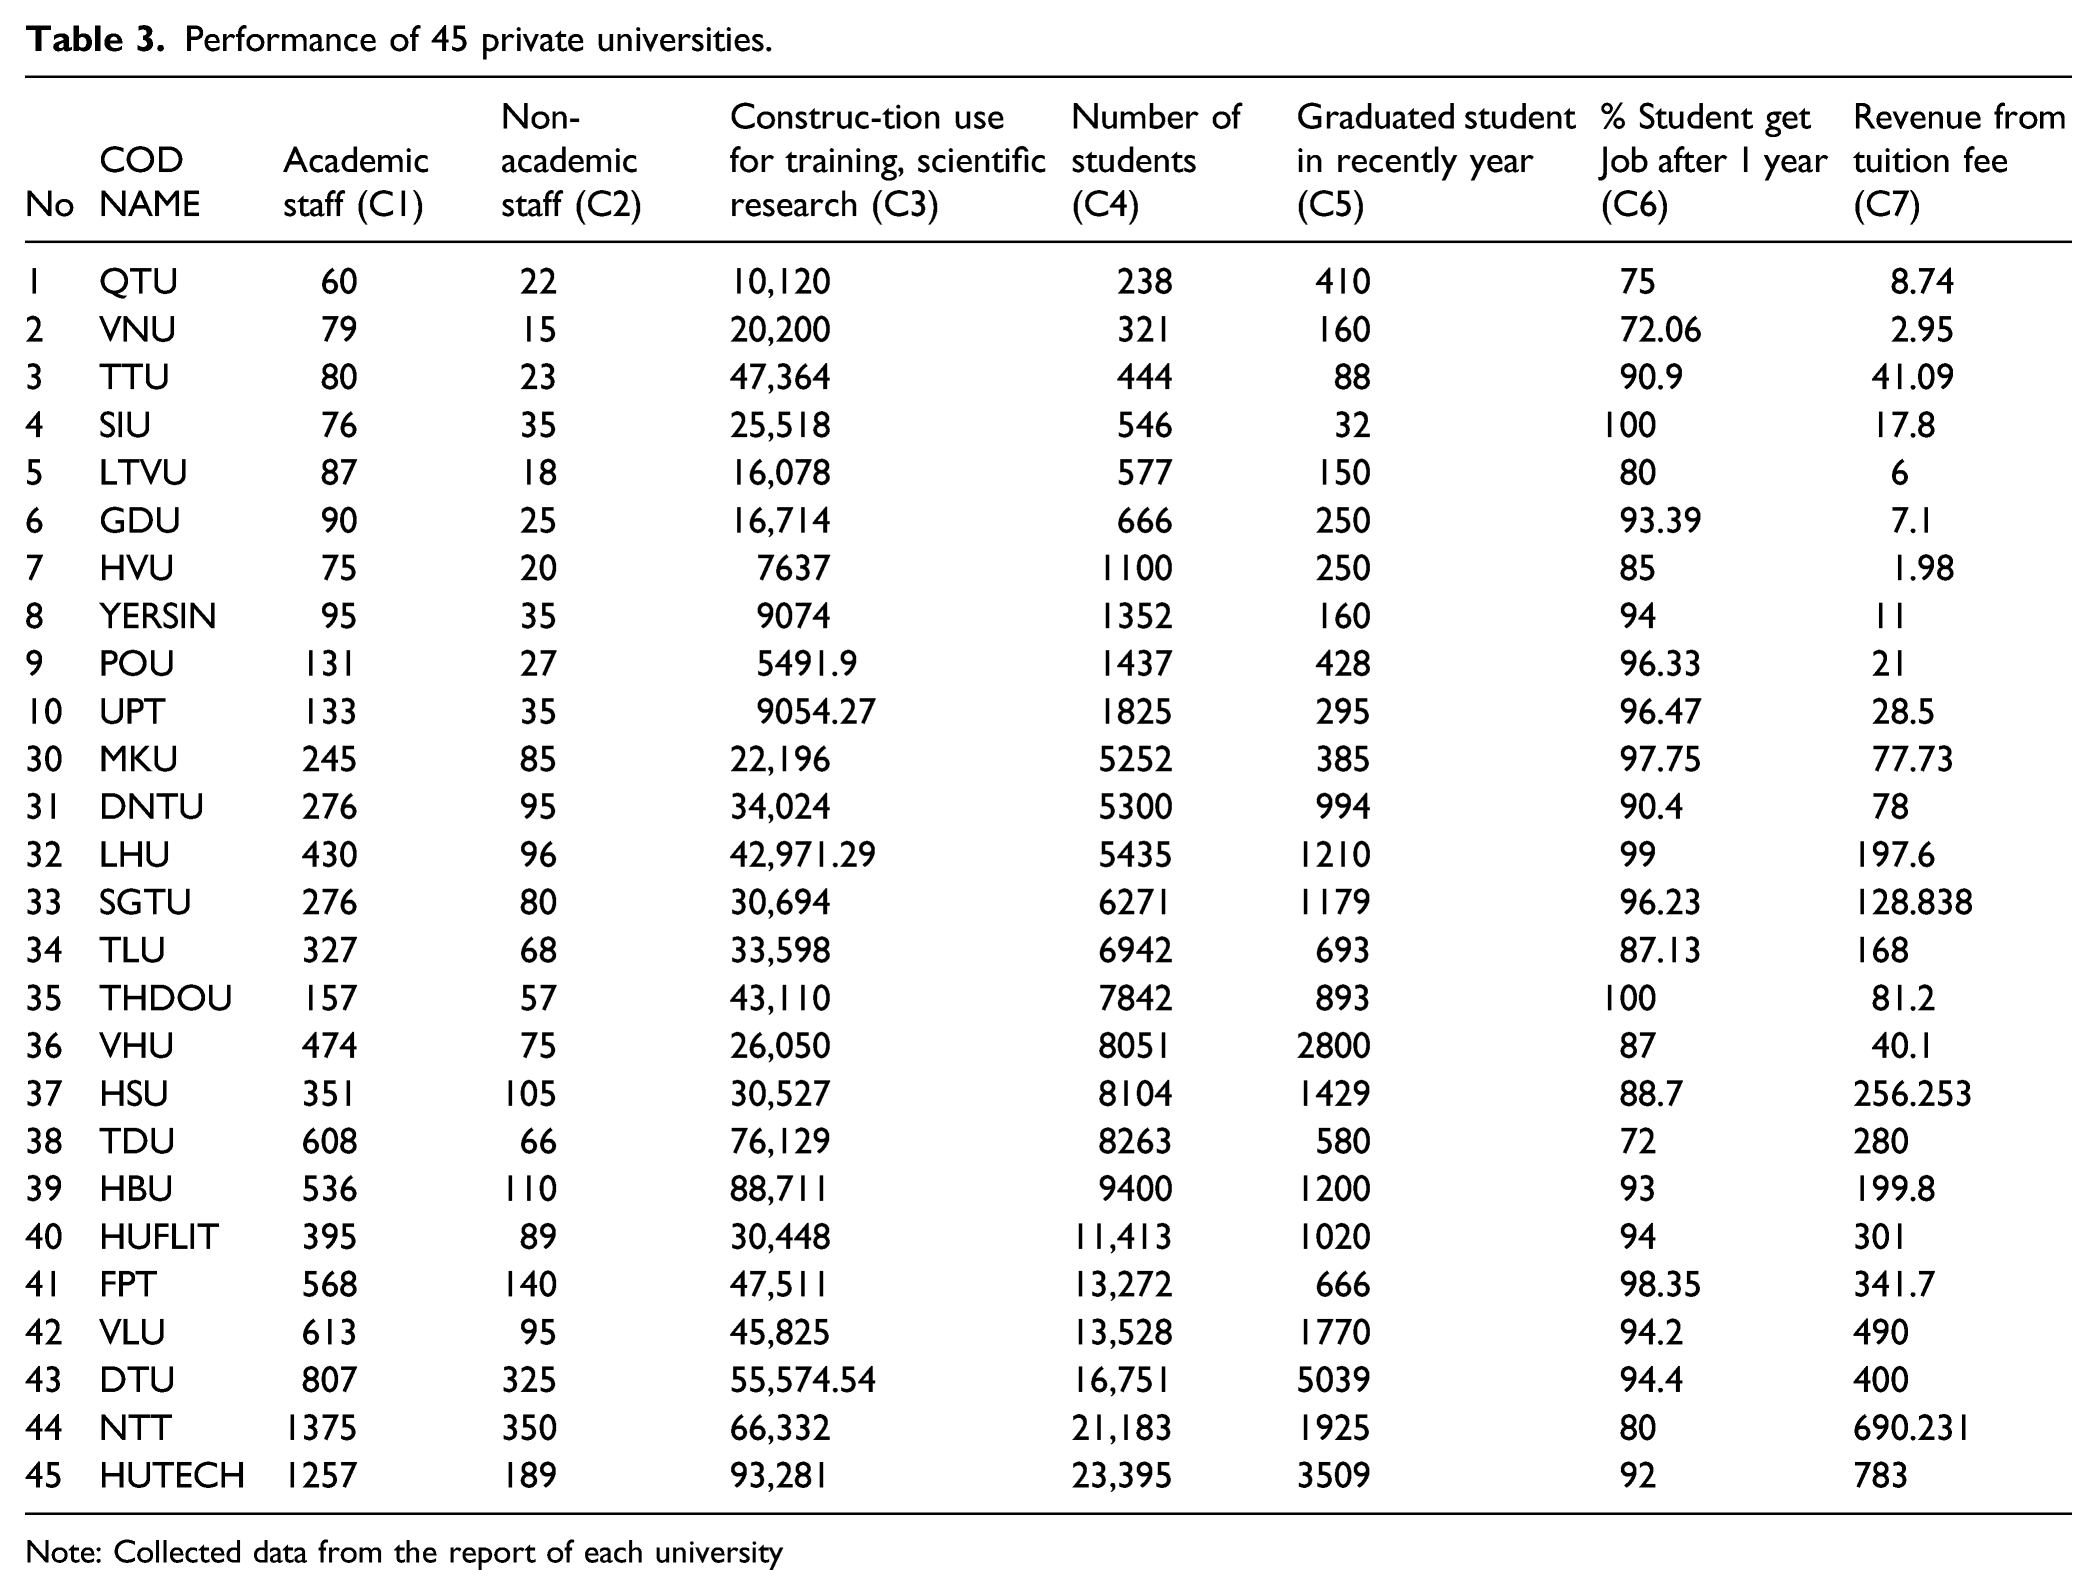
Note: Collected data from the report of each university
Data Normalization Year 2018–2019 (see full Table 16 in Appendix).
Data Normalization Year 2019–2020 (see full Table 17 in Appendix).
Entropy weight of each criterion.
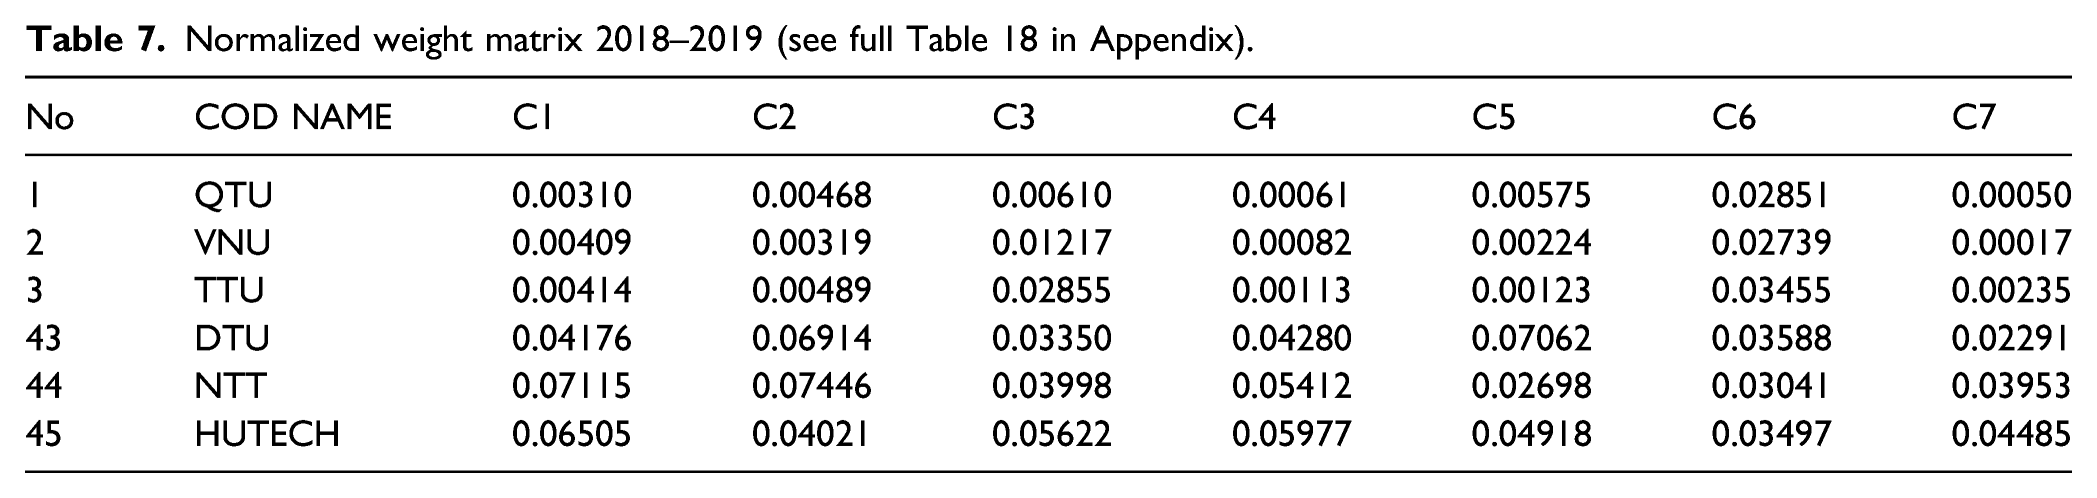
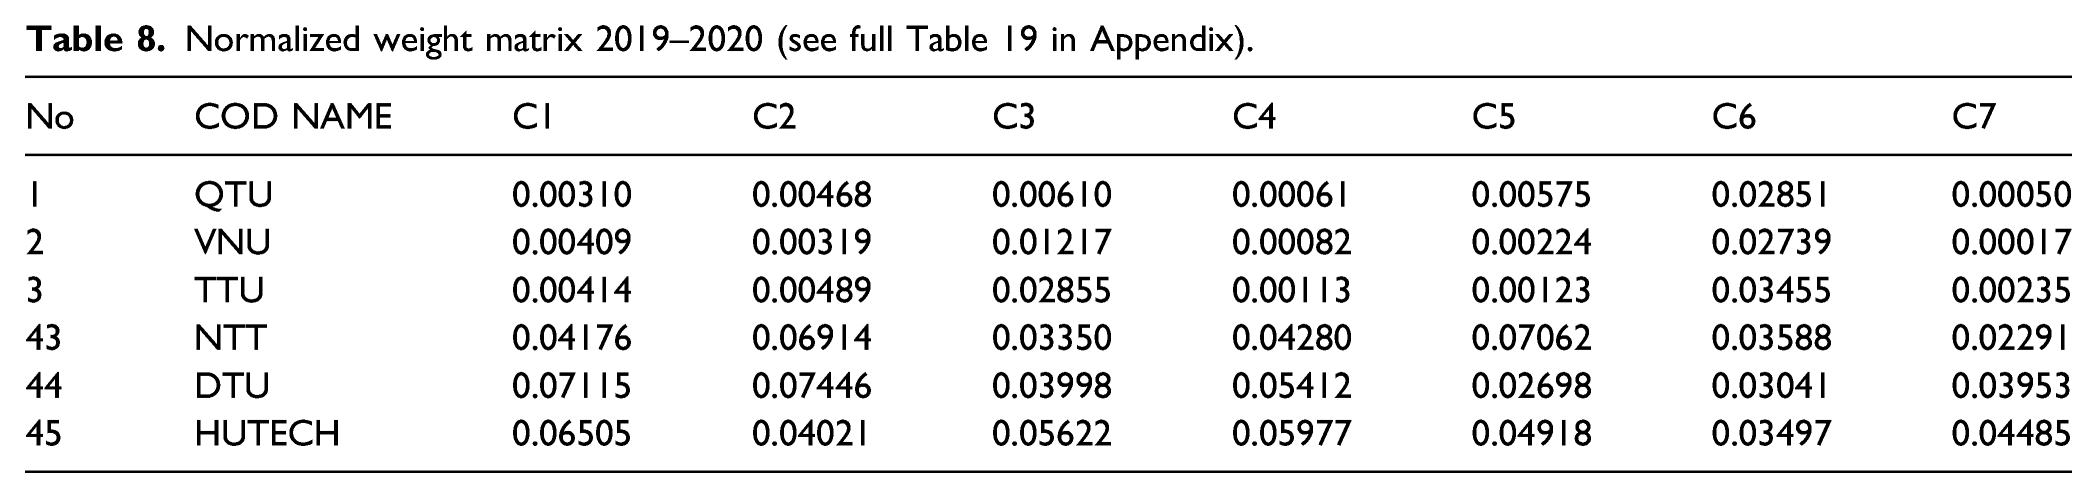
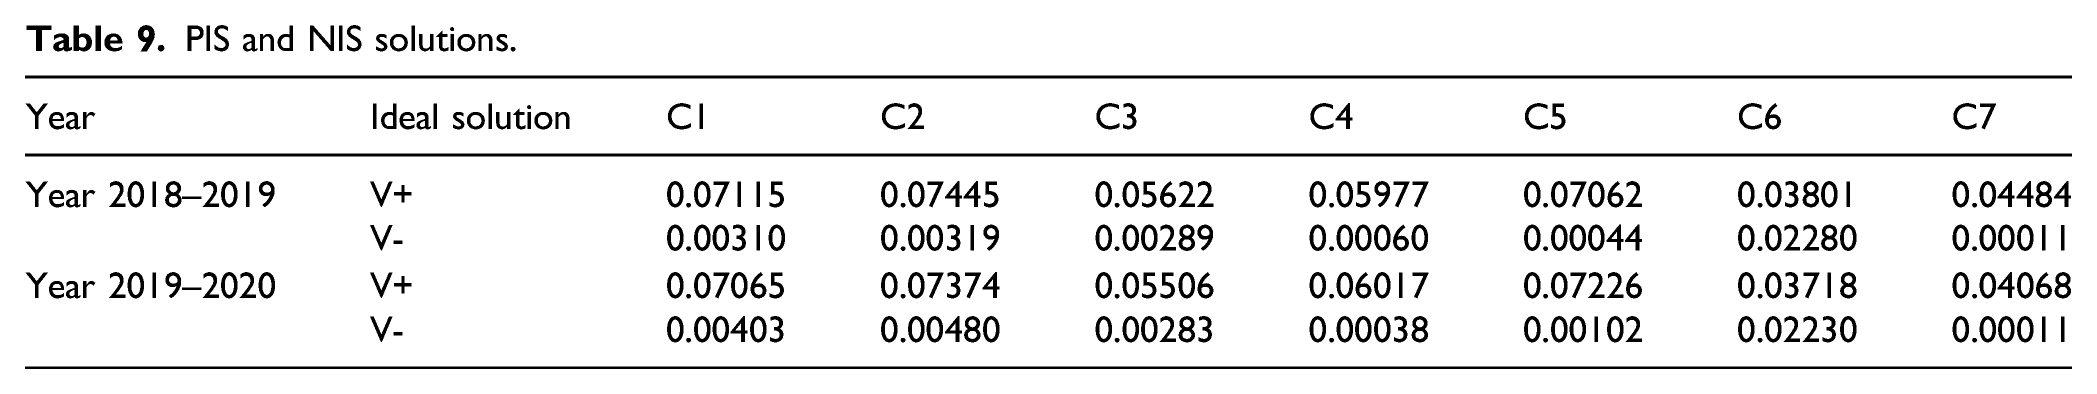
Processing TOPSIS Method a. Constructing normalized weight matrix From the equation b. Seek positive ideal solution and negative ideal solution Base on the equations (6) and (7), the positive ideal solution (PIS) V+ and the negative ideal solution (PIS) V- are presented in Table 9. c. Calculate the separation measure positive-ideal one From equation (8)
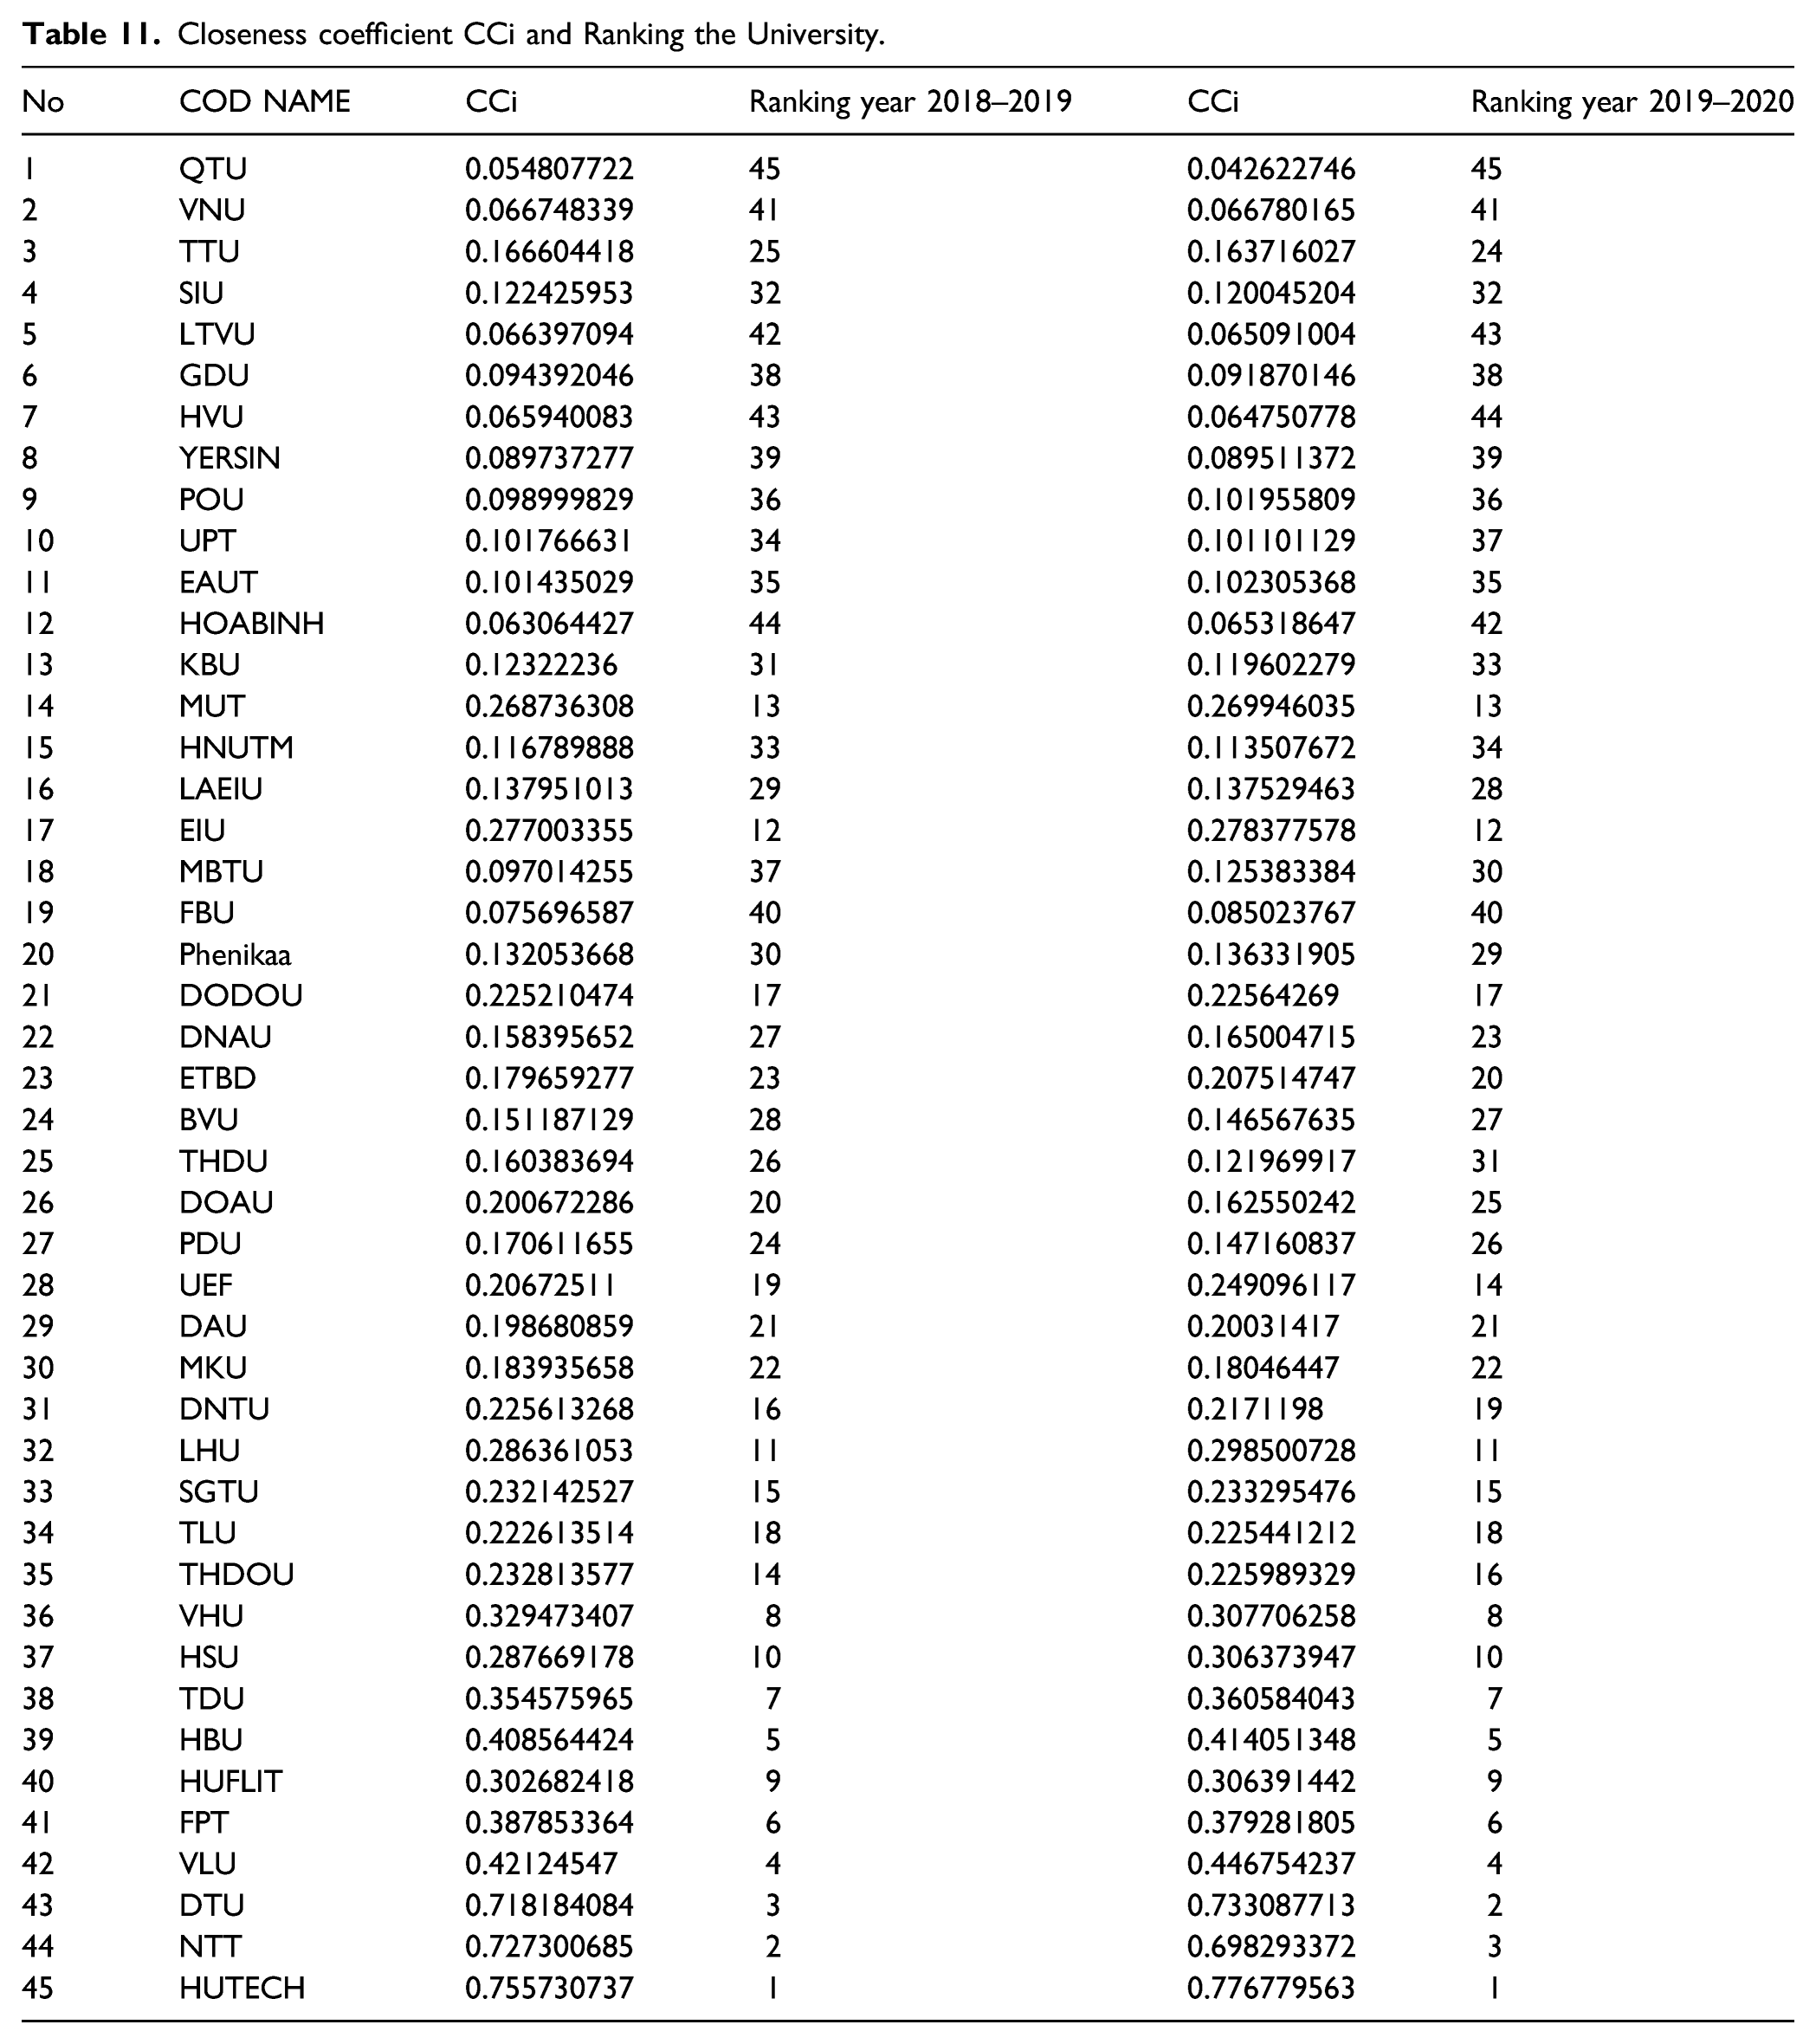
d. Calculate the relative closeness coefficient to the ideal solution According to equation (10), the closeness coefficient CCi was calculated and presented in Table 11. The CC1 as an example As the results are evident in Table 11, we favor the initial results consistent with their relative proximity to the ideal solution. Therefore, the rankings of the universities are shown as follows:
Normalized weight matrix 2018–2019 (see full Table 18 in Appendix).
Normalized weight matrix 2019–2020 (see full Table 19 in Appendix).
PIS and NIS solutions.
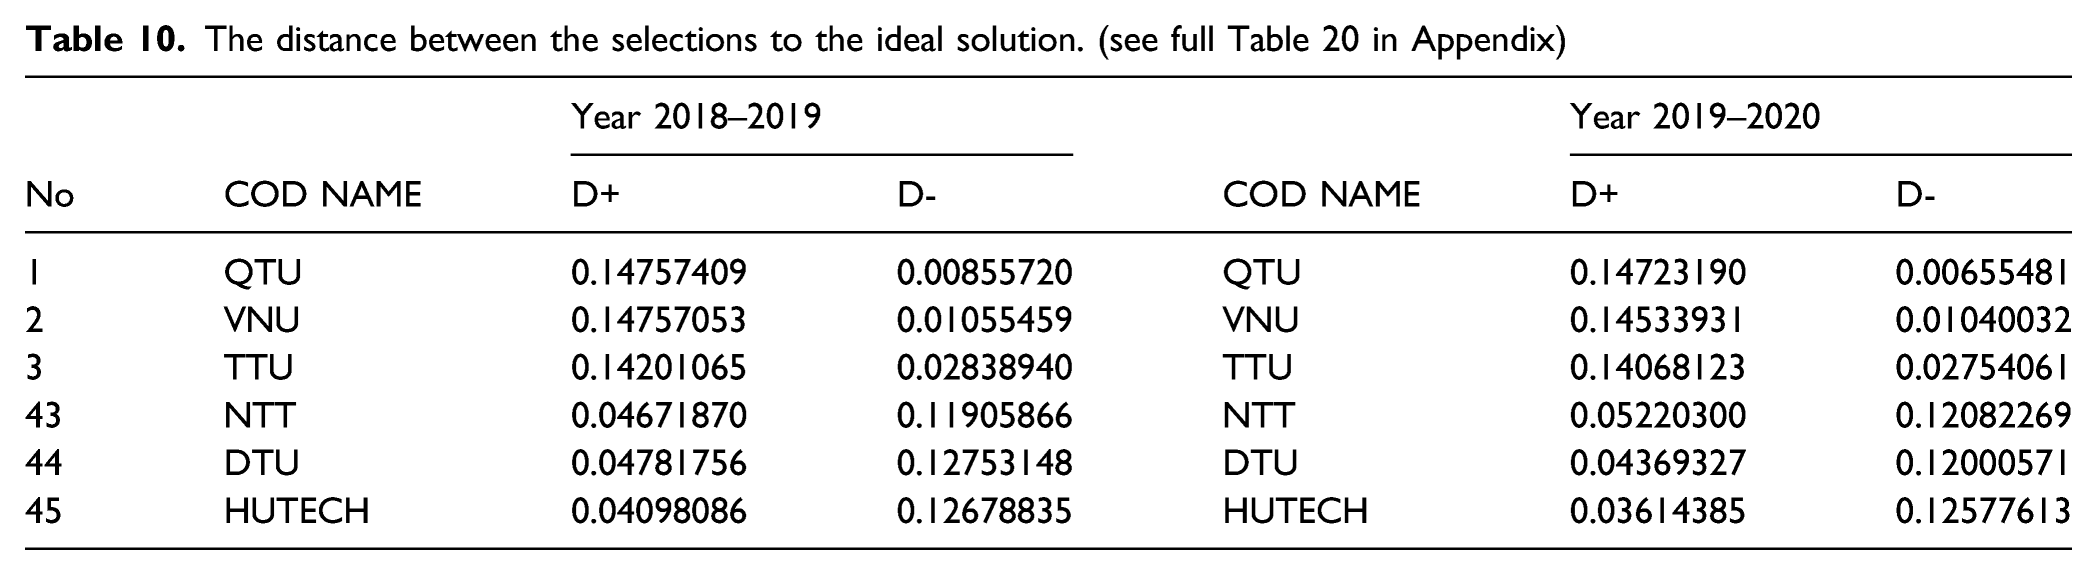
The distance between the selections to the ideal solution. (see full Table 20 in Appendix)
Closeness coefficient CCi and Ranking the University.
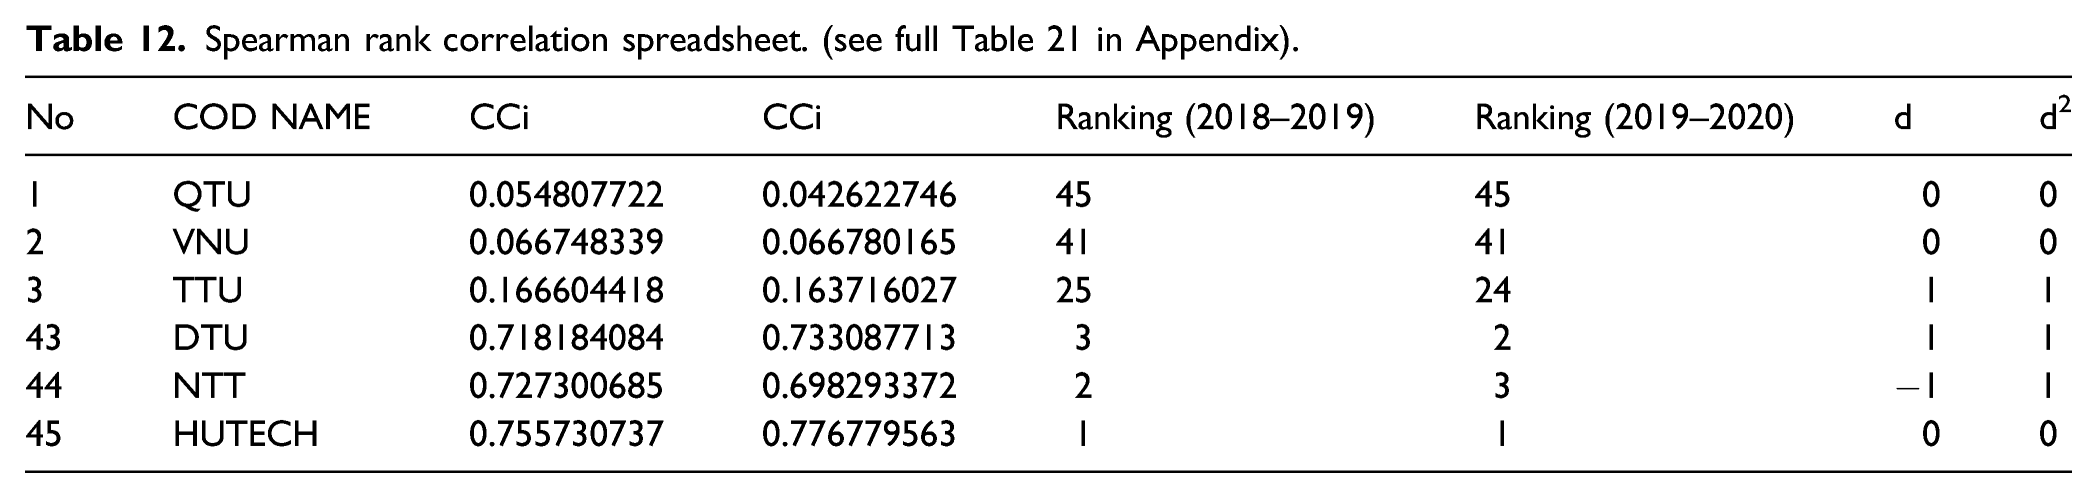
Apply Spearman's rank correlation coefficient By the equation (11). The result of spearman’s rank correlation coefficient between the year 2018–2019 and 2019–2020 showed that, over the past 2 years, the ranking of private universities has changed but not significantly, see Table 12.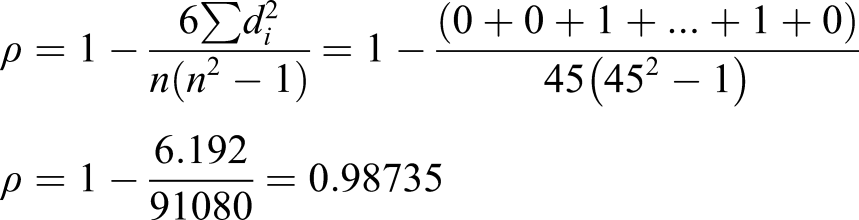
Spearman rank correlation spreadsheet. (see full Table 21 in Appendix).
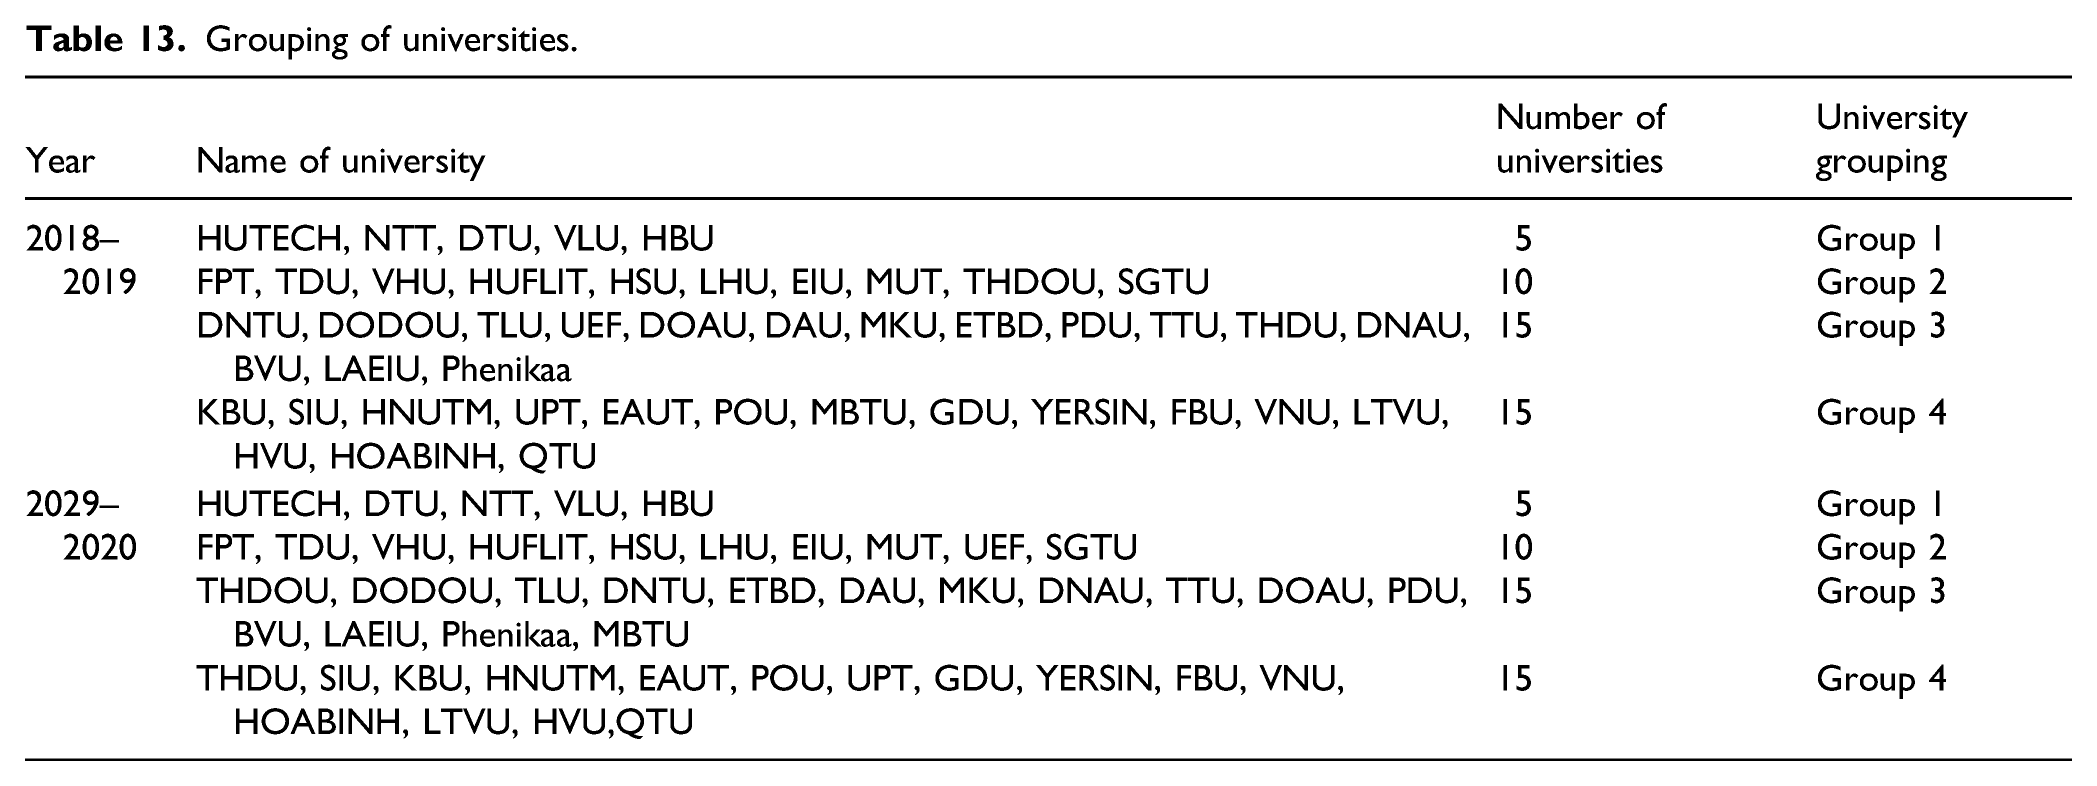
Group the options. Based on the ranking results, private universities are grouped as follows, see Table 13.
Grouping of universities.
ANOVA in-depth analysis comparing standards After ranking the universities according to the teaching effectiveness, groups of schools were divided, and four (4) groups were formed each academic year. In the next step, ANOVA analysis is applied to find the criteria with statistically significant differences. Then, to discover which performance was better at the same cluster level, the Duncan Post hoc test was performed. Results are presented in Tables 14 and 15. a. General performance through seven analytical criteria Non-significant differences Criteria. Of the seven analytical criteria, % of students who had a job after one year was non-significant differences criteria; all groups had similar quality levels for 2 years; specifically, the ANOVA results as follows (F = 1.004, p = 0.402), (F = 0.753, p = 0.526) (see Tables 14 and 15) respectively. Significant differences criteria One-way ANOVA results show significant differences for the remaining six (6) criteria over the two school years 2018–2019, 2019–2020 respectively as follows: the Academic Staff (F =39.465, p < 0.001), (F = 41.655, p < 0.001); the Non-Academic Staff (F = 24.284, p < 0.001), (F = 27.789, p < 0.001); the Facilities construction use for training-scientific research (m2) (F = 24.977, p < 0.001), (F = 23.242, p < 0.001); the Number of Students (F = 47.313, p < 0.001), (F = 51.608, p < 0.001); the Graduated Student in recently year (F = 16.622, p < 0.001), (F = 16.479, p< 0.001); the Revenue from Tuition (F = 35.352, p < 0.001), (F = 39.975, p < 0.001) (see Tables 14 and 15); There exists a significant performance gap between 4 (four) clusters. This means that the quality of education of private universities has changed over 2 years. ANOVA analysis results show that the values analyzed between the 2 years have different performances. Training assurance conditionality is additional, resulting in different training quality results. Therefore, educational managers need to pay attention to these criteria to operate teaching activities more effectively. The ANOVA theoretically supports identifying statistically distinct criteria for at least one pair of groups; however, it does not indicate differences in specific location between groups. The Duncan Post hoc test is applied in the next step to determine the group performance differences in these individual criteria. b. Point out universities group performance. The Duncan Post hoc test shows the general assessment of the private schools' training performance (see Tables 14 and 15). When applying this method, the levels of the criteria are indicated. Thus, there is a clear comparison between groups of fields. Since benchmarks are built, the low-performing groups can be based on standards to achieve better productivity. A detailed description of the differences of the 6 (six) spending is shown as follows: Academic staff: The teaching team holds an important position in education and imparts knowledge to students. If their teaching works, they give the university credibility. During both academic years, with the highest rankings, group 1 universities achieved optimal performance across groups. Group A2 earned a higher degree than group A3, but there was no significant difference between these two groups. Group A4 has the lowest performance value, so the universities in this group need to improve teaching staff to improve the quality of training. There was no change in the ranks of the groups for the following school year. While group 1 and group 2 increased in performance, groups 3 and 4 did not see significant changes. In this criterion, group A1 is the benchmark for A2 and A3 in the first school year. Likewise, A2 and A3 are the benchmarks for A4. In the second year of school, B1 is the standard for B2. In contrast, B2 is the standard of B3 and B4. Non-academic staff: This team supports a lot of activities in the university besides the academic unit. The group with the highest performance is still group 1. During the two school years, group 1 was the benchmark for groups 2, 3, and 4. Facilities construction use for training, scientific research (m2): This is necessary for the training activities. In the 2018–2019 and 2019-2020 school years, universities still maintain the same facilities, in which group 4 has lower performance than groups 2 and 3. Although groups 2 and 3 are not significantly different, they are the benchmark for group 4. In this criterion, group 1 has the highest performance, group 2, and the remaining groups follow. Number of students: The number of students represents the university's enrolment ability. Students will enroll if the school has good training quality. In addition, training programs are tailored to students' competencies. Over the 2 years of study, the groups with the number of students have increased. There was a significant difference between groups, specifically group 1 performed better than group 2, then group 3, then group 4. Therefore, A1, B1 is the benchmark for A2, B2. A2, B2 are the benchmarks for A3, B3, and A3, and B3 is the benchmark for A4 and B4. Graduate student in a recent year: The number of graduates shows the training quality of the institution when they ensure the correct output for students. In addition, it also demonstrates the student's learning ability. In the 2018–2019 school year, group A1 performed the best with the highest number of graduates compared to the rest. Groups A2 and A3 achieve the average value. However, A2 has better performance. The lowest is group A4. From that, we can say, A1 is the standard for groups A2 and A3. Besides, A2 and A3 are the standards for A4. During the following school year, performance groups increased but not significantly. Similar to Year 1, B1 is still the standard for B2 and B3. B2, B3 are the standard for B4. Revenue from tuition: The revenue from tuition fees also demonstrates the effectiveness of the training activity. An increase in the number of students leads to an increase in tuition revenue. In this criterion, group 1 still holds the highest position. This is inevitable because, in other criteria, group 1 has high efficiency. Next comes group 2. Then comes groups 3 and 4. Thus, A1 is the benchmark for A2. A2 is the standard for A3 and A4. Likewise, B1 is the standard for B2. B2 is the standard for B3 and B4. The Duncan Post hoc test helps to see the differences in performance between university groups and criteria. Making a comparison between groups of universities will help leaders know the university's position. From there, they make a development effort. A comparison between the criteria shows which groups of universities perform well and which criteria perform poorly for improvement. After applying the research model to evaluate Viet Nam private universities, the following finding showed: Based on the entropy approach, different criteria were determined for the target weights, the results of which are shown in Table 6. For the criteria affecting teaching effectiveness are shown, Academic staff (0.142) (0.143), Non-academic staff (0.139) (0.142), Facilities construction (0.158) (0.155), Number of students (0.128), (0.131) Graduated students (0.121) (0.123), % Student get job (0.226) (0.222), and Revenue from tuition (0.082) (0.080) for the two academic years 2018–2019 and 2019–2020, respectively. The criteria are all weighted insignificant in the next school year. Educational activities have changed but not strongly between the years. Private universities consider the impact of the criteria to operate. The finding from calculating the closeness coefficient for the ideal solution gave the value of 45 private universities. From that result, the ranking of the fields is done. The university with the highest closeness coefficient value (0.7557) of the year 2018–2019; (0.7767) of the year 2019–2020 ranked first and the lowest (0.0548) of the year 2018–2019 (0.0426) of the year 2019–2020 entered in the last place. The ranking correlation coefficient results between 2018–2019 and 2019–2020 in Table 11 show that the rankings of private universities have changed but not significantly in the past 2 years. The values of the criteria did not change much over one school year. Based on the coherence coefficient values and ratings for private universities regarding teaching effectiveness and revenue performance in Table 11, universities were classified into four groups in Table 13. The results show that five universities ranked from first to fifth place in group 1, 10 universities ranked from sixth to 15th place in group 2, 15 universities organized from 16th to 30th place in group 3, and the remaining 15 universities are in group 4. ANOVA analysis is applied to find the criteria with statistically significant differences. In which, % of students who had a job after one year was non-significant differences criteria when this rate is statistically similar in universities. The remaining criteria are all important differences criteria. ANOVA analysis results show that the values analyzed between the 2 years have different performances. Then, to discover which performance was better at the same group level, the Duncan Post hoc test was performed. Results are presented in Tables 14 and 15. Seeing that, group 1 with a set of high-ranked universities all have high-valued criteria as the benchmark for the remaining groups. Group 2 with the universities reaching the average value also becomes the benchmark for groups 3 and 4.
ANOVA and duncan post hoc test result for the year 2018–2019.
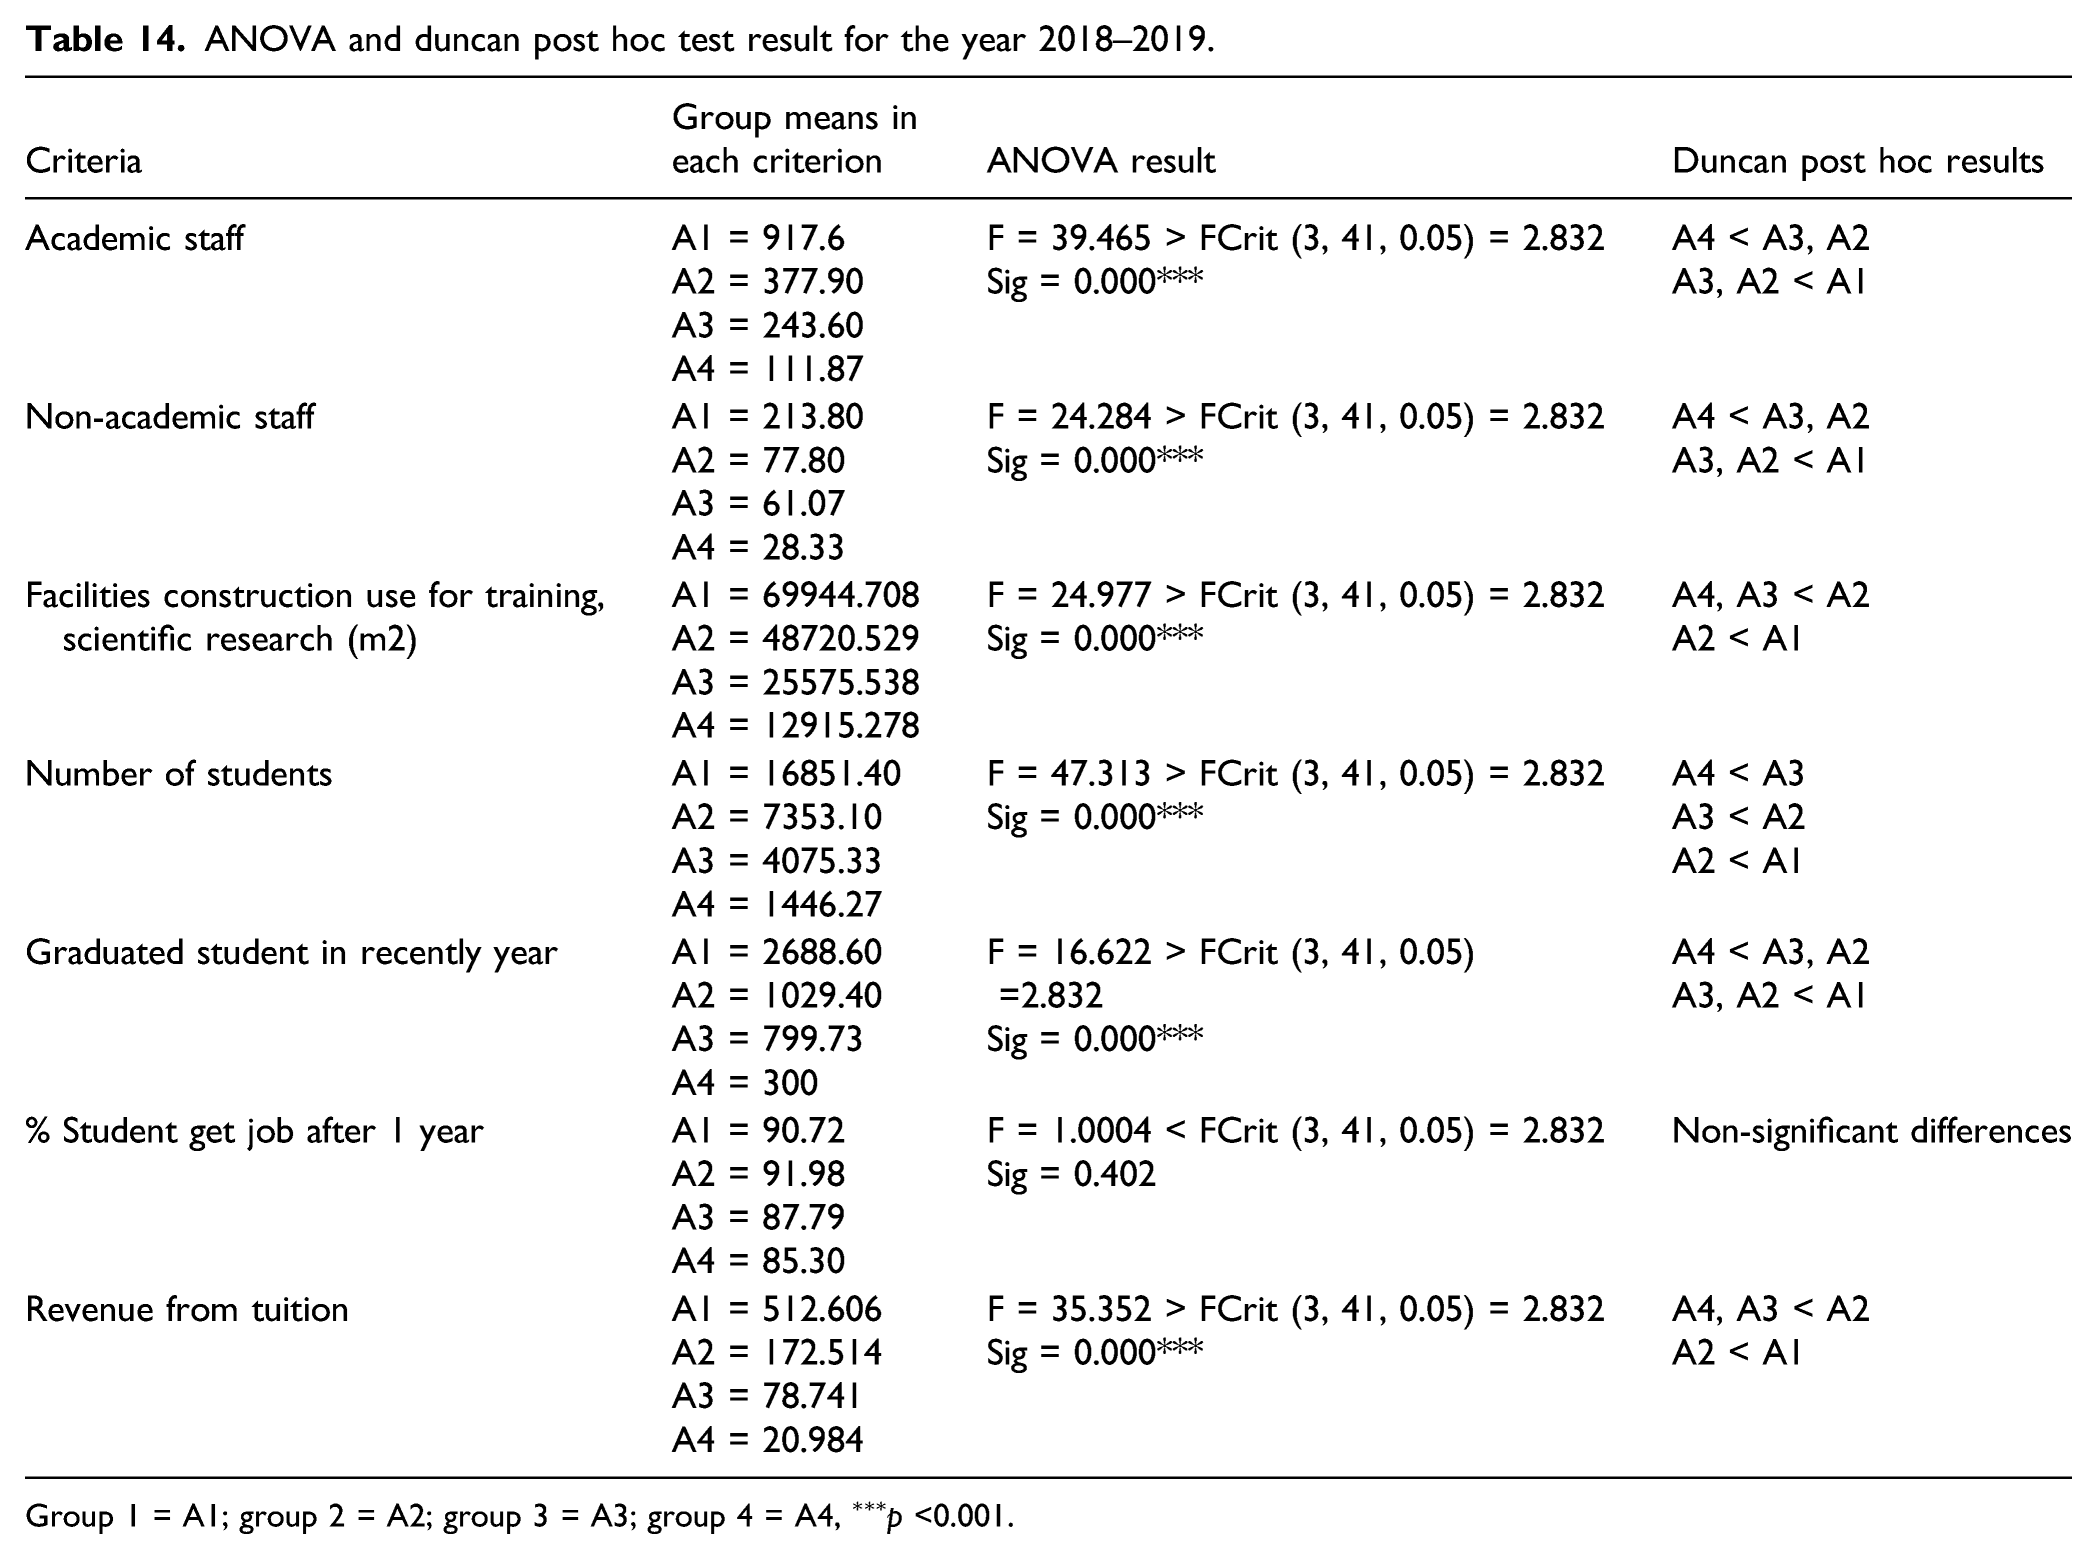
Group 1 = A1; group 2 = A2; group 3 = A3; group 4 = A4, ∗∗∗ p <0.001.
ANOVA and duncan post hoc test result for the year 2019–2020.
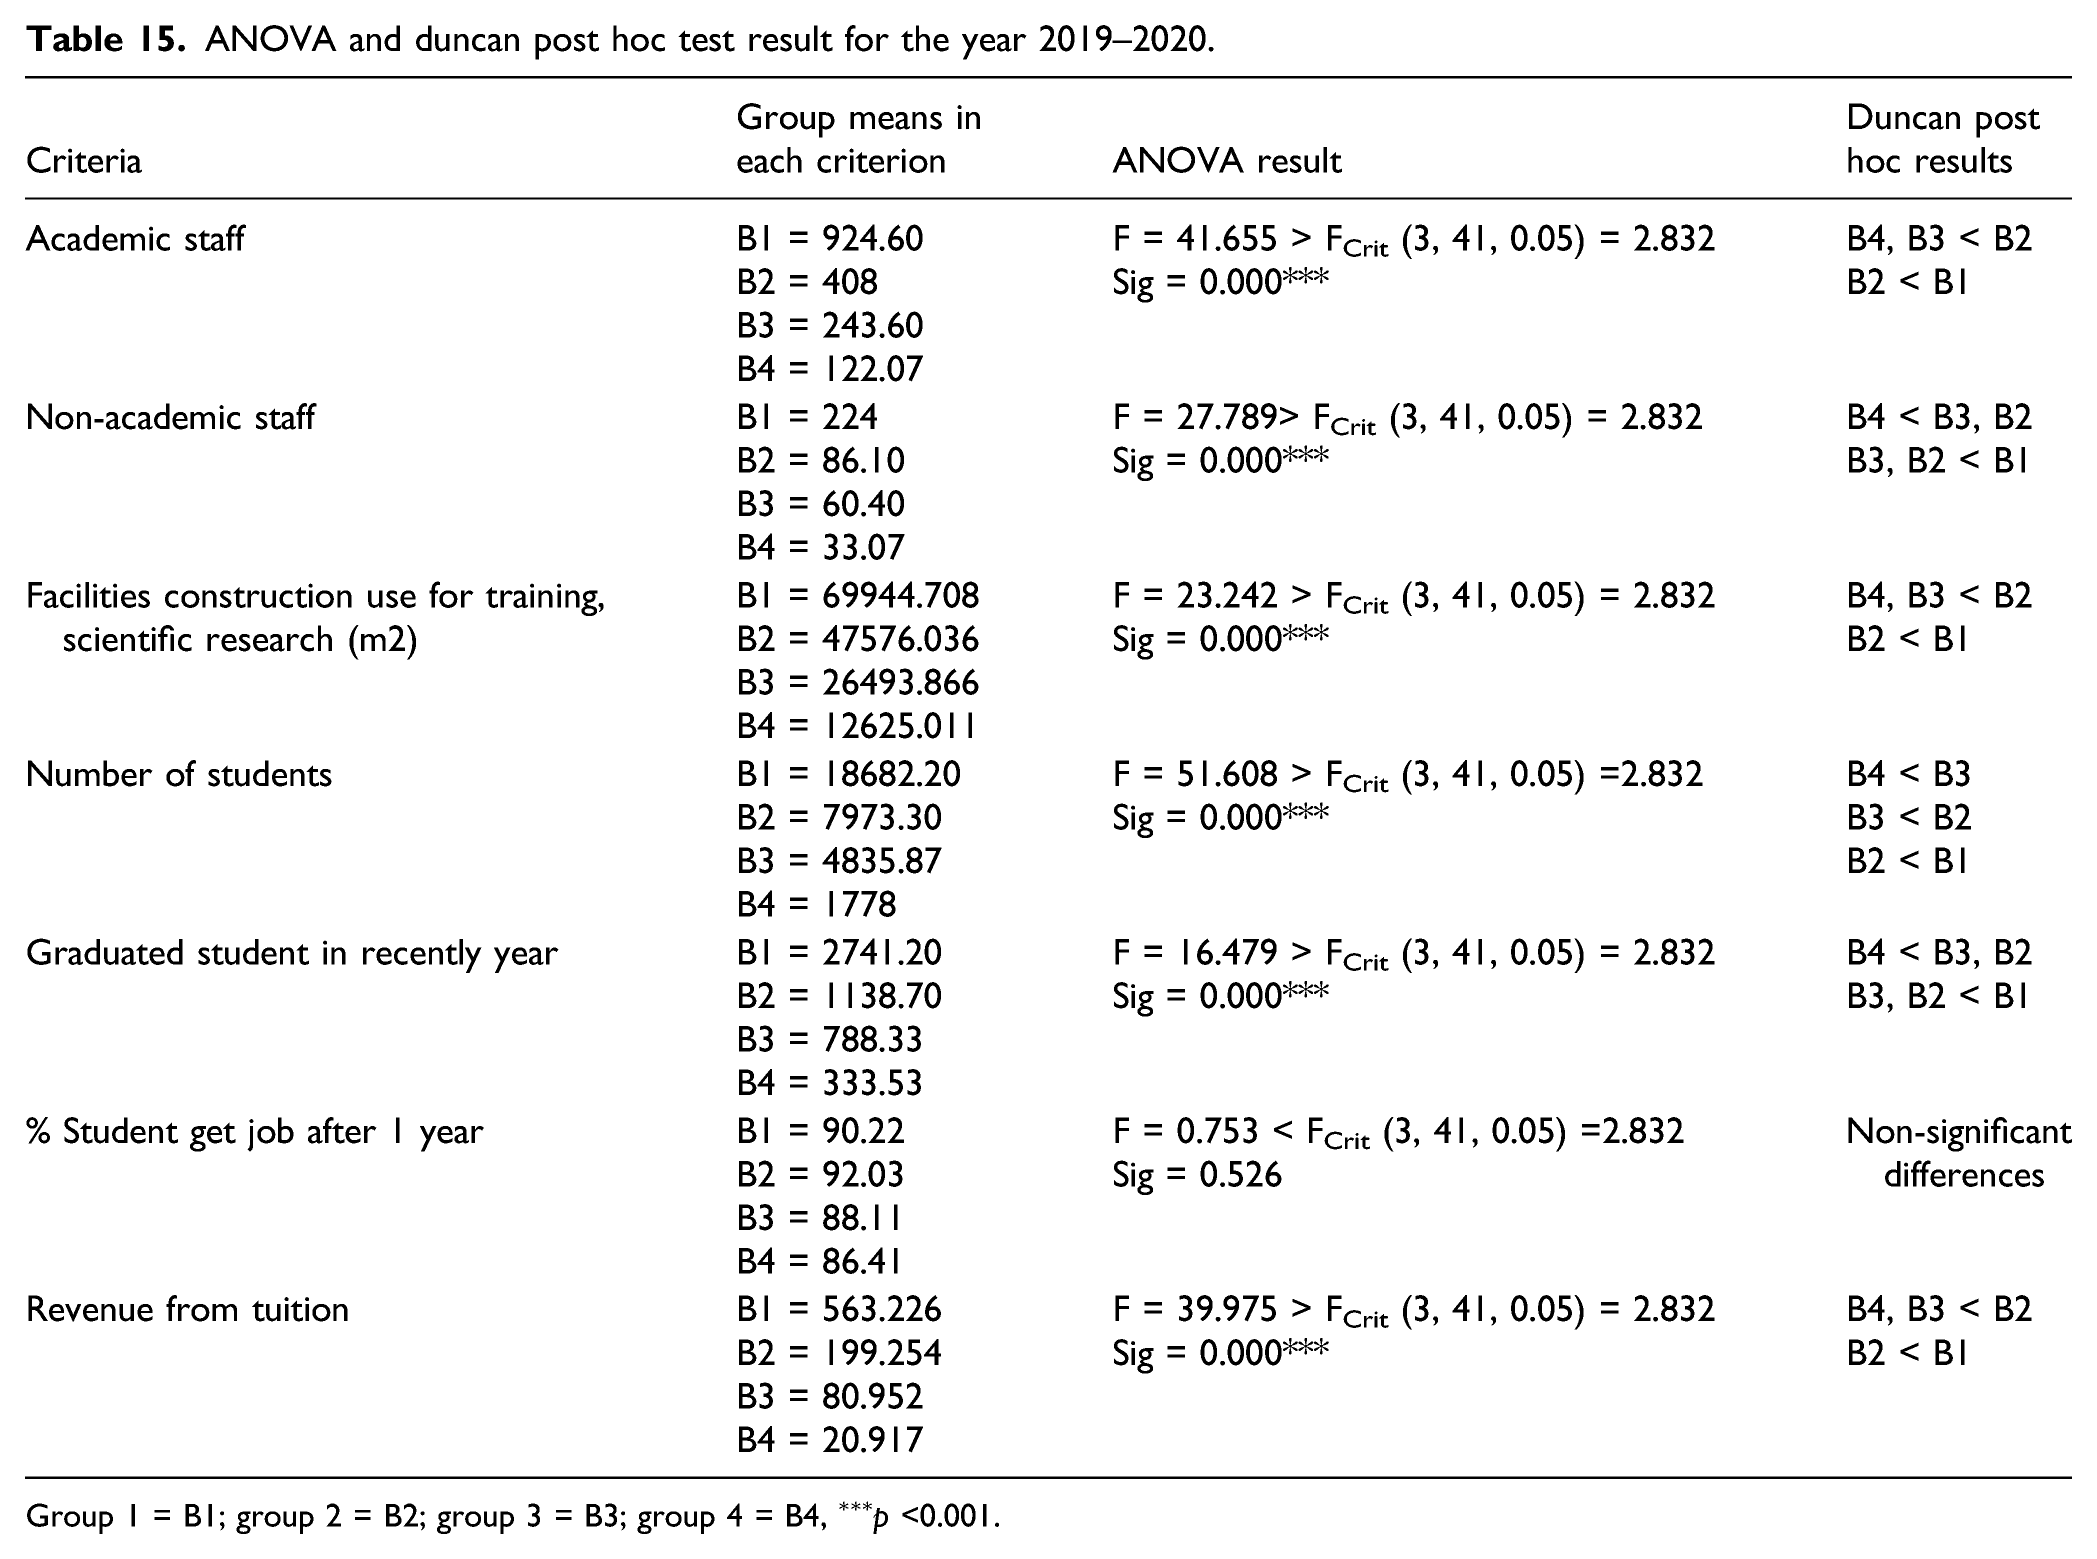
Group 1 = B1; group 2 = B2; group 3 = B3; group 4 = B4, ∗∗∗ p <0.001.
Discussion and recommendation
Viet Nam private and public universities have differences in management systems. That affects the quantity and quality of enrollment, the number of students, tuition fees, facilities, and the quality of training. Therefore, for the analysis to have objective results, this study chooses to analyze private universities separately.
University groups have insignificant changes in the adjacent academic years. Universities still maintain a level of development in teaching – training effectiveness. However, the development between private universities is not uniform. Universities in large cities and have been established a long time tend to be more developed and benchmarked for those universities in the province with lower criteria. Therefore, when choosing private schools to enroll in, students tend to choose a more prominent and quality one.
As mentioned in the literature review, there are many different methods used to analyze performance and decision-making. Recent studies on the evaluation of higher education performance in Vietnam are mainly based on the DEA method. In this method, the authors analyze input and output variables to examine which determinants significantly affect their performance. For benchmarking studies, universities are classified and ranked by region to select and compare groups of universities. In this study, the influencing criteria were analyzed, and the universities were ranked first. Then the comparison of the criteria is made later.
More importantly, through the results by determining the different levels of quality performance between groups and the criteria differ significantly, the authors give objective recommendations to educational managers as follows:
Firstly, it is related to increasing the size of the private university system. For the university, it is necessary to identify essential criteria for improvement. The number and quality of academic staff need to increase to match the university's training volume and contribute to the operation, scientific research, and technology transfer. Besides, the appropriate selection of non-academic staff is also one of the school leaders' requirements because this team can support a lot in the university's administration. Since all the departments have smooth coordination, the university's executive operations became well-executed. The conditions to ensure the quality of training must include the facilities. The university focuses on constructing a convenient classroom system, libraries, research rooms, and practice rooms to motivate teachers and students in learning and teaching. The above three criteria are also inputs to produce useful outputs that promote scientific research, maintaining and improving the quantity and quality of the international publication, and large numbers of students and the number of graduates on track. Thanks to the grouping after ranking results and the benchmarking formula, state education managers can select private universities according to the development strategy to invest in finance or land to expand the scale of the university's purpose.
Secondly is regard to planning and investing in the development of many crucial private universities. The high-performance groups' results were seen as the benchmark for the lower performing schools showed that applying the support model (Grouping-ANOVA-Duncan post hoc test) can help us easily assign the focus groups and under-standard groups. Educational administrators can use this approach to review new potential universities and select universities with high planning and development productivity.
Third, it is necessary to promote the competitiveness of private universities. From the benchmark results, university leaders can view the university's actual training activities for others in the same field or region to make a competitive strategy in the right direction. Based on the statistical analysis, the different significant criteria were indicated. At this time, the university will compare factors that should be promoted to increase productivity, focusing on investment or vice versa.
Conclusion
In the paper, we have established a higher education performance evaluation system by introducing a research model, including the Entropy weight-based TOPSIS method that calculated the weight and entropy of seven criteria. Then, we combined Spearman's assessment and applied deep ANOVA analysis with Duncan's post hoc test to compare the effectiveness of criteria and find out the benchmark. Finally, to make the model more realistic and popular, we analyzed 45 Vietnamese private universities, presenting data for two consecutive academic years.
Through the analysis results in the two academic years, 2018–2019 and 2019–2020, 45 private universities are ranked based on teaching capacity and revenue efficiency. Four groups of universities were collected based on the rankings. These groups possess important criteria, such as Academic staff, Non-academic staff, Facilities for training - scientific research (m2), Number of students, Graduate student in recent years, Revenue from tuition. After being a statistic, the fundamental differences in productivity between these groups can be easily indicated for each criterion. Then, analyzing Duncan's post hoc test helped see the groups that perform better and those that are not effective. Based on that result, under the same criterion, the groups with good performance are recommended to be standard for the lower performing groups. In addition, this standard is also the target for the following school years.
The advantages of the research method in this paper are reflected in several aspects such as specific data analysis process, weighted criteria, and subjects ranked for favorable classification. In addition, the criteria are compared and evaluated against each other. The application of this research model is a useful method to help administrators make decisions scientifically, objectively and limit subjective factors. Education leaders can generally evaluate which universities are performing well, recognize the weaknesses of the private education system based on benchmark analysis. Furthermore, they can see a clear goal to develop in the coming evaluation years. The contribution of this method also helps university leaders have an objective view of the actual training activities of different universities in the same field or region. They can formulate strategies development evenly or improve weak criteria. In addition, this method is also strongly applied in several other fields, such as selecting investment projects, assessing the reliability of the information, and evaluating the quality of products.
On the other hand, this paper also has shortcomings in the analysis. With the proposed model, the grouping of universities is based on the ranking results. This grouping can lead to the wrong universities cluster placement. The study analyzes the training effectiveness of 45 private universities in Vietnam based on seven selected criteria. However, to evaluate operational efficiency, it is advisable to analyze more scientific research effectiveness. Because scientific research activities between universities are not uniform, some universities do not have any international scientific research; therefore, the analytical results are not available when entering the Entropy weight analysis. Furthermore, the study does not analyze all private universities. The number of universities selected is based on fully published data. The research model only evaluates based on the data obtained from the report. Therefore, it does not analyze the factors affecting the ranking, such as reputation, time of establishment, location of construction.
This study was conducted to measure the training performance of Vietnamese private universities. This topic can be considered in public schools in Vietnam and expanded in different countries in future studies. More comprehensive performance measurement studies could be made by including new criteria such as research activity and technology transfer, international academic studies, student satisfaction, international cooperation. The new criteria will create new input and output variables. Qualitative variables such as student satisfaction can use fuzzy TOPSIS, or other fuzzy MCDM methods can be formatted. In future studies, other multi-criteria decision-making methods can be used instead of the TOPSIS method. The cluster method can be applied to group exactly the position of universities. Besides, future research can fully investigate the system of universities when universities simultaneously strictly report publicly to the Ministry of Education and Training. In addition, universities currently do self-assessment reports in more detail, so future research can combine to select robust data with new metrics.
Footnotes
Declaration of conflicting interests
The author(s) declared no potential conflicts of interest with respect to the research, authorship, and/or publication of this article.
Funding
The author(s) received no financial support for the research, authorship, and/or publication of this article.
Appendix
No
Name
C1
C2
C3
C4
C5
C6
C7
1
QTU
0.0217681
0.0335147
0.0384426
0.0047441
0.0471749
0.1259421
0.0060527
2
VNU
0.0286613
0.0228509
0.0767332
0.0063986
0.0184097
0.1210052
0.0020430
3
TTU
0.0290241
0.0350381
0.1799203
0.0088504
0.0101253
0.1526419
0.0284560
4
SIU
0.0275729
0.0533189
0.0969345
0.0108836
0.0036819
0.1679229
0.0123270
5
LTVU
0.0315637
0.0274211
0.0610750
0.0115016
0.0172591
0.1343383
0.0041552
6
GDU
0.0326521
0.0380849
0.0634910
0.0132756
0.0287652
0.1568232
0.0049169
7
HVU
0.0272101
0.0304679
0.0290105
0.0219267
0.0287652
0.1427344
0.0013712
8
YERSIN
0.0344661
0.0533189
0.0344691
0.0269499
0.0184097
0.1578475
0.0076178
9
POU
0.0475269
0.0411317
0.0208619
0.0286443
0.0492460
0.1617601
0.0145431
10
UPT
0.0482525
0.0533189
0.0343942
0.0363784
0.0339429
0.1619952
0.0197370
11
EAUT
0.0663926
0.0426551
0.0211966
0.0369764
0.0039121
0.1637248
0.0131580
12
HOABINH
0.0609505
0.0487487
0.0182336
0.0370960
0.0417671
0.1007537
0.0401666
13
KBU
0.0293869
0.0396083
0.1063628
0.0384714
0.0423424
0.1550432
0.0131580
14
MUT
0.1251663
0.0533189
0.2891891
0.0445112
0.0379700
0.1427344
0.0381306
15
HNUTM
0.0576853
0.0685528
0.0411130
0.0490361
0.0876763
0.1467646
0.0290862
16
LAEIU
0.0925142
0.0837868
0.1110390
0.0495743
0.0253134
0.1248171
0.0244642
17
EIU
0.0634902
0.0533189
0.3177057
0.0527637
0.0215164
0.1670832
0.0300481
18
MBTU
0.0638530
0.0563656
0.0660551
0.0538002
0.0242778
0.1343383
0.0331028
19
FBU
0.0308381
0.0380849
0.0275404
0.0563517
0.0721431
0.1175460
0.0165445
20
Phenikaa
0.0968678
0.0517955
0.0304289
0.0601789
0.1171318
0.1227684
0.0519209
21
DODOU
0.1248035
0.0853102
0.1750056
0.0608167
0.1265668
0.1449174
0.0155643
22
DNAU
0.1110171
0.1035909
0.0635518
0.0733150
0.0677708
0.1204847
0.1149596
23
ETBD
0.0591365
0.0533189
0.1200319
0.0815873
0.1240355
0.1628852
0.0275210
24
BVU
0.0667554
0.0609358
0.0344843
0.0838199
0.1226548
0.1549928
0.0623967
25
THDU
0.0642158
0.0594124
0.0572042
0.0853149
0.1338157
0.1612059
0.0098000
26
DOAU
0.1044867
0.1142547
0.0804255
0.0855142
0.1651122
0.1283770
0.0554022
27
PDU
0.0580481
0.1096845
0.0565432
0.0901986
0.1282927
0.1506268
0.0522166
28
UEF
0.1128311
0.1310120
0.1202852
0.0938264
0.0119663
0.1679229
0.0977918
29
DAU
0.0983190
0.1294886
0.0871871
0.0968164
0.1090776
0.1573605
0.0532761
30
MKU
0.0888862
0.1294886
0.0843153
0.1046901
0.0442984
0.1641446
0.0538302
31
DNTU
0.1001330
0.1447226
0.1292460
0.1056469
0.1143704
0.1518023
0.0540171
32
LHU
0.1560044
0.1462460
0.1632338
0.1083379
0.1392235
0.1662436
0.1368434
33
SGTU
0.1001330
0.1218717
0.1165964
0.1250022
0.1356566
0.1615922
0.0892239
34
TLU
0.1186359
0.1035909
0.1276278
0.1383775
0.0797371
0.1463112
0.1163446
35
THDOU
0.0569597
0.0868336
0.1637607
0.1563176
0.1027493
0.1679229
0.0562332
36
VHU
0.1719676
0.1142547
0.0989554
0.1604837
0.3221701
0.1460929
0.0277704
37
HSU
0.1273431
0.1599566
0.1159620
0.1615401
0.1644218
0.1489476
0.1774622
38
TDU
0.2205829
0.1005441
0.2891891
0.1647095
0.0667352
0.1209045
0.1939077
39
HBU
0.1944613
0.1675735
0.3369839
0.1873738
0.1380729
0.1561683
0.1383670
40
HUFLIT
0.1433063
0.1355822
0.1156620
0.2274997
0.1173620
0.1578475
0.2084508
41
FPT
0.2060709
0.2132754
0.1804787
0.2645558
0.0766305
0.1651521
0.2366366
42
VLU
0.2223969
0.1447226
0.1740741
0.2696588
0.2036575
0.1581833
0.3393385
43
DTU
0.2927803
0.4951036
0.2111094
0.3339041
0.5797911
0.1585192
0.2770110
44
NTT
0.4988512
0.5331885
0.2519735
0.4222488
0.2214920
0.1343383
0.4780039
45
HUTECH
0.4560407
0.2879218
0.3543439
0.4663415
0.4037482
0.1544890
0.5422490
Data normalization year 2019–2020.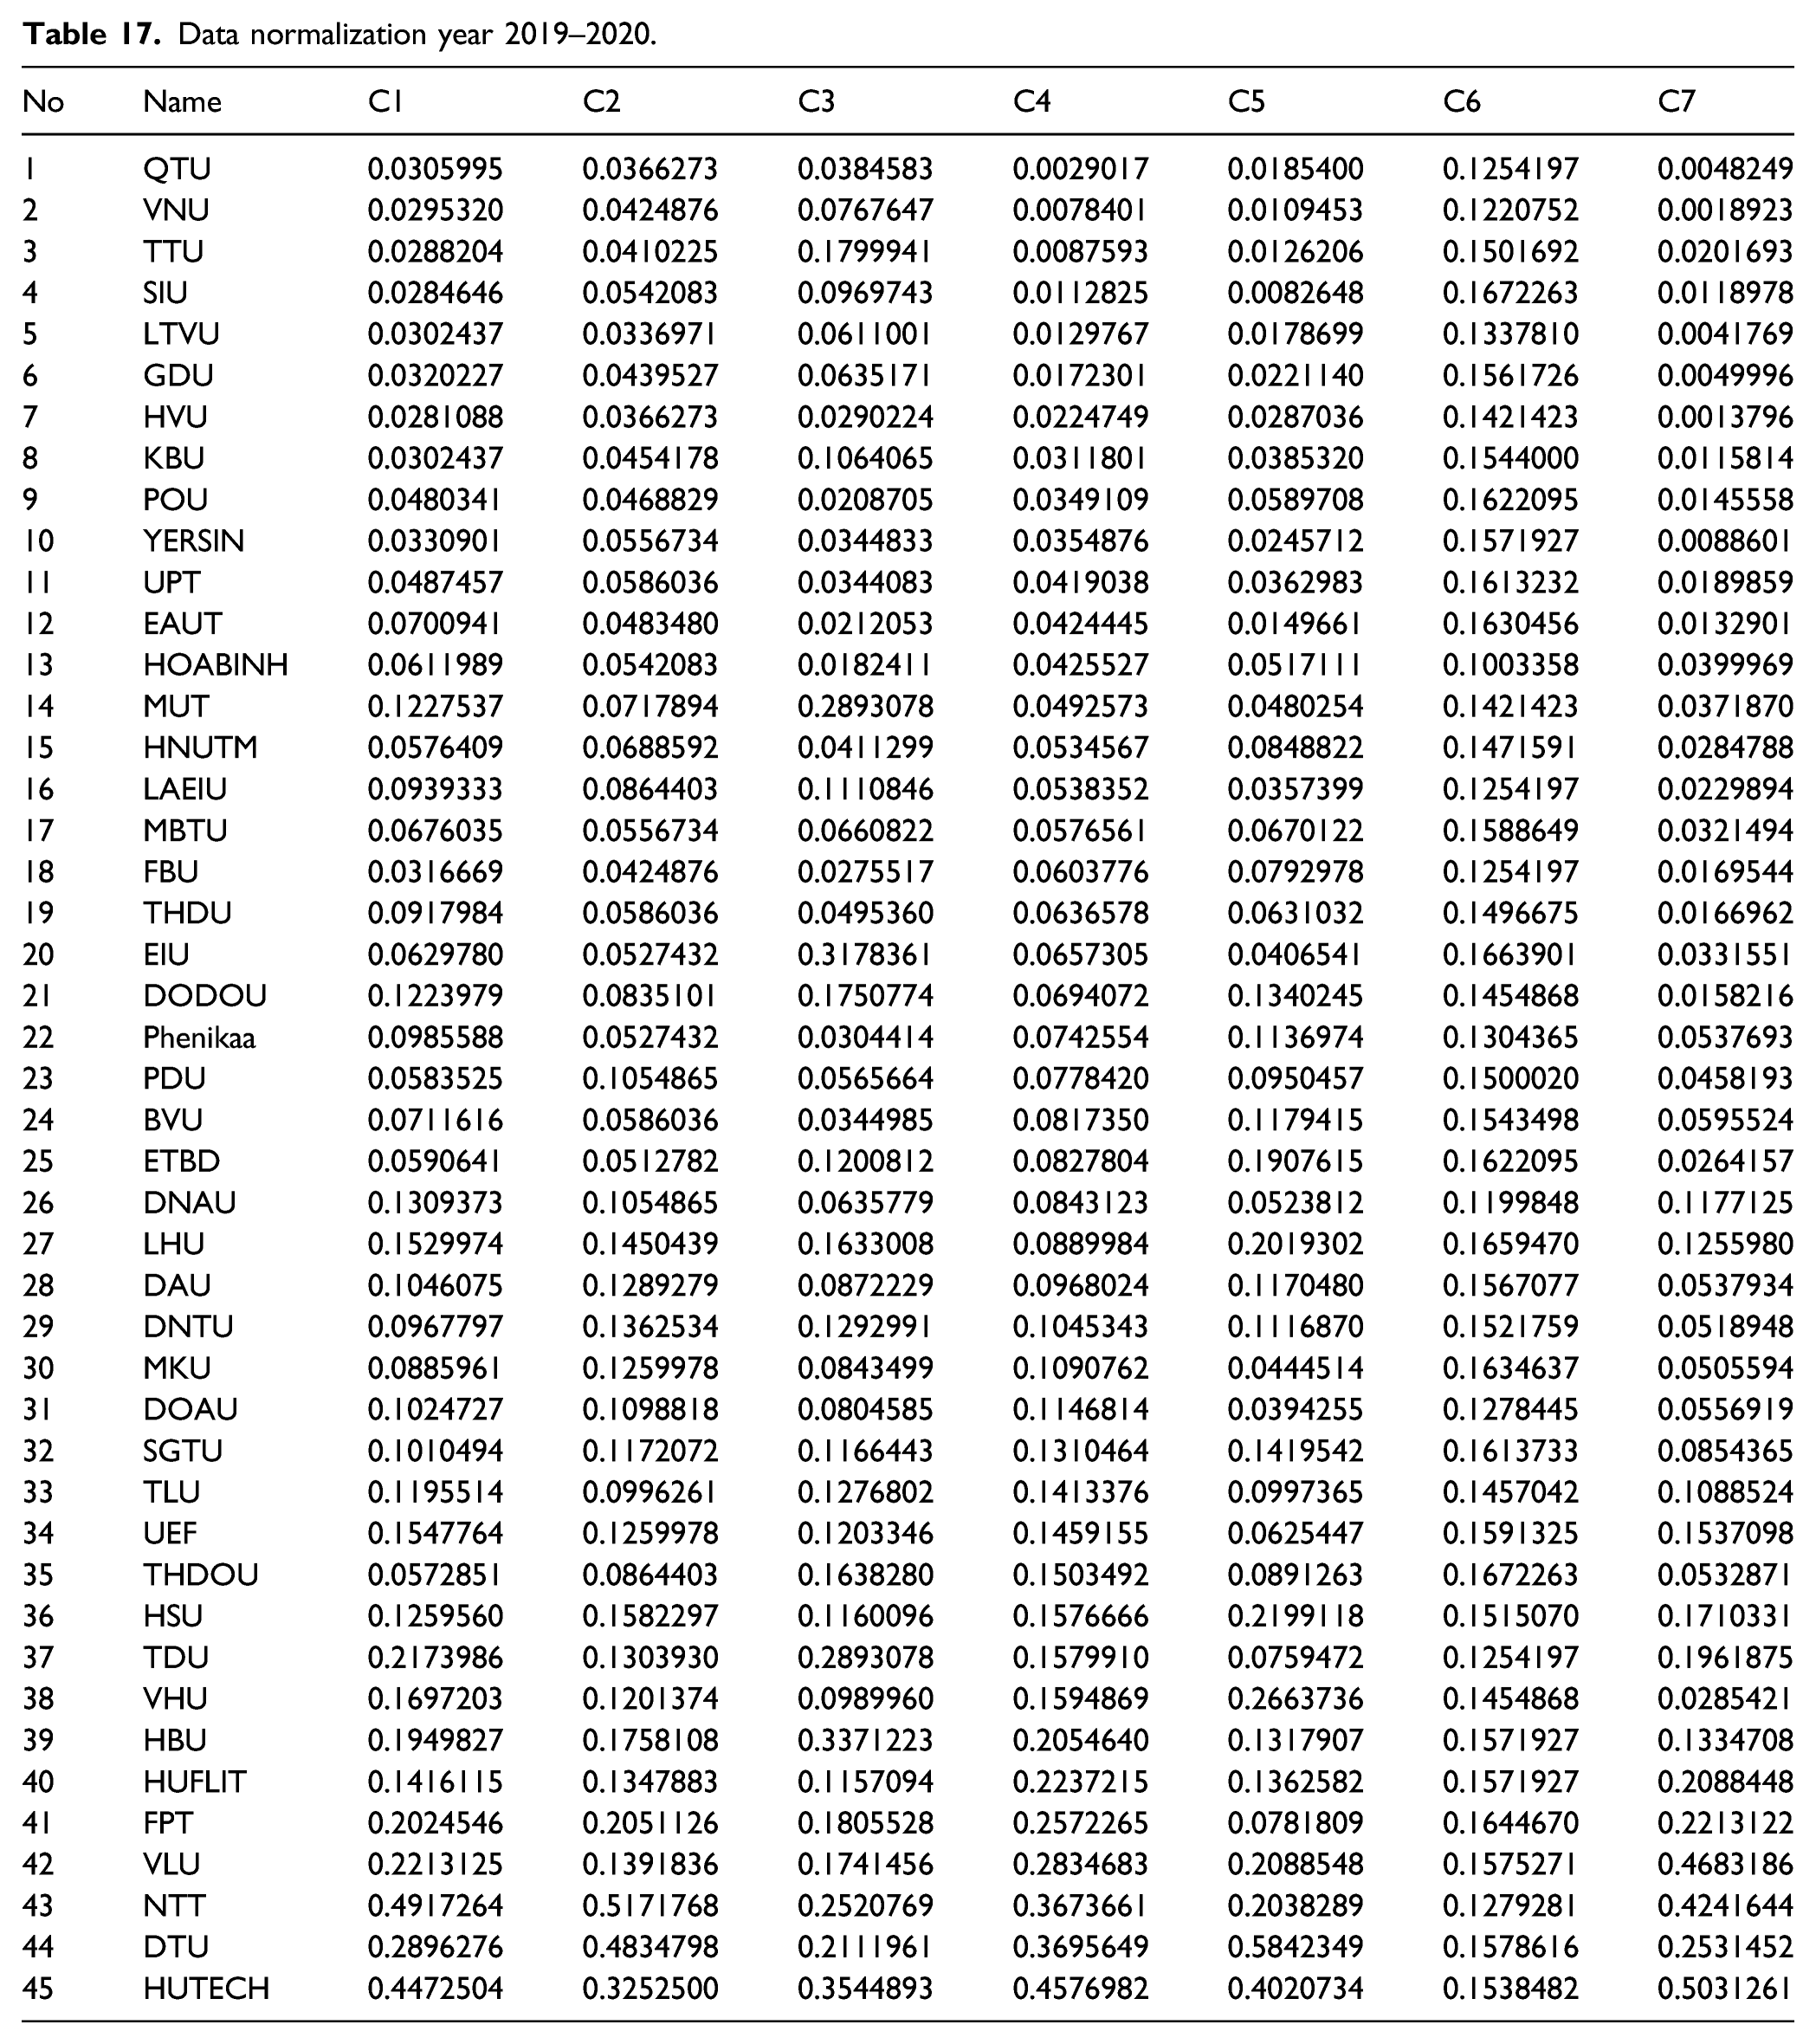
No
Name
C1
C2
C3
C4
C5
C6
C7
1
QTU
0.0305995
0.0366273
0.0384583
0.0029017
0.0185400
0.1254197
0.0048249
2
VNU
0.0295320
0.0424876
0.0767647
0.0078401
0.0109453
0.1220752
0.0018923
3
TTU
0.0288204
0.0410225
0.1799941
0.0087593
0.0126206
0.1501692
0.0201693
4
SIU
0.0284646
0.0542083
0.0969743
0.0112825
0.0082648
0.1672263
0.0118978
5
LTVU
0.0302437
0.0336971
0.0611001
0.0129767
0.0178699
0.1337810
0.0041769
6
GDU
0.0320227
0.0439527
0.0635171
0.0172301
0.0221140
0.1561726
0.0049996
7
HVU
0.0281088
0.0366273
0.0290224
0.0224749
0.0287036
0.1421423
0.0013796
8
KBU
0.0302437
0.0454178
0.1064065
0.0311801
0.0385320
0.1544000
0.0115814
9
POU
0.0480341
0.0468829
0.0208705
0.0349109
0.0589708
0.1622095
0.0145558
10
YERSIN
0.0330901
0.0556734
0.0344833
0.0354876
0.0245712
0.1571927
0.0088601
11
UPT
0.0487457
0.0586036
0.0344083
0.0419038
0.0362983
0.1613232
0.0189859
12
EAUT
0.0700941
0.0483480
0.0212053
0.0424445
0.0149661
0.1630456
0.0132901
13
HOABINH
0.0611989
0.0542083
0.0182411
0.0425527
0.0517111
0.1003358
0.0399969
14
MUT
0.1227537
0.0717894
0.2893078
0.0492573
0.0480254
0.1421423
0.0371870
15
HNUTM
0.0576409
0.0688592
0.0411299
0.0534567
0.0848822
0.1471591
0.0284788
16
LAEIU
0.0939333
0.0864403
0.1110846
0.0538352
0.0357399
0.1254197
0.0229894
17
MBTU
0.0676035
0.0556734
0.0660822
0.0576561
0.0670122
0.1588649
0.0321494
18
FBU
0.0316669
0.0424876
0.0275517
0.0603776
0.0792978
0.1254197
0.0169544
19
THDU
0.0917984
0.0586036
0.0495360
0.0636578
0.0631032
0.1496675
0.0166962
20
EIU
0.0629780
0.0527432
0.3178361
0.0657305
0.0406541
0.1663901
0.0331551
21
DODOU
0.1223979
0.0835101
0.1750774
0.0694072
0.1340245
0.1454868
0.0158216
22
Phenikaa
0.0985588
0.0527432
0.0304414
0.0742554
0.1136974
0.1304365
0.0537693
23
PDU
0.0583525
0.1054865
0.0565664
0.0778420
0.0950457
0.1500020
0.0458193
24
BVU
0.0711616
0.0586036
0.0344985
0.0817350
0.1179415
0.1543498
0.0595524
25
ETBD
0.0590641
0.0512782
0.1200812
0.0827804
0.1907615
0.1622095
0.0264157
26
DNAU
0.1309373
0.1054865
0.0635779
0.0843123
0.0523812
0.1199848
0.1177125
27
LHU
0.1529974
0.1450439
0.1633008
0.0889984
0.2019302
0.1659470
0.1255980
28
DAU
0.1046075
0.1289279
0.0872229
0.0968024
0.1170480
0.1567077
0.0537934
29
DNTU
0.0967797
0.1362534
0.1292991
0.1045343
0.1116870
0.1521759
0.0518948
30
MKU
0.0885961
0.1259978
0.0843499
0.1090762
0.0444514
0.1634637
0.0505594
31
DOAU
0.1024727
0.1098818
0.0804585
0.1146814
0.0394255
0.1278445
0.0556919
32
SGTU
0.1010494
0.1172072
0.1166443
0.1310464
0.1419542
0.1613733
0.0854365
33
TLU
0.1195514
0.0996261
0.1276802
0.1413376
0.0997365
0.1457042
0.1088524
34
UEF
0.1547764
0.1259978
0.1203346
0.1459155
0.0625447
0.1591325
0.1537098
35
THDOU
0.0572851
0.0864403
0.1638280
0.1503492
0.0891263
0.1672263
0.0532871
36
HSU
0.1259560
0.1582297
0.1160096
0.1576666
0.2199118
0.1515070
0.1710331
37
TDU
0.2173986
0.1303930
0.2893078
0.1579910
0.0759472
0.1254197
0.1961875
38
VHU
0.1697203
0.1201374
0.0989960
0.1594869
0.2663736
0.1454868
0.0285421
39
HBU
0.1949827
0.1758108
0.3371223
0.2054640
0.1317907
0.1571927
0.1334708
40
HUFLIT
0.1416115
0.1347883
0.1157094
0.2237215
0.1362582
0.1571927
0.2088448
41
FPT
0.2024546
0.2051126
0.1805528
0.2572265
0.0781809
0.1644670
0.2213122
42
VLU
0.2213125
0.1391836
0.1741456
0.2834683
0.2088548
0.1575271
0.4683186
43
NTT
0.4917264
0.5171768
0.2520769
0.3673661
0.2038289
0.1279281
0.4241644
44
DTU
0.2896276
0.4834798
0.2111961
0.3695649
0.5842349
0.1578616
0.2531452
45
HUTECH
0.4472504
0.3252500
0.3544893
0.4576982
0.4020734
0.1538482
0.5031261
Normalized weight matrix 2018–2019.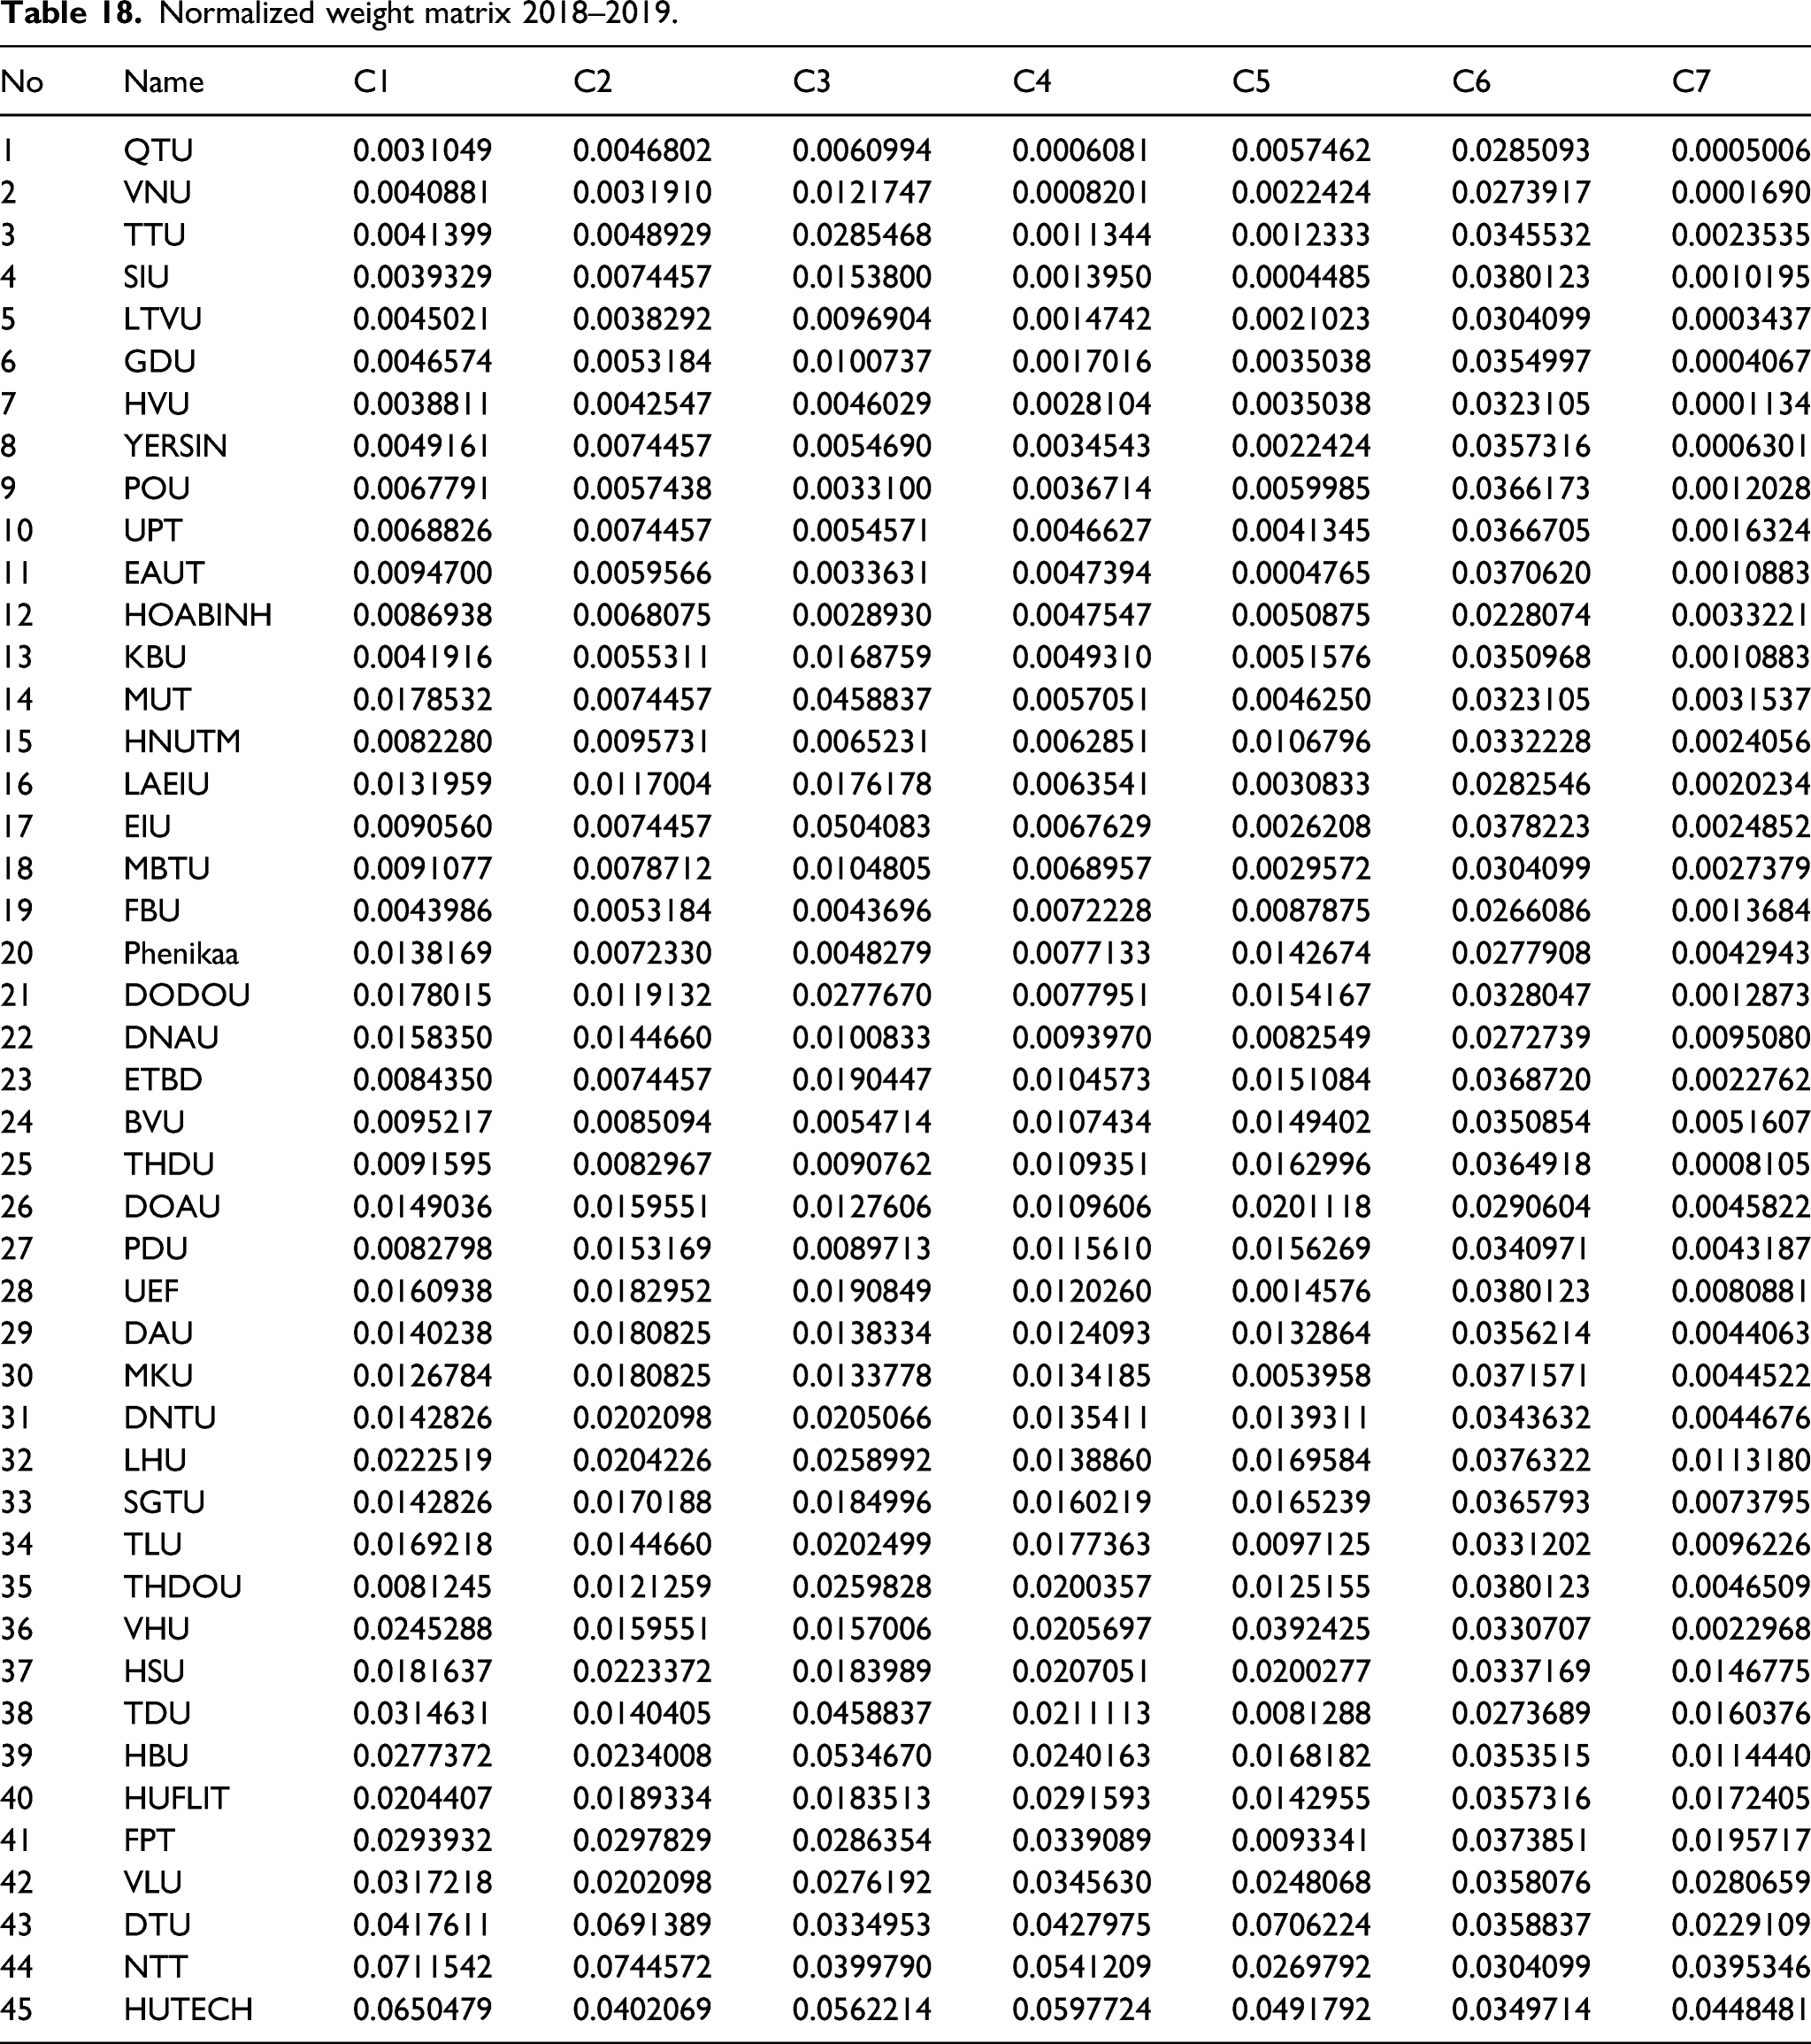
No
Name
C1
C2
C3
C4
C5
C6
C7
1
QTU
0.0031049
0.0046802
0.0060994
0.0006081
0.0057462
0.0285093
0.0005006
2
VNU
0.0040881
0.0031910
0.0121747
0.0008201
0.0022424
0.0273917
0.0001690
3
TTU
0.0041399
0.0048929
0.0285468
0.0011344
0.0012333
0.0345532
0.0023535
4
SIU
0.0039329
0.0074457
0.0153800
0.0013950
0.0004485
0.0380123
0.0010195
5
LTVU
0.0045021
0.0038292
0.0096904
0.0014742
0.0021023
0.0304099
0.0003437
6
GDU
0.0046574
0.0053184
0.0100737
0.0017016
0.0035038
0.0354997
0.0004067
7
HVU
0.0038811
0.0042547
0.0046029
0.0028104
0.0035038
0.0323105
0.0001134
8
YERSIN
0.0049161
0.0074457
0.0054690
0.0034543
0.0022424
0.0357316
0.0006301
9
POU
0.0067791
0.0057438
0.0033100
0.0036714
0.0059985
0.0366173
0.0012028
10
UPT
0.0068826
0.0074457
0.0054571
0.0046627
0.0041345
0.0366705
0.0016324
11
EAUT
0.0094700
0.0059566
0.0033631
0.0047394
0.0004765
0.0370620
0.0010883
12
HOABINH
0.0086938
0.0068075
0.0028930
0.0047547
0.0050875
0.0228074
0.0033221
13
KBU
0.0041916
0.0055311
0.0168759
0.0049310
0.0051576
0.0350968
0.0010883
14
MUT
0.0178532
0.0074457
0.0458837
0.0057051
0.0046250
0.0323105
0.0031537
15
HNUTM
0.0082280
0.0095731
0.0065231
0.0062851
0.0106796
0.0332228
0.0024056
16
LAEIU
0.0131959
0.0117004
0.0176178
0.0063541
0.0030833
0.0282546
0.0020234
17
EIU
0.0090560
0.0074457
0.0504083
0.0067629
0.0026208
0.0378223
0.0024852
18
MBTU
0.0091077
0.0078712
0.0104805
0.0068957
0.0029572
0.0304099
0.0027379
19
FBU
0.0043986
0.0053184
0.0043696
0.0072228
0.0087875
0.0266086
0.0013684
20
Phenikaa
0.0138169
0.0072330
0.0048279
0.0077133
0.0142674
0.0277908
0.0042943
21
DODOU
0.0178015
0.0119132
0.0277670
0.0077951
0.0154167
0.0328047
0.0012873
22
DNAU
0.0158350
0.0144660
0.0100833
0.0093970
0.0082549
0.0272739
0.0095080
23
ETBD
0.0084350
0.0074457
0.0190447
0.0104573
0.0151084
0.0368720
0.0022762
24
BVU
0.0095217
0.0085094
0.0054714
0.0107434
0.0149402
0.0350854
0.0051607
25
THDU
0.0091595
0.0082967
0.0090762
0.0109351
0.0162996
0.0364918
0.0008105
26
DOAU
0.0149036
0.0159551
0.0127606
0.0109606
0.0201118
0.0290604
0.0045822
27
PDU
0.0082798
0.0153169
0.0089713
0.0115610
0.0156269
0.0340971
0.0043187
28
UEF
0.0160938
0.0182952
0.0190849
0.0120260
0.0014576
0.0380123
0.0080881
29
DAU
0.0140238
0.0180825
0.0138334
0.0124093
0.0132864
0.0356214
0.0044063
30
MKU
0.0126784
0.0180825
0.0133778
0.0134185
0.0053958
0.0371571
0.0044522
31
DNTU
0.0142826
0.0202098
0.0205066
0.0135411
0.0139311
0.0343632
0.0044676
32
LHU
0.0222519
0.0204226
0.0258992
0.0138860
0.0169584
0.0376322
0.0113180
33
SGTU
0.0142826
0.0170188
0.0184996
0.0160219
0.0165239
0.0365793
0.0073795
34
TLU
0.0169218
0.0144660
0.0202499
0.0177363
0.0097125
0.0331202
0.0096226
35
THDOU
0.0081245
0.0121259
0.0259828
0.0200357
0.0125155
0.0380123
0.0046509
36
VHU
0.0245288
0.0159551
0.0157006
0.0205697
0.0392425
0.0330707
0.0022968
37
HSU
0.0181637
0.0223372
0.0183989
0.0207051
0.0200277
0.0337169
0.0146775
38
TDU
0.0314631
0.0140405
0.0458837
0.0211113
0.0081288
0.0273689
0.0160376
39
HBU
0.0277372
0.0234008
0.0534670
0.0240163
0.0168182
0.0353515
0.0114440
40
HUFLIT
0.0204407
0.0189334
0.0183513
0.0291593
0.0142955
0.0357316
0.0172405
41
FPT
0.0293932
0.0297829
0.0286354
0.0339089
0.0093341
0.0373851
0.0195717
42
VLU
0.0317218
0.0202098
0.0276192
0.0345630
0.0248068
0.0358076
0.0280659
43
DTU
0.0417611
0.0691389
0.0334953
0.0427975
0.0706224
0.0358837
0.0229109
44
NTT
0.0711542
0.0744572
0.0399790
0.0541209
0.0269792
0.0304099
0.0395346
45
HUTECH
0.0650479
0.0402069
0.0562214
0.0597724
0.0491792
0.0349714
0.0448481
Normalized weight matrix 2019–2020.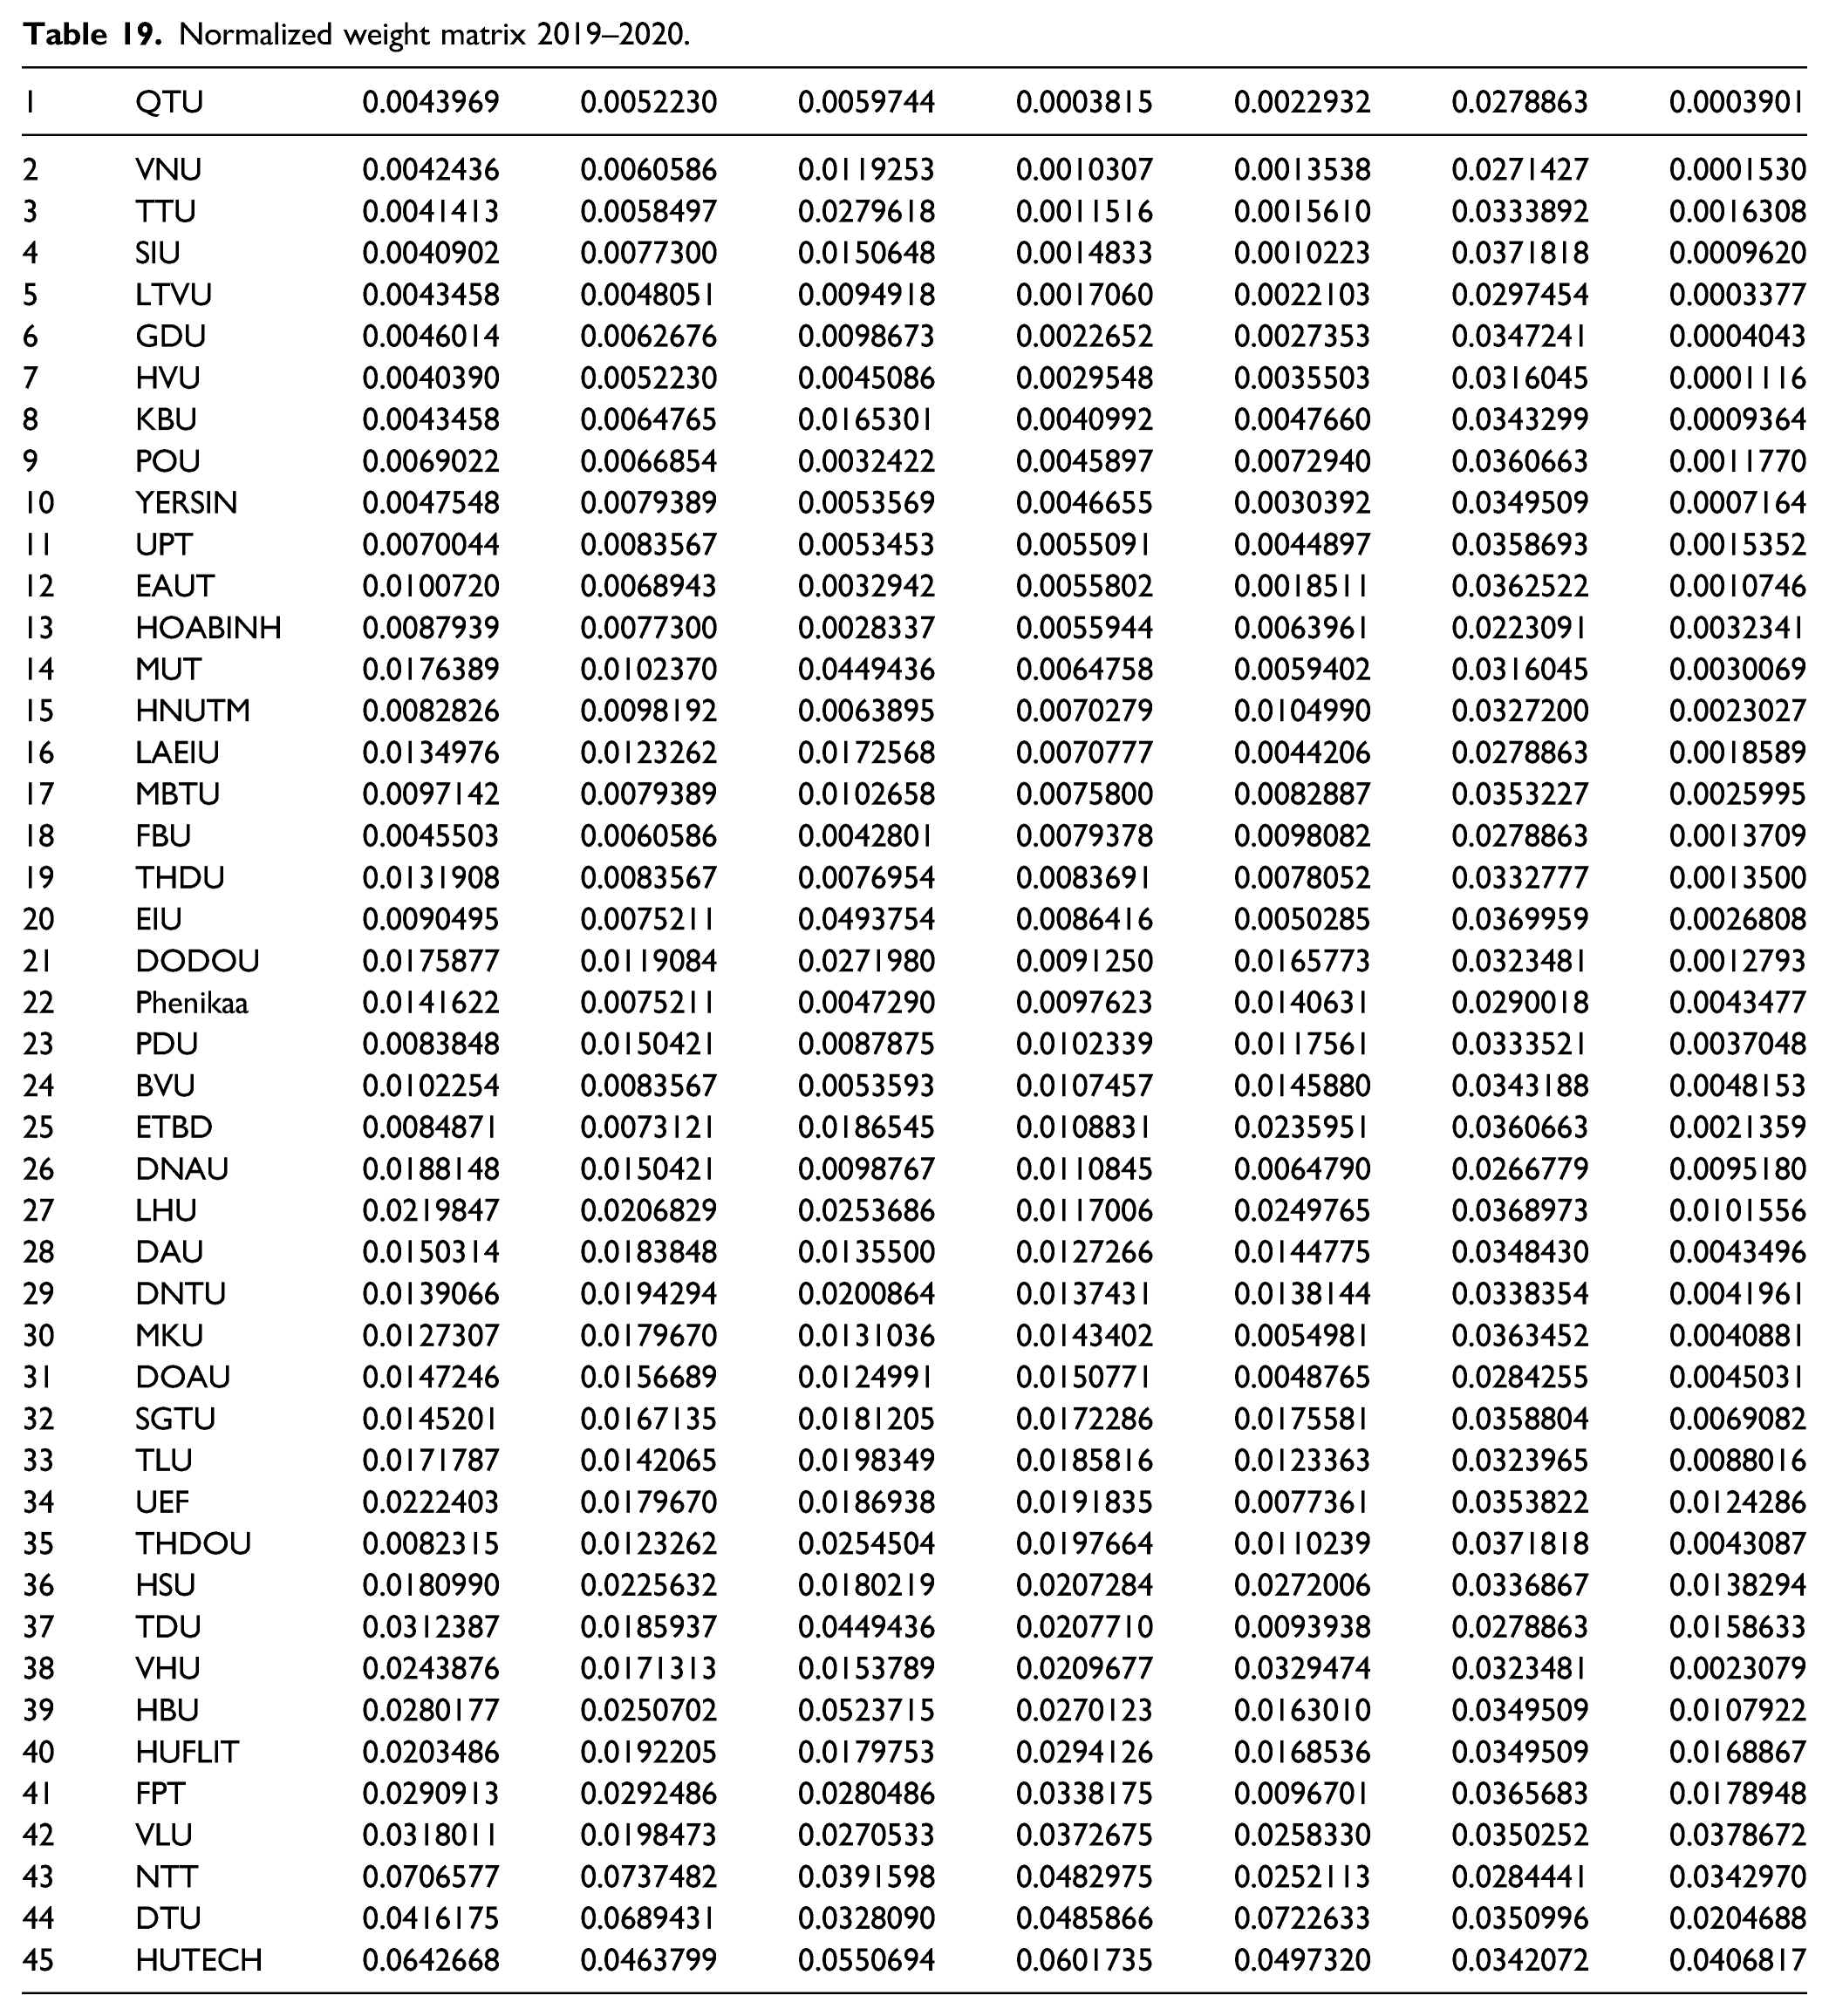
1
QTU
0.0043969
0.0052230
0.0059744
0.0003815
0.0022932
0.0278863
0.0003901
2
VNU
0.0042436
0.0060586
0.0119253
0.0010307
0.0013538
0.0271427
0.0001530
3
TTU
0.0041413
0.0058497
0.0279618
0.0011516
0.0015610
0.0333892
0.0016308
4
SIU
0.0040902
0.0077300
0.0150648
0.0014833
0.0010223
0.0371818
0.0009620
5
LTVU
0.0043458
0.0048051
0.0094918
0.0017060
0.0022103
0.0297454
0.0003377
6
GDU
0.0046014
0.0062676
0.0098673
0.0022652
0.0027353
0.0347241
0.0004043
7
HVU
0.0040390
0.0052230
0.0045086
0.0029548
0.0035503
0.0316045
0.0001116
8
KBU
0.0043458
0.0064765
0.0165301
0.0040992
0.0047660
0.0343299
0.0009364
9
POU
0.0069022
0.0066854
0.0032422
0.0045897
0.0072940
0.0360663
0.0011770
10
YERSIN
0.0047548
0.0079389
0.0053569
0.0046655
0.0030392
0.0349509
0.0007164
11
UPT
0.0070044
0.0083567
0.0053453
0.0055091
0.0044897
0.0358693
0.0015352
12
EAUT
0.0100720
0.0068943
0.0032942
0.0055802
0.0018511
0.0362522
0.0010746
13
HOABINH
0.0087939
0.0077300
0.0028337
0.0055944
0.0063961
0.0223091
0.0032341
14
MUT
0.0176389
0.0102370
0.0449436
0.0064758
0.0059402
0.0316045
0.0030069
15
HNUTM
0.0082826
0.0098192
0.0063895
0.0070279
0.0104990
0.0327200
0.0023027
16
LAEIU
0.0134976
0.0123262
0.0172568
0.0070777
0.0044206
0.0278863
0.0018589
17
MBTU
0.0097142
0.0079389
0.0102658
0.0075800
0.0082887
0.0353227
0.0025995
18
FBU
0.0045503
0.0060586
0.0042801
0.0079378
0.0098082
0.0278863
0.0013709
19
THDU
0.0131908
0.0083567
0.0076954
0.0083691
0.0078052
0.0332777
0.0013500
20
EIU
0.0090495
0.0075211
0.0493754
0.0086416
0.0050285
0.0369959
0.0026808
21
DODOU
0.0175877
0.0119084
0.0271980
0.0091250
0.0165773
0.0323481
0.0012793
22
Phenikaa
0.0141622
0.0075211
0.0047290
0.0097623
0.0140631
0.0290018
0.0043477
23
PDU
0.0083848
0.0150421
0.0087875
0.0102339
0.0117561
0.0333521
0.0037048
24
BVU
0.0102254
0.0083567
0.0053593
0.0107457
0.0145880
0.0343188
0.0048153
25
ETBD
0.0084871
0.0073121
0.0186545
0.0108831
0.0235951
0.0360663
0.0021359
26
DNAU
0.0188148
0.0150421
0.0098767
0.0110845
0.0064790
0.0266779
0.0095180
27
LHU
0.0219847
0.0206829
0.0253686
0.0117006
0.0249765
0.0368973
0.0101556
28
DAU
0.0150314
0.0183848
0.0135500
0.0127266
0.0144775
0.0348430
0.0043496
29
DNTU
0.0139066
0.0194294
0.0200864
0.0137431
0.0138144
0.0338354
0.0041961
30
MKU
0.0127307
0.0179670
0.0131036
0.0143402
0.0054981
0.0363452
0.0040881
31
DOAU
0.0147246
0.0156689
0.0124991
0.0150771
0.0048765
0.0284255
0.0045031
32
SGTU
0.0145201
0.0167135
0.0181205
0.0172286
0.0175581
0.0358804
0.0069082
33
TLU
0.0171787
0.0142065
0.0198349
0.0185816
0.0123363
0.0323965
0.0088016
34
UEF
0.0222403
0.0179670
0.0186938
0.0191835
0.0077361
0.0353822
0.0124286
35
THDOU
0.0082315
0.0123262
0.0254504
0.0197664
0.0110239
0.0371818
0.0043087
36
HSU
0.0180990
0.0225632
0.0180219
0.0207284
0.0272006
0.0336867
0.0138294
37
TDU
0.0312387
0.0185937
0.0449436
0.0207710
0.0093938
0.0278863
0.0158633
38
VHU
0.0243876
0.0171313
0.0153789
0.0209677
0.0329474
0.0323481
0.0023079
39
HBU
0.0280177
0.0250702
0.0523715
0.0270123
0.0163010
0.0349509
0.0107922
40
HUFLIT
0.0203486
0.0192205
0.0179753
0.0294126
0.0168536
0.0349509
0.0168867
41
FPT
0.0290913
0.0292486
0.0280486
0.0338175
0.0096701
0.0365683
0.0178948
42
VLU
0.0318011
0.0198473
0.0270533
0.0372675
0.0258330
0.0350252
0.0378672
43
NTT
0.0706577
0.0737482
0.0391598
0.0482975
0.0252113
0.0284441
0.0342970
44
DTU
0.0416175
0.0689431
0.0328090
0.0485866
0.0722633
0.0350996
0.0204688
45
HUTECH
0.0642668
0.0463799
0.0550694
0.0601735
0.0497320
0.0342072
0.0406817
The distance between the selections to the ideal solution.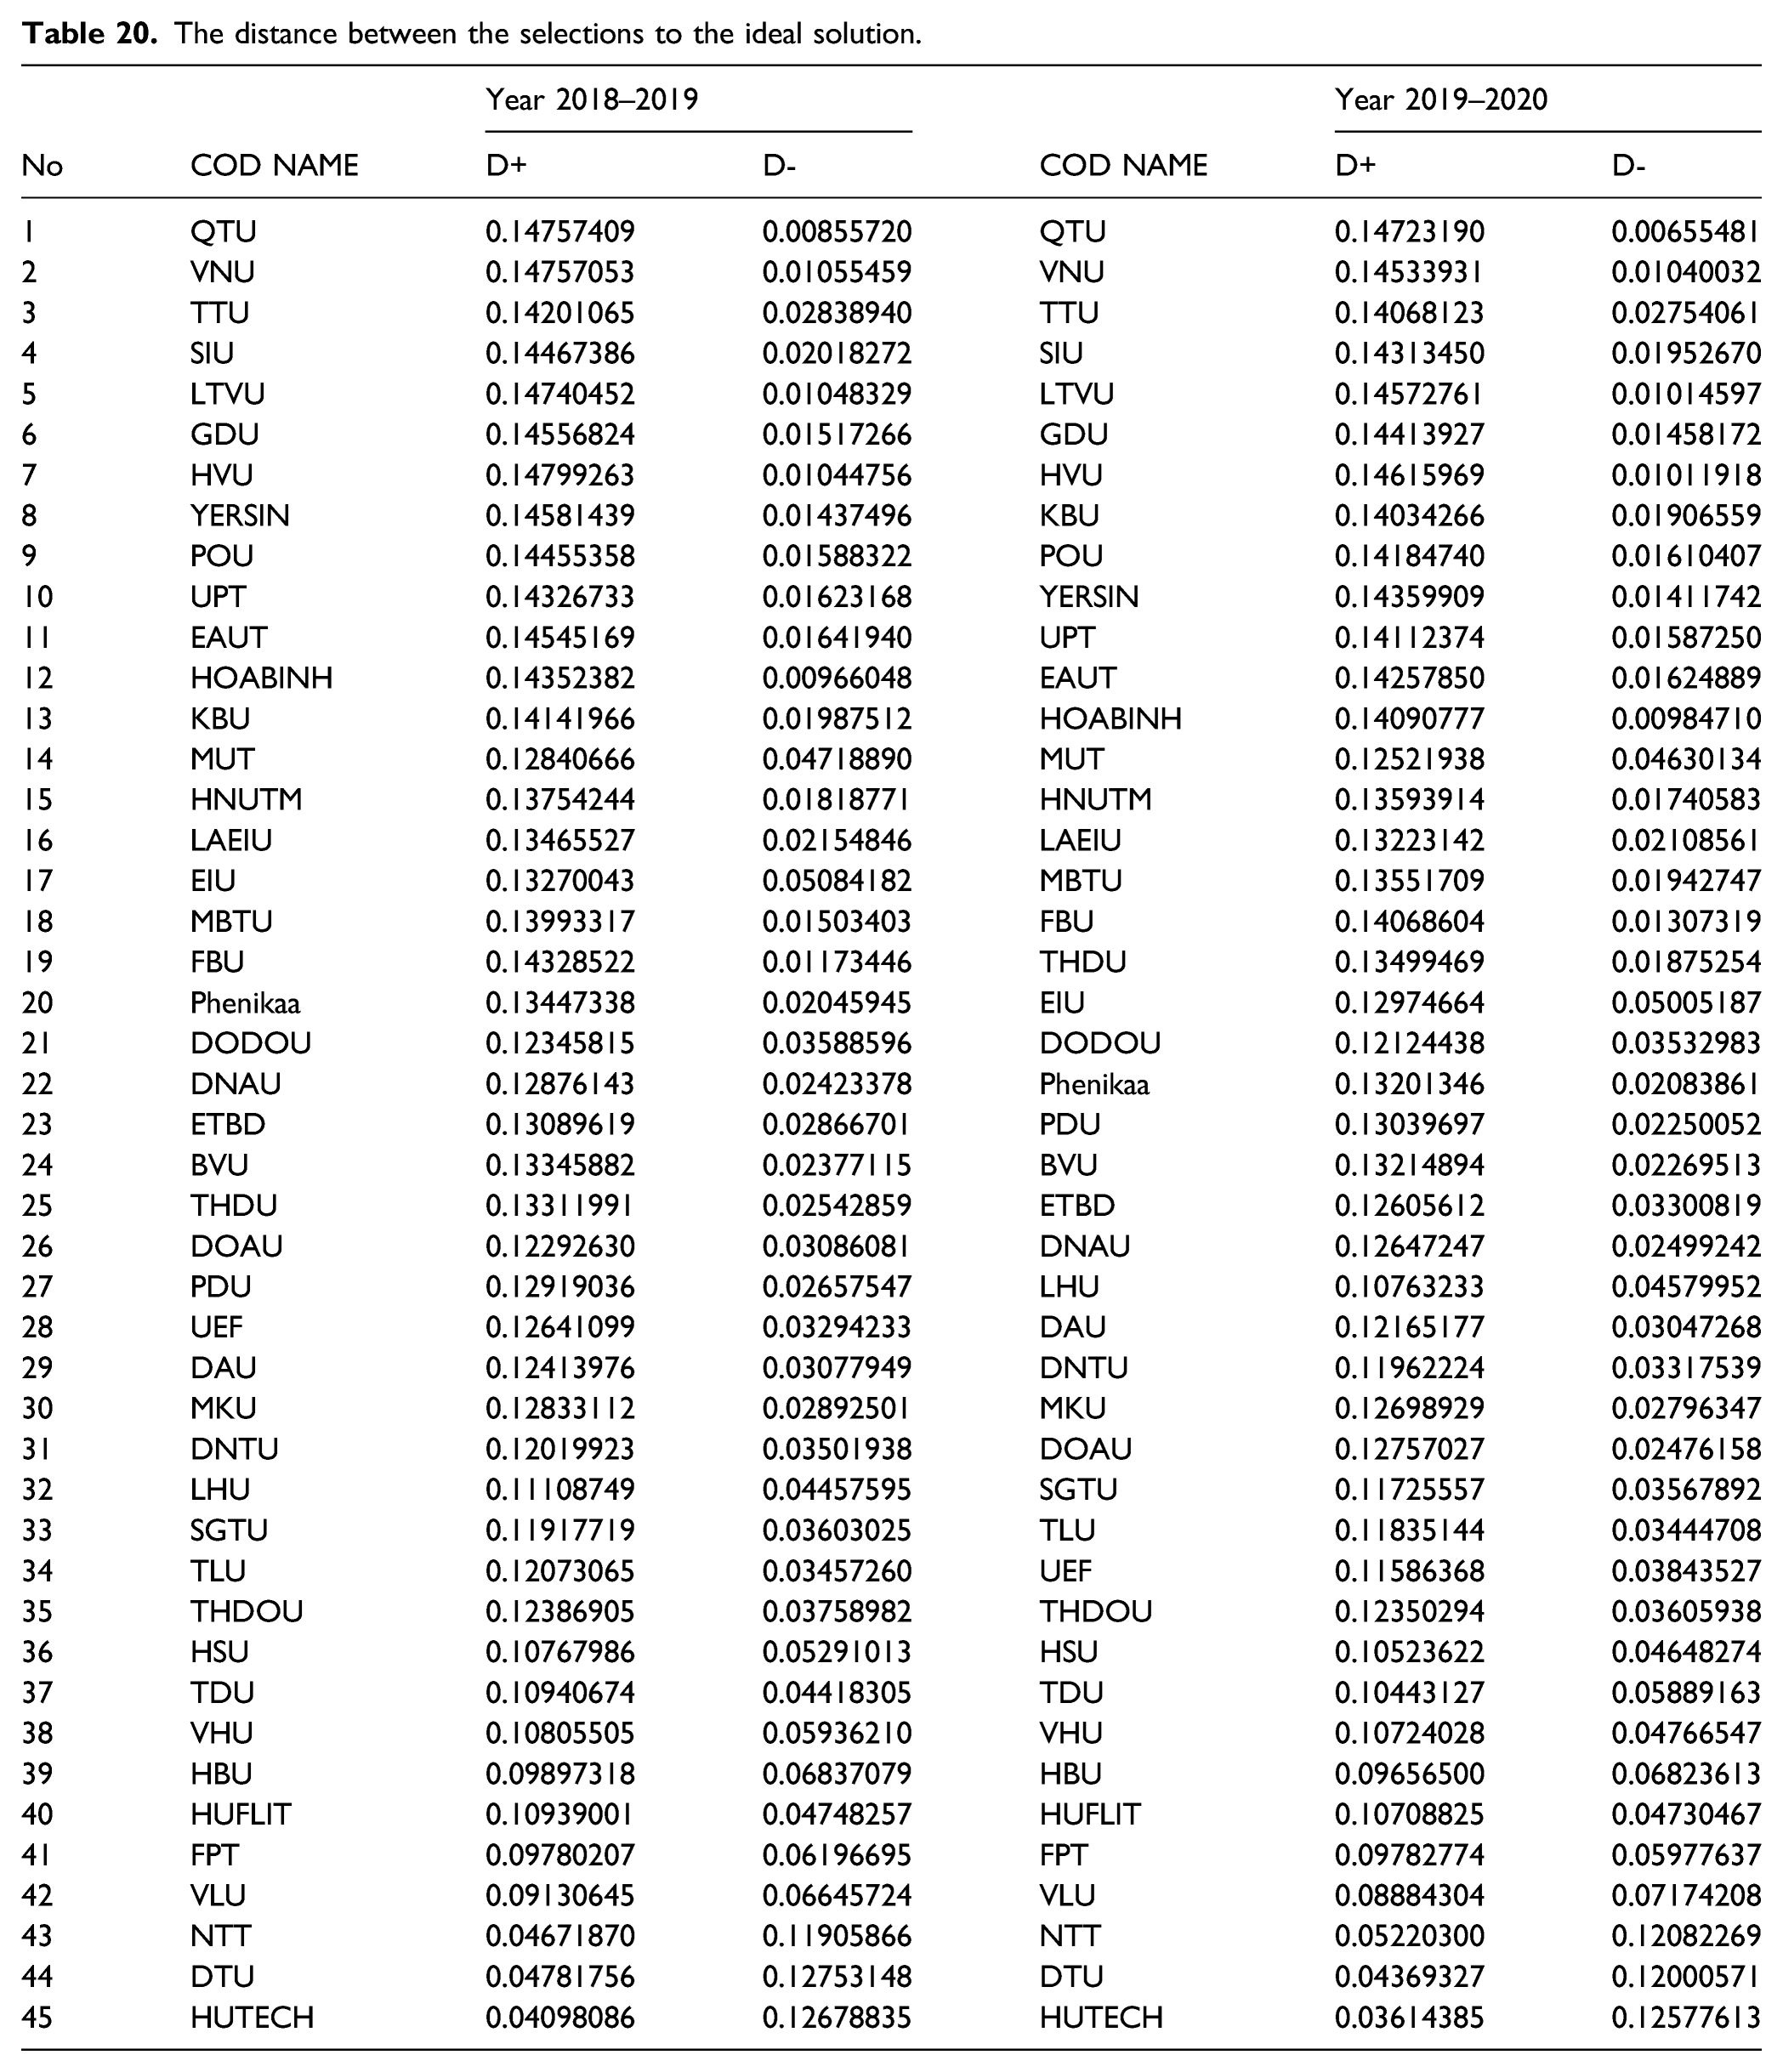
No
COD NAME
Year 2018–2019
COD NAME
Year 2019–2020
D+
D-
D+
D-
1
QTU
0.14757409
0.00855720
QTU
0.14723190
0.00655481
2
VNU
0.14757053
0.01055459
VNU
0.14533931
0.01040032
3
TTU
0.14201065
0.02838940
TTU
0.14068123
0.02754061
4
SIU
0.14467386
0.02018272
SIU
0.14313450
0.01952670
5
LTVU
0.14740452
0.01048329
LTVU
0.14572761
0.01014597
6
GDU
0.14556824
0.01517266
GDU
0.14413927
0.01458172
7
HVU
0.14799263
0.01044756
HVU
0.14615969
0.01011918
8
YERSIN
0.14581439
0.01437496
KBU
0.14034266
0.01906559
9
POU
0.14455358
0.01588322
POU
0.14184740
0.01610407
10
UPT
0.14326733
0.01623168
YERSIN
0.14359909
0.01411742
11
EAUT
0.14545169
0.01641940
UPT
0.14112374
0.01587250
12
HOABINH
0.14352382
0.00966048
EAUT
0.14257850
0.01624889
13
KBU
0.14141966
0.01987512
HOABINH
0.14090777
0.00984710
14
MUT
0.12840666
0.04718890
MUT
0.12521938
0.04630134
15
HNUTM
0.13754244
0.01818771
HNUTM
0.13593914
0.01740583
16
LAEIU
0.13465527
0.02154846
LAEIU
0.13223142
0.02108561
17
EIU
0.13270043
0.05084182
MBTU
0.13551709
0.01942747
18
MBTU
0.13993317
0.01503403
FBU
0.14068604
0.01307319
19
FBU
0.14328522
0.01173446
THDU
0.13499469
0.01875254
20
Phenikaa
0.13447338
0.02045945
EIU
0.12974664
0.05005187
21
DODOU
0.12345815
0.03588596
DODOU
0.12124438
0.03532983
22
DNAU
0.12876143
0.02423378
Phenikaa
0.13201346
0.02083861
23
ETBD
0.13089619
0.02866701
PDU
0.13039697
0.02250052
24
BVU
0.13345882
0.02377115
BVU
0.13214894
0.02269513
25
THDU
0.13311991
0.02542859
ETBD
0.12605612
0.03300819
26
DOAU
0.12292630
0.03086081
DNAU
0.12647247
0.02499242
27
PDU
0.12919036
0.02657547
LHU
0.10763233
0.04579952
28
UEF
0.12641099
0.03294233
DAU
0.12165177
0.03047268
29
DAU
0.12413976
0.03077949
DNTU
0.11962224
0.03317539
30
MKU
0.12833112
0.02892501
MKU
0.12698929
0.02796347
31
DNTU
0.12019923
0.03501938
DOAU
0.12757027
0.02476158
32
LHU
0.11108749
0.04457595
SGTU
0.11725557
0.03567892
33
SGTU
0.11917719
0.03603025
TLU
0.11835144
0.03444708
34
TLU
0.12073065
0.03457260
UEF
0.11586368
0.03843527
35
THDOU
0.12386905
0.03758982
THDOU
0.12350294
0.03605938
36
HSU
0.10767986
0.05291013
HSU
0.10523622
0.04648274
37
TDU
0.10940674
0.04418305
TDU
0.10443127
0.05889163
38
VHU
0.10805505
0.05936210
VHU
0.10724028
0.04766547
39
HBU
0.09897318
0.06837079
HBU
0.09656500
0.06823613
40
HUFLIT
0.10939001
0.04748257
HUFLIT
0.10708825
0.04730467
41
FPT
0.09780207
0.06196695
FPT
0.09782774
0.05977637
42
VLU
0.09130645
0.06645724
VLU
0.08884304
0.07174208
43
NTT
0.04671870
0.11905866
NTT
0.05220300
0.12082269
44
DTU
0.04781756
0.12753148
DTU
0.04369327
0.12000571
45
HUTECH
0.04098086
0.12678835
HUTECH
0.03614385
0.12577613
Closeness coefficient cci and Ranking the University.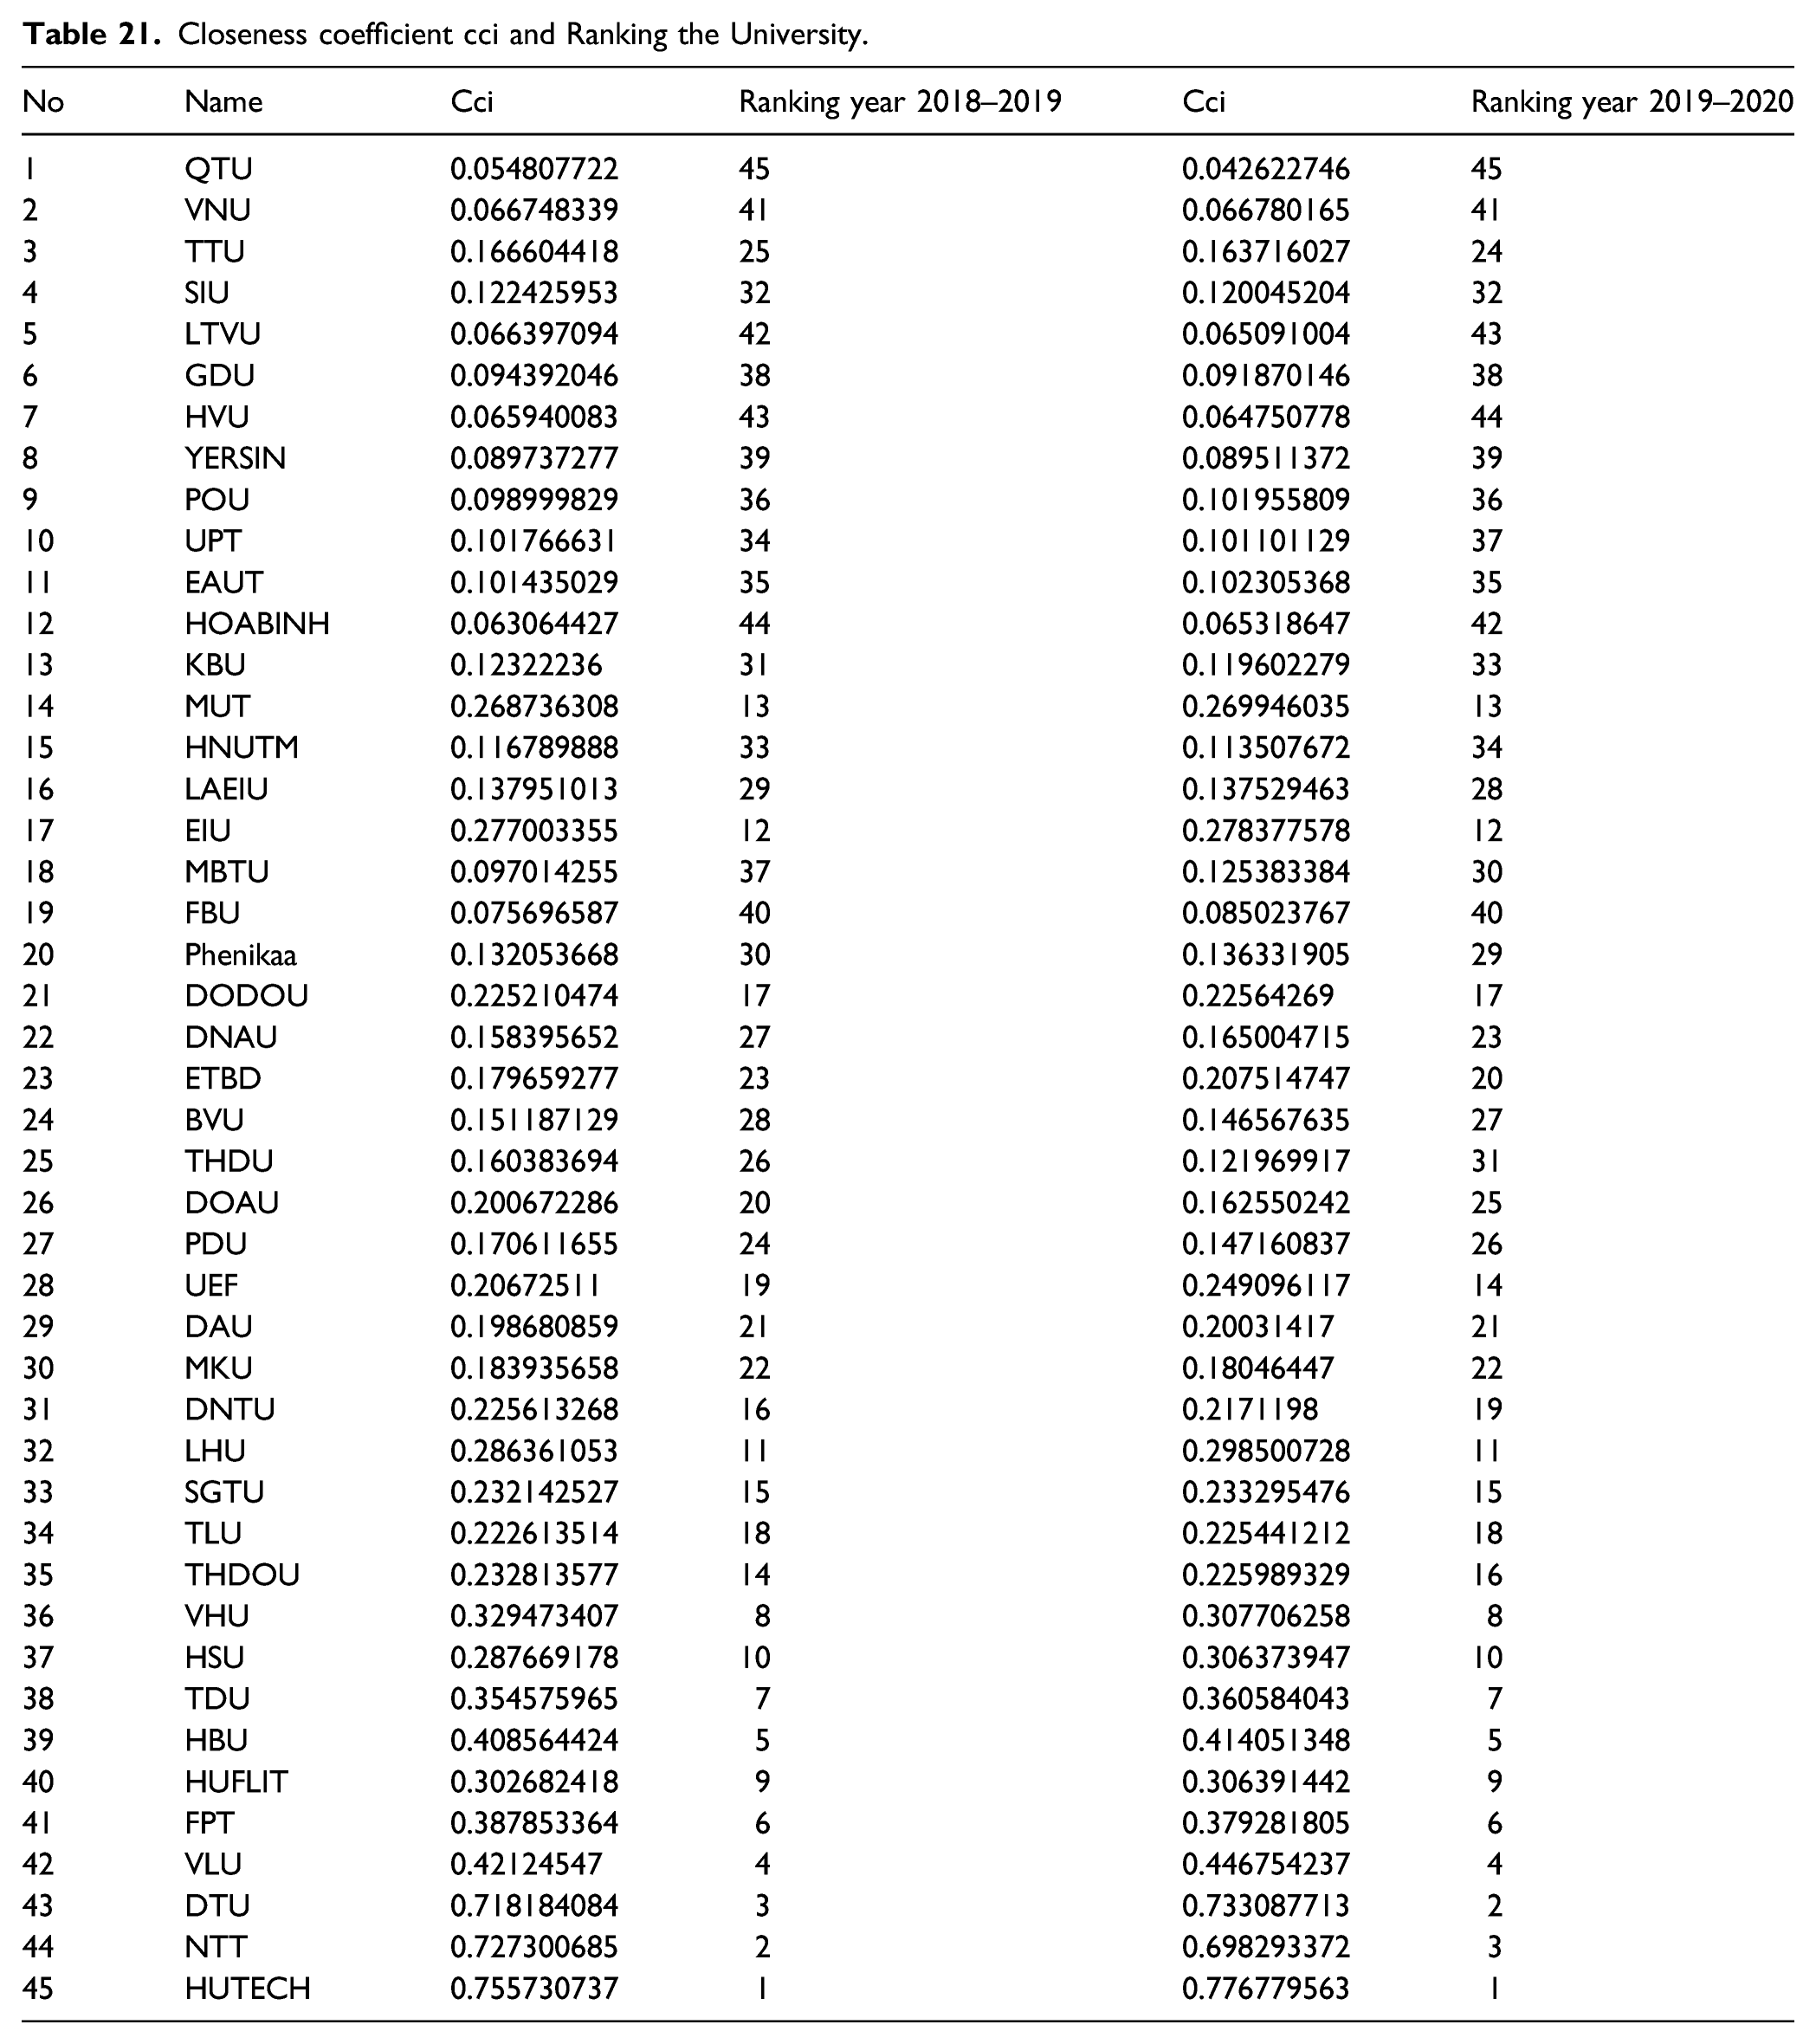
No
Name
Cci
Ranking year 2018–2019
Cci
Ranking year 2019–2020
1
QTU
0.054807722
45
0.042622746
45
2
VNU
0.066748339
41
0.066780165
41
3
TTU
0.166604418
25
0.163716027
24
4
SIU
0.122425953
32
0.120045204
32
5
LTVU
0.066397094
42
0.065091004
43
6
GDU
0.094392046
38
0.091870146
38
7
HVU
0.065940083
43
0.064750778
44
8
YERSIN
0.089737277
39
0.089511372
39
9
POU
0.098999829
36
0.101955809
36
10
UPT
0.101766631
34
0.101101129
37
11
EAUT
0.101435029
35
0.102305368
35
12
HOABINH
0.063064427
44
0.065318647
42
13
KBU
0.12322236
31
0.119602279
33
14
MUT
0.268736308
13
0.269946035
13
15
HNUTM
0.116789888
33
0.113507672
34
16
LAEIU
0.137951013
29
0.137529463
28
17
EIU
0.277003355
12
0.278377578
12
18
MBTU
0.097014255
37
0.125383384
30
19
FBU
0.075696587
40
0.085023767
40
20
Phenikaa
0.132053668
30
0.136331905
29
21
DODOU
0.225210474
17
0.22564269
17
22
DNAU
0.158395652
27
0.165004715
23
23
ETBD
0.179659277
23
0.207514747
20
24
BVU
0.151187129
28
0.146567635
27
25
THDU
0.160383694
26
0.121969917
31
26
DOAU
0.200672286
20
0.162550242
25
27
PDU
0.170611655
24
0.147160837
26
28
UEF
0.20672511
19
0.249096117
14
29
DAU
0.198680859
21
0.20031417
21
30
MKU
0.183935658
22
0.18046447
22
31
DNTU
0.225613268
16
0.2171198
19
32
LHU
0.286361053
11
0.298500728
11
33
SGTU
0.232142527
15
0.233295476
15
34
TLU
0.222613514
18
0.225441212
18
35
THDOU
0.232813577
14
0.225989329
16
36
VHU
0.329473407
8
0.307706258
8
37
HSU
0.287669178
10
0.306373947
10
38
TDU
0.354575965
7
0.360584043
7
39
HBU
0.408564424
5
0.414051348
5
40
HUFLIT
0.302682418
9
0.306391442
9
41
FPT
0.387853364
6
0.379281805
6
42
VLU
0.42124547
4
0.446754237
4
43
DTU
0.718184084
3
0.733087713
2
44
NTT
0.727300685
2
0.698293372
3
45
HUTECH
0.755730737
1
0.776779563
1