
Abstract
Entropy-based nonlinear dynamic techniques have been considered to be a powerful tool and widely and successfully utilized to analyze the vibration signals in rolling bearing. This paper presents a new entropy-based nonlinear dynamic method, called the Grey entropy (GreyEn) for vibration performance degradation evaluation of rolling bearing. Similar to the existing measures, GreyEn is the negative natural logarithm of the conditional probability that two vectors similar for m points remain similar for the next m+1 points. Importing the concept of grey system theory, vectors’ similarity is measured by the grey relational degree (GRD). Simulation signals are employed to evaluate the effectiveness of the proposed method. The results suggest that GreyEn, compared with sample entropy (SampEn) and fuzzy entropy (FuzzyEn), leads to more efficiently measure the complexity. The validity of GreyEn is also assessed through three experimental tests. The experimental results show that GreyEn, compared with SampEn and FuzzyEn, can effectively evaluate the vibration performance degradation of the rolling bearing.
Introduction
Rolling bearings, as they support the machinery, are the essential part of rotary machines.1,2 Therefore, it is of practical noteworthiness to evaluate the degradation of rolling bearings.
Recently, performance degradation evaluation (PDE) of rolling bearings has been a subject of extensive research due to their crucial role in fault diagnosis and prediction of rotating machinery.3,4 The degradation phenomenon over the complete lifetime of the rolling bearings can be mainly summarized in three phases: natural run-in phase, optimal operation phase, and deterioration degradation phase. In PDE, it is critical important to construct a degradation indicator to identify the three stages of bearing deterioration. 5 For a long time, the feature extraction based on time domain methods, 6 frequency domain methods, 7 and time-frequency domain methods8,9 are the main method used by researchers. However, the signals collected from rolling bearing vibration are extremely complex as they are influenced by many factors, including friction, lubricating, surface roughness, roundness error, waviness, and localized defects, assembly clearance, et al.10,11 Some scholars built dynamic models to provide a deep understanding of the bearing vibration mechanism. Jang and Jeong 12 presented a nonlinear model to analyze the ball bearing vibration caused by the waviness in a rigid rotor supported by two or more ball bearings. Babu et al. 13 proposed a 6-DOF vibration model of the roller bearing with waviness on balls and races. Yu et al. 14 proposed a time-varying comprehensive vibration dynamic model which takes the distributed defects and localized defects into consideration. Hence, the vibration signals can hardly be described as simple linear and stationary behaviors and the time domain methods and the frequency domain methods mentioned above inevitably will be limited by their intrinsic characteristics.15,16
To address this issue, many nonlinear dynamic methods have been widely introduced to analyze the vibration signals to get a better insight into the complex signals and then extract the degradation feature hidden in acquired vibration signals that may not be successfully identified by using other existing methods. Efforts have been made to use fractal dimension to describe the non-linear behaviors of vibration signal, 17 identify a gearbox operating condition with fatigue crack or broken tooth compared with the normal condition, 18 detect fixed and drifting bias faults generated in supply air temperature sensor of air handling unit system, 19 study the correlation dimension in engine condition monitoring, 20 characterize the changing trend of degradation progress of rolling bearing, 21 and so on. Efforts have also been made to use chaos theory to evaluate nonlinearly evolutionary process of rolling bearing performance, 22 perform a systematic dynamic analysis of a gear-bearing system with time varying stiffness, gear backlash and surface friction, 23 etc.
Although nonlinear dynamic methods mentioned above are powerful approach to analyze the vibration signals, they still have two following shortcomings. (1) A very large dataset are usually needed to ensure that the calculation results are reliable and convergent, short sequences of practical measured data may lead to false results. 24 (2) They are computationally expensive. 15 To conquer the aforementioned drawbacks, entropy-based nonlinear dynamic methods have attracted the attention of a wide range of researchers and have shown a promising application prospect.
Entropy-based nonlinear dynamic methods were developed to measure the complexity and regularity of the system by phase space reconstruction, which had been proved to be more computationally efficient than traditional nonlinear dynamic methods. 25 Pincus, 26 in 1991, put forward approximate entropy (ApEn) to evaluate the system complexity, which can be effortlessly applied to noisy and short time series. Richman and Moorman, 27 in 2000, developed related measure of time series complexity named sample entropy (SampEn), which agrees with theory much more closely than ApEn over a broad range of conditions. Bandt and Pompe, 28 in 2002, developed another complexity parameters named permutation entropy(PE) for time series based on comparison of neighboring values, which are easily calculated for any type of time series, be it regular, chaotic, noisy, or reality based. Also in 2002, Costa et al. 29 introduced a method to calculate multiscale entropy (MSE) for complex time series, which overcomes the problem that widely used entropy measures are based on single-scale analysis and do not take into account the complex temporal fluctuations inherent in healthy physiologic control systems. In ApEn and SampEn, similarity of vectors is based on Heaviside function which is a kind of conventional two-state classifier. In the real physical world, however, boundaries between classes may be ambiguous, and it is difficult to determine whether an input pattern belongs totally to a class. 24 For this reason, in 2007, Chen et al. 24 developed fuzzy entropy (FuzzyEn) by replacing the Heaviside function with exponential function and removing the mean of matching template.
In recent years, the above entropy-based nonlinear dynamic methods and their improved algorithms have been widely used. Zheng et al. 30 proposed an improved multiscale PE method called generalized composite multiscale PE to extract the fault feature from vibration signal of rolling bearing. Zhang et al. 31 combined PE and ensemble empirical mode decomposition to reveal the multi-scale intrinsic characteristics of the vibration signal. Li et al. 32 presented a signal processing scheme by combining an improved Vold-Kalman filter and the multiscale SampEn for planetary gearboxes under non-stationary working conditions. Xu and Tse 33 combined refined composite multiscale FuzzyEn and support vector machine with particle swarm optimization for diagnosing roller bearing faults. Zhao et al. 34 proposed two improved multiscale entropy called local maximum multiscale entropy and extended multiscale entropy to characterize the rolling bearing vibration signal. However, there is still a drawback that needs to be conquered, that is, the SampEn of white noise is higher than the SampEn of 1/f noise, even though the latter represent more complex structure.29,35 Costa et al. 29 attributed this contradictory phenomenon to single-scale analysis. However, he did not get the correct value of entropy when the scale factor is 1.
In this study, we proposed a novel measure of time series complexity termed grey entropy (GreyEn), and applied it to evaluate performance degradation of rolling bearing. In GreyEn, the vectors’ similarity was determined by the grey relational degree (GRD)36,37 which is developed based on the grey system theory. Grey system theory introduced by Deng Julong in 1982 has been widely employed in abundant research fields because of its superiority in evaluating complex systems with various correlated indicators. The notion of “grey” is used to indicate the system that information is incomplete, “white” and “black” are used to represent the situations where information is complete and situations where information is unknown, respectively. To get more adequate insight into the underlying dynamics feature, we also studied multiscale GreyEn through extending time series to different time scales.
The remainder of this paper is arranged as follows. Section 2 introduces the basic theory of GreyEn and multiscale GreyEn, and then by applying SampEn, FuzzyEn, and GreyEn analyses to the simulation signal, the good performance of the GreyEn is demonstrated. A new rolling bearing performance degradation evaluation method and its experimental validation are given in Section 3. Finally, conclusions are drawn in Section 4.
Theoretical framework of GreyEn and multiscale GreyEn
In the two existing involved complexity measures ApEn and SampEn, similarity of two vectors is based on Heaviside function, which can be expressed as

An apparent drawback of this hard threshold judgment is that a small change near the threshold will lead to the completely opposite result. To overcome this drawback, Chen et al. 24 introduced FuzzyEn and employed the fuzzy function instead of the hard threshold functions to get a fuzzy measurement of two vectors’ similarity based on their shapes. The fuzzy function is the exponential function, which is defined as

Although the similarity does not change abruptly, the disadvantage that the calculated entropy value are inconsistent the real dynamics systems has not been effectively conquered. The basic design of the GRD is to evaluate the correlation between different data sequences by studying the similarity of geometric curves. The more similarity between two data sequences, the higher the correlation degree will be. Therefore, we employed GRD to measure two vectors’ similarity.
Definition of GreyEn
For a time series with length N: {x(i), i = 1,2,3, …, N}, it can be extended to phase space with a given embedding dimension m, as following

The phase point in the phase space can be expressed as

Where i = 1,2, …, M, M = N − (m − 1)q.
For certain vector X m (i), the GRD that indicates the similarity degree between the comparative sequences (Xm(i) and Xm(j)) is defined as following36,37:
X m(i) and Xm(j) are normalized and the new data sequence are obtained as

Where yi(m) = x(i+(m − 1)q)/x(i), k = 1, 2, …, m.

Where yj(m) = x(j+(m − 1)q)/x(j), k = 1, 2, …, m.
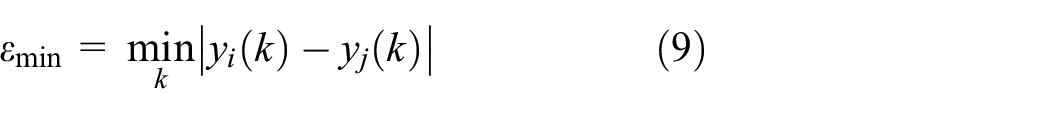
Given the similarity tolerance r, the grey relational coefficient is used to indicate the closeness between Ym(i) and Ym(j), which is defined as

Where


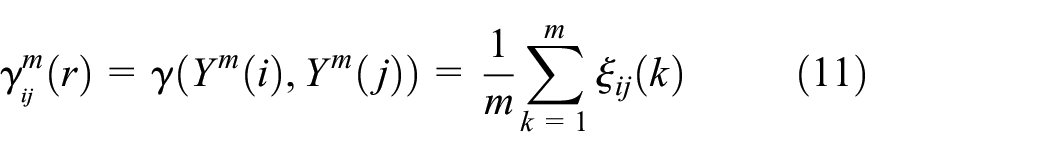
The GRD is defined as
Define the function Φm(r) as

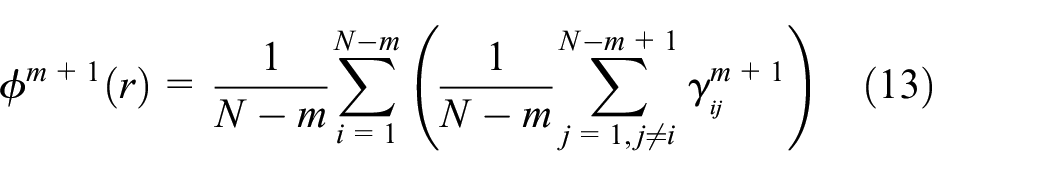
Similarly, for another given embedding dimension m+1, the function Φm+1(r) can be acquired as
Finally, we can define the parameter GreyEn(m, r) of the original sequence as the negative natural logarithm of the deviation of Φm from Φm+1

When the length N of time series is finite, GreyEn(m, r) can be evaluated by the statistic as

The calculation process of GreyEn is shown in Figure 1.

The calculation flowchart of GreyEn.
Multiscale grey entropy
Multiscale grey entropy (MGE) is defined as the GreyEn value of time series over different scales and it can be calculated as following29,30:
For a time series with length N: {x(i), i = 1, 2, 3, …, N}, it can be divided into several coarse-grained time series zk(τ) as
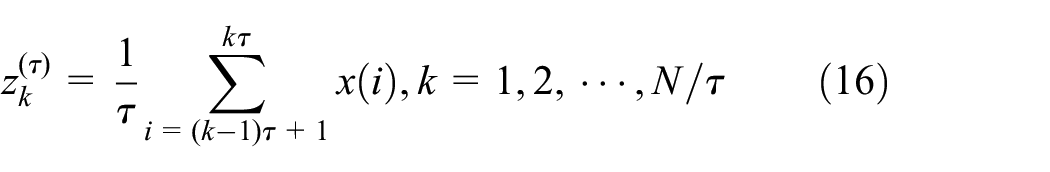
Where τ = 1, 2, …, is the scale factor. When τ = 1, zk(1) is simply the original time series {x(i), i = 1, 2, 3, …, N}.
Calculate GreyEn for each coarse-grained time series zk(τ) and then plot these GreyEn values as a function of scale factor τ. This procedure is called MGE analysis.
Comparison of SampEn, FuzzyEn, and GreyEn
Parameter selection
There are four parameters (data length N, embedding dimension m, time delay q, and similarity tolerance r) that must be fixed for each calculation of GreyEns in different scales. First, although the larger m, the richer the information obtained after phase space reconstruction, a too large m value is disadvantageous owing to the need of a very large N (10m–30m), which is difficult to meet for a rolling bearing vibration data set, or the requirement of a very broad boundary, which will cause information loss. 24 Therefore, embedding dimension m is set as 2. Second, since the time delay q has little effect on the calculation results, time delay q is fixed to 1. Third, similarity tolerance r denotes the boundary width of comparison window and mainly controls the similarity of template matching. According to literature16,24 too broader boundary will lead to more difficult matching of templates and much more statistical information will be lost, while too narrower boundary will make the evaluated result of statistical properties inaccurate and sensitive to noise. Therefore, r often takes a value between 0.1 SD and 0.25 SD (SD is standard deviation of original time series). Finally, since the maximum of scale factor has no certain standard, generally the scale factor τ is set to 20.
Simulation analysis
To illustrate the advantages of the new complexity measure over SampEn and FuzzyEn, we tested its performance on several Gaussian white noises (GW noises) and 1/f noises with different lengths. Figures 2 to 4 show the performance of SampEn, FuzzyEn, and GreyEn on these signals respectively with different lengths of N = 2000, N = 3000, and N = 4000, where m = 2. For N = 2000, N = 3000, and N = 4000, GreyEn values of the 1/f noises are higher than those of the GW noises for all r values, which is consistent with the fact that 1/f noise is much more complex and contains much more information than GW noise. However, SampEn values of the 1/f noises are lower than those of the GW noises for all r values, which indicate poor consistency. Though FuzzyEn shows good relative consistency when the value of r is less than 0.25, it no longer holds the property when the value of r is greater than 0.25. Therefore, the above analysis reveals that GreyEn is an advantageous method for depict the complexity of time series and compared with SampEn and FuzzyEn, GreyEn gets much more consistent entropies for all r values.

SampEn as functions of r.

FuzzyEn as functions of r.

GreyEn as functions of r.
Furthermore, in order to investigate performances of the three statistics of FuzzyEn, SampEn, and GreyEn on different scales and the effect of data length (N) on their entropy calculations, these three statistics are all applied to analyze several GW noises and 1/f noises with different lengths (N = 2000, 3000, 4000, and 5000) and the results are shown in Figure 5, where m = 2, r = 0.15SD. It can be seen from Figure 5 that for different lengths of data, GreyEn values of the 1/f noises are all higher than those of the GW noises for all scale factors (τ), which indicates strong relative consistency of its complexity measurement and its performance is not affected by the data length. Though SampEn shows good relative consistency when the value of τ is greater than 3, it no longer holds the property when the value of τ is less than 3. When the data length is 5000, a higher value of FuzzyEn is assigned to 1/f noise in comparison with GW noises for all scale factors (τ). However, when the data length is less than 5000, FuzzyEn no longer holds the property. This result indicates that the data length has big effect on the calculations of FuzzyEn. To systematically summarize the performance of these three entropy, a comparative analysis is conducted, shown in Table 1. From the table it can be found that GreyEn can get consistent results with the data length of 2000 which is far below the data length required by FuzzyEn. And the table also indicates that testing accuracy of GreyEn on scale is up to 100%. An experiment was conducted on a Laptop computer with a 2.6 GHz dual processor, although it took the GreyEn algorithm 12.9 ms to complete a calculation for 50 data points which is slightly higher than FuzzyEn and SampEn, such a result is already appropriate for online applications. Therefore, the above analysis indicates that the GreyEn is an effective method for describe the complexity of time series.

FuzzyEn, SampEn, and GreyEn of GW noise and 1/f noise on different scales.
The comparative analysis results.

Experiment data validation
To verify the suitability of GreyEn for rolling bearing performance degradation evaluation, we first tested its performance on rolling bearing experiment data offered by Case Western Reserve University, 38 which were often used by related researchers, and then applied the proposed method to analyze our own experiment data of rolling bearing.
Experiment 1
In this paper, the sampled rolling bearing vibration signal under 1797 r/min and sampling frequency 12 kHz is served as the analyzed data. The test bearings are SKF deep groove ball bearings: 6205 and the single point fault diameters are 0.1778, 0.5334, and 0.7112 mm, which were seeded on the inner race of the normal bearings by using electrical discharge. The length of the bearing vibration signal in each state is 1600 points. Since the rolling bearing service process generally includes four stages: health, light damage, medium damage, and severe damage, the normal rolling bearing and three different fault diameters rolling bearings can be used to characterize these four phases respectively. Figure 6(a) shows the raw vibration signal of four rolling bearing working phases.

The vibration signal and GreyEn at various phases of the bearing life (a) vibration signal and (b) GreyEn for vibration series.
It is very important to construct an indicator that can accurately identify the degradation stage of rolling bearings. Since the vibration signal contain physical nonlinear complexity information on the health state of the rolling bearing being monitored, calculating the GreyEn values for each phase would reveal the physical condition of the rolling bearing. Calculate a GreyEn value for every 400 vibration data obtained from the vibration signal and 16 GreyEn values was acquired. For the selection of parameters in GreyEn in the experiment concerning rolling bearing vibration signal, m was fixed to 2 in that the rolling bearing vibration signal are usually short, and r was fixed to 0.15 SD. Figure 6(b) describes the GreyEn values for the four rolling bearing service phases. From Figure 6(b), it can be seen that the GreyEn value has shown a generally decreasing trend as the health of the rolling bearing deteriorates (from Phase I to Phase IV). The GreyEn extracted from vibration signal of normal operation phase (Phase I) varies slowly and nearly stabilize at 0.35. However, as the fault diameter gradually increased, the GreyEn value gradually decreased. The larger the defect size, the lower the GreyEn value. This can be illustrated that generally, the vibration signal of healthy bearing is irregular. And the vibration signals will show obvious periodic characteristics, once local faults appear in the rolling bearing. 30 Besides, the GreyEn varies slowly in each phase and almost stabilize at a fixed value and this can be explained that the calculation effect of GreyEn has strong consistency.
To investigate the suitability of GreyEn on different scales, we calculate GreyEn for each coarse-grained rolling bearing vibration series and the corresponding calculation results are shown in Figure 7. From Figure 7 it can be found that for all scales, as the working condition of the rolling bearing deteriorates, the GreyEn values for the vibration signal monotonically decreases. This result shows that GreyEn has good consistency on all scales. It is worth mentioning that although for scale 2 (τ = 2), the GreyEn values of the four phases show a significant stepwise decline, GreyEn values of the four phases will be more or less indistinguishable for other scales. This can be explained that when τ equals 1, as the coarse-grained time series is the original time series which contains a lot of noise, the noise contained in the vibration signal will affect the calculation effect of GreyEn. When τ equals 2, the coarse-grained time series can significantly reduce noise. However, while the coarse-grained time series can also play a role in reducing noise for τ > 2, more and more useful information is lost as the scale increases.

GreyEn for rolling bearing vibration series on different scales.
For comparison purpose, SampEn and FuzzyEn of the rolling bearing vibration signal also are calculated, and the corresponding results are given in Figures 8 and 9. The mean values of the GreyEn of each phase were used to represent the actual GreyEn values of the respective signal phase. By observing the Figure 8, it can be found that SampEn values for the vibration signal has shown a generally trend of decreasing first and then increasing as the condition of the bearing deteriorates (from Phase I to Phase IV) at most scales. Such a trend cannot truly reflect the deterioration of the measured rolling bearing. By observing the Figure 9, it can be found that while for scale 1 the FuzzyEn values have shown an increasing trend corresponding the deterioration of the rolling bearing’s health condition, such a trend is not consistent with the trend of the rolling bearing vibration signal complexity. And for all other scales, FuzzyEn does not show obvious regularity. In contrast, the GreyEn yields consistent findings for all scales. Therefore, the above analysis indicates that GreyEn is superior to SampEn and FuzzyEn in evaluation the degradation trend of rolling bearings.

GreyEn and SampEn at each phase of the rolling bearing vibration signal.

GreyEn and FuzzyEn at each phase of the rolling bearing vibration signal.
Experiment 2
In this part, the GreyEn is employed to analyze the performance degradation data of a rolling bearing over its entire life-time. To simulate the rolling bearing’s natural degradation process, accelerated bearing life tests over the whole life time were conducted at the Hangzhou Bearing Test and Research Center. The basic layout of the test rig is shown in Figure 10, which consists of monitoring system, transmission system, loading system, lubrication system, computer control system, and so on. Table 2 shows the test condition. One data is recorded every minute, and 8000 vibration data (about 135 h) were recorded in total. The accelerated life test was carried out successively until the crest factor of vibration signal over-passed the set value. The waveform of the vibration signal is shown in Figure 11(a), from which it can be found that the vibration amplitude acquired from the test rolling bearing has shown a generally increasing trend. The vibration signal obtained from the whole life can be generally recognized as the three degradation phases (I through III) which correspond to the normal operation phase, light damage phase, and severe damage phase respectively.
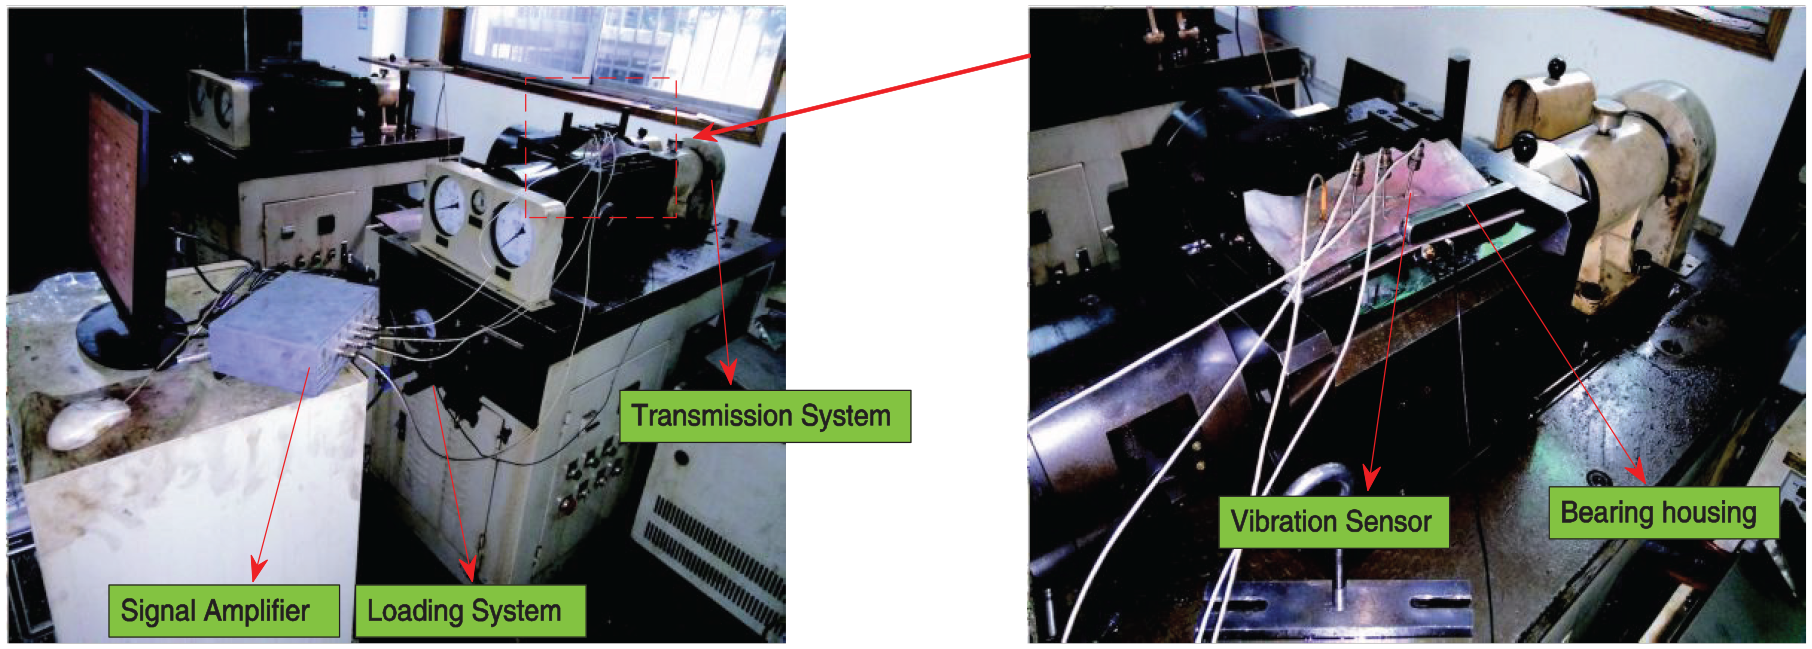
The experimental setup of the bearing test system.
The test condition of the bearing test system.

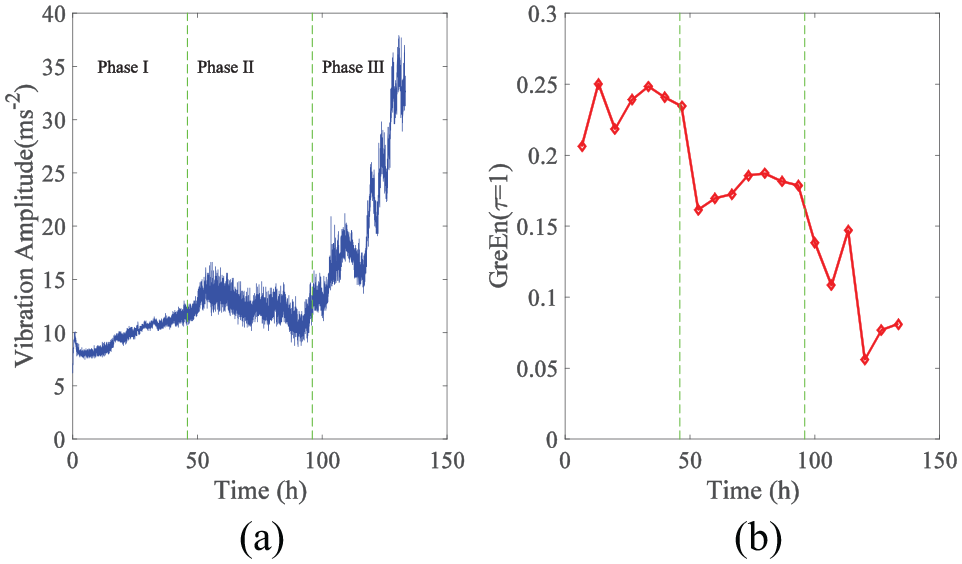
The vibration signal and GreyEn at various phases of the bearing life (a) vibration signal and (b) GreyEn for vibration series.
Calculate a GreyEn value for every 400 vibration data obtained from the vibration signal and 20 GreyEn values was acquired. For the selection of parameters in GreyEn, m was fixed to 2, and r was fixed to 0.15 SD. Figure 11(b) describes the GreyEn values for the rolling bearing vibration signal. It can be seen from Figure 11(b) that the GreyEn values show a significant stepwise decline trend. Such a trend is consistent with the evolution trend of dynamic complexity of rolling bearing. This indicates that the GreyEn can accurately identify the three degradation phase (from Phase I to Phase III) of the rolling bearing. The GreyEn also be calculated for each coarse-grained time series of the vibration signal, and the corresponding results are shown in Figure 12. As seen in Figure 12, the GreyEn appears to yield consistent results for all scales.

GreyEn and SampEn at each phase of the rolling bearing vibration signal.
To enable performance comparison, SampEn and FuzzyEn of the rolling bearing vibration signal also are calculated, and the corresponding results are given in Figures 12 and 13 respectively. It can be seen from Figures 12 and 13 that for all scales, FuzzyEn and SampEn are all fail to characterize the degradation feature of the rolling bearing obviously. The above analysis show that the GreyEn presents an inherently more effective measure for characterizing the degradation feature of rolling bearing being monitored than the SampEn and FuzzyEn.
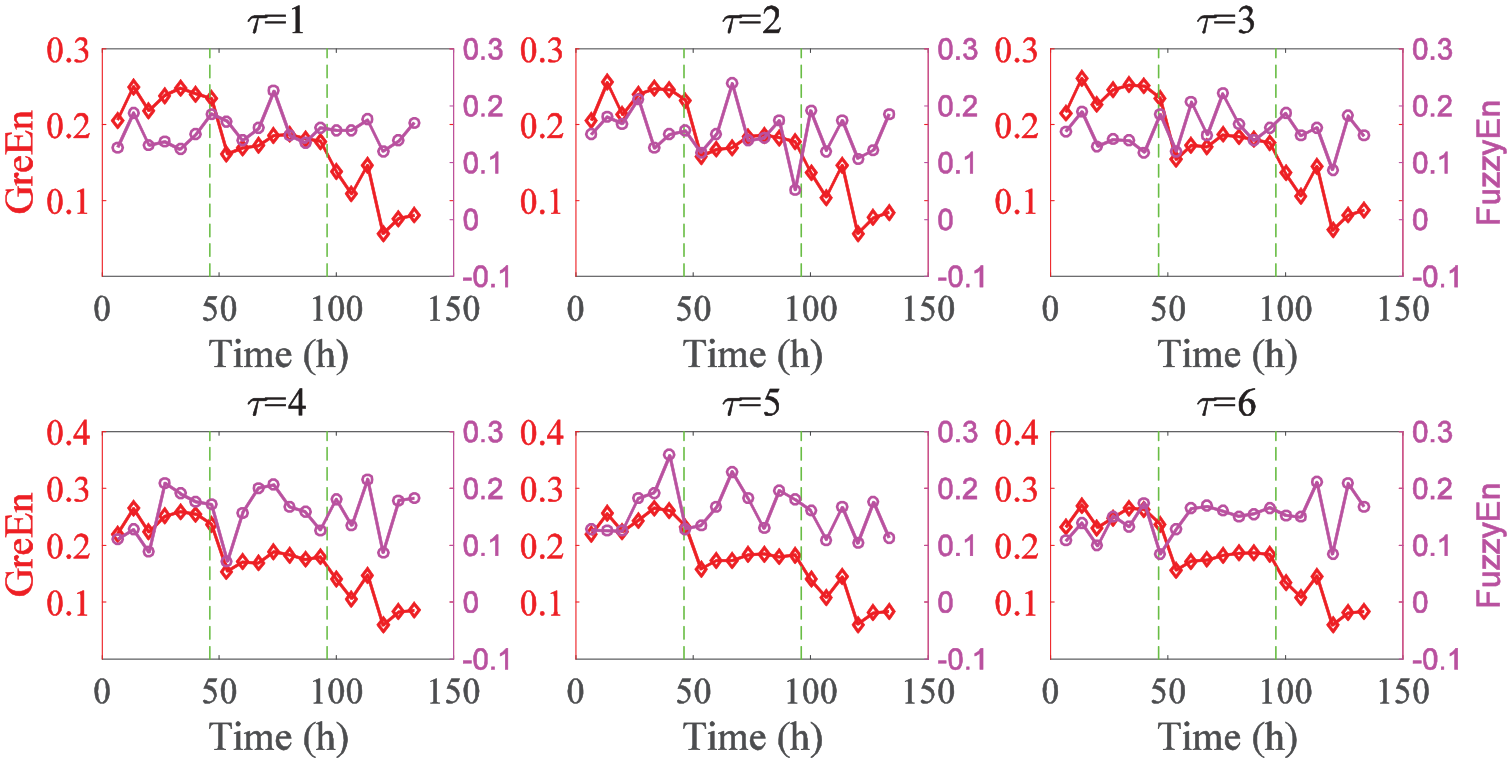
GreyEn and FuzzyEn at each phase of the rolling bearing vibration signal.
Experiment 3
In this part, another accelerated bearing life test over the whole life time was conducted at the Hangzhou Bearing Test and Research Center, the basic layout of the test rig is the same as experiment 2. The test condition is shown in Table 3. The waveform of the vibration signal is shown in Figure 14(a), from which it can be found that the vibration amplitude acquired from the test rolling bearing has shown a generally increasing trend. The vibration signal obtained from the whole life can be recognized as the three degradation phases which correspond to the run-in phase, normal operation phase, and damage phase respectively.
The test condition of the bearing test system.


The vibration signal and GreyEn at various phases of the bearing life (a) vibration signal and (b) GreyEn for vibration series.
Calculate GreyEn with the same parameters as in experiment 2, and 14 GreyEn values was acquired. Figure 14(b) describes the GreyEn values for the rolling bearing vibration signal. It can be seen from Figure 14(b) that the GreyEn values show a significant stepwise decline trend. Such a trend is consistent with the evolution trend of dynamic complexity of rolling bearing. This indicates that the GreyEn can accurately identify the three degradation phase (from Phase I to Phase III) of the rolling bearing. The GreyEn also be calculated for each coarse-grained time series of the vibration signal, and the corresponding results are shown in Figure 15. As seen in Figure 15, the GreyEn appears to yield a consistent result for all scales.

GreyEn and SampEn at each phase of the rolling bearing vibration signal.
The SampEn and FuzzyEn of the rolling bearing vibration signal also are calculated, and the corresponding results are given in Figures 15 and 16 respectively. It can be seen from Figures 15 and 16 that for all scales, FuzzyEn and SampEn are all fail to characterize the degradation feature of the rolling bearing obviously. The above analysis fully illustrates the effectiveness and superiority of GreyEn over FuzzyEn and SampEn.
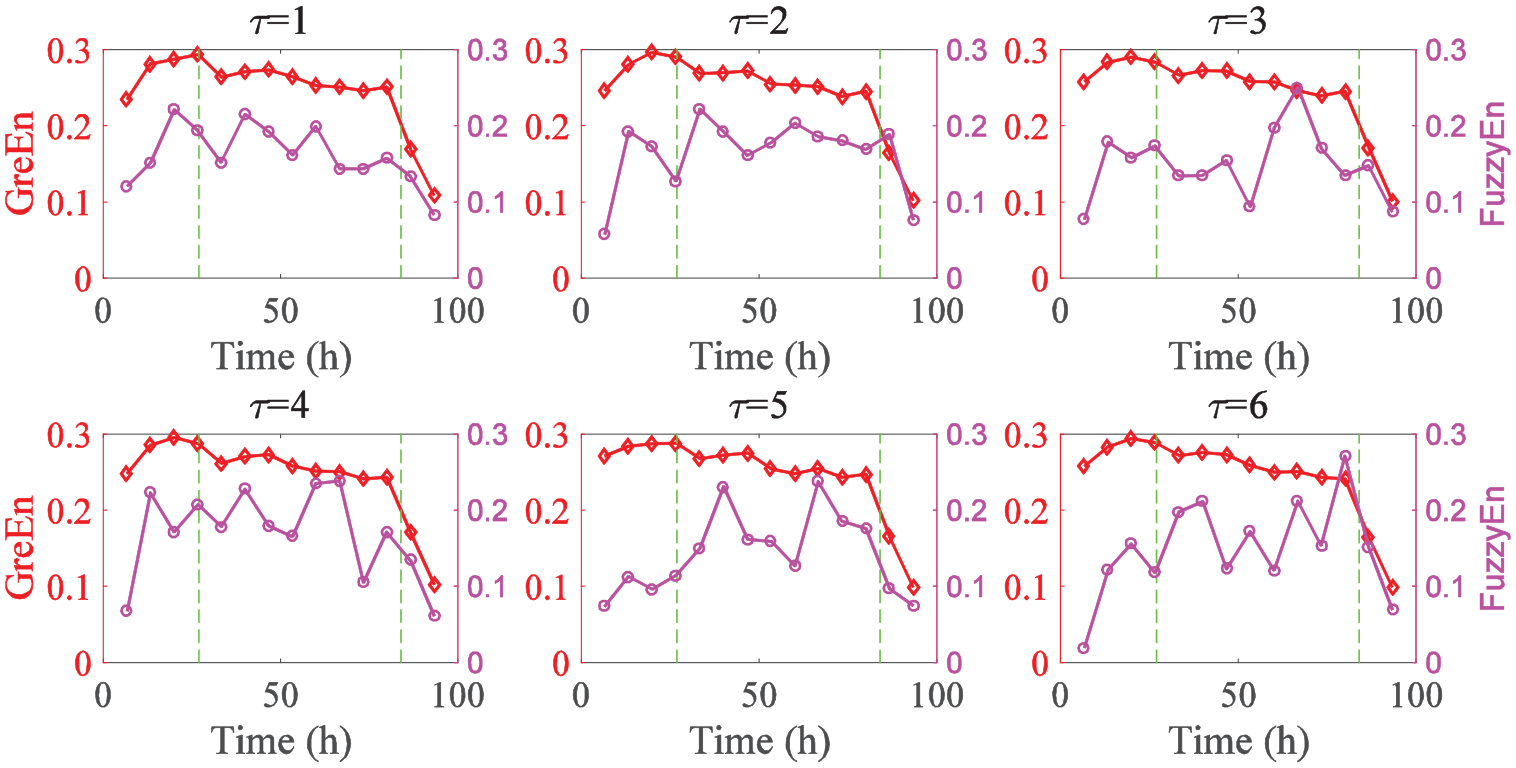
GreyEn and FuzzyEn at each phase of the rolling bearing vibration signal.
Conclusions
In this paper, a novel nonlinear dynamic parameter named grey entropy (GreyEn) is proposed for measuring the complexity of time series. In the proposed methods, the vectors’ similarity was determined by the grey relational degree. We have compared it with the known complexity parameters (SampEn and FuzzyEn) and found that GreyEn has the following advantages,
The considered parameters being fewer for calculation. For GreyEn and SampEn, each calculation only needs to fix four parameters (data length N, embedding dimension m, time delay q, and similarity tolerance r), but the calculation of FuzzyEn must fix five parameters (data length N, embedding dimension m, time delay q, similarity tolerance r, and exponential function parameter n).
The required data length being short. Only when the data length reaches 5000, FuzzyEn can get consistent calculation results for all scale factors, while the data length required for GreyEn is only 2000.
For GreyEn, the calculation results with different similarity tolerance r are consistent. Though FuzzyEn shows good relative consistency when the value of r is less than 0.25, it no longer holds the property when the value of r is greater than 0.25. SampEn holds poor consistency for all r values.
Experimental investigations on vibration signals of rolling bearings have found that grey entropy could accurately identify the performance degradation phase of the rolling bearing. The next work will be focused on applying grey entropy to assess the reliability of rolling bearing vibration performance.
Footnotes
Handling Editor: Chenhui Liang
Declaration of conflicting interests
The author(s) declared no potential conflicts of interest with respect to the research, authorship, and/or publication of this article.
Funding
The author(s) disclosed receipt of the following financial support for the research, authorship, and/or publication of this article. This research was funded by the National Natural Science Foundation of China (Grant No. 51475144) and the National Natural Science Foundation of China (Grant No. 52075500).