
Abstract
The gearbox of the small joint steering gear of a service robot is characterized by a compact structure, a large reduction ratio, and a special manufacturing and assembling technology. However, when a tooth in the gear is broken, the gear transmission can be still maintained, so it is difficult to identify the broken tooth accurately. In order to provide a theoretical basis for the identification of a broken tooth in the study, the influence of gear tooth fracture on the time-varying meshing stiffness in the transmission process was firstly analyzed theoretically and its influencing mechanisms on the time domain and frequency domain characteristics of transmission error (TE) were further analyzed. Then, the TE measurement test bench of the joint steering gear was designed. The signal-to-noise ratios and root-mean-square errors of the TE data processed by wavelet noise reduction, Kalman filtering and combined wavelet-Kalman filtering algorithms were compared and analyzed. The analysis results showed that the joint algorithm had the best performance. Next, the TE data measured under multiple working conditions were processed with the joint filtering algorithm to obtain the time domain results and then the frequency domain results were obtained by Fourier transform. Whether there was a broken tooth in the joint steering gear could be judged based on the difference between the maximum and minimum values of the TE in the time domain. The broken-tooth gear shaft could be positioned based on the frequency of TE mutation waveform. Furthermore, combined with the frequency domain, the accurate identification of the position of the broken gear can be realized. Finally, the accurate positioning method of broken teeth was applied in the product inspection process. Broken teeth were successfully identified and located, thus proving the effectiveness of the identification method.
Keywords
Introduction
The joint steering gear module is one of the core components of a service robot and plays a decisive role in its motion accuracy. Reducers used in the joint steering gear are mainly classified into harmonic reducers and gearbox reducers. Gear transmission has the advantages of constant instantaneous transmission ratio, high bearing capacity, compact structure, and high transmission efficiency1,2 and is widely used in the joint steering gear of small service robots. In the production and assembly process of a joint steering gearbox, due to the special material and manufacturing process of the gear, the gear tooth crack, and other defects may occur and result in tooth breakage. Therefore, a small number of bad products with a broken tooth may enter the assembly process due to the inspection difficulty. In the operation process, the frequent starting/stopping switching of the joint steering gear causes more internal vibration and impact, thus affecting the positioning accuracy and stability of a robot. The design structure and production process of the gearbox may lead to the large backlash and low matching accuracy of gear transmission. Repeated impact may also increase the defects and lead to cracks and tooth breakage. In addition, a small service robot is mainly applied in children’s intelligence education. Children are the main users and a small robot is prone to fall. When a small robot falls, a joint steering gear is greatly impacted, thus leading to internal gear cracks or direct fracture. The joint steering gear is composed of drive controller, small motor, encoder, shell, gear transmission system, and other components. Figure 1 shows the internal physical components of a joint steering gear.
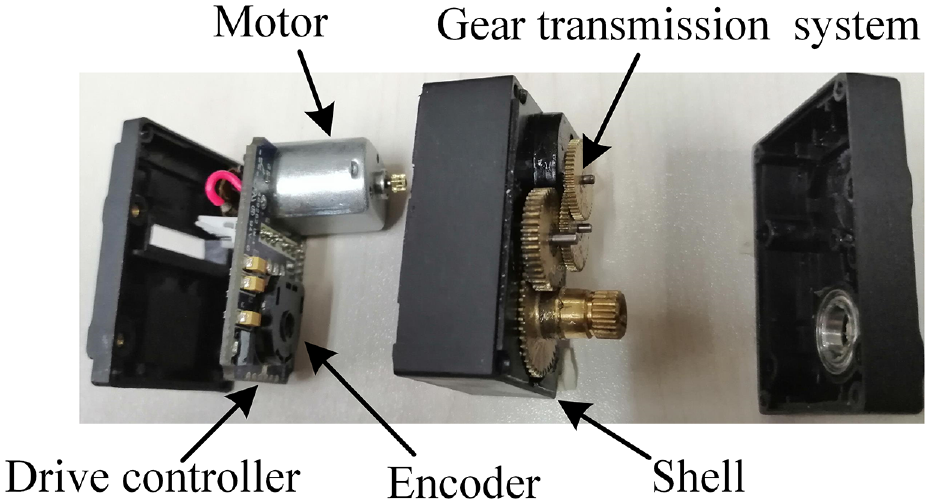
Internal components of a joint steering gear.
At present, in the ex-factory inspection or return-to-factory repair of the joint steering gear of a service robot, maintainers mostly rely on experiences to judge the fault based on sound. If further fault confirmation is required, the joint steering gear needs to be disassembled and inspected, thus causing the waste of human resources. Therefore, it is necessary to propose a reliable detection method and design a set of practical detection devices for the purposes of processing the measured data and realizing the rapid identification and accurate location of tooth defects of a joint steering gear. Especially in the ex-factory inspection stage, due to the noisy environment in the factory, it is difficult to accurately inspect a large number of steering gears artificially and misjudged steering gears may be delivered. The inspection based on the disassembly and assembly of misjudged steering gears is inefficient and easy to cause damage to qualified products.
The performance measurement of a joint steering gear has been explored. A comprehensive performance test machine for the joint steering gear of a service robot was developed to realize the measurement of multiple performance parameters of the joint steering gear. 3 Based on the measurement of joint steering gear backlash, the evaluation index of transmission accuracy was proposed. 4 In Visual Studio C++ environment, a set of test software was designed for the joint steering gear of a service robot to test mechanical and electrical parameters and transmission accuracy. 5
Transmission error (TE) is an important evaluation index of the transmission performance and meshing state of a joint steering gear.6–8 A mathematical calculation model of a pair of gear drives was proposed based on the consideration of the influences of gear meshing stiffness, micro-modification, and tooth profile error. 9 The measurement and evaluation system of backlash for a precision reducer was studied and a dynamic measurement method of backlash based on bidirectional TE method was proposed.10,11
In the fault detection of a gear transmission system, an artificial neural network algorithm was applied. 12 Under unloading or loading conditions, the working state of a gear was analyzed with gearbox vibration data. The multi-degree-of-freedom dynamics model of the gear transmission system was explored based on the consideration of the influence of gear damage.13,14 By means of static simulation and dynamic simulation, the influences of gear defects on the gear transmission performance were studied. 15 The bending-torsion coupling simulation model of the gear transmission system was established 16 and the gear tooth breaking fault test was performed under different loading conditions for the comparison of time domain and frequency domain results.
A variety of data processing methods were used in gear fault detection. The wavelet noise reduction method was used to process terahertz signals 17 and the comparison between terahertz images before and after noise reduction showed that the peak signal-to-noise ratio and visual effect of the image obtained after wavelet noise deduction were improved. With a wavelet noise reduction method based on the unsupervised learning model, the experimental analysis was performed 18 and the analysis results indicated that this method had the good noise reduction performance and achieved the better results in peak signal-to-noise ratio (PSNR) and structural similarity index (SSIM). In order to deal with the discontinuity of hard threshold functions and the constant deviation of soft threshold functions in the process of wavelet noise reduction, an improved threshold function was used 19 and the dynamic wavelet threshold noise reduction algorithm was realized with the DSP platform for the dynamic compensation of the system. Kalman filter was used in noise control system to suppress pipeline noise and Kalman algorithm results obtained in DSP showed that this method could achieve a SNR of 30 dB 20 Kalman filter was designed on the special STM32 platform and applied in the aircraft data processing system, thus reducing the measurement noise of inertial measurement elements and GPS and improving the position estimation accuracy of UAV. 21 The signal noise reduction method integrating wavelet and Kalman filtering was studied and the noise removal effect of actual signals proved the high performance of the method. 22 The combined wavelet-Kalman filtering noise reduction method was adopted to retain the better image edge in the noise filtering process and achieved good filtering effects. 23 Wavelet noise reduction was also combined with Kalman filtering to reduce signal noise and improve the tracking accuracy and robustness of Global Navigation Satellite System (GNSS). 24
Wavelet decomposition has the adaptive time-frequency localization function and can distinguish useful signals from noise signals. Compared with traditional filtering methods, wavelet decomposition retains original signal characteristics to the largest degree and has the less loss of signal details. In Kalman filter algorithm, it is not required to store a large number of observation data. Kalman filter algorithm can update the optimal estimation value in time when there is any new observation data. The algorithm is increasingly used in dynamic data processing. The combined wavelet-Kalman filtering algorithm can reduce the loss of signal details, realize the optimal estimation of measurement data, and comprehensively reflect the characteristics of the original signal. The method based on wavelet analysis and Kalman filtering has been widely used in image processing, laser gyroscope, inertial navigation, GPS data dynamic processing and other fields.25–29
The test and analysis of the joint steering gear of a small service robot has always been a hotspot in recent studies, but a common method for testing the performance parameters of a joint steering gear gearbox is not available and the development and design of test devices are seldom explored. At present, the identification of cracks and broken tooth defects in traditional gears have been extensively explored, but the defect identification method for small modulus gears for joints (copper gear or plastic gear) of service robots is seldom reported. The data processing method of TE measurements need to be further explored and improved. Therefore, it is necessary to develop joint measurement devices for service robots so as to identify and accurately locate broken teeth in the joint of service robots based on measured TE.
In this paper, with the joint steering gear of a small service robot as the research object, the stiffness difference between a normal gear and a defective gear was qualitatively analyzed. In addition, the TE difference between a normal gear and a defective gear was further analyzed in time domain and frequency domain. The TE test bench was developed independently. In order to eliminate the interference of noise signal in the acquisition process of the TE data, the wavelet noise reduction, Kalman filtering, and the combined wavelet-Kalman filtering noise reduction algorithms were compared. The combined wavelet-Kalman filtering algorithm was determined as the optimal data processing method. Through joint noise reduction and frequency spectrum analysis of the measurement data obtained with the developed test bench, the identification and location method of gear tooth defects was established based on the time domain and frequency domain characteristics of TE. Then, the method was integrated into the self-developed test bench for experimental verification. The experimental results showed that the identification effect of the gear tooth defect was accurate.
The main structure of this paper includes introduction, accurate positioning method of broken teeth, experimental results, and conclusions. The accurate positioning method of broken teeth includes the influence of broken teeth on transmission error, the development of test bench, the comparative analysis of data processing methods, and the realization method of accurate positioning of broken teeth.
Influences of gear tooth defects on TE
In the process of spur gear transmission, in order to ensure the continuous and stable gear meshing transmission, the contact ratio is generally between 1 and 2. In other words, both a single-tooth meshing area and a double-tooth meshing area occur in the process of gear meshing transmission. Tooth fracture may occur at any position of the tooth surface. The schematic diagram of the fracture area is shown in Figure 2. In Figure 2, the blue and red areas represent the double-tooth meshing area and the green area in the middle of the tooth profile is the single-tooth meshing area. In addition, it is assumed that the tooth fracture direction does not intersect with the meshing line. The stiffness variation trend of a single gear tooth after fracturing at different positions is shown in Figure 2. The transition position in the meshing area where a broken tooth occurs can be derived from the trend of the stiffness of the broken tooth in adjacent zones (Figure 3).
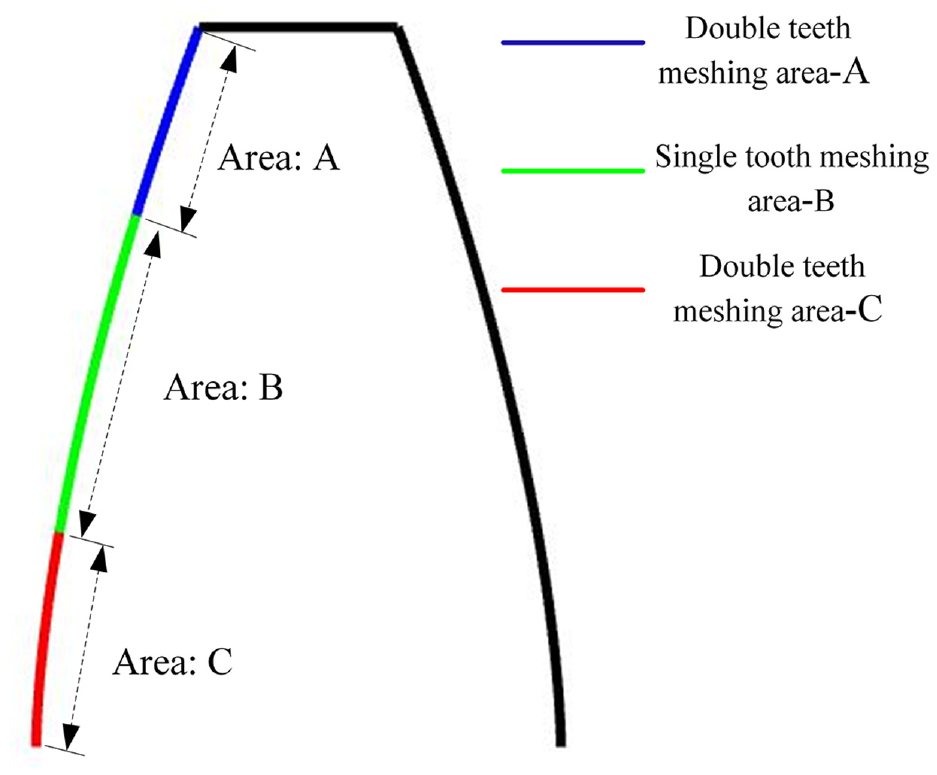
Division results of a tooth.
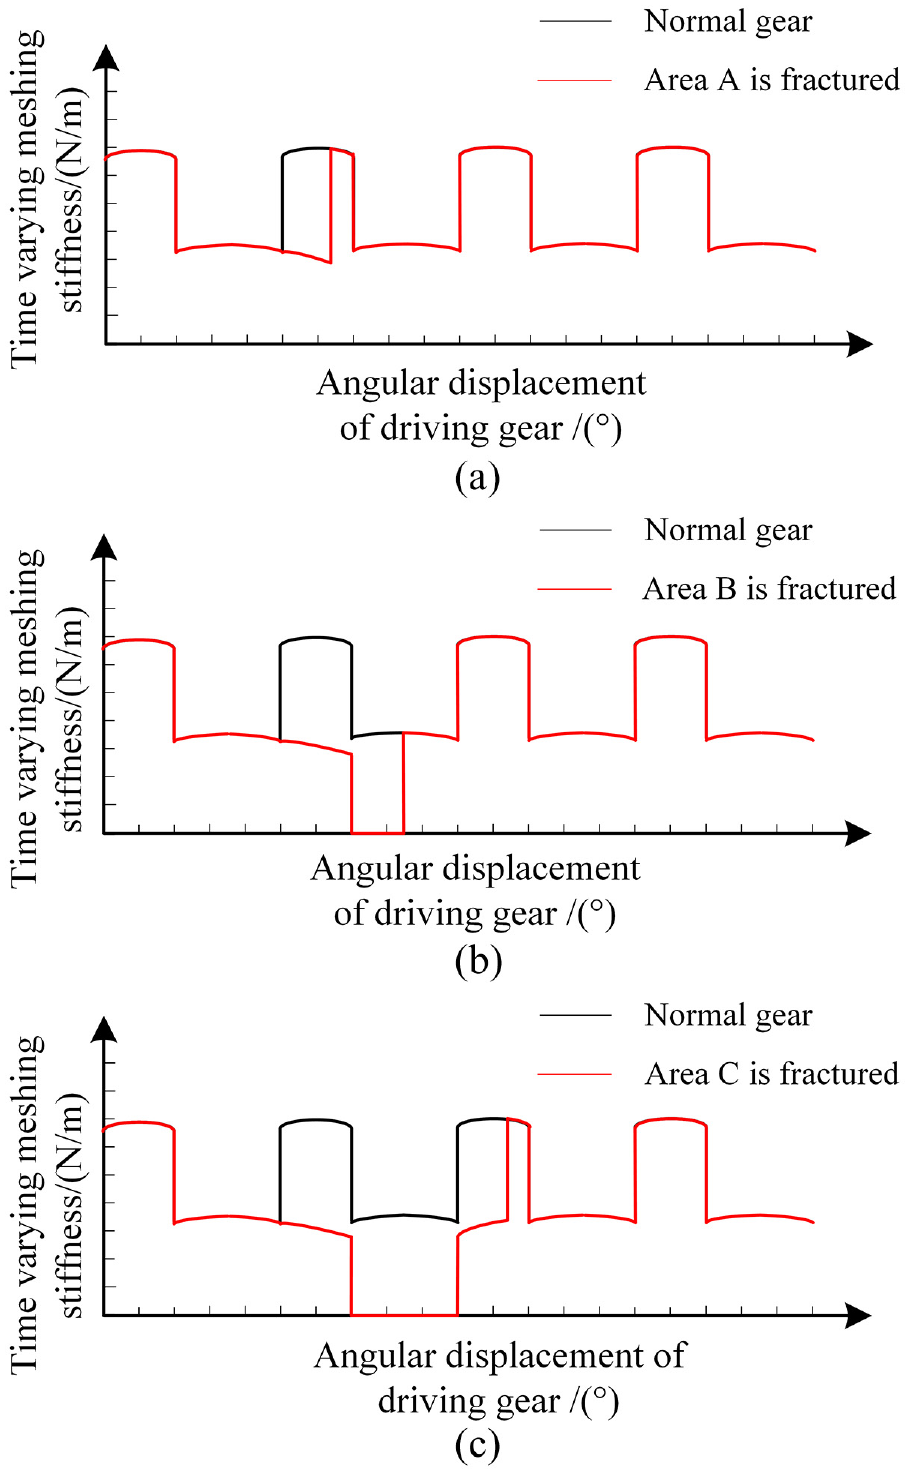
Trend of fracture stiffness of a single tooth.
When a single tooth breaks, the meshing stiffness of the gear changes obviously. It changes abruptly at the position of the broken tooth. Then, the meshing stiffness becomes normal after the broken tooth. Therefore, in the time domain, the times of sudden changes in meshing stiffness is equal to the rotation frequency of the gear shaft with a broken tooth. In the frequency domain, the change in the meshing stiffness affects the gear meshing frequency and its high-order harmonic components. TE is affected by gear meshing stiffness. When the meshing stiffness curve changes suddenly, the TE curve also changes simultaneously. Therefore, through the analysis of the change of gear meshing stiffness in the case of a broken tooth in the gear meshing transmission process, the conclusions can be drawn as follows:
In the time domain, the TE can identify a sudden change in an ideal state and the change frequency is equal to the rotation frequency of the broken-tooth shaft.
In the frequency domain, sidebands appear near the meshing frequency and corresponding high-order harmonics are in an ideal state. The number and amplitude of sidebands are large.
Test bench for the joint steering gear of a service robot
Joint steering gear module of a small service robot
The locating accuracy and motion stability of the joint steering gear module directly influence the working performance of the robot and it is an important basic component of the service robot. Figure 4 shows the positions of internal joint steering gears of a small service robot.
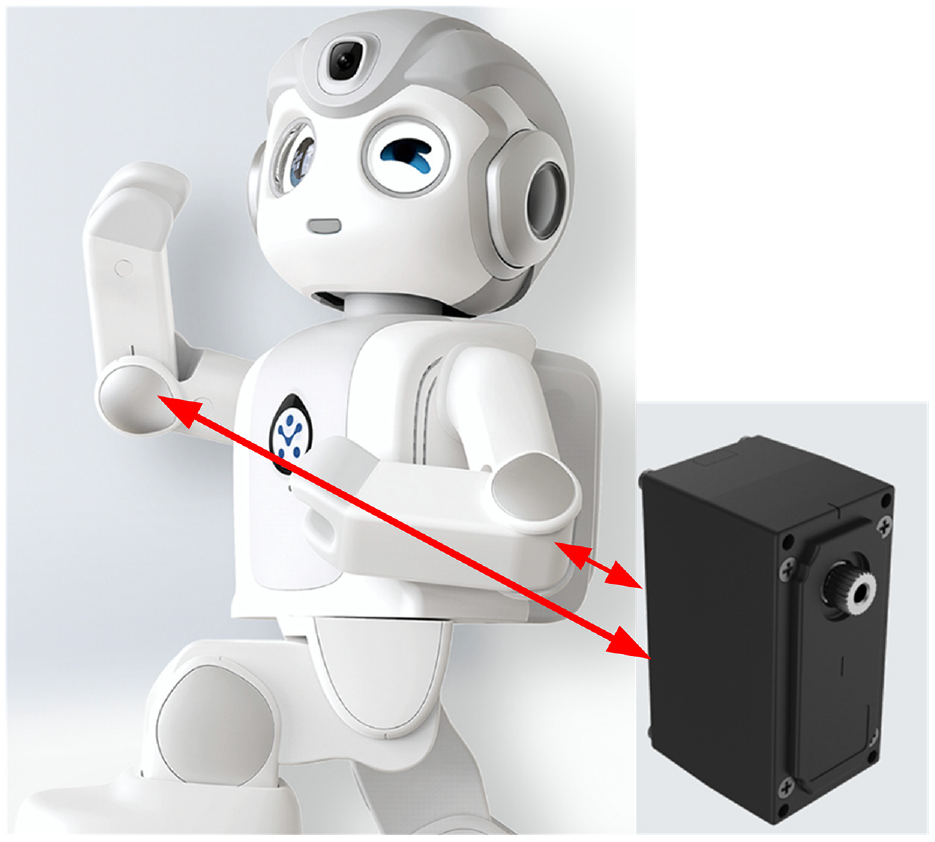
Joint steering gear of a small service robot.
Measurement principle of TE
Due to the influences of gear machining error, assembly error, and time-varying meshing stiffness in transmission process, the difference between the actual position and theoretical position of a driven gear, TE, is generated. TE is usually expressed with angular displacement 7 :
where
In the actual measurement process, the initial angles of input end and output end are generally set to zero. The instantaneous TE of the joint steering gear is calculated by reading the angle data of input magnetic encoder and output grating. In the measurement process, the system firstly idles in order to ensure that both input end and output end are in a stable state, and then the angle data of input encoder and output grating are recorded to calculate the TE of reducer.
Test bench of TE
The test bench of TE mainly consists of gripper part, circular grating (±1.44″), torque sensor (±1‰ N·m), and load motor (±5‰ N·m). The structure diagram and physical picture of the TE test bench are shown in Figure 5.
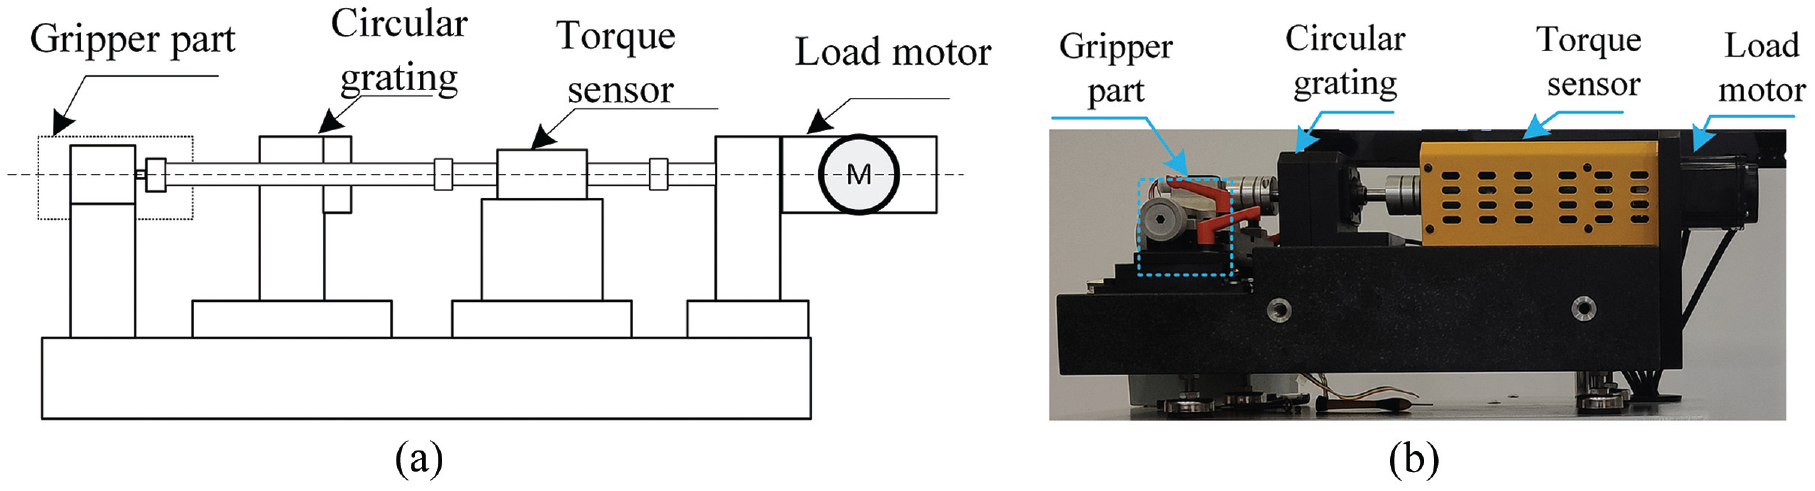
Structure diagram and physical picture of the test bench: (a) structure diagram of the TE test bench and (b) physical picture of the TE test bench.
Figure 6 shows the working principle of the test bench. The location information of encoder at input end of the joint steering gear is transmitted to an industrial control computer via CAN communication. The communication rate is 1 MHz and can ensure the transmission speed and quality of position signals. The data of circular grating and torque sensor are uploaded to a host computer through a data acquisition card. The host computer controls the torque of the load motor via an analog conversion module. RS232 communication mode is adopted between the power analyzer and the host computer. Figure 7 shows the whole test bench machine. It can measure TE, rotational speed, torque, voltage, current, efficiency, maximum output power, reverse starting torque, and maximum torque of joints.
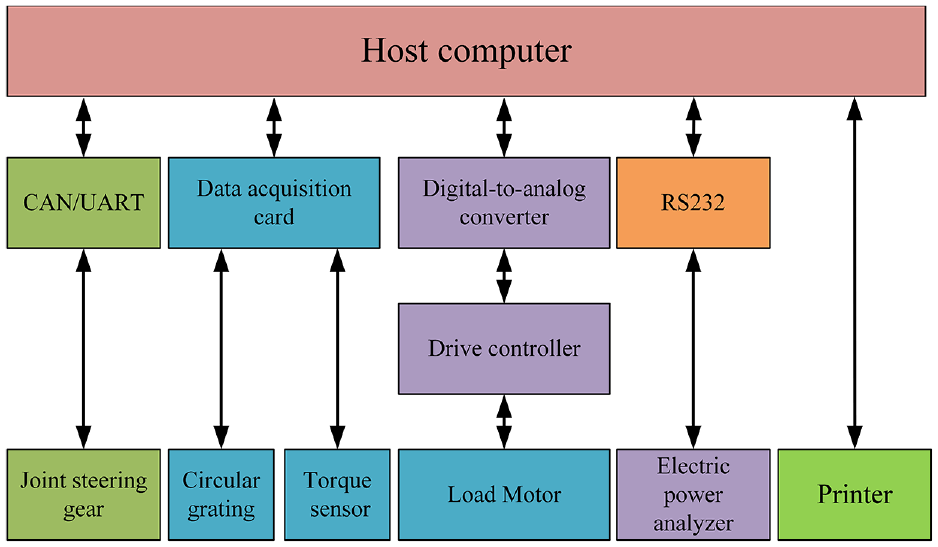
Working principle of the test bench.
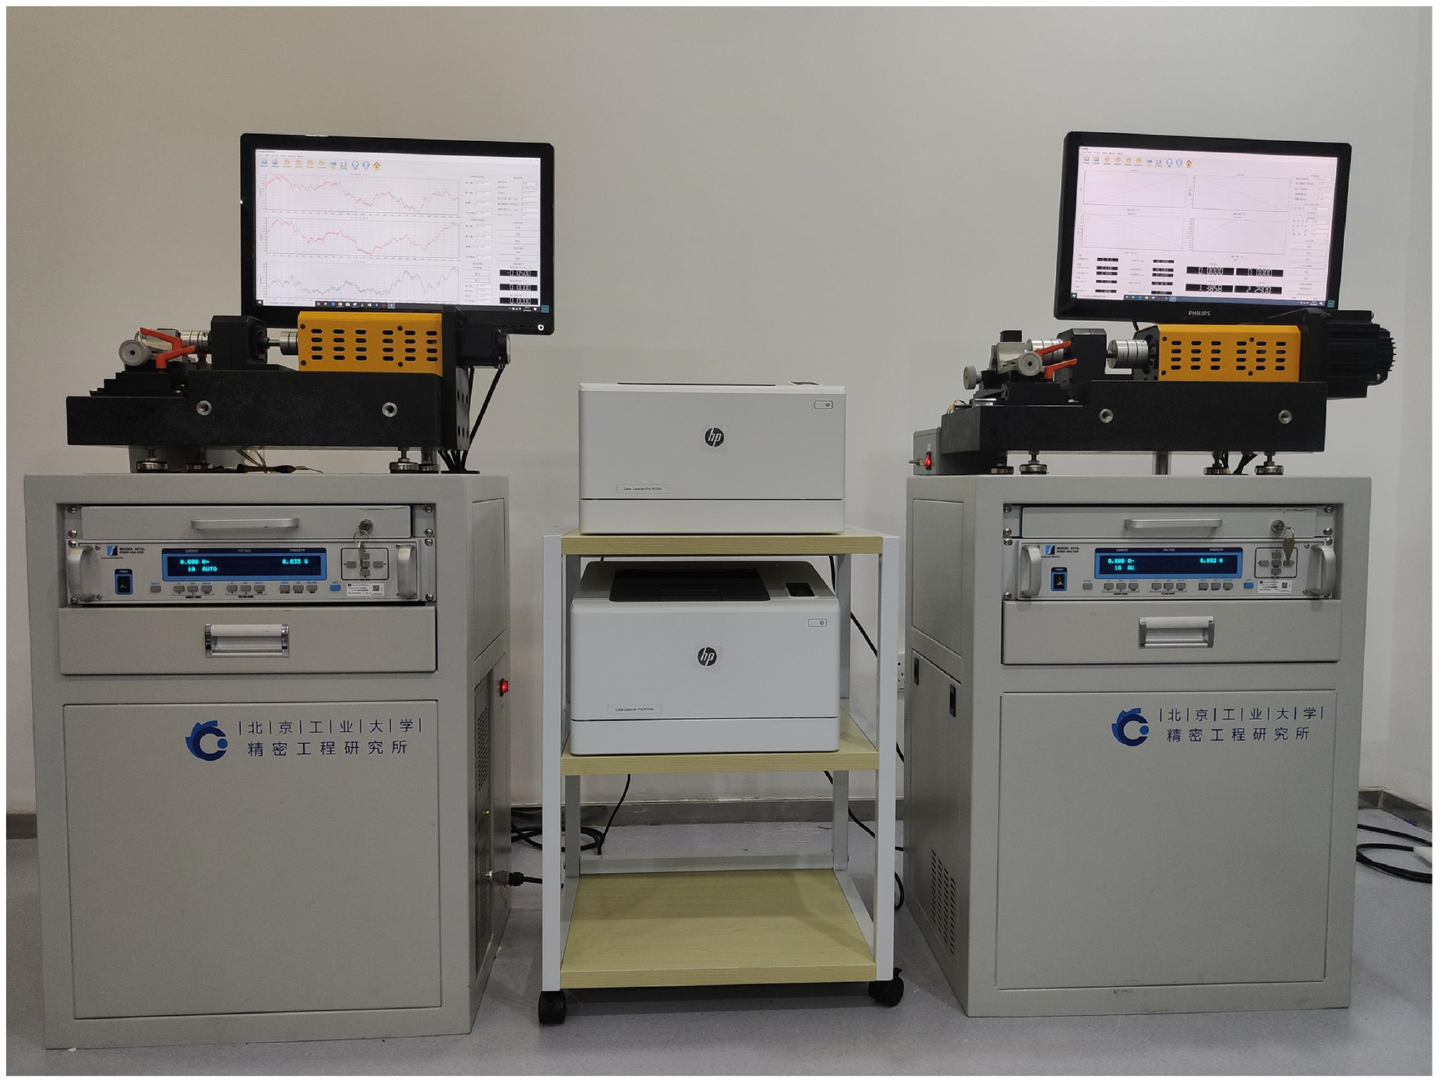
Test bench machine.
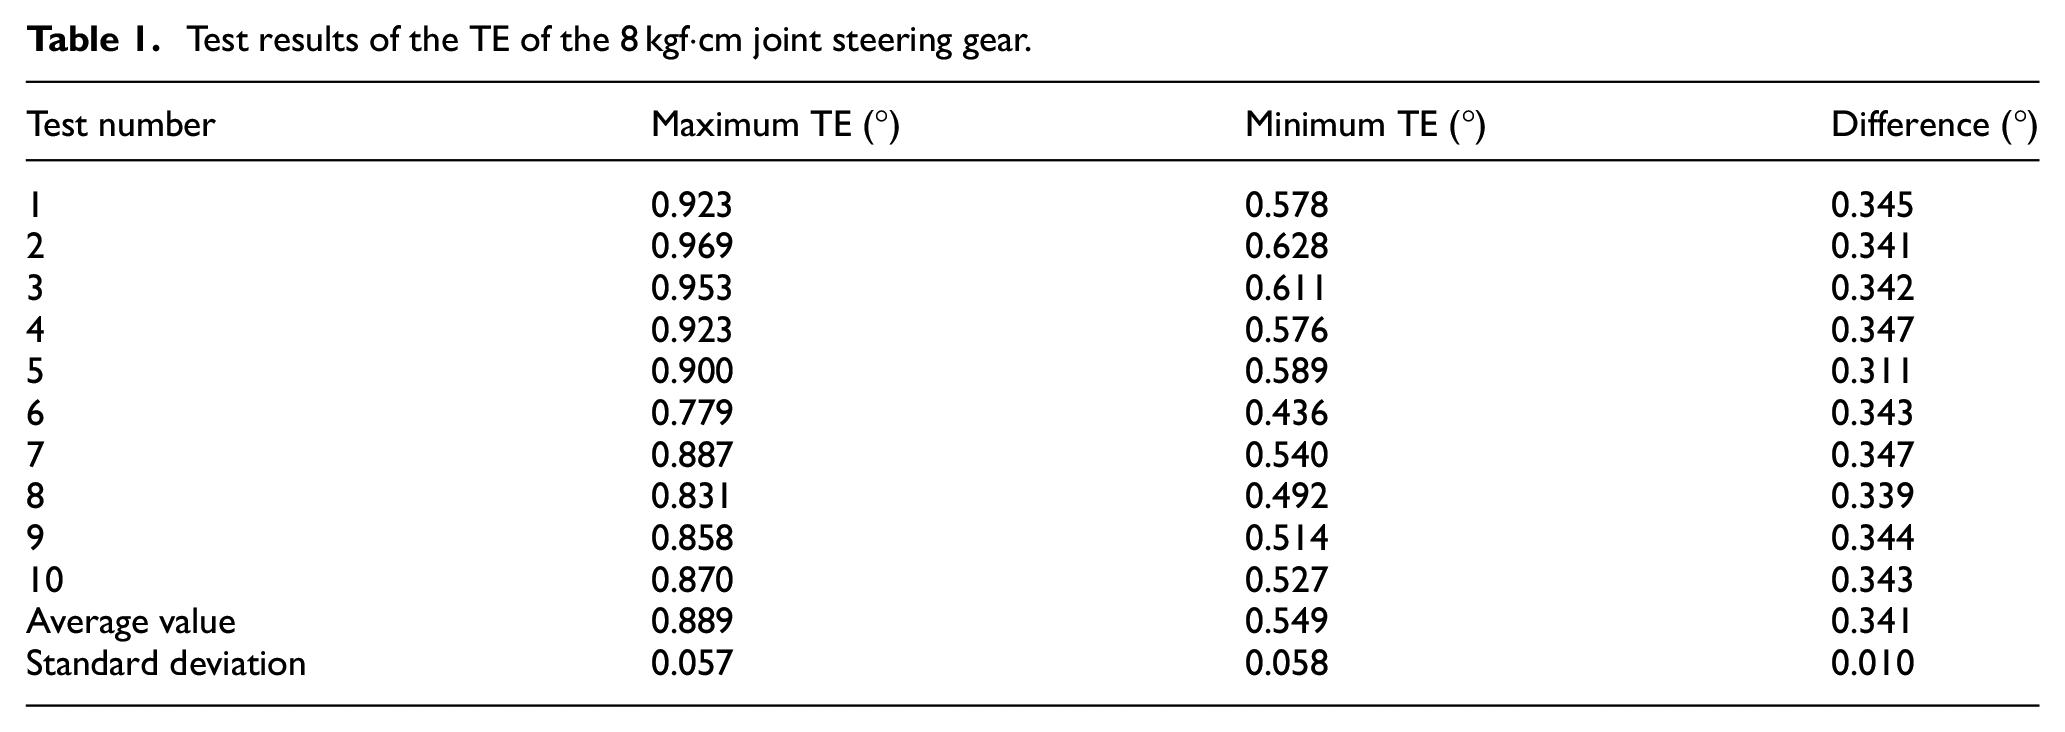
In the unloaded state, the TE of the 8 kgf·cm joint steering gear was repeatedly tested. The results are shown in Table 1. The standard deviation of maximum TE was 0.057. The standard deviation of minimum TE was 0.058. The standard deviation of the difference between maximum and minimum TE was 0.010, proving that the test bench had good repeatability.
Test results of the TE of the 8 kgf·cm joint steering gear.
Comparative analysis of three TE noise reduction methods
TE data are disturbed by noises in the process of data acquisition and transmission and the obtained original data contain irregular system noise and measurement noise. These noises influence the subsequent analysis and processing directly, so it is necessary to filter out noise signals from original transmission signals and improve the data quality.
The noise reduction effects of wavelet threshold noise reduction, Kalman filtering and the combined wavelet-Kalman filtering algorithm were compared and the quality of noise reduction was evaluated.
Wavelet threshold noise reduction
If the function
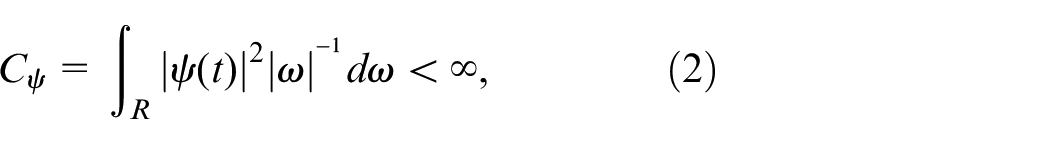
where
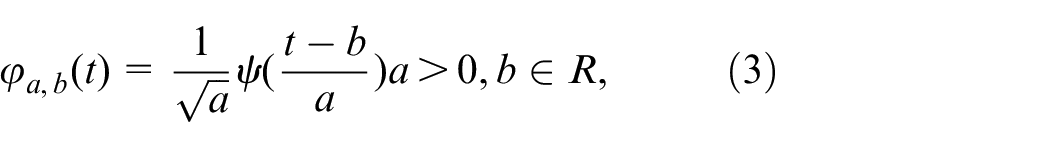
where a is contraction factor and represents the contraction related to frequency; b is time shift factor. For every
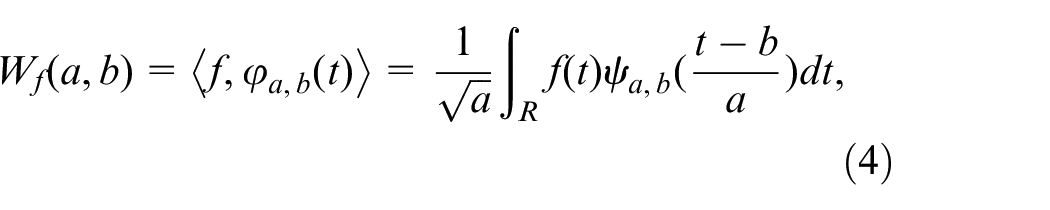
where
Many wavelet noise reduction methods have been proposed. The threshold noise reduction method with less computation is selected to reduce the noise in TE signals. Mallat algorithm is used to deal with the low-frequency components and high-frequency components of signals separately through wavelet decomposition and reconstruction. Through wavelet transformation, TE signals are transformed into high-frequency signals with noise and low-frequency signals with original characteristics. High-frequency components stay in a lower scale and their wavelet coefficients are smaller than those of original signals. After selecting an appropriate threshold function, if wavelet coefficients are less than the threshold, signals are considered as noise signals to be removed. If wavelet coefficients are larger than the threshold, signals are considered as useful signals to be retained. In this way, noise signals are removed finally.
Due to a small quantity of computation and a simple processing method, VisuShink criterion is widely applied in wavelet filtering. When the threshold is set in this paper, the general threshold method of VisuShink criterion is adopted as:

where
The soft threshold function has good continuity, and the whole result is relatively smooth, thus avoiding discontinuity points in the reconstructed signals obtained with the hard threshold function. Therefore, the soft threshold function is selected as:
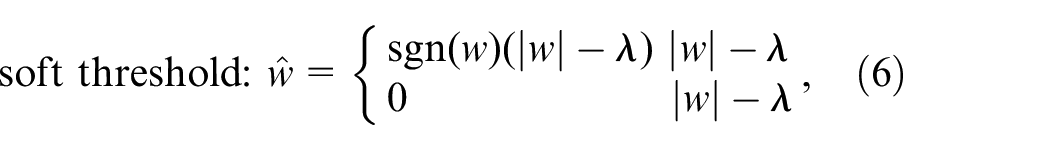
where
Kalman filtering noise reduction
Kalman filtering is a continuous process of prediction and correction. It has a good filtering effect on system noise and measurement noise.32,33 Assume that the state prediction equation of measured TE signals is:

Where
The measured TE signal is not a controlled variable and the Kalman filter state prediction equation is:

The prediction equation of system covariance is:

where

where
According to the state estimation at time k and measurement results at time k, the optimal estimation at time k, the filtered value at time k, can be obtained as:

where

where
Combined wavelet-Kalman filtering noise reduction algorithm
The flow chart of the combined wavelet-Kalman filtering noise reduction algorithm is shown in Figure 8. Firstly, TE signal is calculated by equation (1). The measured original signal of TE is decomposed into high-frequency signal and low-frequency approximation signal. The soft threshold function is used for noise reduction and then the signal is reconstructed through inverse transformation. Then, the reconstructed signal obtained after wavelet noise reduction is input as the observation value under the optimal state estimation of Kalman filter and the optimal state of each input value is estimated so as to obtain the better effect of noise reduction. According to equations (7)–(12), the initial value
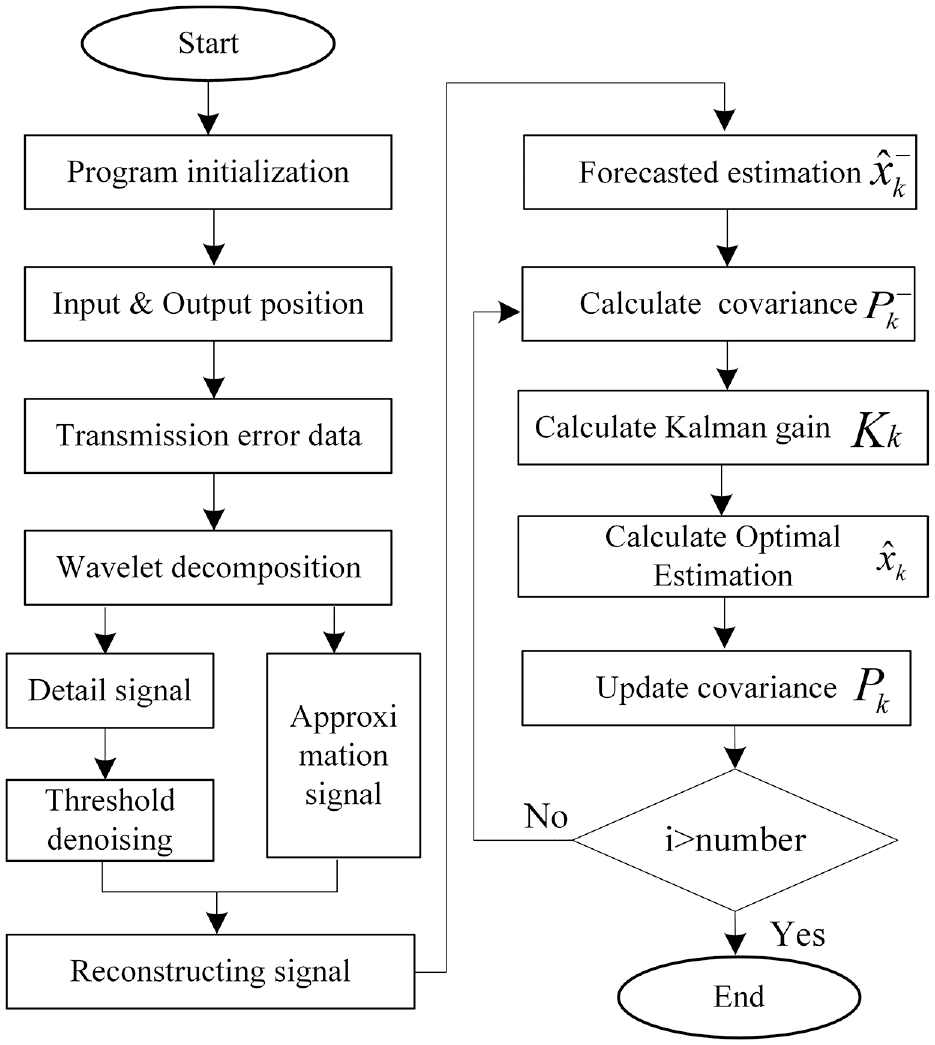
Combined wavelet-Kalman filtering algorithm.
Evaluation of the noise reduction effect of TE signals
Based on Matlab programming, with db2 wavelet and four decomposition layers, the soft threshold function is used to process decomposed high-frequency signals. In this way, noise reduction is realized in the reconstructed data. The selected threshold in the wavelet noise reduction is
The 8 kgf·cm joint steering gear without broken tooth was used to test no-load TE for five times. The measured TE signals were respectively processed with wavelet transform, Kalman filter and the combined wavelet-Kalman filtering algorithm (Figure 9).
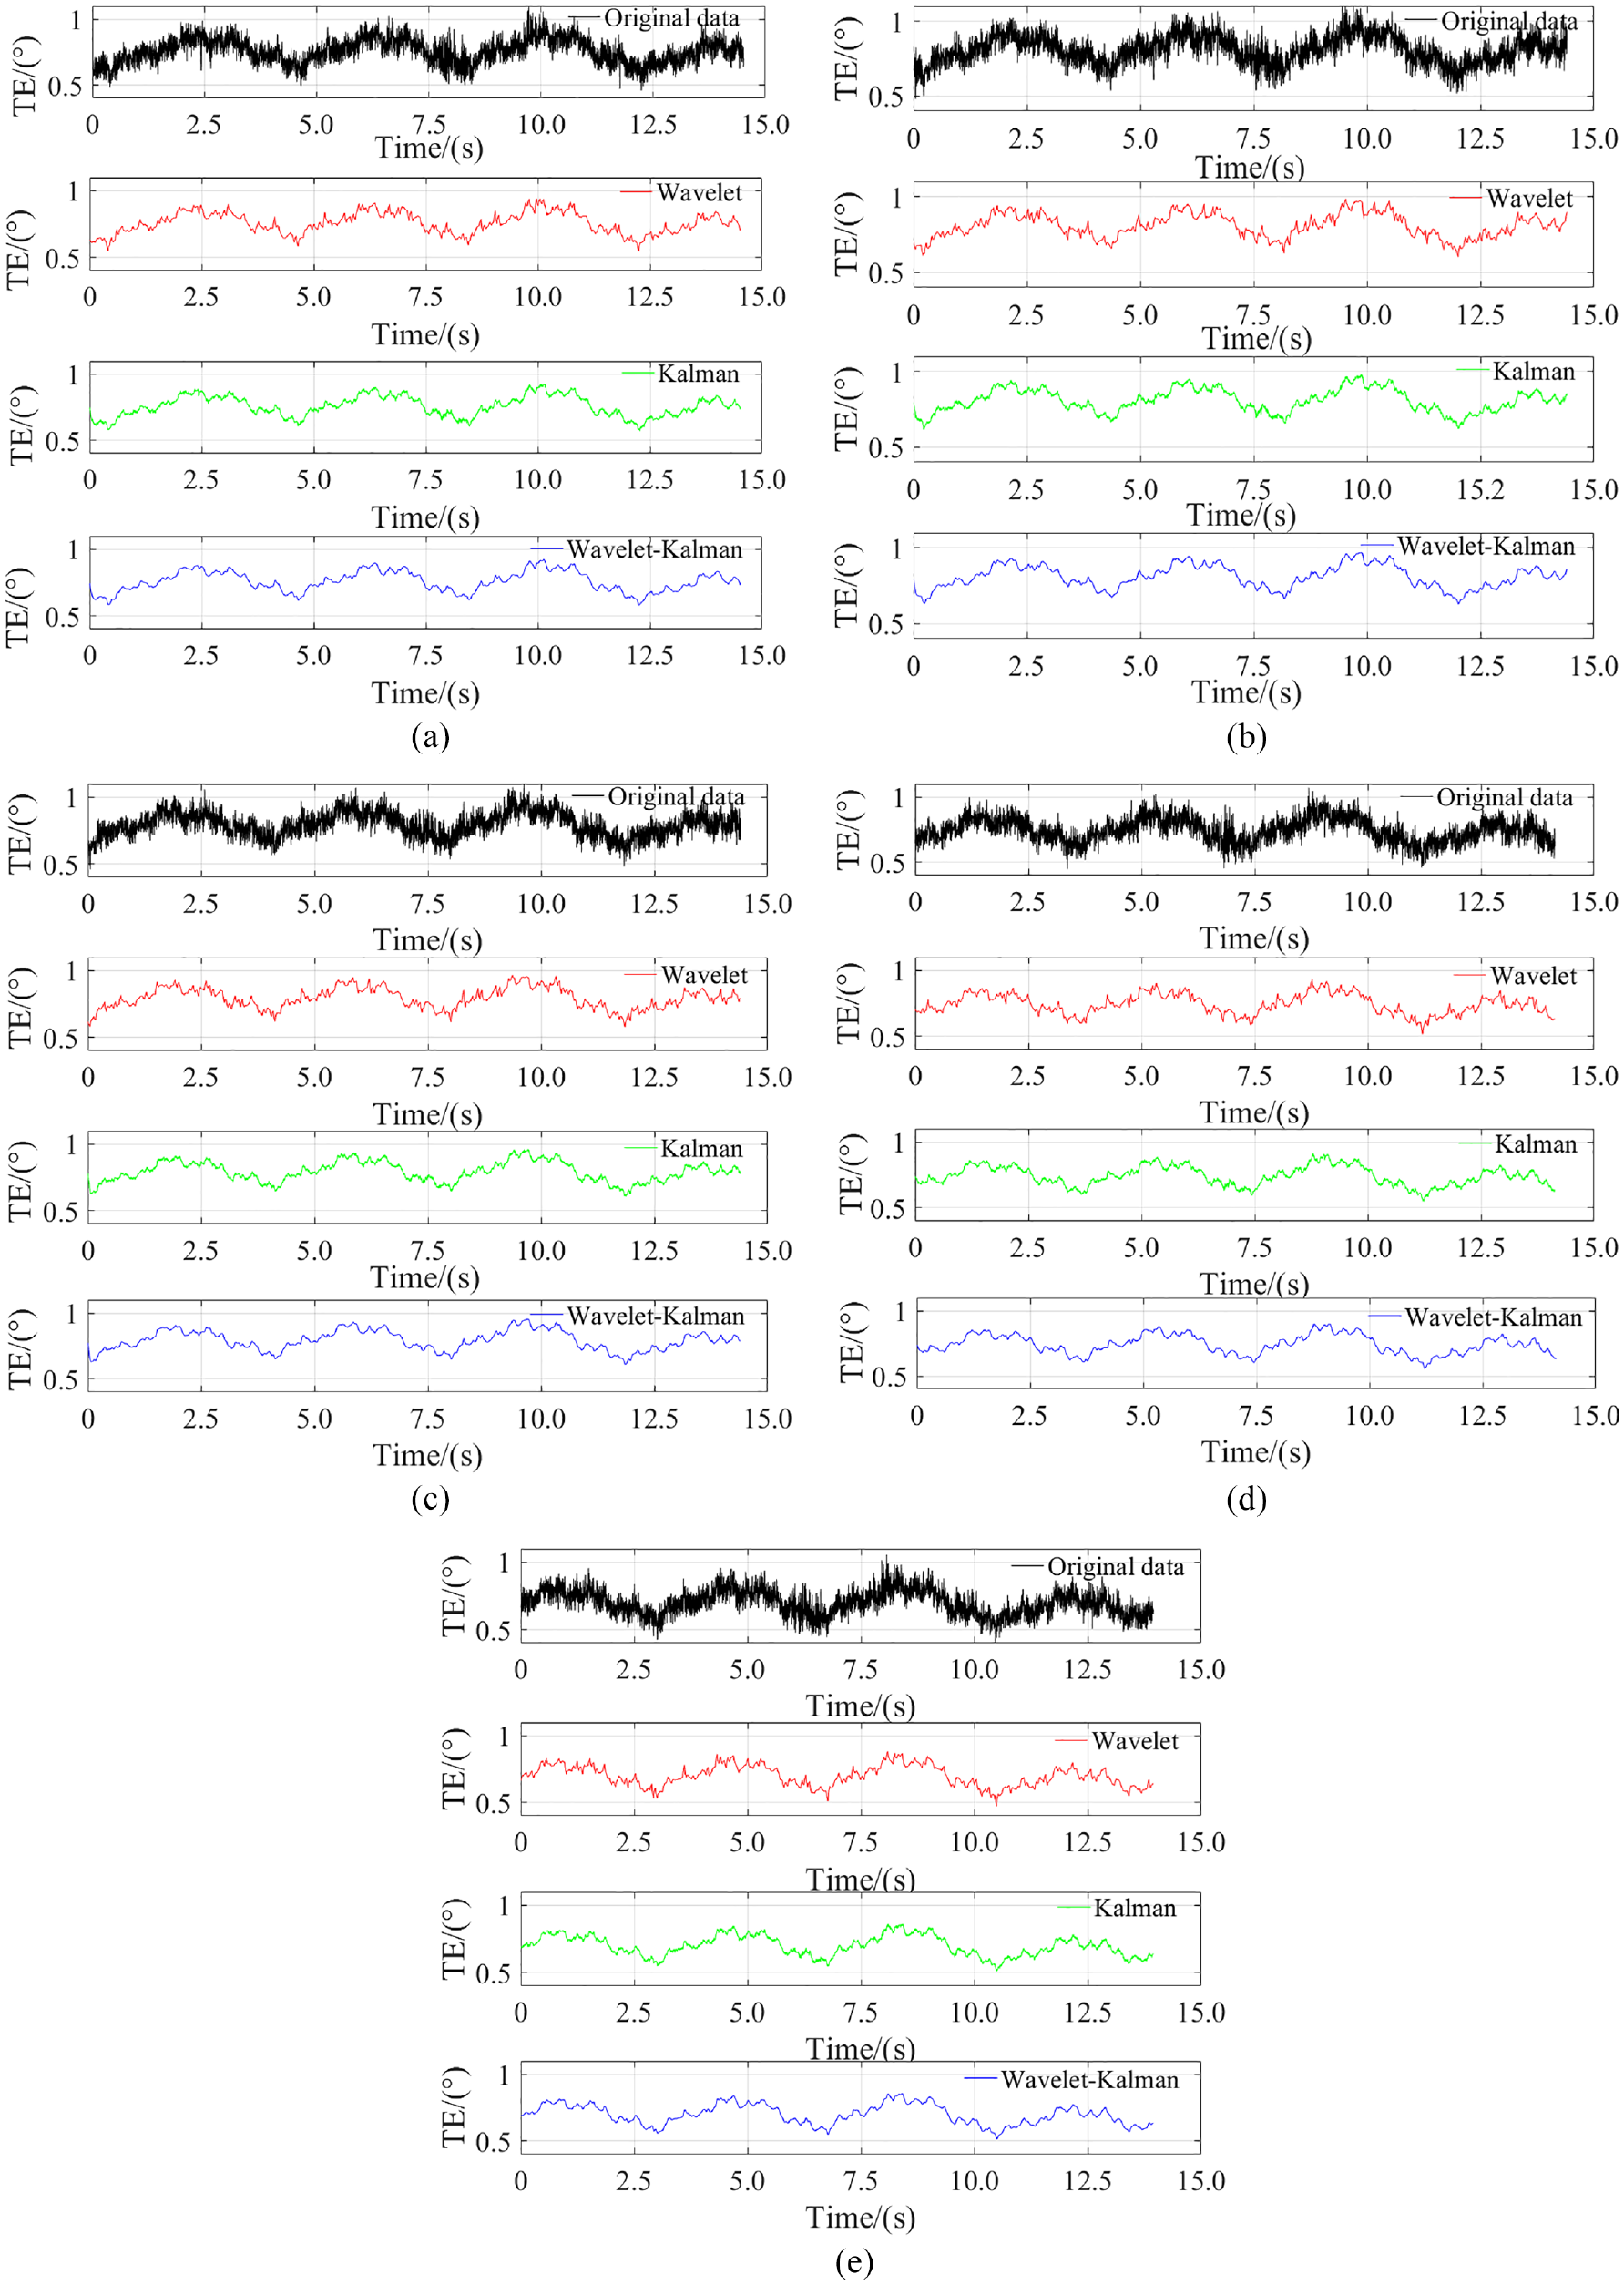
Comparison of TE processed by three algorithms: (a) the first group of data, (b) the second group of data, (c) the third group of data, (d) the fourth group of data, and (e) the fifth group of data.
It can be seen that all the three algorithms can filter noise and restore the characteristics and changes of the original TE signals to a certain degree. It is difficult to determine the advantages and disadvantages of the three methods only through graphics, so reasonable evaluation indexes are required.
The evaluation indexes of the noise reduction effect include signal-noise ratio (SNR), root-mean-square error, smoothness and cross-correlation coefficient.34,35 In order to evaluate the effects of wavelet noise reduction, Kalman filtering and the combined wavelet-Kalman filtering accurately, signal-noise ratio (SNR), and root-mean-square error (RMSE) are used as the main evaluation indexes for comparative analysis.
Signal-noise ratio is the ratio of signal power to noise power in electronic equipment or electronic systems. The signal-noise ratio is calculated as:
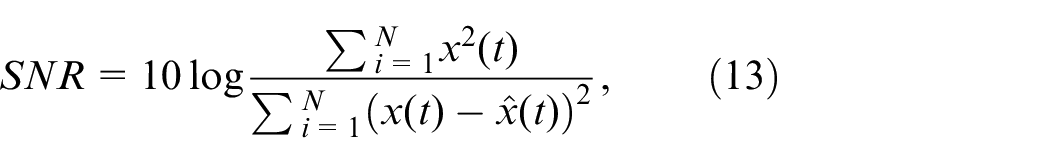
where x(t) is the TE signal containing noise signal;
Root-mean-square error is the square root of the ratio of the sum of squared deviations between observations and true values to observation times N. Root-mean-square error (RMSE) is calculated as:
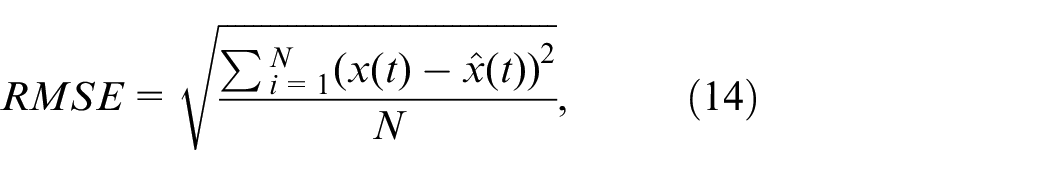
where x(t) is the TE signal containing noise;
Smoothness of processed signals is used as the secondary evaluation index. The smoother the processed signals are, the more obvious the noise reduction effect is. However, if the smoothness of the curve is too high, the processed signals may be seriously distorted. After the TE data are filtered by three different methods, the values of SNR and RMSE are shown in Table 2.
SNR and RMSE of three algorithms.
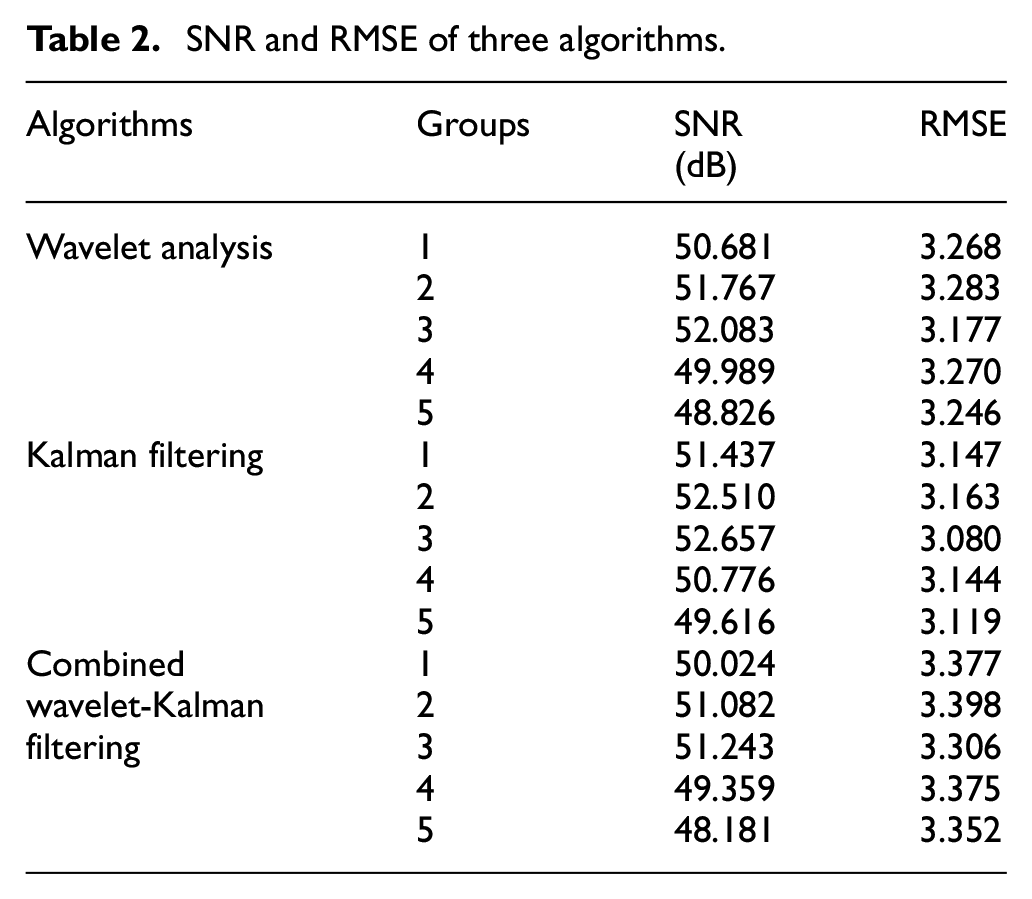
As shown in Table 2, among the three algorithms, the combined wavelet-Kalman filtering algorithm has the smallest SNR value and the largest RMSE value, indicating that the most removed noise and the best noise reduction performance. The difference between maximum and minimum TE is an important index for evaluating gear transmission performance and identifying broken teeth. Without noise reduction, noise signals introduced in the test produce large random blur. If the extrema are incorrectly replaced by blurred data, it leads to the wrong identification result. The combined wavelet-Kalman filtering algorithm can eliminate the influence of random noise, make the optimal estimation, and retain the essential characteristics of measurement data.
Identification method of the joint steering gear with a broken tooth
In order to determine whether the joint steering gear of a service robot has a broken tooth and identify the position of a broken tooth accurately, it is necessary to disassemble the joint steering gear for inspection. The inspection efficiency is extremely low, thus resulting in a lot of waste of human resources. It is necessary to identify whether the joint steering gear has a broken tooth, locate the broken tooth accurately, and replace it though a fast and accurate method.
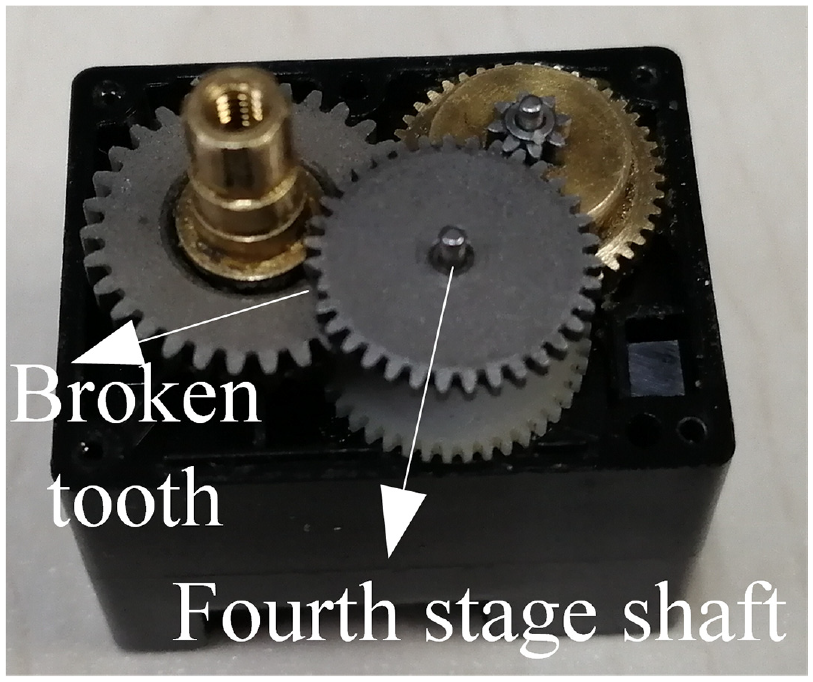
Figure 10 shows the internal structure of 8 kgf·cm joint steering gearbox. Figure 11 shows the physical picture of the fourth stage shaft with a broken tooth.
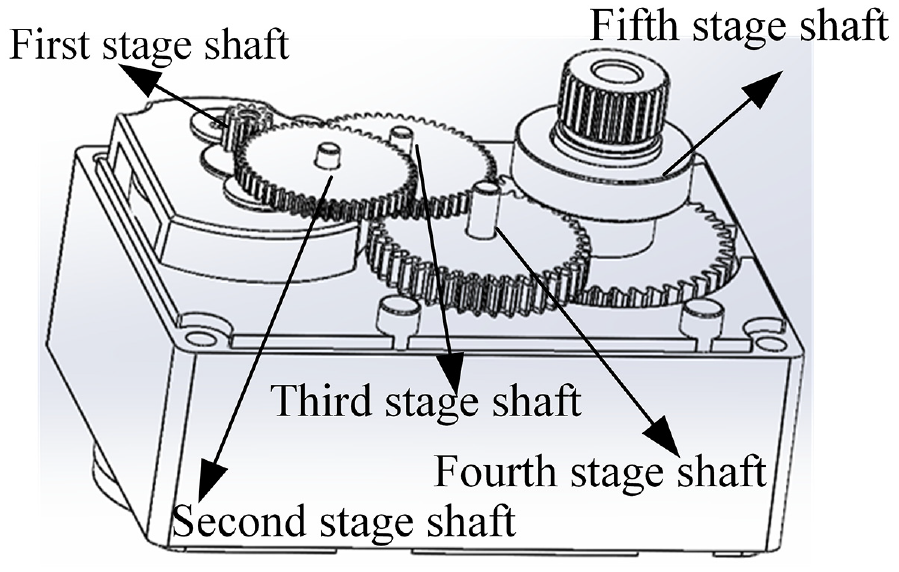
Internal structure of a joint steering gearbox.
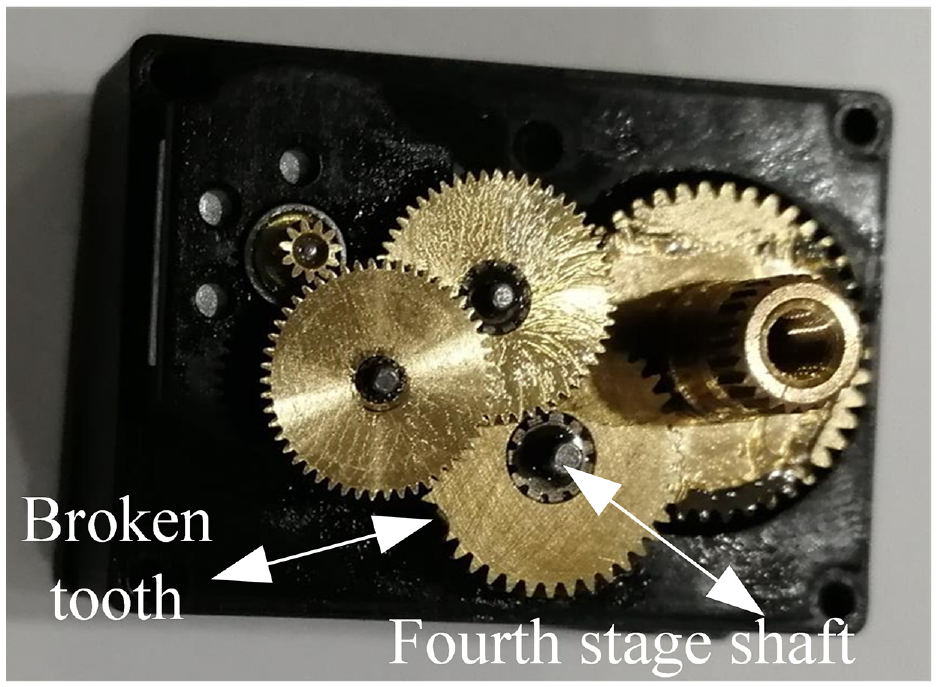
Physical picture of a broken tooth.
Figure 12 shows the five groups of original TE data of the joint steering gear with a broken tooth under no-load conditions and the processed results by the combined wavelet-Kalman filtering algorithm.
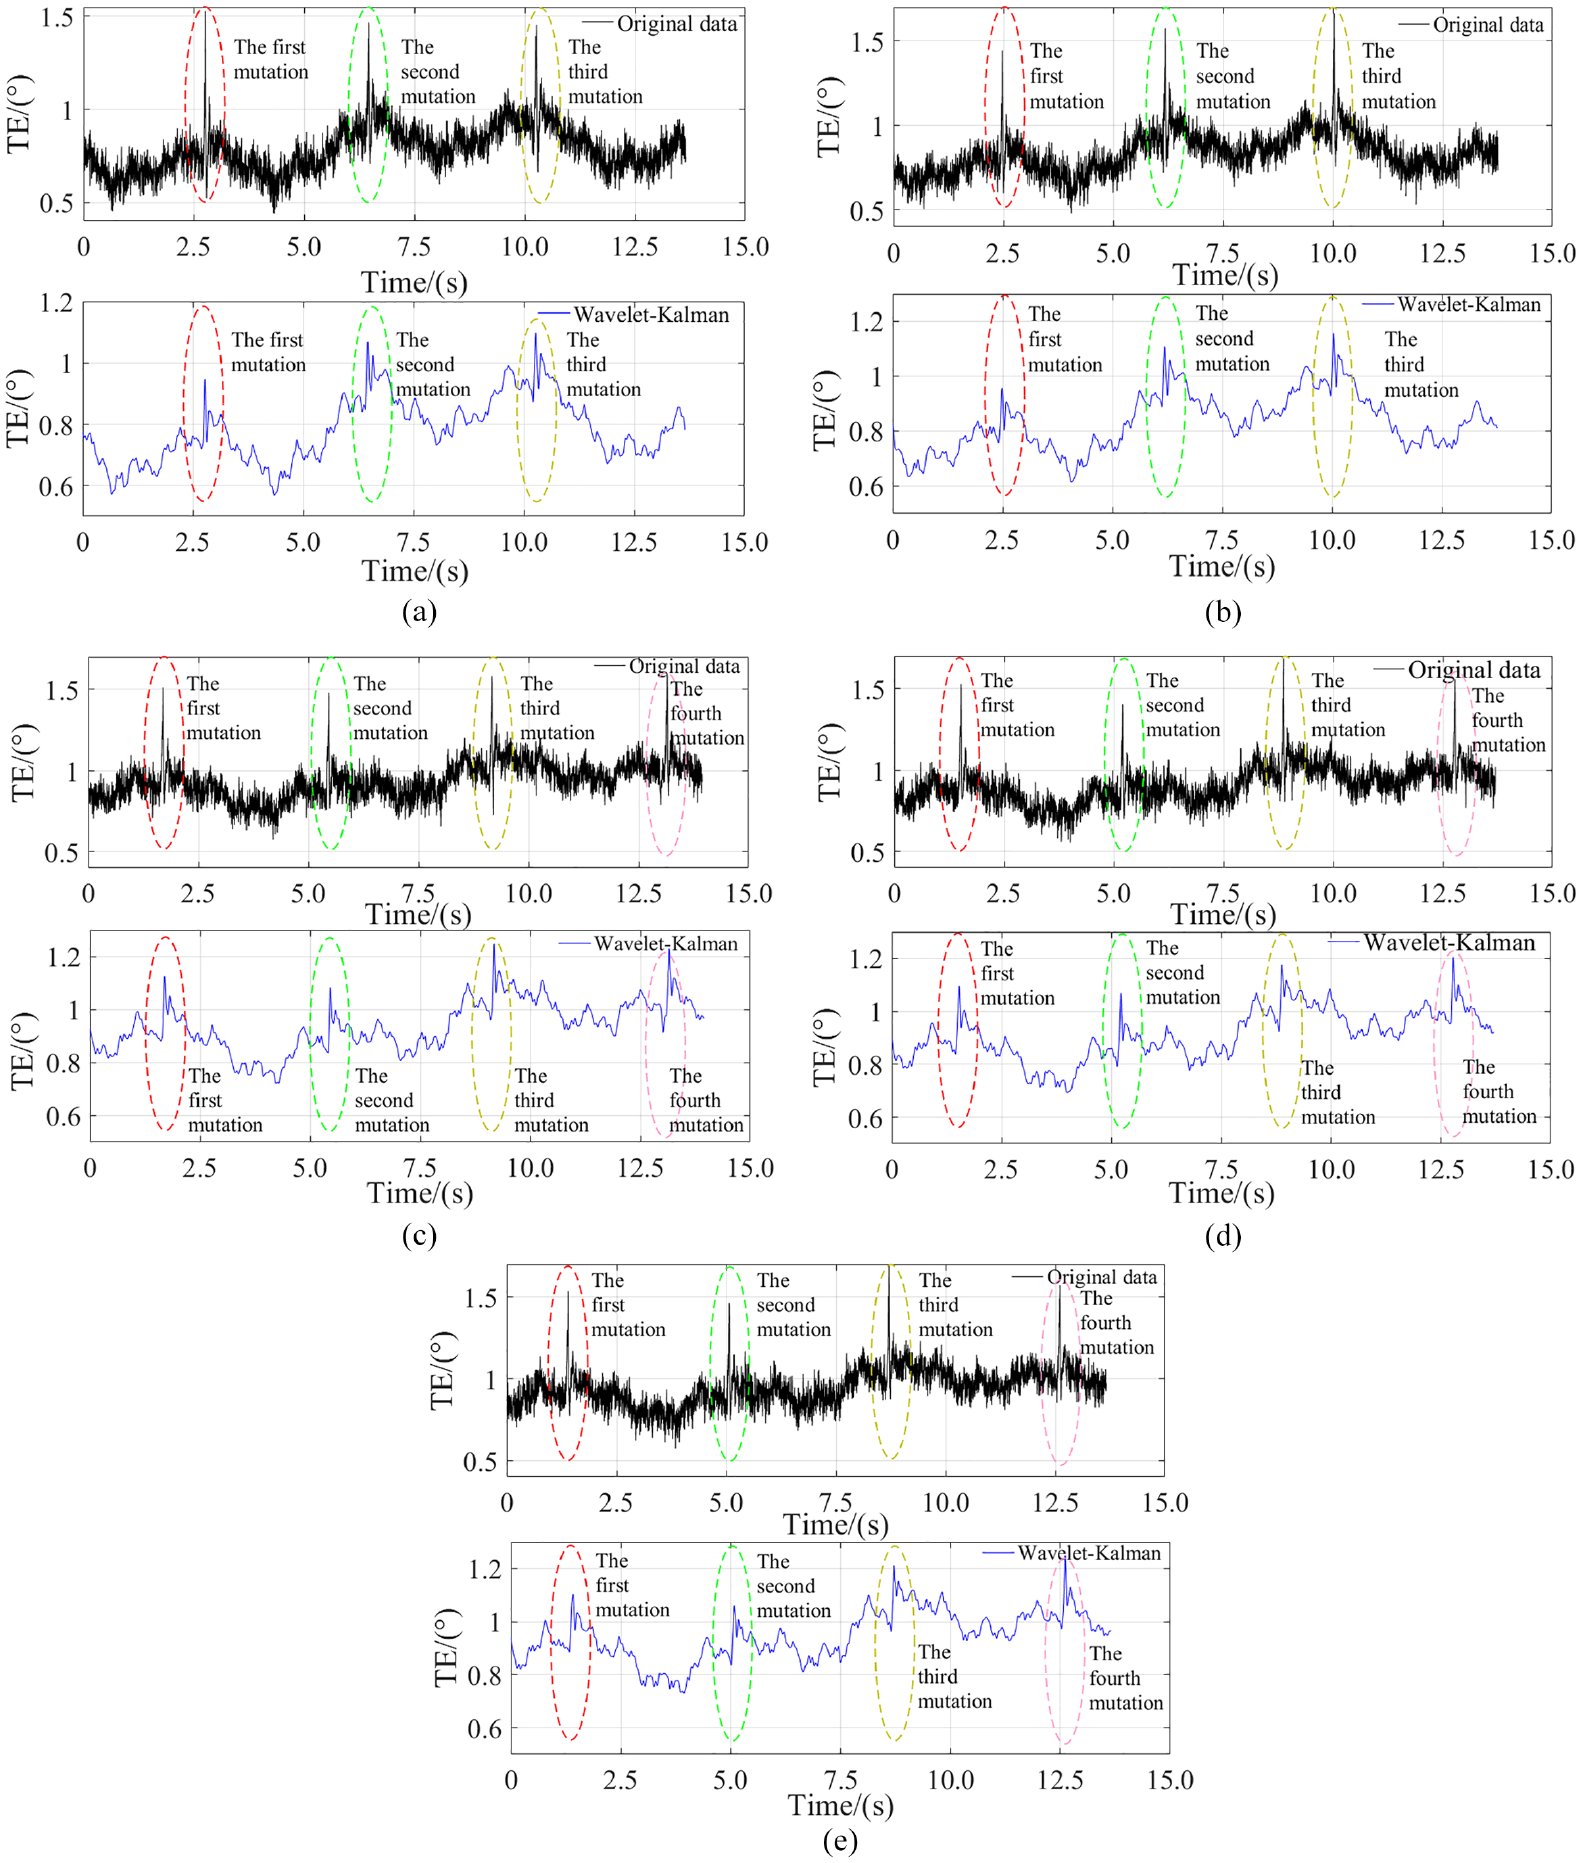
TE data of the joint steering gear with a broken tooth under no-load conditions: (a) the first group of data, (b) the second group of data, (c) the third group of data, (d) the fourth group of data, and (e) the fifth group of data.
As shown in Figure 12, the TE waveform of the joint steering gear with a broken tooth is obviously different from that of the normal joint steering gear.
Obvious mutation waveforms were observed in the TE waveform of the joint steering gear with a broken tooth. Mutation waveform occurred 3–4 times in the test cycle. Figure 12(a) and (b) show three mutation waveforms, and Figure 12(c) to (e) show four mutation waveforms. The difference between maximum and minimum TE in filtered data was about 0.52°.
The difference between the maximum and minimum TE of the joint steering gear with a broken tooth is obviously greater than that of the normal joint steering gear.
Based on the TE data of the normal joint steering gear (8 kgf·cm, Figure 9) and the gear with a broken tooth (Figure 12), the preliminary conclusions can be drawn as follows:
Under no-load conditions, the difference between maximum and minimum TE of the joint steering gear with a broken tooth was greater than that of the normal joint steering gear, and the difference was basic stable. The broken tooth could be identified based on the difference between maximum and minimum TE.
Under no-load conditions, the TE curve of the joint steering gear with a broken tooth showed the stepped mutation waveform, displaying periodicity. The mutation waveform might be interpreted as follows. The TE changed greatly when the broken tooth was engaged in the transmission process. Therefore, the broken tooth could be identified according to the characteristics of the stepped mutation waveform of TE and the position of the broken gear shaft could be determined by the periodicity.
After original signals were filtered, the waveform presented the obvious periodicity. The broken tooth could be located in the frequency domain by identifying the meshing frequency and the curve characteristics near the high-order harmonic components.
Identification of a broken tooth based on the difference between maximum and minimum TE
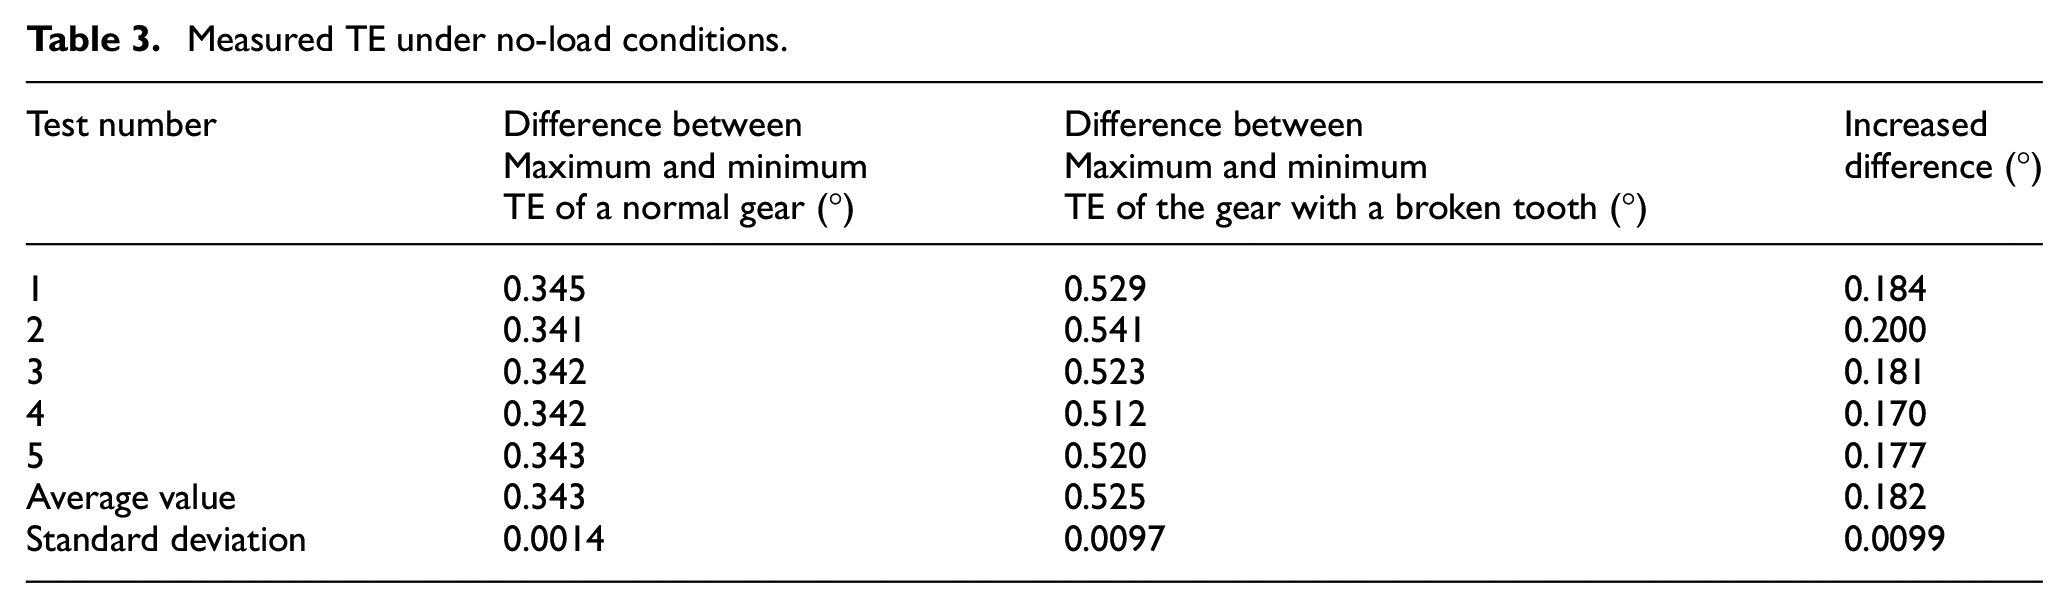
Table 3 shows the measured TE of 8 kgf·cm joint steering gear with/without a broken tooth under no-load conditions. Table 4 shows the measured TE of 8 kgf·cm joint steering gear with/without a broken tooth under various conditions (0.2, 0.4, 0.6, 0.8, and 1.0 kgf·cm).
Measured TE under no-load conditions.
Measured TE under various conditions.
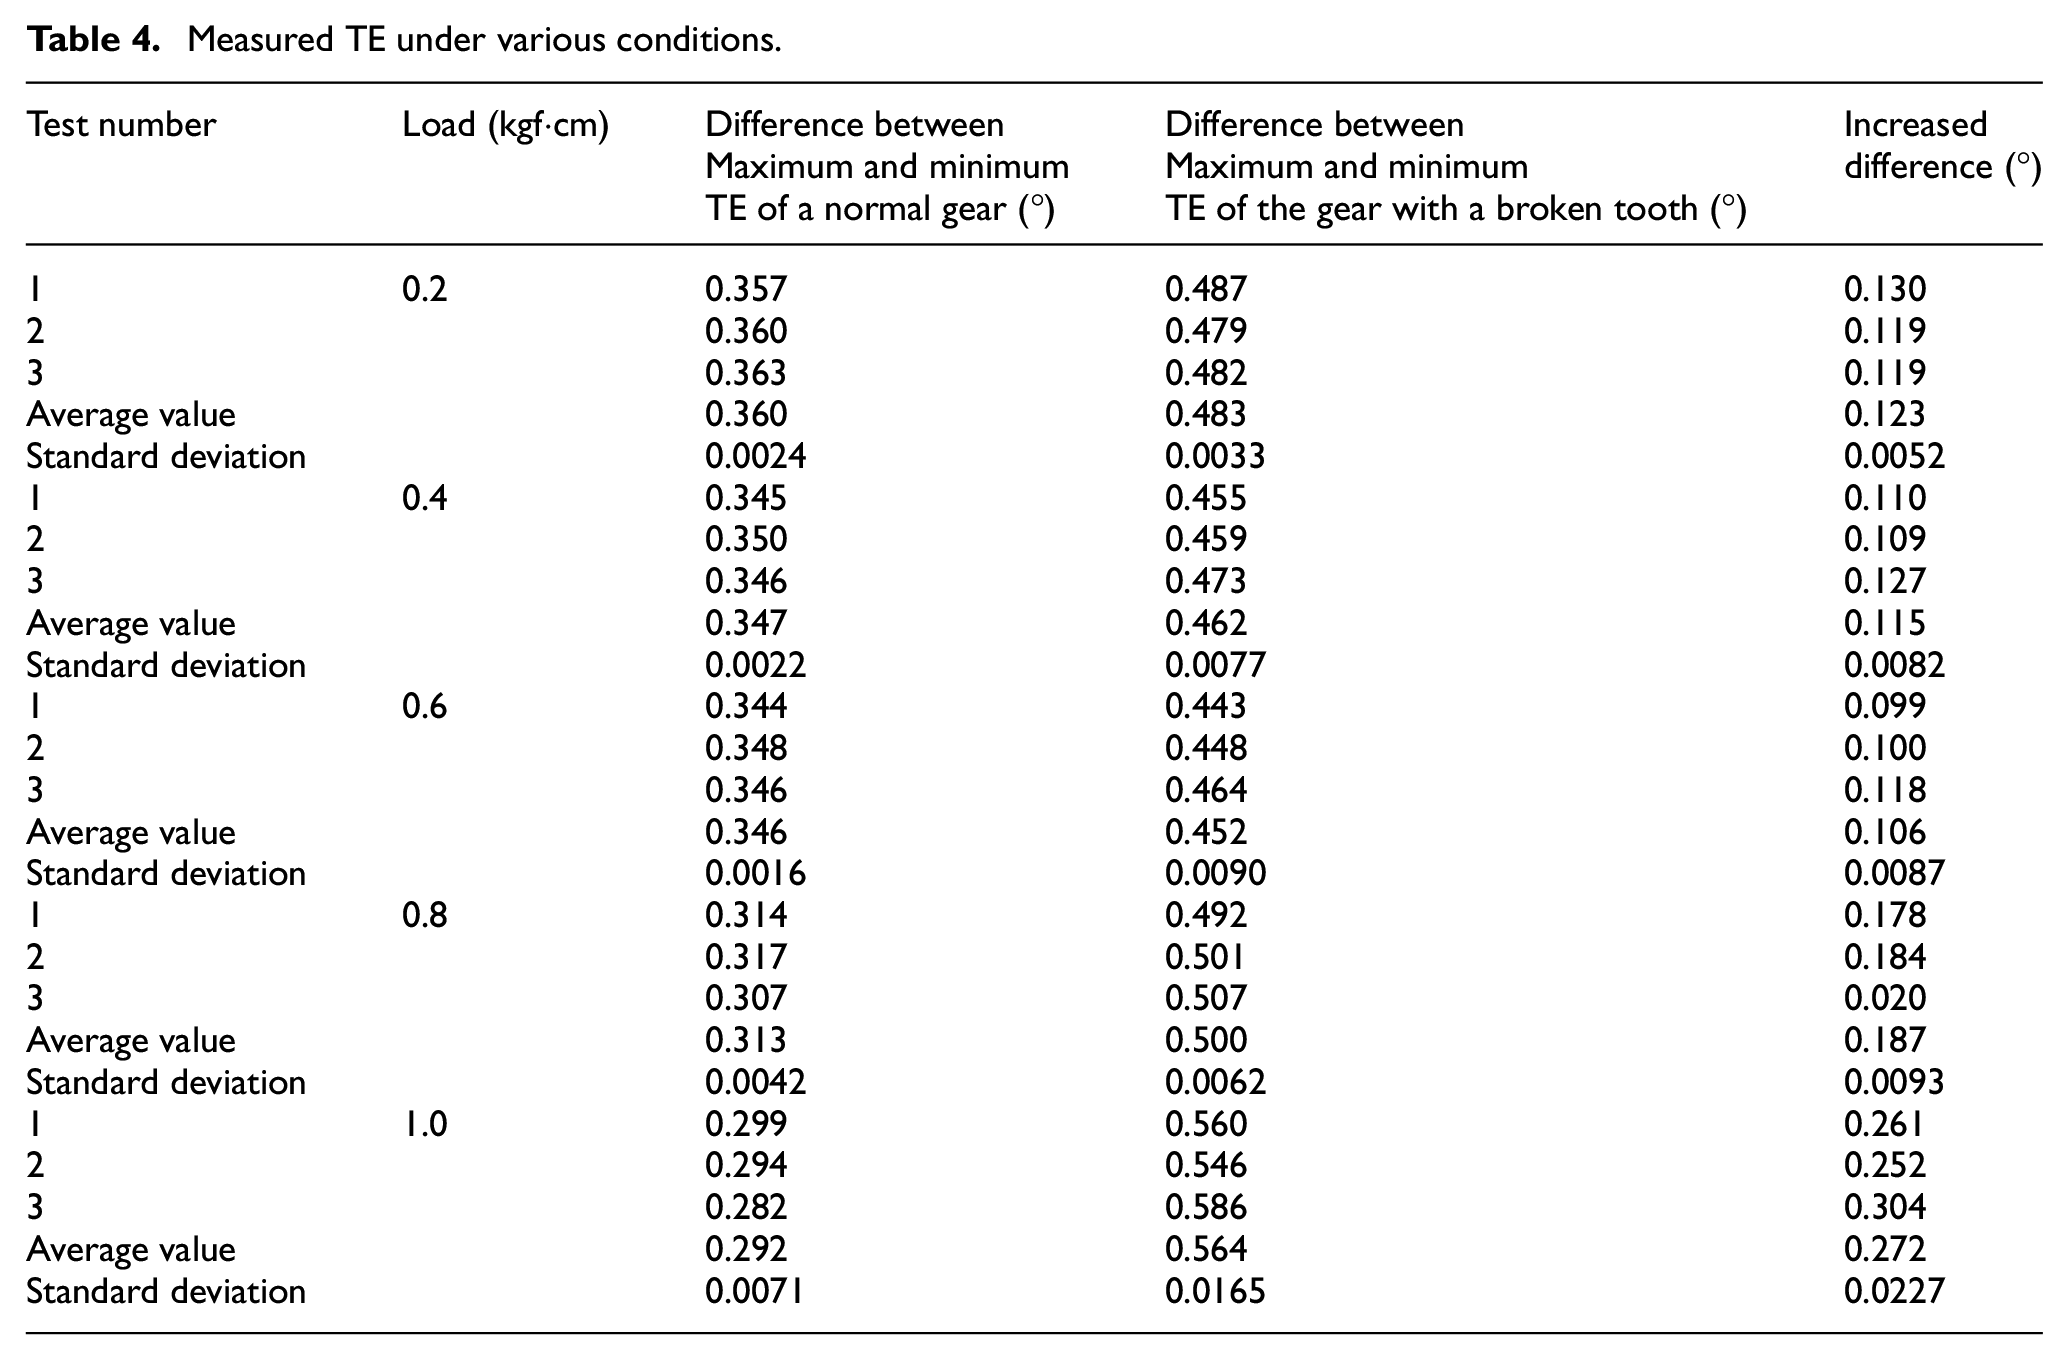
It can be seen from Tables 3 and 4 that the differences between maximum and minimum TE of the normal joint steering gear and the joint steering gear with a broken tooth under no-load conditions were significantly different from those under loaded conditions. The average difference between maximum and minimum TE of the normal joint steering gear under no-load conditions was about 0.343°. The average difference of the joint steering gear with a broken tooth was about 0.525°. The increased difference was about 0.182°. Under the conditions of 0.2–1.0 kgf·cm, the difference between maximum and minimum TE of the normal joint steering gear ranged from 0.282° to 0.363°, but that of the joint steering gear with a broken tooth ranged from 0.443° to 0.586°.
Therefore, under the no-load or loaded conditions, the joint steering gear with a broken tooth can be quickly identified based on the statistical threshold range of the difference between maximum and minimum TE of the normal joint steering gear. This method improves the inspection efficiency greatly since it does not require manual disassembly inspection. However, it does not realize the accurate location of a broken tooth.
Locating the broken-tooth stage shaft based on TE mutation waveform
The gear ratio of the gearbox was about 383.8. The duty cycle of the motor was set as 10% and the measured output speed was about 4.4 r/min. Table 5 shows the number of gear teeth in the gearbox of joint steering gear.
Parameters of the gearbox of 8 kgf·cm joint steering gear.
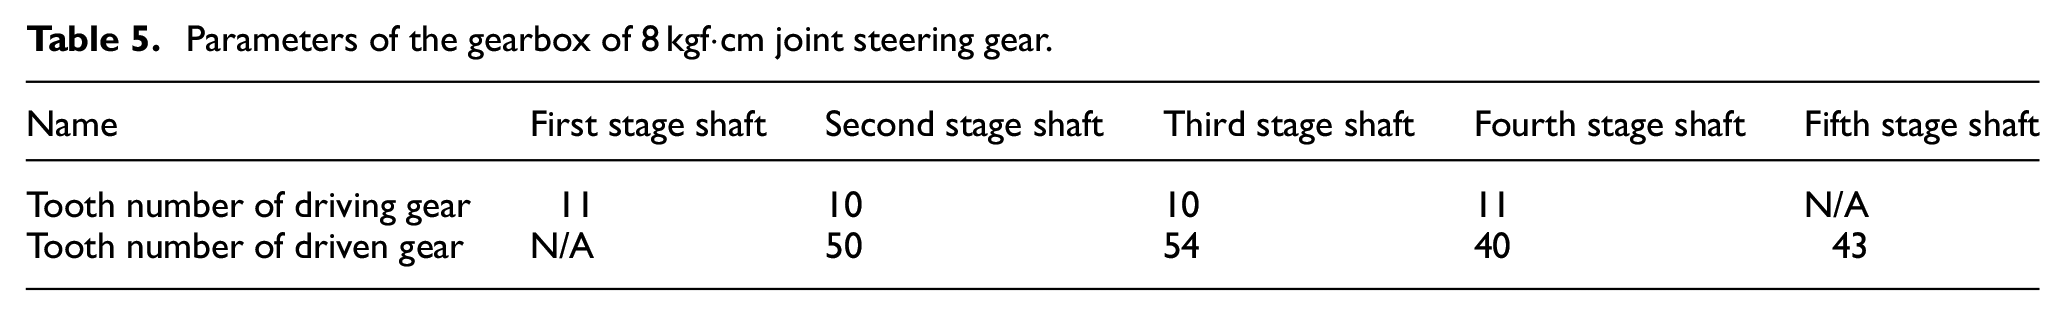
Because of the existence of a broken tooth in the joint steering gear, the mutation frequency of TE waveform was equal to the rotation frequency of the broken-tooth stage shaft. Depending on the initial position of data acquisition (Figure 12), the number of TE mutations within 13.5 s was 3 or 4 and the calculated waveform mutation frequency was 0.22–0.29 Hz. According to the data in Table 6, it could be confirmed that the broken tooth occurred on the fourth gear shaft. The result was consistent with the actual position of the broken tooth. The broken-tooth shaft was located accurately based on the mutation frequency of TE waveform.
Rotational frequency of each gear shaft of the joint steering gear.
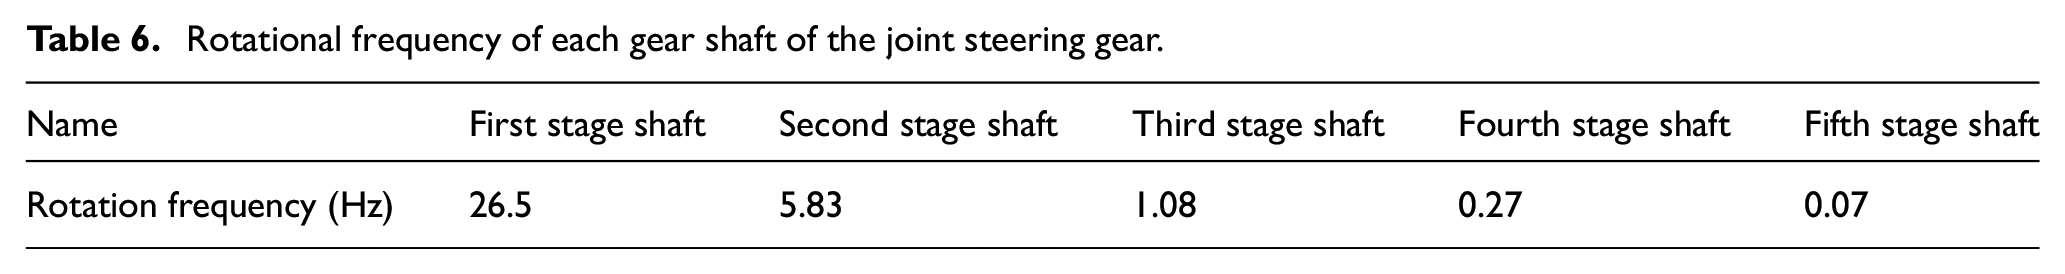
Table 6 shows the rotational frequency of each gear shaft of the joint steering gear after calculation.
Locating the broken-tooth gear based on frequency domain characteristics of TE
Figure 13 shows the spectrum of normal TE of the same type of steering gear. Figure 14 shows the spectrum of the TE of the joint steering gear with a broken tooth in Figure 11. The calculated meshing frequency of gears at all stages and the frequency domain characteristics in Figures 13 and 14 are compared in Table 7.
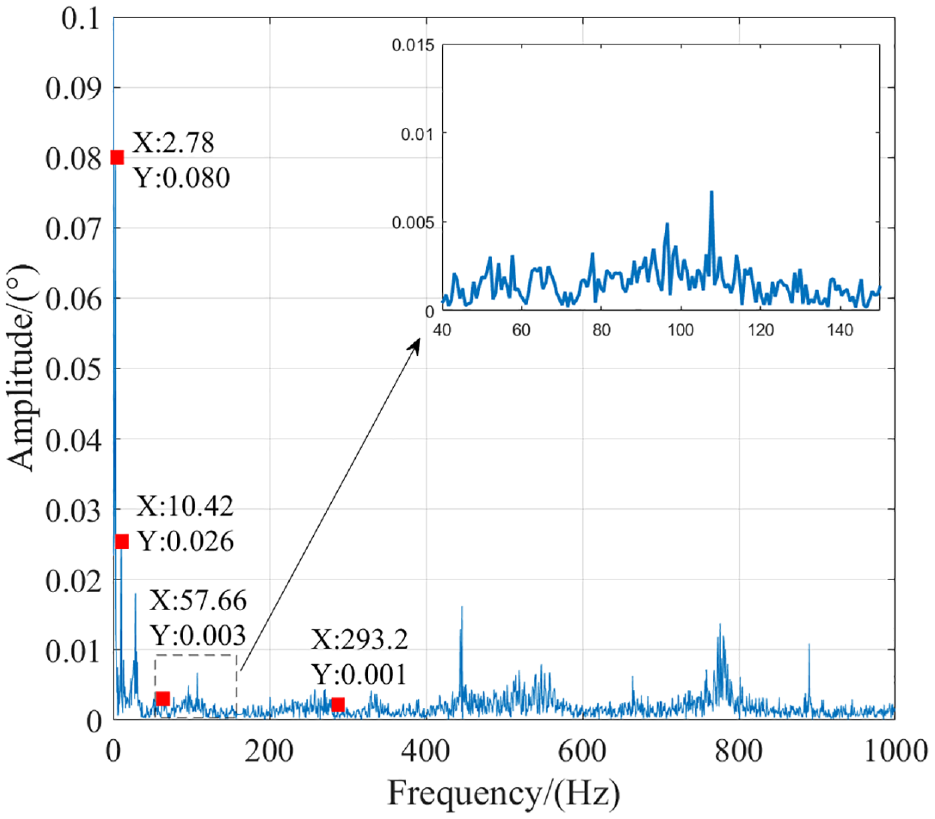
TE spectrum of the normal joint steering gear.
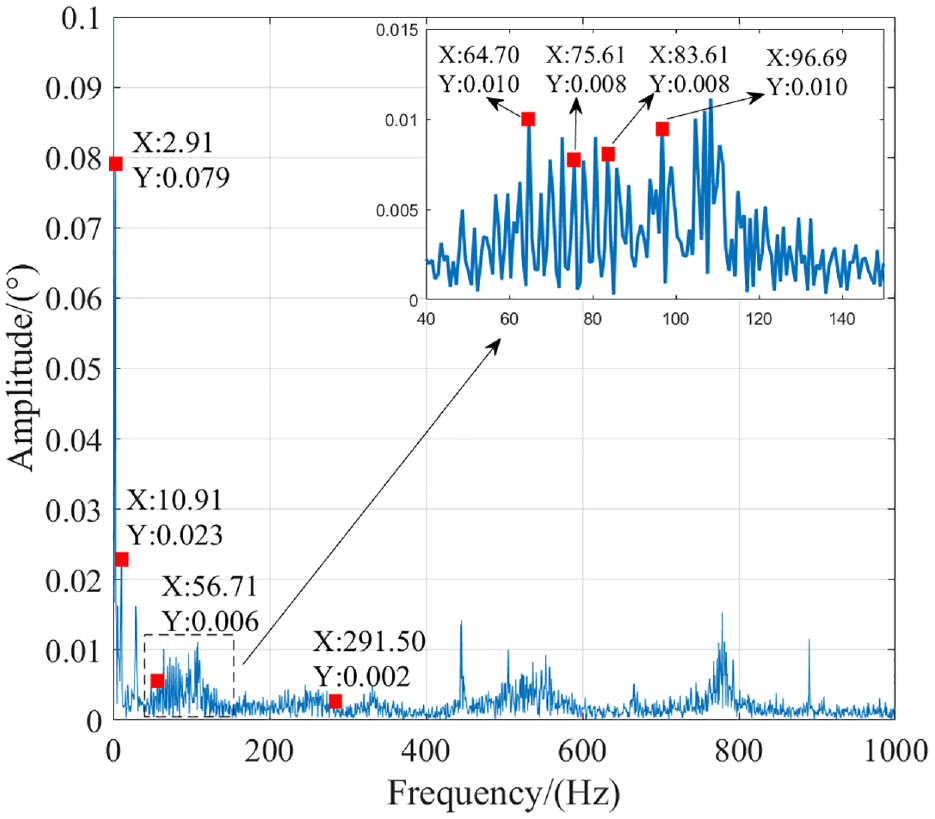
TE spectrum of the joint steering gear with a broken tooth.
Meshing frequencies of 8 kgf·cm joint steering gear.
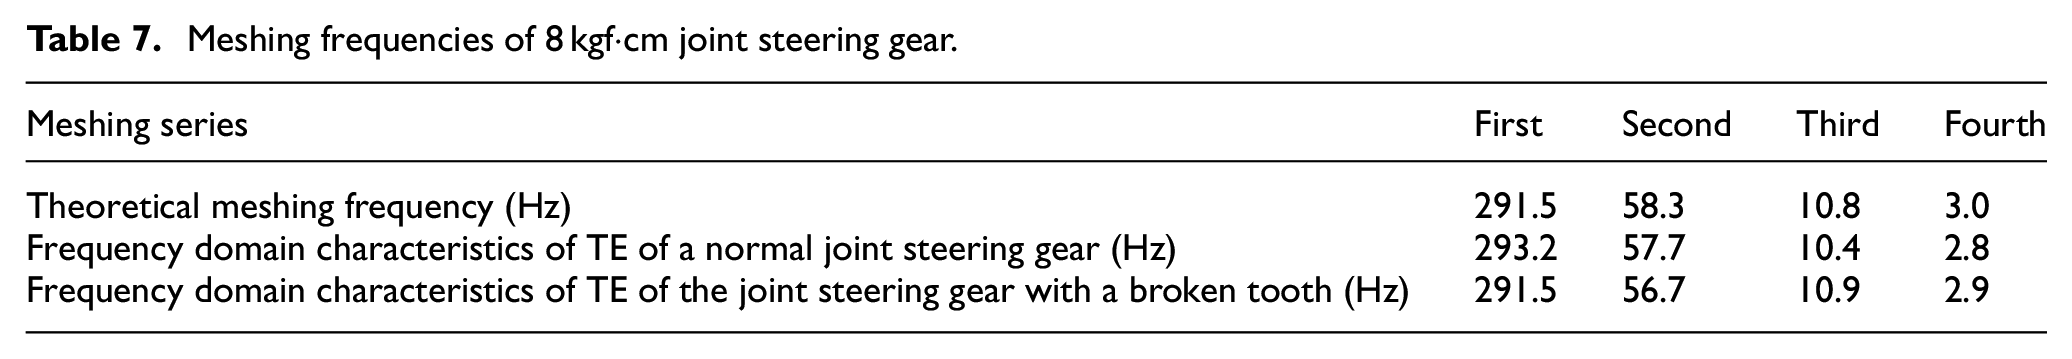
The theoretical meshing frequency of gears at all stages was consistent with the frequency of TE signals obtained after Fourier transform (Table 7), indicating that the results of data acquisition and data processing were accurate. In the range of 40–140 Hz, the amplitudes of multiple meshing frequencies of the broken-tooth joint steering gear were much larger than those of the normal joint steering gear (Figures 13 and 14). Especially, the amplitudes of multiple meshing frequencies of the third gear (64.70, 75.61, 83.61, and 96.69 Hz) were higher than those of the normal joint steering gear and a large number of wide sidebands with large amplitudes occurred near the multiple meshing frequencies of the third gear. Therefore, based on the stage shaft located by the mutation waveform, the gear with a broken tooth could be accurately identified as the driven gear on the fourth stage shaft.
The method is summarized as follows. Firstly, the existence of a broken tooth is identified by the difference between maximum and minimum TE signals of the joint steering gear. Then, the stage shaft with a broken tooth is located based on the mutation frequency of the TE waveform. Finally, the TE signals are transformed into the frequency spectrum. The amplitudes of meshing frequency, multiple meshing frequencies, and the sideband morphology are used as the basis of determination to realize the accurate location of the broken-tooth gear without disassembling the gearbox. In order to test the generality of the detection method, the identification experiments of broken tooth were conducted with different types of joint steering gears.
The work flow chart of broken-tooth identification is shown in Figure 15. After the measured TE data are processed by the joint filtering algorithm, the difference between maximum and minimum values is calculated. If the difference is less than the set threshold, it is believed that there is no broken tooth. If the difference is greater than the set threshold, it is believed that there is a broken tooth. The TE waveform of the joint steering gear with a broken tooth contains mutation waveform. The corresponding frequency of mutation waveform was the rotation frequency of the stage shaft with a broken tooth. In this way, the shaft with a broken tooth could be accurately located by calculating the frequency of mutation waveform. Then the position of the broken tooth of the joint steering gear could be accurately identified based on the frequency domain of TE data of the joint steering gear.
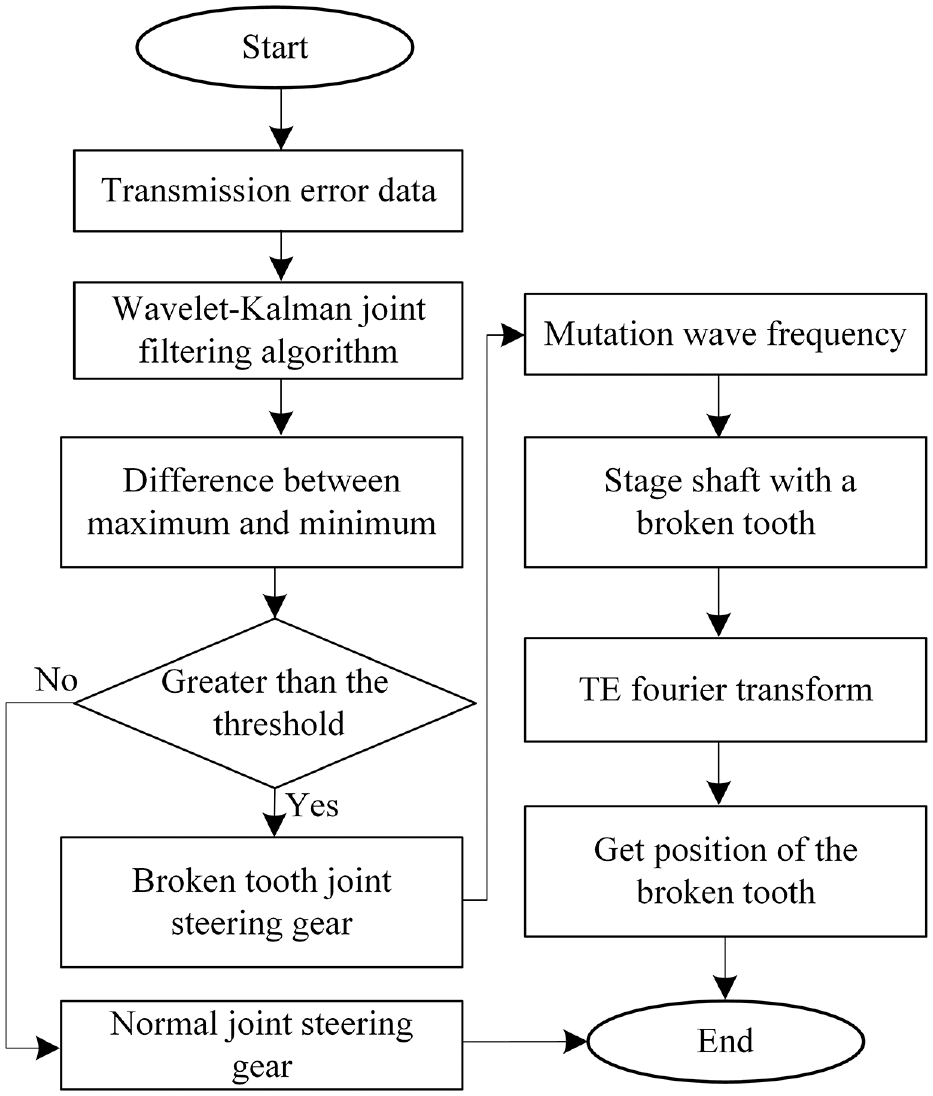
Flow chart of broken-tooth identification.
Measurement time of TE was about 14 s. The running time of the identification program on the platform (Intel (R) core (TM) i7–8750h CPU @ 2.20 GHz) was 0.915 s and the identification time of a broken gear of joint steering gear was about 15 s, indicating that the broken-gear identification program was efficient.
Experimental results and discussion
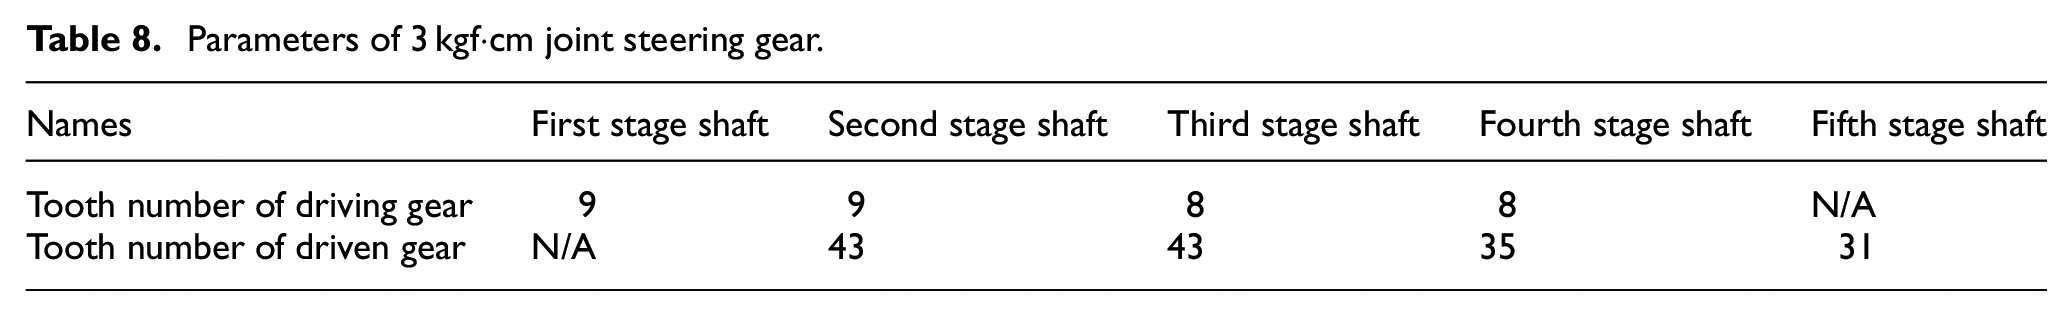
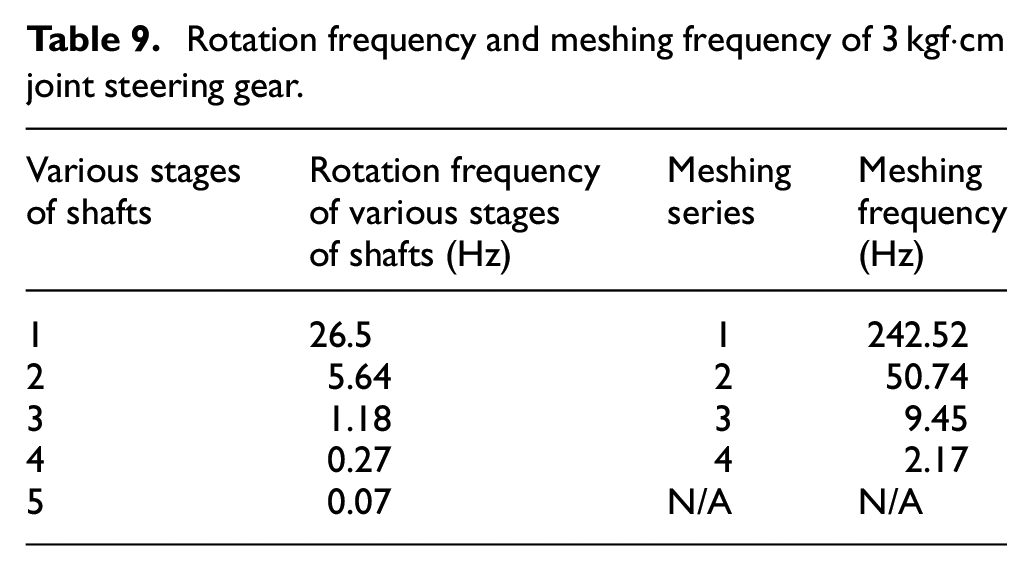
The threshold of broken tooth was determined based on a large number of experimental data and the position of the broken tooth of 3 kgf·cm joint steering gear was identified on a self-developed experimental platform according to this above method. Table 8 shows the parameters of 3 kgf·cm joint steering gear. Table 9 shows rotation frequencies of various stage shafts and gear meshing frequencies of 3 kgf·cm joint steering gearbox.
Parameters of 3 kgf·cm joint steering gear.
Rotation frequency and meshing frequency of 3 kgf·cm joint steering gear.
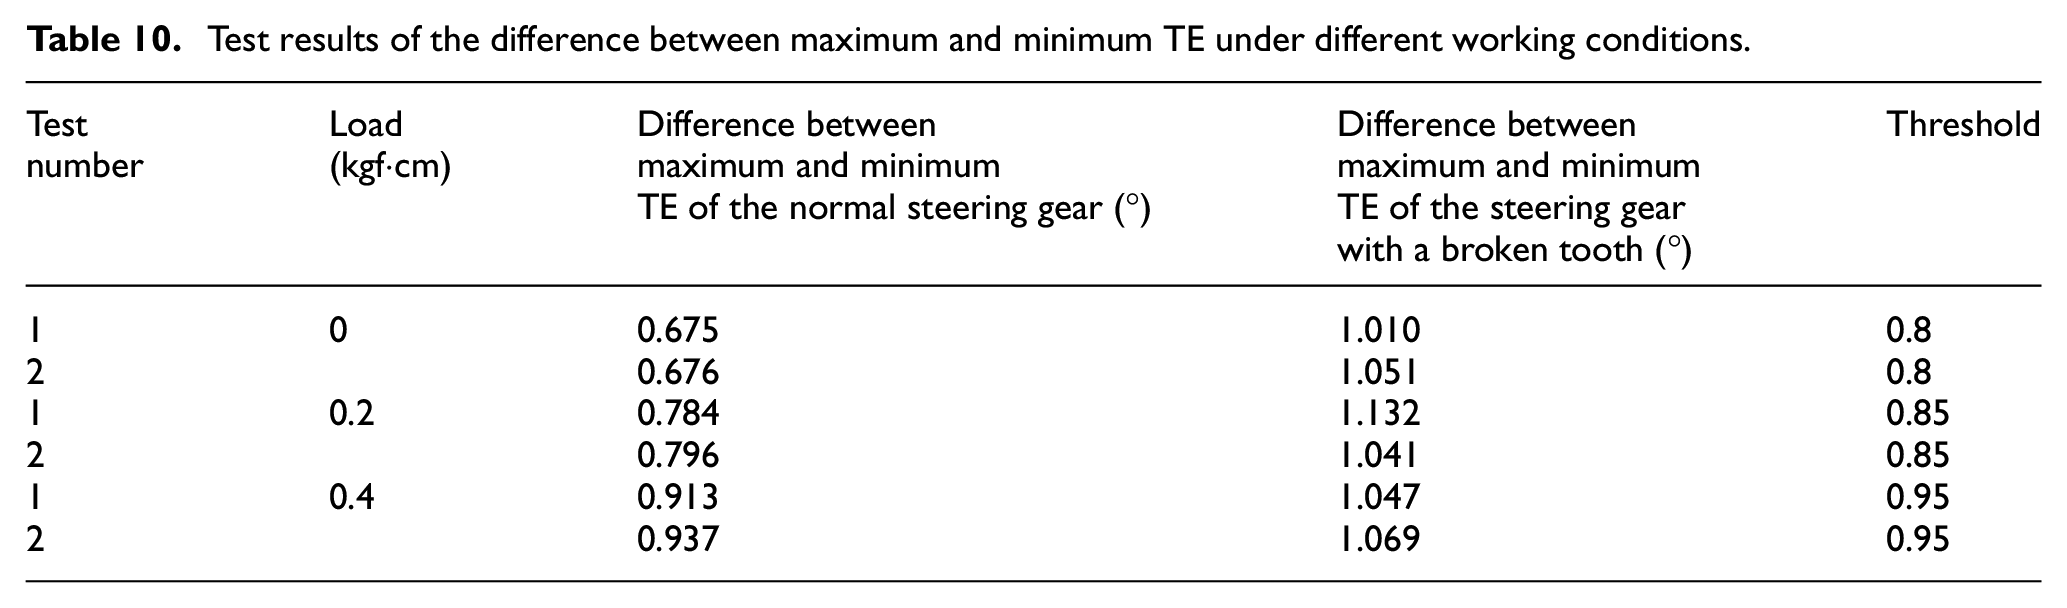
According to the statistics data, the identification threshold under no-load conditions of the difference between maximum and minimum TE of 3 kgf·cm joint steering gear is 0.800° (Figure 16(a), Table 10). If the obtained difference is more than the threshold, then it can be determined that the broken tooth of joint steering gear exists. Figure 16 shows the test results of TE of 3 kgf·cm joint steering gear with/without a broken tooth under no-load conditions. Figure 16(a) shows the TE of the normal steering gear. The difference between maximum and minimum TE was 0.668°, which was less than 0.800°. Figure 16(b) shows TE of the steering gear with a broken tooth. The difference between maximum and minimum TE was 0.978°, which was more than 0.800°. Figure 17 shows the TE spectra of the steering gear with/without a broken tooth.
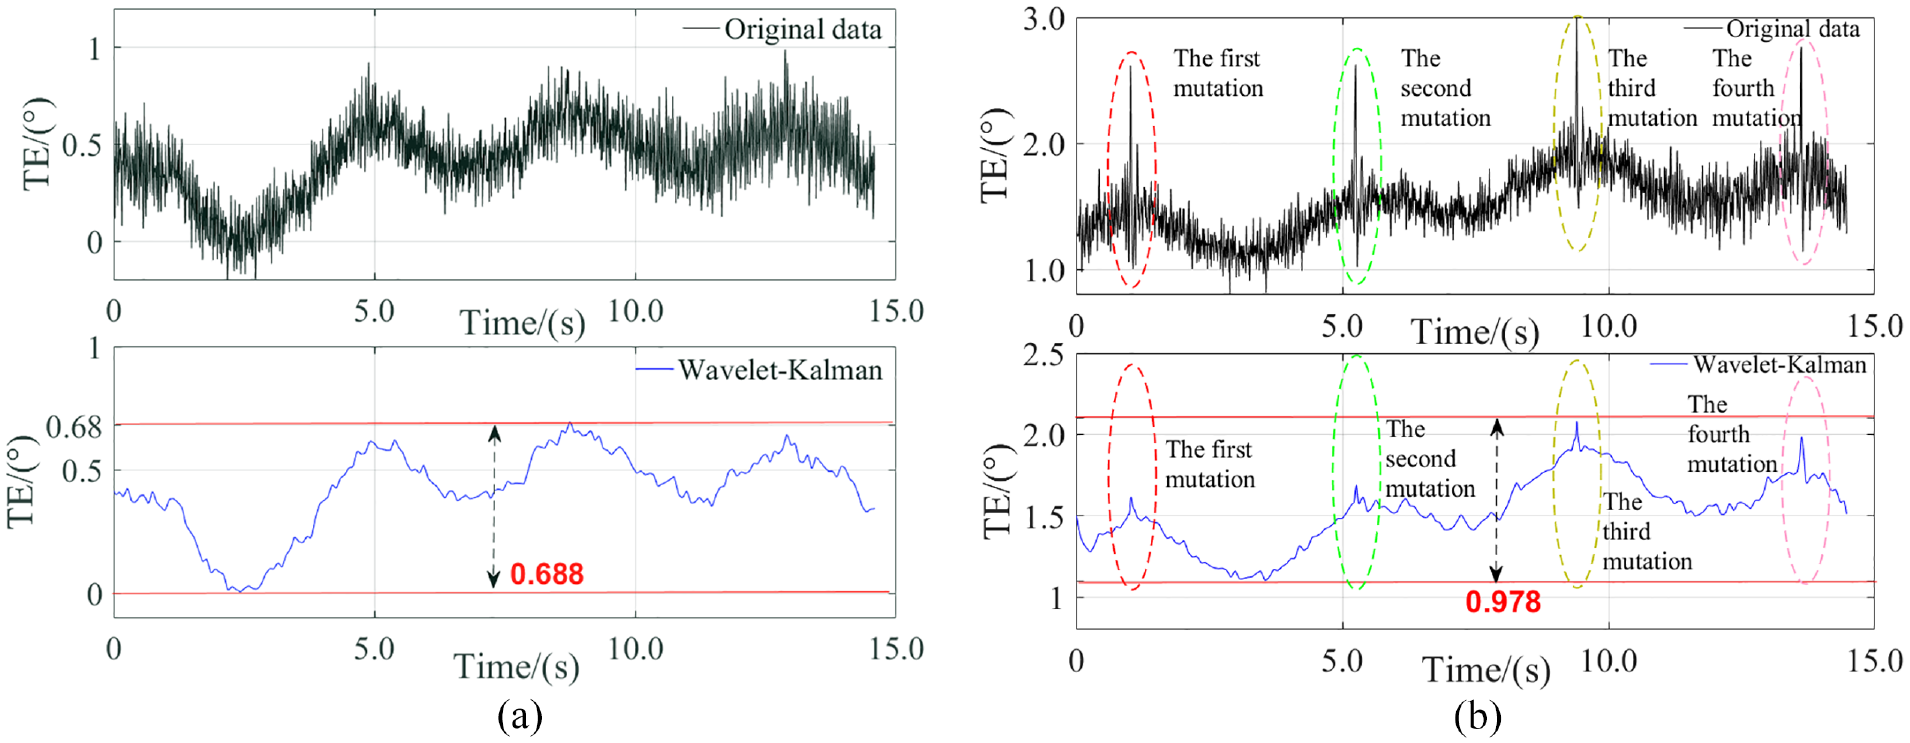
Test results of TE: (a) TE of the normal steering gear under no-load conditions and (b) TE of the steering gear with a broken tooth under no-load conditions.
Test results of the difference between maximum and minimum TE under different working conditions.
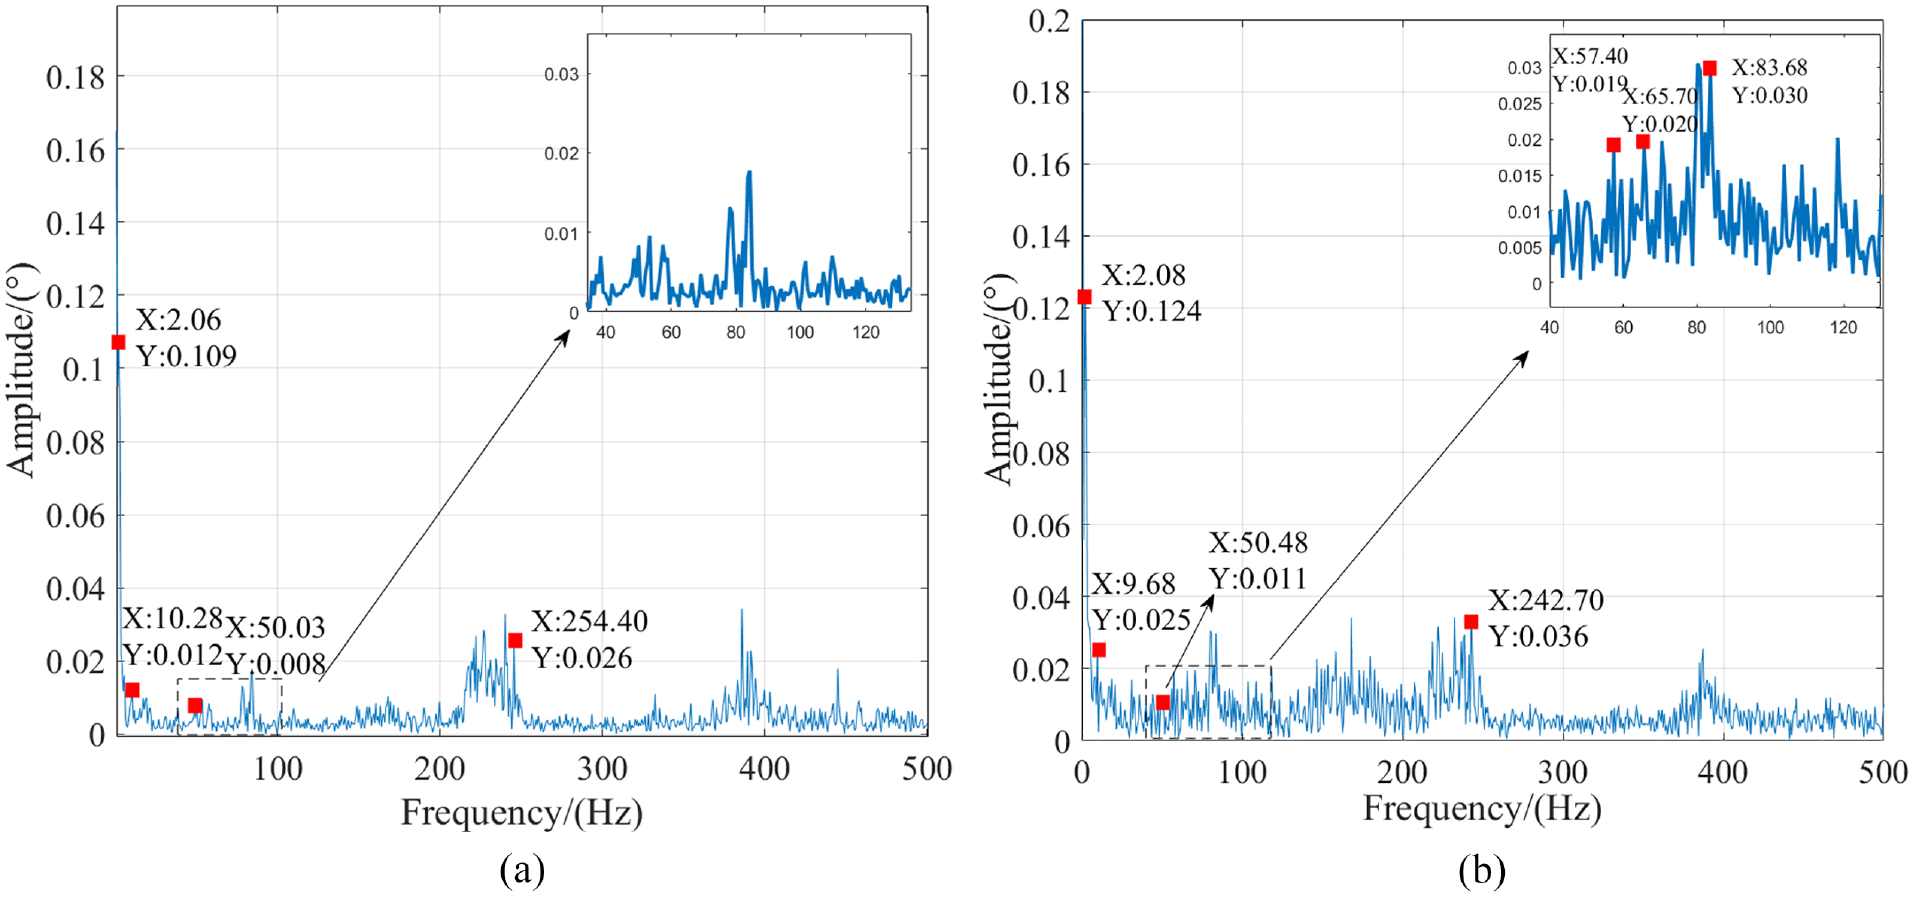
Precision positioning results of a broken tooth: (a) TE spectrum of normal 3 kgf·cm joint steering gear and (b) TE spectrum of 3 kgf·cm joint steering gear with a broken tooth.
Besides the threshold under no-load conditions, the threshold under loading conditions could also be used to identify the existence of a broken tooth. Table 10 shows the differences between maximum and minimum TE of 3 kgf·cm joint steering gear with/without a broken tooth under different working conditions.
The amplitude of the TE of the steering gear with a broken tooth under the no-load condition exceeded the threshold (Figure 16(b)), indicating the existence of a broken tooth in this gearbox. Mutation waveform appeared four times within 14.6 s and the frequency was 0.27 Hz. The broken tooth was found on the fourth stage shaft. A large number of wide sidebands with large amplitudes occurred near the multiple frequencies of 9.45 Hz (Figure 17). The driven gear of the fourth stage shaft was identified as the gear with the broken tooth.
Then, the 3 kgf·cm joint steering gear with a broken tooth was disassembled and checked. Figure 18 shows the physical picture with a broken tooth.
Physical picture with the broken tooth.
As shown in Figure 18, the broken tooth exists on the driven gear of the fourth stage shaft. The method can accurately locate a broken tooth of batch products. In addition, the frequency statistics of a broken tooth at all stages can be used to guide the design and improvement of gearbox.
Conclusion
Broken tooth is a common defect of the joint steering gear of small service robots. In this paper, a comprehensive test machine for the transmission performance of the joint steering gear of a service robot was independently developed and the time domain and frequency domain characteristics of TE data were deeply studied and applied to realize the efficient identification of broken-tooth joint and the accurate positioning of broken tooth. The method proposed in the study can improve the efficiency of ex-factory inspection and return-to-factory maintenance. The statistical data of the frequency of broken tooth position can be used to guide the design and production of gears and have important engineering value in the joint steering gear of a service robot.
The novelty of this paper lies in the exploratory development of a comprehensive test device for joint steering gear. It provides a reference for the integration of transmission performance test method and evaluation standard of joint steering gear. In addition, the conventional measurement results of TE were deeply studied and the results were applied in the identification of broken teeth of small module gears (copper teeth or plastic gears) of small service robots so as to form an accurate positioning method of broken teeth.
However, in the study, it cannot accurately identify the defects such as pitting corrosion in the steering gear and the on-line identification of broken teeth on the production line has not been realized. Therefore, in the future, we will further identify small defects of gears based on TE data and integrate the developed gear fault identification device with a production line so as to realize the on-line identification.
Footnotes
Declaration of conflicting interests
The author(s) declared no potential conflicts of interest with respect to the research, authorship, and/or publication of this article.
Funding
The author(s) disclosed receipt of the following financial support for the research, authorship, and/or publication of this article: The research was supported by the National Natural Science Foundation of China (Grant No. 51905010) and the National Key Research and Development Program of China (Grant No. 2018YFB2001400).