
Abstract
To address the problems of the low accuracy of geometric error identification and incomplete identification results of the linear axis detection of computer numerical control (CNC) machine tools, a new 21-item geometric error identification method based on double ball-bar measurement was proposed. The model between the double ball-bar reading and the geometric error term in each plane was obtained according to the three-plane arc trajectory measurement. The mathematical model of geometric error components of CNC machine tools is established, and the error fitting coefficients are solved through the beetle antennae search particle swarm optimization (BAS–PSO) algorithm, in which 21 geometric errors, including roll angle errors, were identified. Experiments were performed to compare the optimization effect of the BAS–PSO and PSO and BAS and genetic particle swarm optimization (GA–PSO) algorithms. Experimental results show that the PSO algorithm is trapped in the local optimum, and the BAS–PSO is superior to the other three algorithms in terms of convergence speed and stability, has higher identification accuracy, has better optimization performance, and is suitable for identifying the geometric error coefficient of CNC machine tools. The accuracy and validity of the identification results are verified by the comparison with the results of the individual geometric errors detected through laser interferometer experiments. The identification accuracy of the double ball-bar is below 2.7 µm. The proposed identification method is inexpensive, has a short processing time, is easy to operate, and possesses a reference value for the identification and compensation of the linear axes of machine tools.
Keywords
Introduction
The CNC machine-on-machine measurement system is composed of the machine tool body and trigger probe. The probe generates a trigger signal, which prompts the machine tool’s 3D coordinate reading device to obtain a reading and realize 3D coordinate measurement of the measured point. The machining accuracy of the tested workpiece is guaranteed by the hardware installation accuracy and machining parameters of the machine tool. If the machine tool is used to build an on-machine measurement system to measure the machining accuracy of the workpiece, then the positioning and measurement accuracy of the machine tool structure and reading system as the measurement device and reference must be three times higher than the machining accuracy of the machine tool. Thus, only the machine tool hardware is used to ensure that the method cannot satisfy this requirement. The error separation method must be utilized to separate the geometric errors of the machine tool, and a high-precision error model 1 needs to be established to compensate for the measurement error.
At present, the geometric error identification methods for computer numerical control (CNC) machine tools mainly use dual-frequency laser interferometers, double ball-bar, laser trackers,2–4 and other equipment. 5 Laser interferometers use the principle of interference to measure displacement errors. Through various specific combinations of measuring mirrors, single measurements of positioning errors, straightness, verticality, and pitch and yaw errors of each axis can be derived. Although the laser interferometer has high detection accuracy, its installation and debugging process is complicated, time-consuming, and unable to detect the roll angle error of each axis, and one measurement can only measure the geometric error on one spatial measurement line, and the measurement efficiency is low 6 . The laser interferometer can only measure in a limited space, and there is no method to achieve the full spatial coverage and rapid error measurement. These shortcomings can be addressed by adopting the double ball-bar method. The double ball-bar can separate and identify 21 geometric errors, including rolling angle errors, by measuring conventional three-plane arc trajectories. In recent years, domestic and foreign scholars have proposed many methods for identifying spatial errors on the basis of the double ball-bar. Tsutsu et al. 6 used a three-axis linkage method to set two different measurement trajectories of the double ball-bar to identify the position-independent geometric errors of the rotation axis with a tilt angle. Chen et al. 7 constructed a robust identification model to identify six geometric errors of the tilting rotary table on the basis of the double ball-bar measurement results at three different installation positions. Zhong et al. 8 designed a nine-minute circular measurement path for the comprehensive error of each axis of a five-axis machine tool to identify spherical deviations with a double ball-bar. However, the geometric error elements were not identified. Guangsheng et al. 9 identified seven geometric errors of the turntable through the four special installation methods of the double ball-bar on the turntable. Gang et al. 10 utilized the six-step measurement method of the double ball-bar and the least squares method to eliminate the influence of the installation error of the former. They identified 10 geometric errors of the multi-axis CNC machine tool turntable, including verticality and position errors. Compared with the geometric error of the rotating table identified by the double ball-bar, fewer research focus on the linear axis error identification based on the double ball-bar. Wenjie et al. 11 used the ridge regression method to identify the polynomial coefficients of the geometric error elements on the basis of a linear mapping model between the geometric error source and the length error of the double ball-bar. However, this method took the cost of losing some information and reducing the accuracy, and the identification accuracy was not it is high, and the laser interferometer detection results were compared and verified for only one direction of the X-axis. Kai et al. 12 constructed an identification model for homogeneous coordinate transformation and used least squares method to solve the fitting coefficients to identify 18 position-dependent geometric errors of the linear axis. However, these results were not compared with the measurement results of the high-precision detection instruments for verification, and unable to verify the identification accuracy problem.
The geometric errors of CNC machine tools have complex changing laws and many influencing factors. Therefore, addressing the geometric error identification problem of CNC machine tools on the basis of the double ball-bar can be classified as a multidimensional model optimization problem. Genetic algorithm, particle swarm optimization (PSO), and beetle antennae search algorithm (BAS) are the primary solutions for complex multidimensional models at home and abroad. Wan et al. 13 utilized the particle swarm algorithm with strong global search capability to solve the fitting coefficients and the geometric errors identification of CNC machine tools, but the algorithm fell into local extreme values when addressing complex optimization problems up to 36 dimensions, resulting in inaccurate optimal solutions. BAS is a new and efficient optimization algorithm in accordance to the foraging behavior of long beetles; it was proposed by Jiang and Li 14 in 2017. Compared with other algorithms, BAS is simple and flexible, avoids local optimal solutions, and is suitable for high-dimensional search. However, its search consumes a large amount of time, and its global search capability needs further improvement. Combining the characteristics of the two algorithms, this study proposes a beetle antennae search–particle swarm optimization (BAS-PSO) algorithm, which is applied to solve the identification coefficients of the geometric errors of CNC machine tools on the basis of the double ball-bar to obtain enhanced global search capabilities and algorithm stability, and then compared the results of the three-axis single geometric error detection through laser interferometer for a comparative verification.
Geometric error model of a three-axis vertical machining center
When establishing the position-dependent geometric error model of machine tools, the coordinates of the workpiece and tool should be transformed into a fixed coordinate system (i.e. a reference coordinate system) because the positions of both change with the movement of the motion pair. 15 In general, the machine tool base or the lathe bed is set as the reference coordinate system, and the motion coordinate system is established on each moving part relative to the reference coordinate system (i.e. X-, Y-, and Z-slide rails). The entire machine tool’s motion circuit consists of workpiece kinematic chain and tool kinematic chain according to the cutting tool tips (Figure 1).
The workpiece kinematic chain and tool kinematic chains of the three-axis vertical machine tool are respectively sequenced as follows:
Bed R → Y-axis → X-axis → workpiece W
Bed R → Z-axis → spindle S → tool T
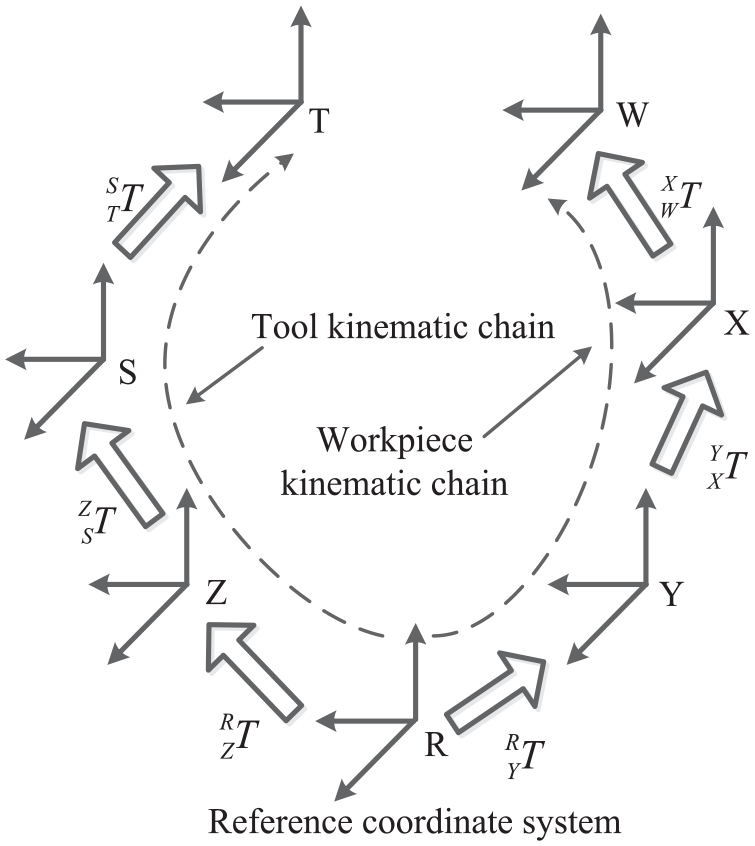
Schematic diagram of machine tool kinematic chain.
In this study, the machine tool is regarded as a rigid body. Hence, no deformation can occur during processing. Based on the rigid body assumption, the machine tools can be regarded as a rigid chain link composed of revolute joints and prismatic joints. The transfer relationship between adjacent parts can be expressed as a 4 × 4 homogeneous transformation matrix (HTM), and the entire motion model of the machine tool can be derived finally through transforming the point coordinates from adjacent local coordinate systems to reference coordinate systems.
Two kinds of motion models are established on the basis of whether or not geometric errors are considered, namely, the ideal kinematic model 16 (IKM) and the real kinematic model (RKM). Both kinematic chains have been established for three-axis vertical CNC machine tools (workpiece kinematic chain and tool kinematic chain). The workpiece kinematic chain is taken as an illustration in the subsequent discussion.
The HTM of the Y-axis in IKM can be represented by
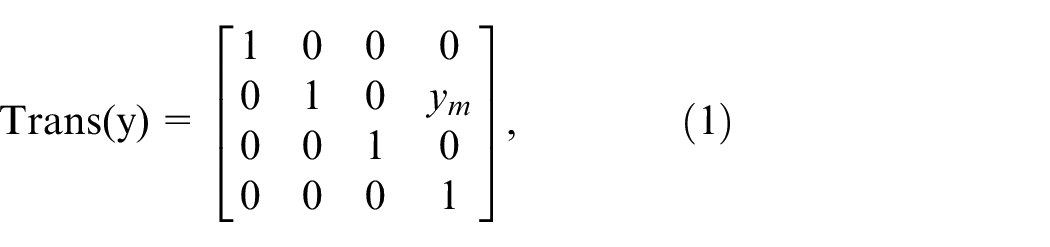
Ignoring higher-order terms, the HTM of the Y-axis geometric error can be represented by
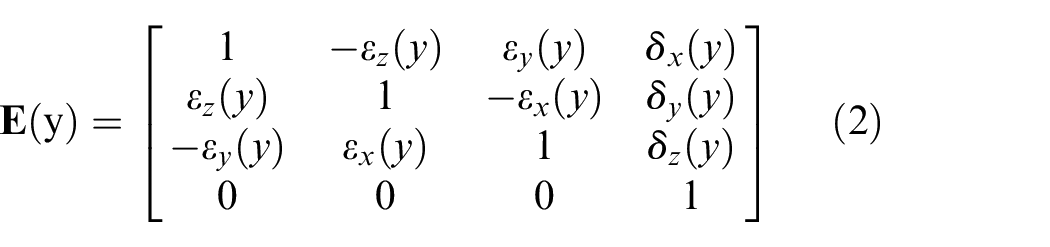
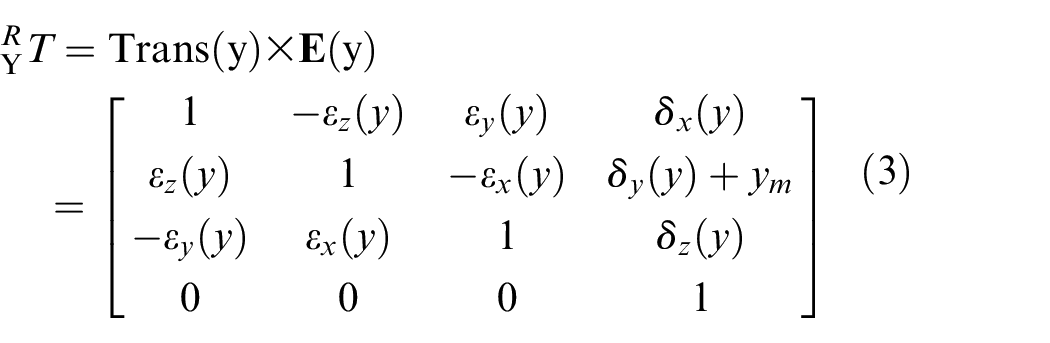
According to equations (1) and (2), the HTM of the Y coordinate system in bed R, including each geometric error, can be obtained as
Similarly, the HTM of X in IKM can be represented by
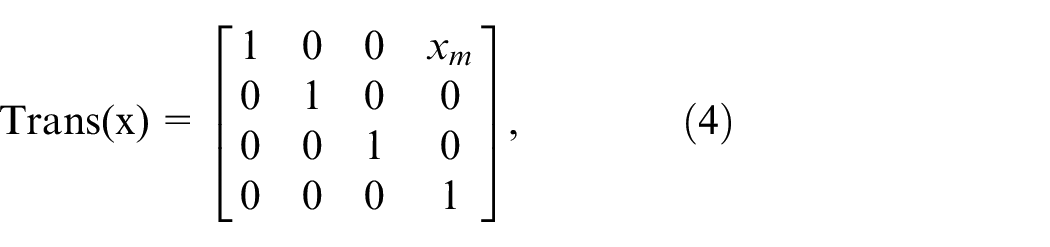
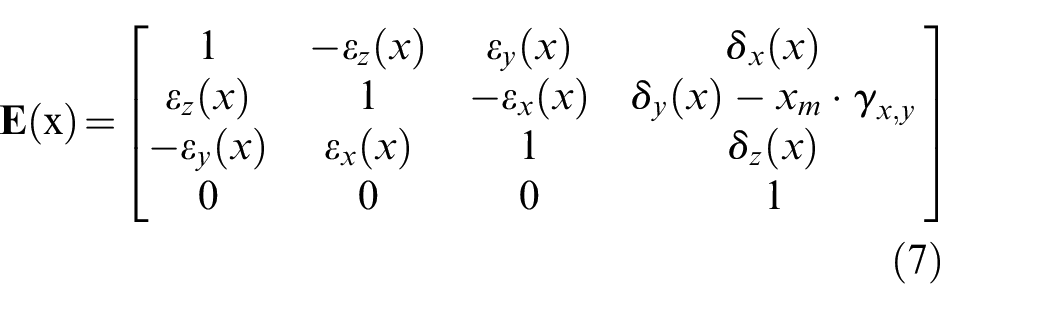
Ignoring higher-order terms, the HTM of the X-axis geometric error can be represented by

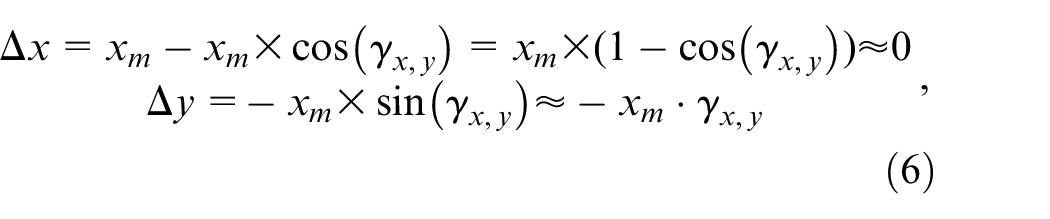
Using the assembly method, with the Y-axis as the mounting reference, a verticality error between the X and Y axes can be obtained.
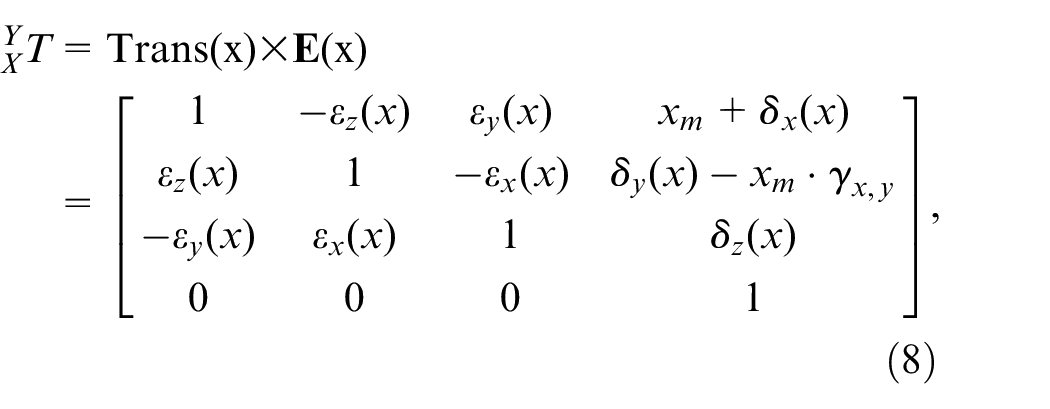
Then, the error transfer matrix can be expressed as
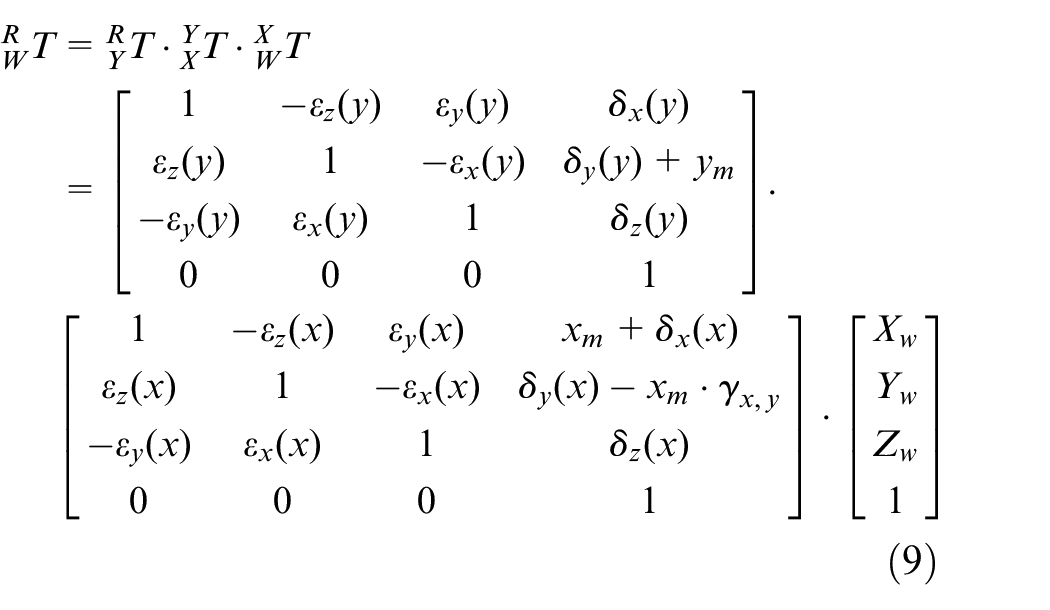
According to equations (4) and (7), the HTM from the X-axis coordinate system to the Y-axis coordinate system in RKM is expressed as
Setting the position coordinate vector of the theoretical processing point of the workpiece in the workpiece coordinate system as
Based on the similar principal, the RKM of the Z-axis

where
In IKM, the tool position should be consistent with the machining point of workpiece. However, considering the non-negligible geometric errors, these positions do not coincide in most cases, thus affecting the machining accuracy and surface quality.
The difference between equations (9) and (10) is the relative displacement error matrix between the tool tip and the workpiece, that is, the geometric error matrix of the machine tool.

Measurement principle and identification method
Double ball-bar’s measurement principle
Figure 2 shows a schematic of the measuring principle of the double ball-bar. In the diagram, the coordinates of the center of the precision ball adsorbed on the worktable mounting base are
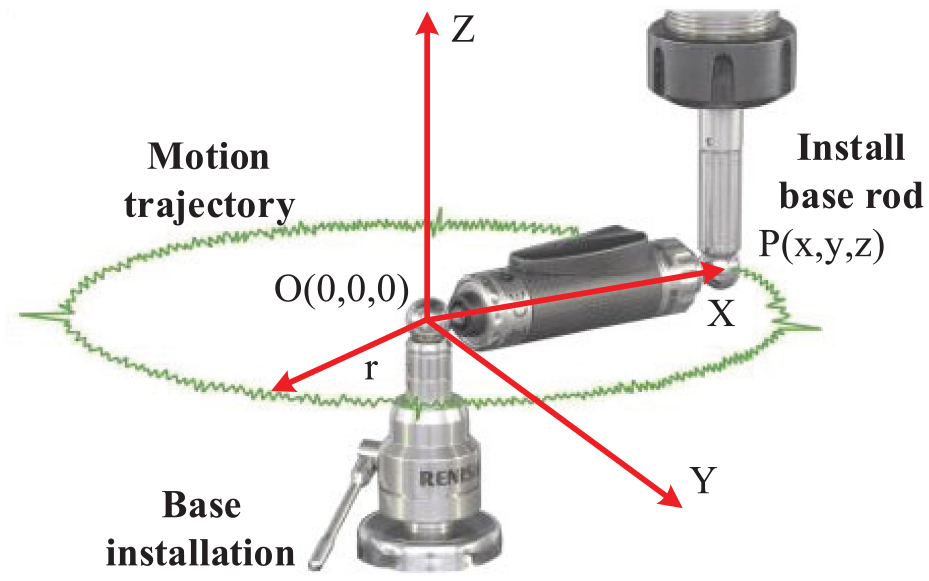
Measuring principle diagram of the double ball-bar method.
The true length containing the geometric error of the double ball-bar can be represented by

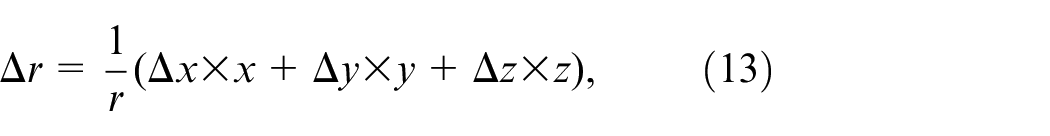
where Δx, Δy, and Δz are all within a micrometer range, and the quadratic term is ignored. The measuring error of the double ball-bar can be expressed as
where
Geometric error identification method
According to theoretical derivation, equation (10) can be written as
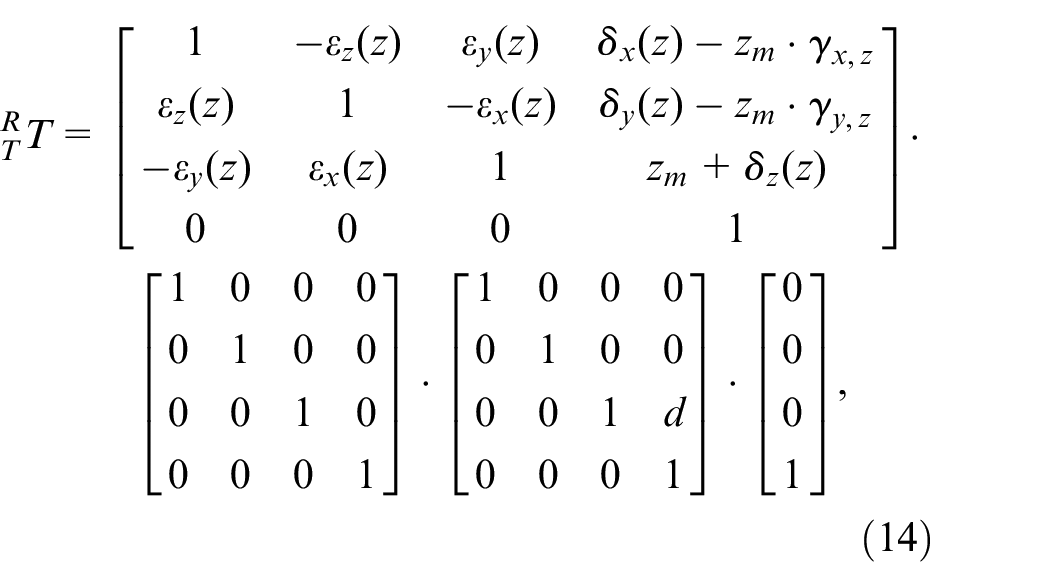
where
According to equations (9), (11), and (14), let
where x, y, and z are the theoretical coordinate values of the measurement points.
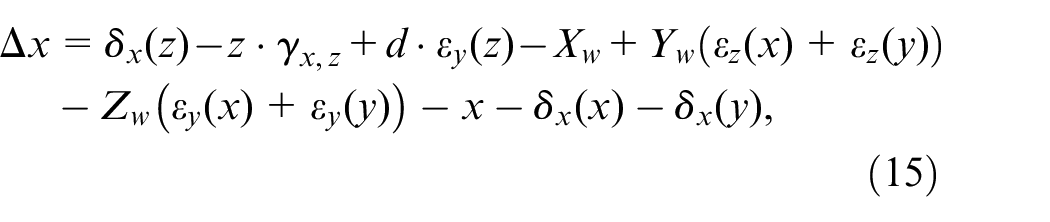
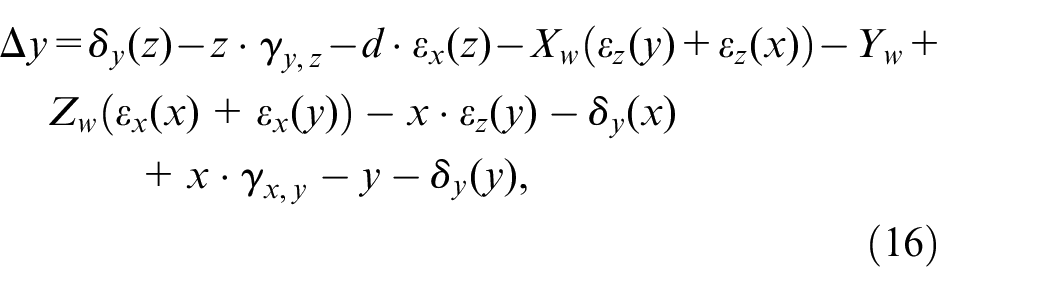
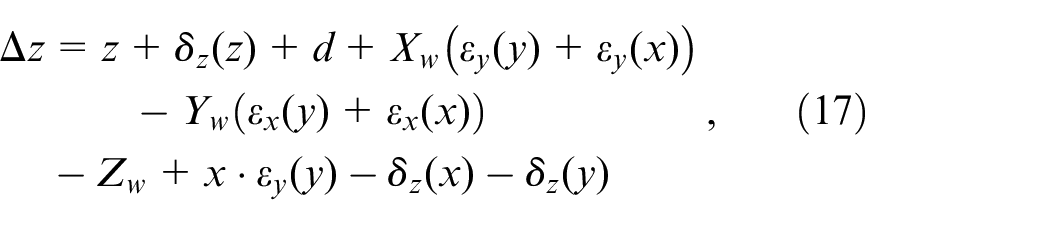
Substituting the above equations into equation (13) yields
Experiments indicate that the geometric error component is correlated with the movement position of the CNC machine tool, revealing that the geometric error value during the movement varies with the position and is not constant. This phenomenon should be considered using a simple method that involves fitting the geometric error components with a cubic polynomial function.
According to the quadratic analytical model of the geometric error of the machine tool, 17 the non-negligible angle deviation around the central axis perpendicular to the translation axis always exists, resulting in errors in straightness, and the yaw angle error is calculated based on the partial differential of the straightness error. Considering the Y-axis as an example, for the simplicity of calculation, the higher-order terms of errors are discarded, and the positioning, yaw angle, and X-direction straightness errors can be expressed as
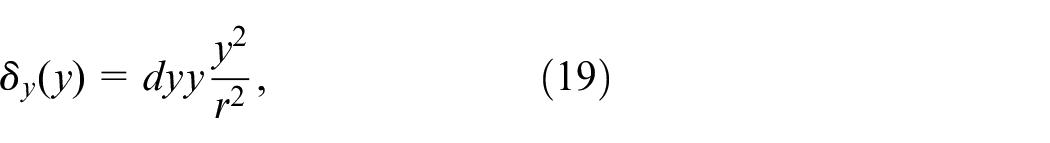
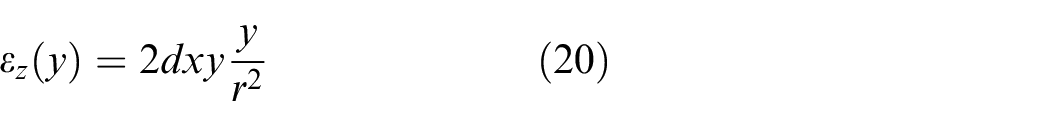
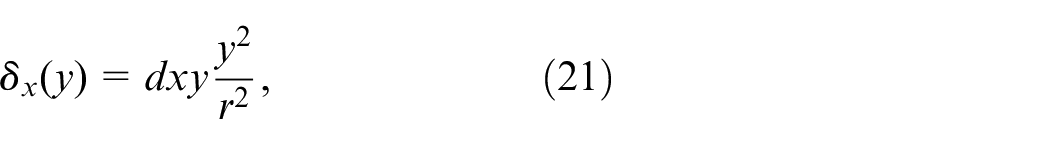
where y is the theoretical coordinate value of the measurement point,
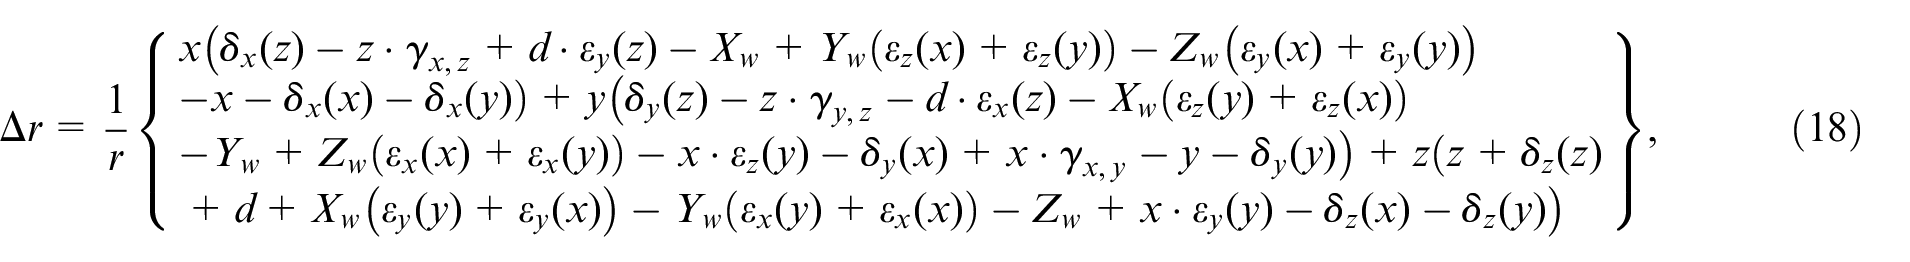
Apart from the three verticality errors, 18 position-dependent geometric component errors can be obtained to express the correlation equation into equation (18). An equation with 12 unknown parameters relevant to the length deviation of the double ball-bar, can also be obtained.
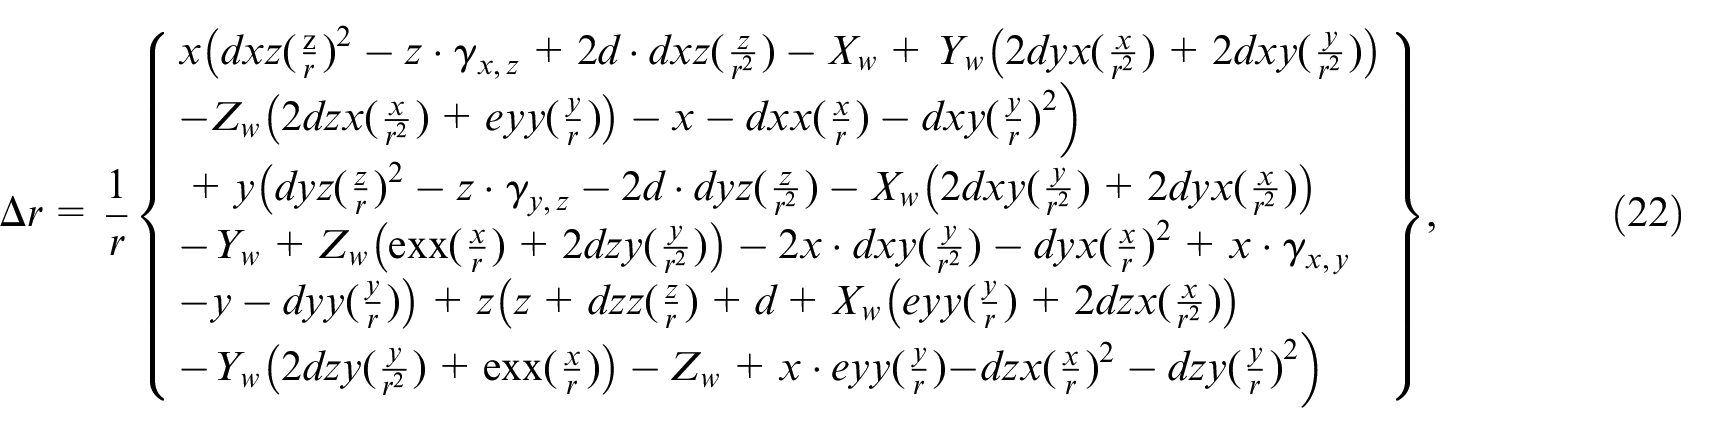
where
From the measurements, data with thousands of sets of radial error values
BAS–PSO algorithm
BAS–PSO
PSO is a random algorithm. When solving some complicated optimization problems, falling into local extreme values is easy, resulting in inaccurate optimal solutions. The BAS–PSO is a PSO algorithm based on BAS, which can accelerate the parallel calculation of global search and local search, and quickly obtain the global optimal solution by quickly approximating the fitness value of the objective function. The basic idea of this algorithm is to transplant the antenna search operation of BAS into the speed and position update process of PSO to enhance the global search capability. Using this algorithm to solve the approximate solution of the double ball-bar’s overdetermined equations can resolve the shortcomings of the PSO. The flow chart of the BAS–PSO is displayed in Figure 3.
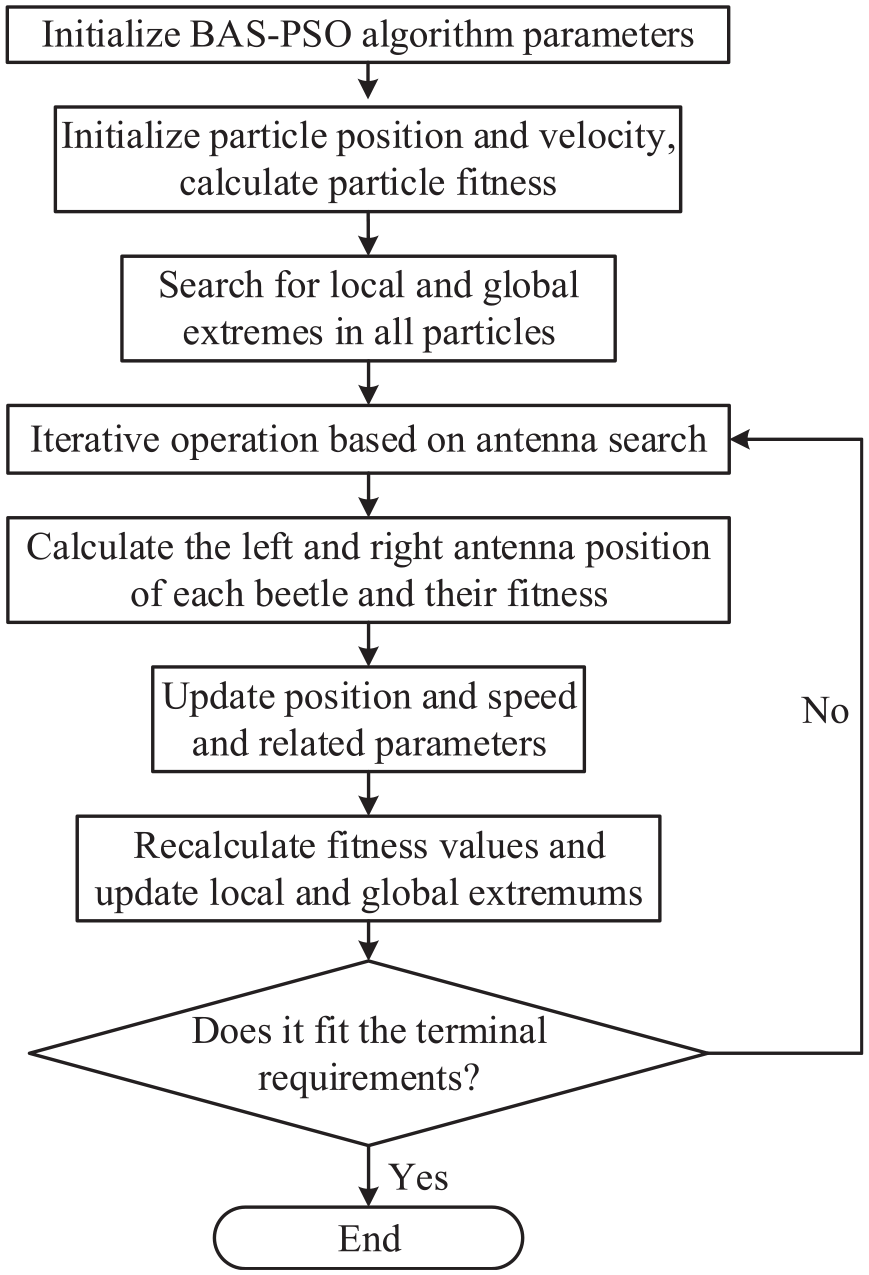
Flow diagram of the BAS–PSO algorithm.
The antenna search operation follows the following rules:
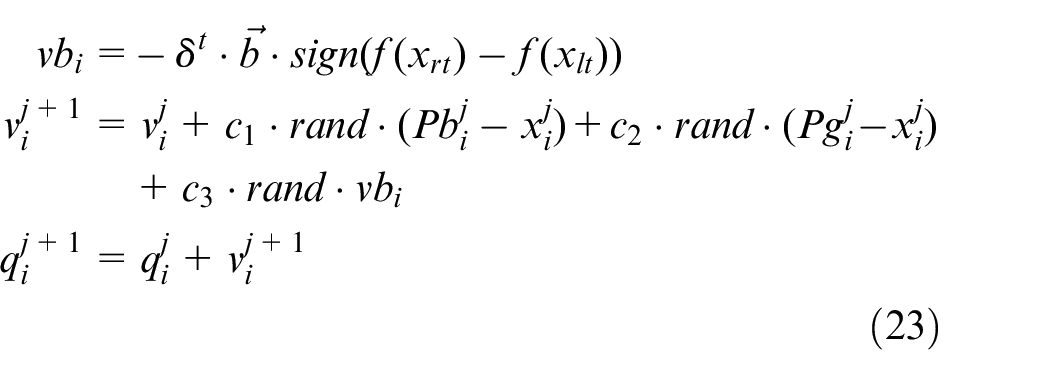
where j represent the number of iterations,
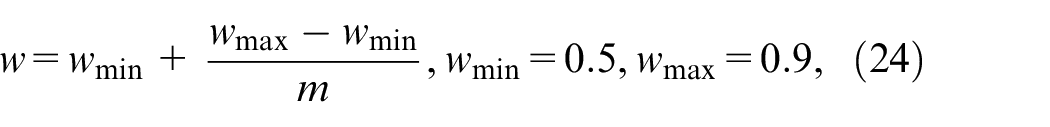
This study refers to the related literature
13
and compares the search results of algorithms under multiple sets of inertia weight values. The optimization effect is better when
Algorithm test for identifying geometric errors
To test the performance of this algorithm, this study used the PSO, BAS, GA-PSO, 13 and BAS–PSO algorithms to calculate the double ball-bar readings of the XY plane machine tool clockwise and applied the fitting coefficients of the overdetermined equations determined by the objective function of equation (22). By calculating and comparing the sum of squares of the least squares errors of the four algorithms, the smaller the result, the closer the fitness value of the objective function is, and the result is the optimal solution of the overdetermined equation system. All algorithms are run on MATLABR2016B. The experimental platform uses AMD Athlon (tm) IIX4 641 quad-core processor, CPU at 2.79 GHz, and a PC with 12 GB of running memory.
PSO algorithm parameter settings: particle size PopSize = 36, maximum iterations maxgen = 30, maximum and minimum speed Vmax = 0.5 and Vmin =−0.5, acceleration factor c1 = c2 = 1.49445.
BAS algorithm parameter settings: maxgen = 30, step factor: eta = 0.95, initial step: step = 22.
GA–PSO algorithm parameter settings: PopSize=36, maxgen=30, c1=c2=1.49445, crossover probability CrossPercent=0.7, and the inertia weight selection method shown in equation (24).
BAS–PSO algorithm parameter settings: PopSize=36, maxgen=30, c1=c2=c3=1.49445, step factor: eta=0.95, initial step: step=22, and the inertia weight selection method is the same as above.
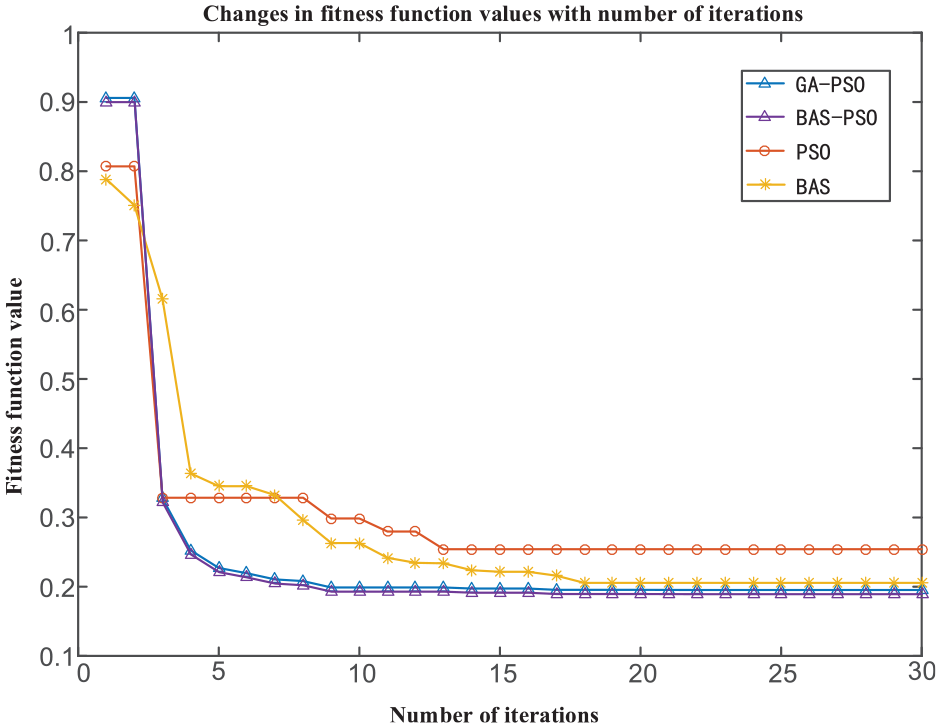
PSO, BAS, GA-PSO, and BAS–PSO are repeatedly run for 10 times each. The single optimization results of the four algorithms are presented in Figure 4, and the test results are summarized in Table 1. Figure 4 shows the variation of the fitness function value with the changes of the number of iterations. In accordance to the measurement data of the XY plane, the fitness function value of the BAS–PSO and the GA-PSO algorithms both reache the minimum value in the ninth generation. Regardless of the number of calculations, the minimum value remains almost unchanged. The experimental results show that the BAS–PSO algorithm possesses fast convergence speed, high identification accuracy, satisfactory optimization performance, and suitability for the geometric error coefficients identification of CNC machine tools.
Comparison of the optimization results of the four algorithms.
Test results of the four algorithms.
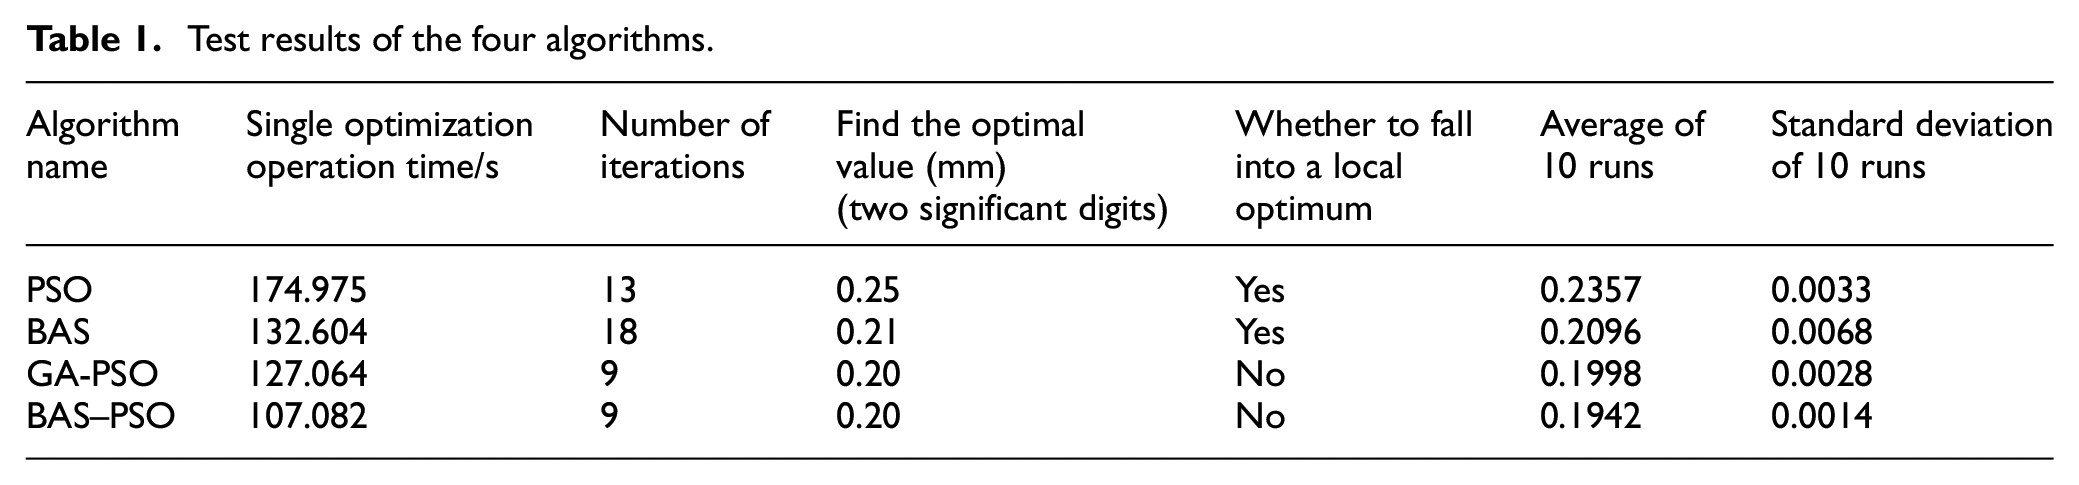
From the comparison of the optimization results in Table 1, the following inferences are obtained. (1) The PSO algorithm and the BAS algorithm are trapped in the local optimal solution after multiple iterations, and the optimal values are 0.25 and 0.21 mm. Neither the GA-PSO nor the BAS-PSO algorithm is trapped in the local optimal solution, but the former can only obtain the suboptimal approximate solution of the problem, not the optimal one, and the BAS-PSO and the GA-PSO algorithm optimization results are similar. (2) The convergence speed of the BAS-PSO algorithm is faster than that of the BAS and PSO algorithms. The BAS-PSO and the GA-PSO algorithm both converge in the ninth generation, whereas the BAS and PSO algorithms converge in the 18th and 13th generations, respectively. (3) The single optimization operation time of the BAS–PSO algorithm is shorter than that of the BAS, PSO and the GA-PSO algorithms. Compared with the PSO, BAS and the GA-PSO algorithms, the BAS–PSO algorithm improves the speed of a single optimization operation by 63.4%, 23.8%, and 18.7%, respectively. This is also the biggest difference between the BAS-PSO and GA-PSO algorithms. (4) Based on the average value and standard deviation obtained by each algorithm after 10 independent runs, the accuracy and stability of the BAS–PSO algorithm are better than those of the PSO, BAS, and the GA-PSO algorithms.
Experiment and result comparison
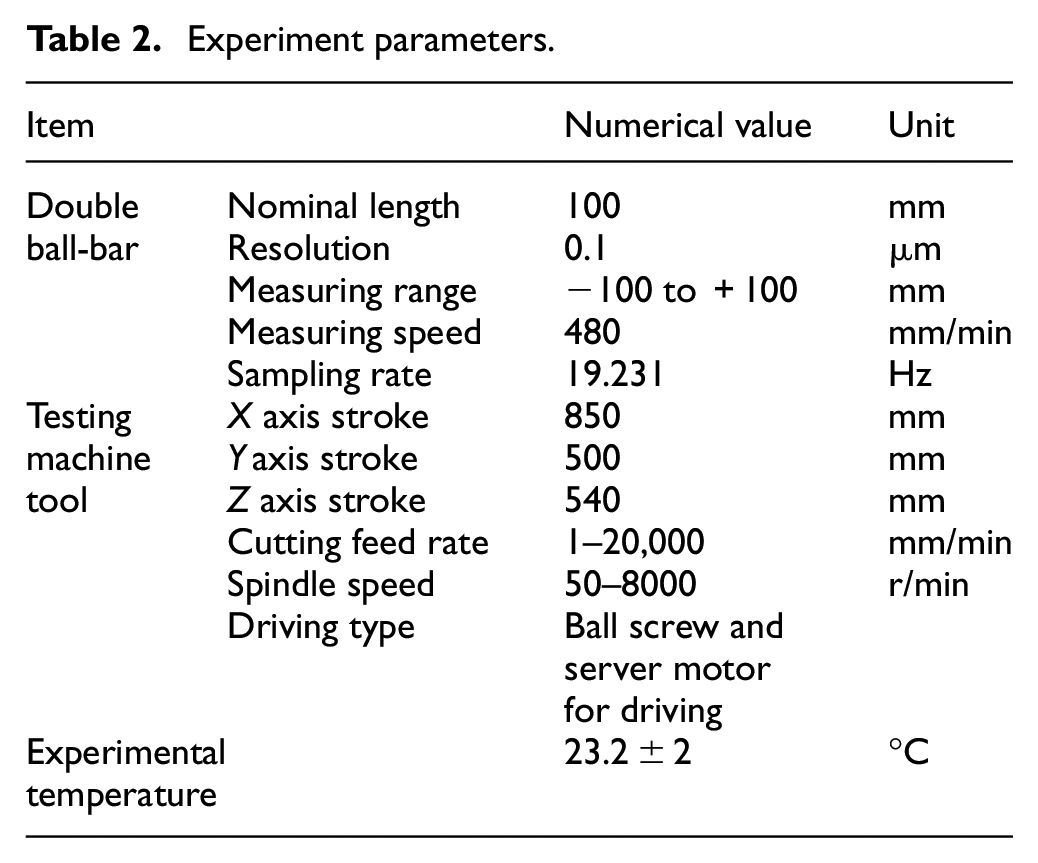
The identification method was applied to the Shenyang Machine Tool VMC850E three-axis vertical machining center. Renishaw’s QW20 double ball-bar was used to measure and identify the geometric error of CNC machine tools. Several parameters are shown in Table 2.
Experiment parameters.
Three-plane test and error identification
A large stroke cannot be measured easily because the length of the cue bar is divided into 50, 100, and 150 mm and restricted by installation. The comprehensive geometric errors on the XY, YZ, and ZX planes of the machine tools were measured with the double ball-bar, and the length of the rod was set to 100 mm. On the XY plane, the movement stopped in the z direction. Similarly, the movement stopped in the X and Y directions on the YZ and ZX planes, respectively. A 360° (overrange 45°) arc measurement was performed on the XY plane, and a 220° (overrange 2°) arc measurement was performed on the ZX and YZ planes, as shown in Figure 5.
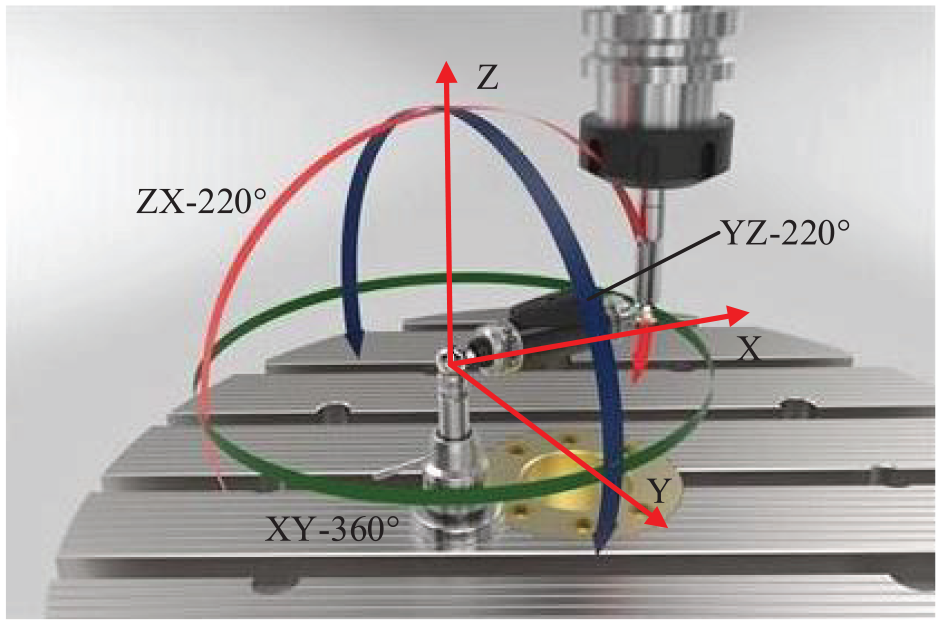
Trace pattern of the double ball-bar test.
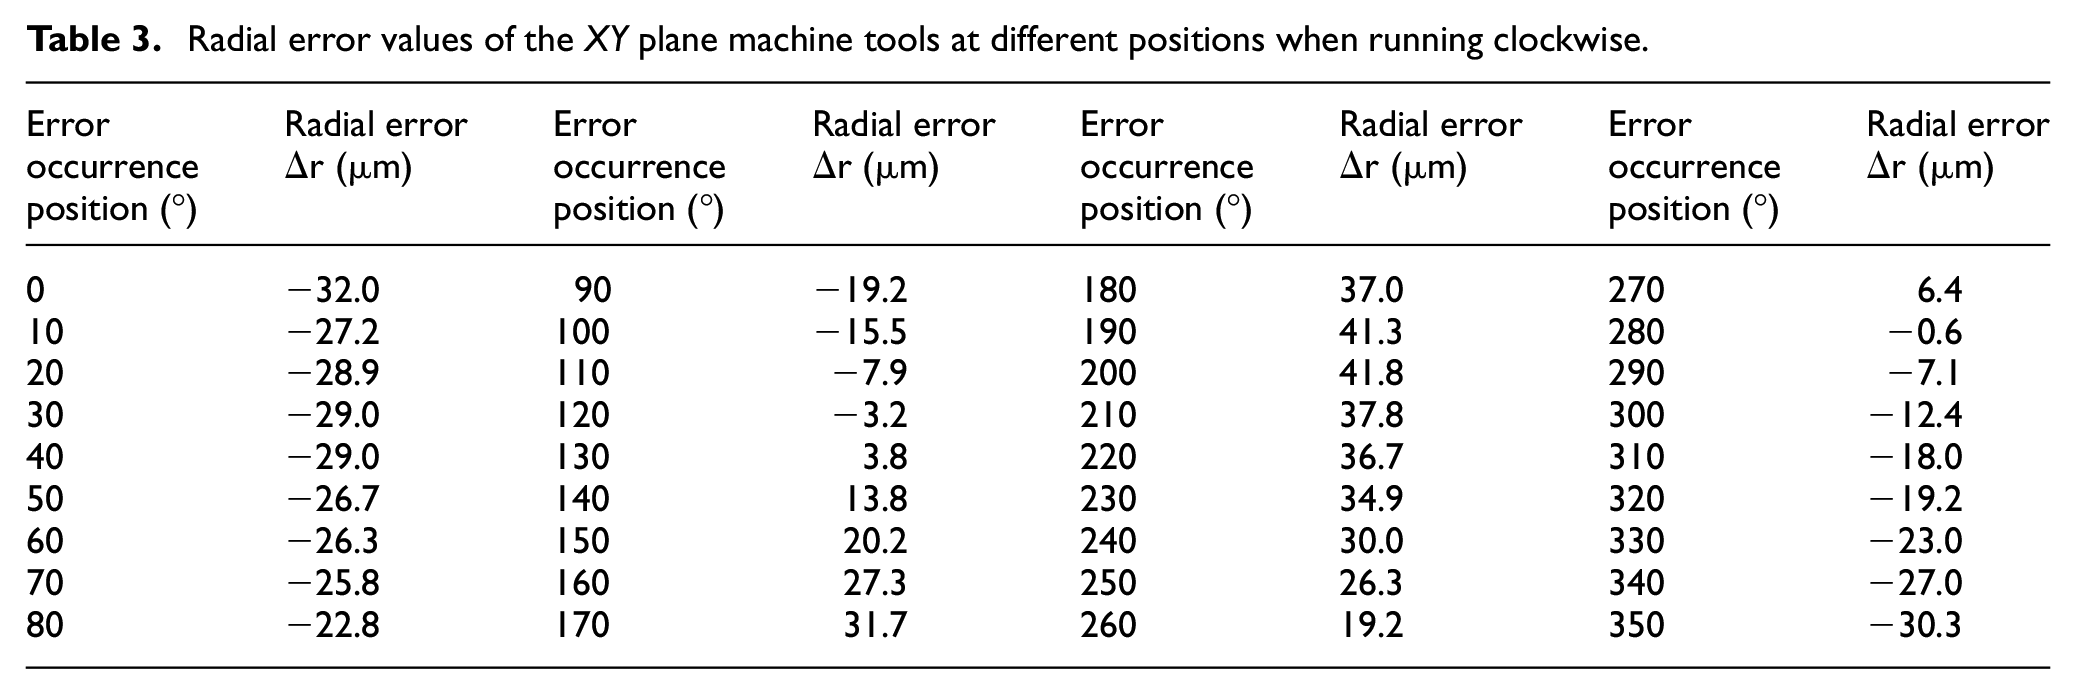
The QW20 double ball-bar was installed on the workbench, and the experiment was performed under a no-load condition of the machine tool. Figure 6 displays the field test chart of the double ball-bar. The spindle of the machine tool performed clockwise and counterclockwise circular path interpolation motions with a radius of 100 mm in each plane at a speed of 480 mm/min. The QW20 double ball-bar was rotated by 10° to select data once, and three measurements were performed in each plane experiment. The average value, which is taken as the final value, was detected by the double ball-bar to reduce the random errors. Take the clockwise operation of the XY plane machine tool as an example. Table 3 lists the double ball-bar measurement data at different positions. This method was used to solve the unknown coefficient of the geometric error model.
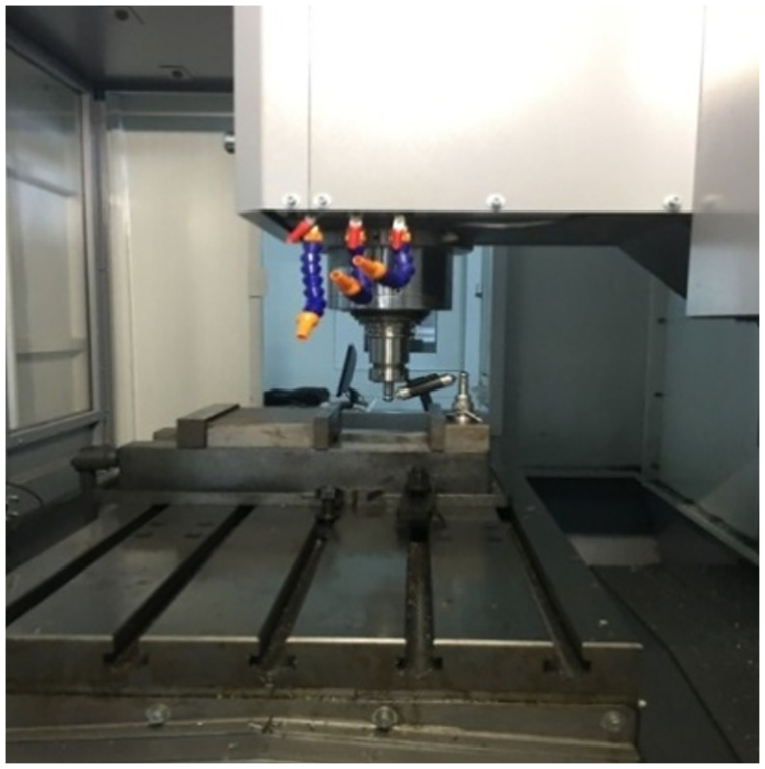
Double ball-bar experiment on CNC machine tools.
Radial error values of the XY plane machine tools at different positions when running clockwise.
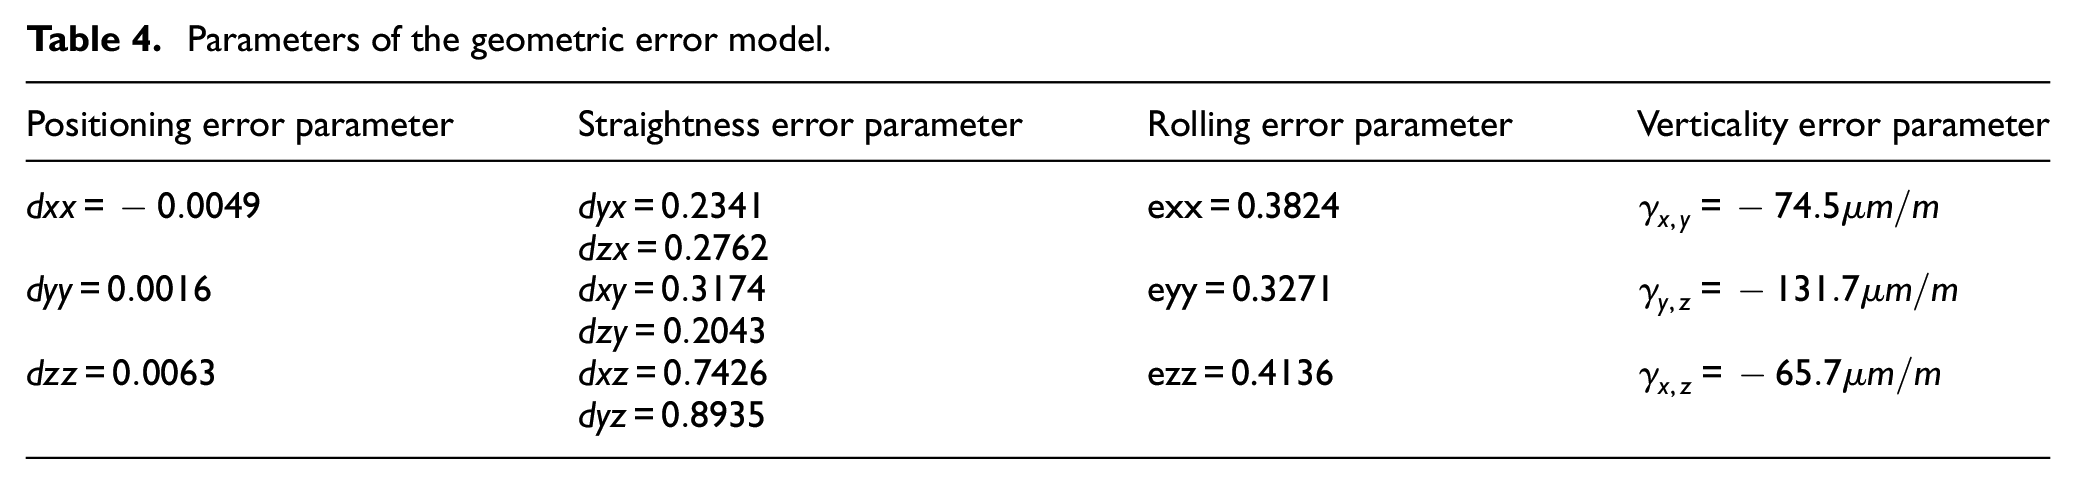
According to the BAS-PSO algorithm flow chart shown in Figure 3, the corresponding parameters of each geometric error model are solved through programming (Table 4).
Parameters of the geometric error model.
Each parameter and related coordinate values were substituted into equations (19) to (21) to obtain the identification values of the machine tool geometric errors. Figures 7 to 9 present the identification results of the six position-dependent geometric errors of the three axes.
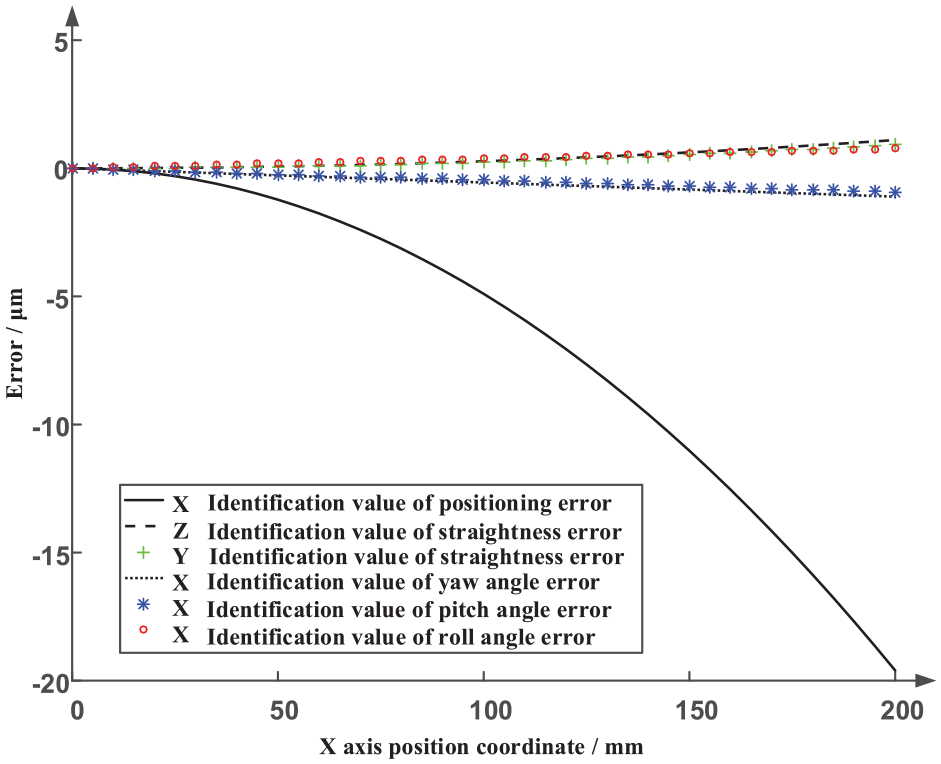
Identification results of the X-axis position-dependent geometric errors.
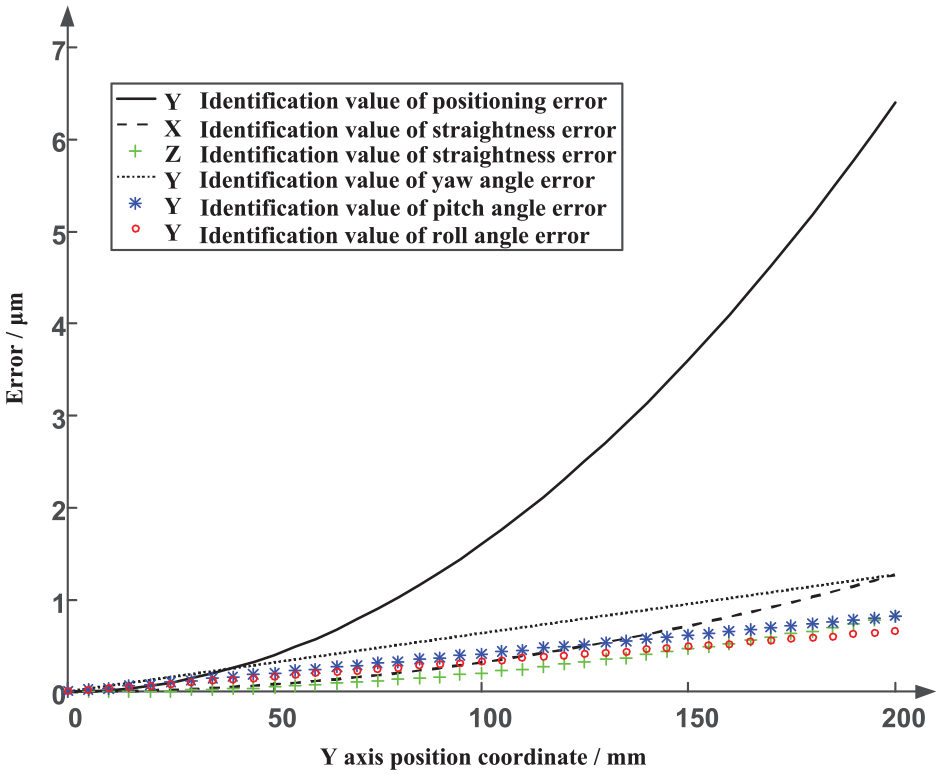
Identification results of the Y-axis position-dependent geometric errors.
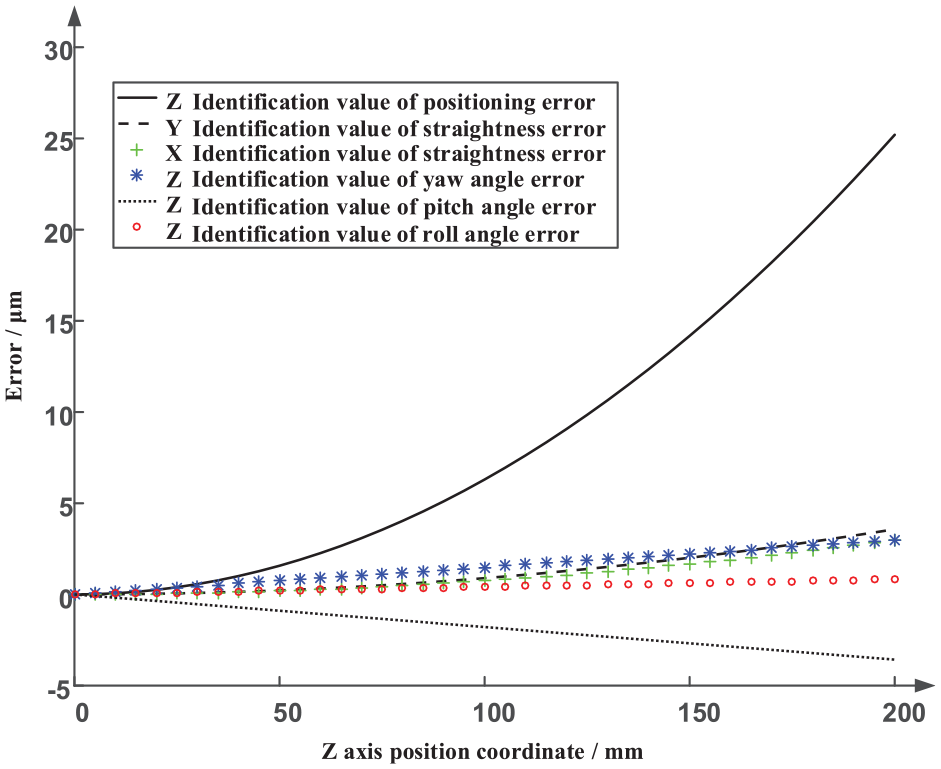
Identification results of the Z-axis position-dependent geometric errors.
Therein, three verticality error parameters were directly obtained by measurement of the double ball-bar.
According to the geometric error identification results of the machine tool shown in Figures 7 to 9, among all the geometric errors of CNC machine tools, the positioning error of each axis exerts the greatest impact on the overall geometric error and far exceeds the impacts of angle and straightness errors. The variation ranges of the positioning error of the X, Y, and Z axes are −20–0 μm, 0–6.4 μm, and 0–25 μm, respectively. The variation range of the Y axis positioning error is smaller than that of the two other moving axes. The absolute value of each geometric error increases with the increase in displacement because of the accumulation of errors and reaches the maximum at the displacement limit position.
Comparative analysis of results
To verify the accuracy of the identification method, the individual errors of the laser interferometer were determined within the corresponding measurement range in the three directions of the double ball-bar experiment. The measurement area was set to 200 mm × 200 mm × 200 mm, and data were collected once every 5 mm. Each measurement point was unidirectionally measured three times. The unit of the angular error was arc seconds, and the unit of the linear error was μm. Thus, for a comparison using the same result graph, the unit of the angular error was converted according to the technical information of the laser interferometer, as shown in equation (25). We measured the pitch and yaw Abbe arm in the X, Y, and Z directions, as shown in Table 5. After conversion, the straightness error caused by the corresponding angle error was obtained.

Experimental measurement of Abbe arm.
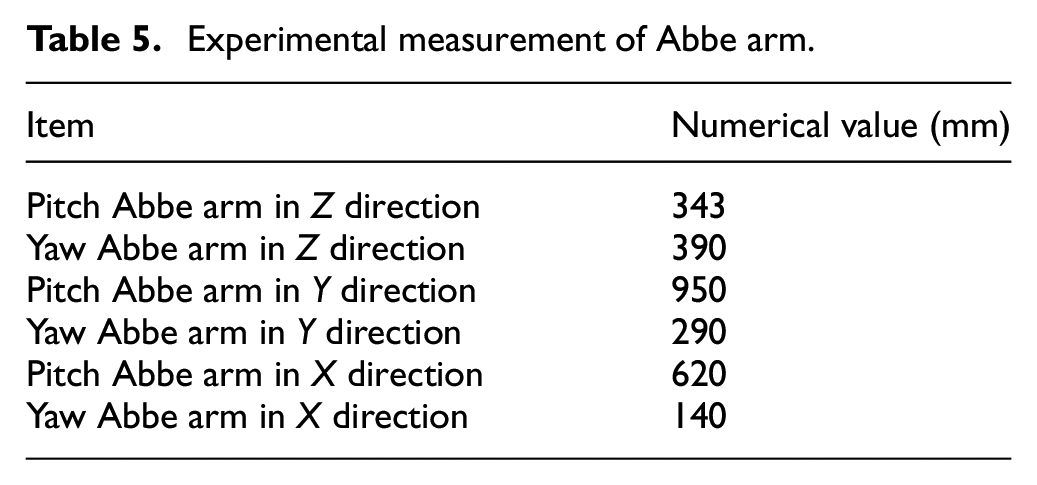
Figure 10 shows the on-site detection chart of the laser interferometer with the three verticality errors directly measured by the double ball-bar. The correctness of the three-axis roll angle error identification (
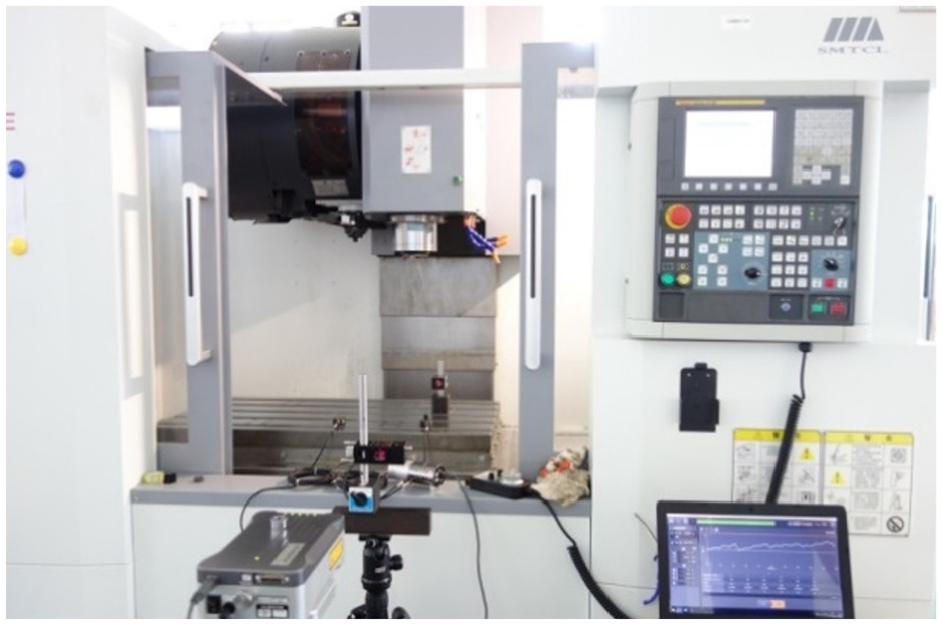
Laser interferometer experiment on CNC machine tools.
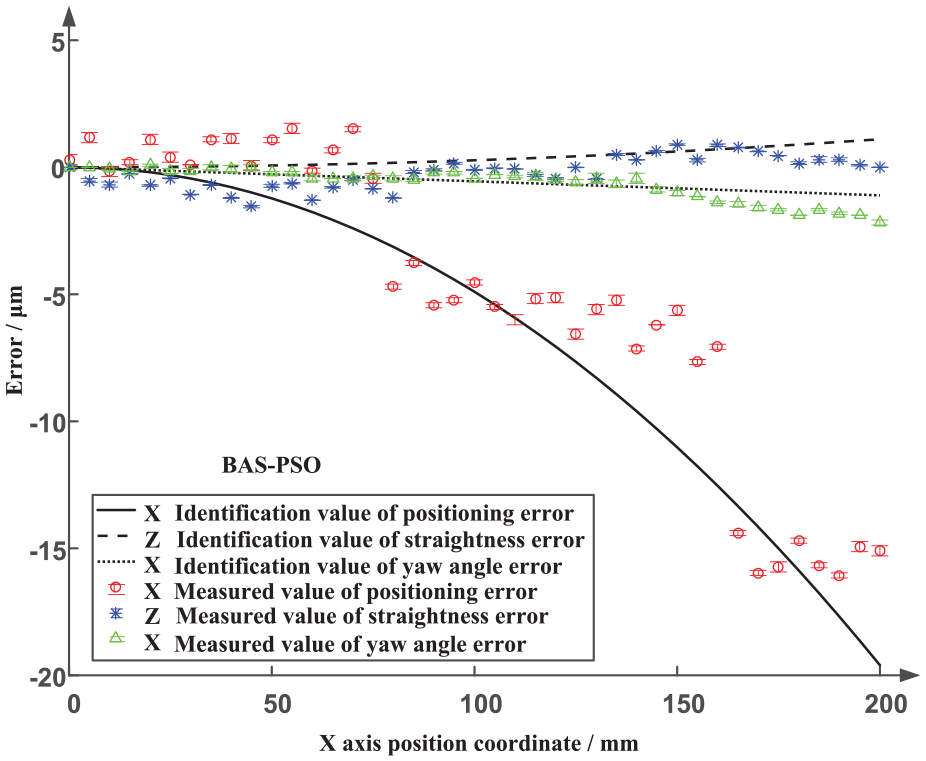
Comparison chart of the geometric errors at different positions on the X-axis.
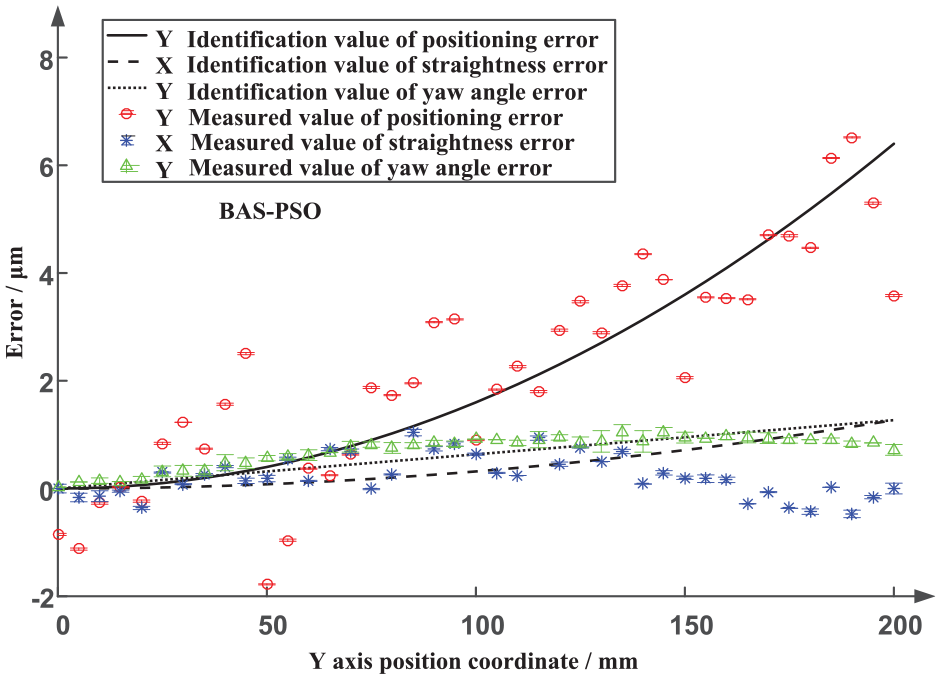
Comparison chart of the geometric errors at different positions on the Y-axis.
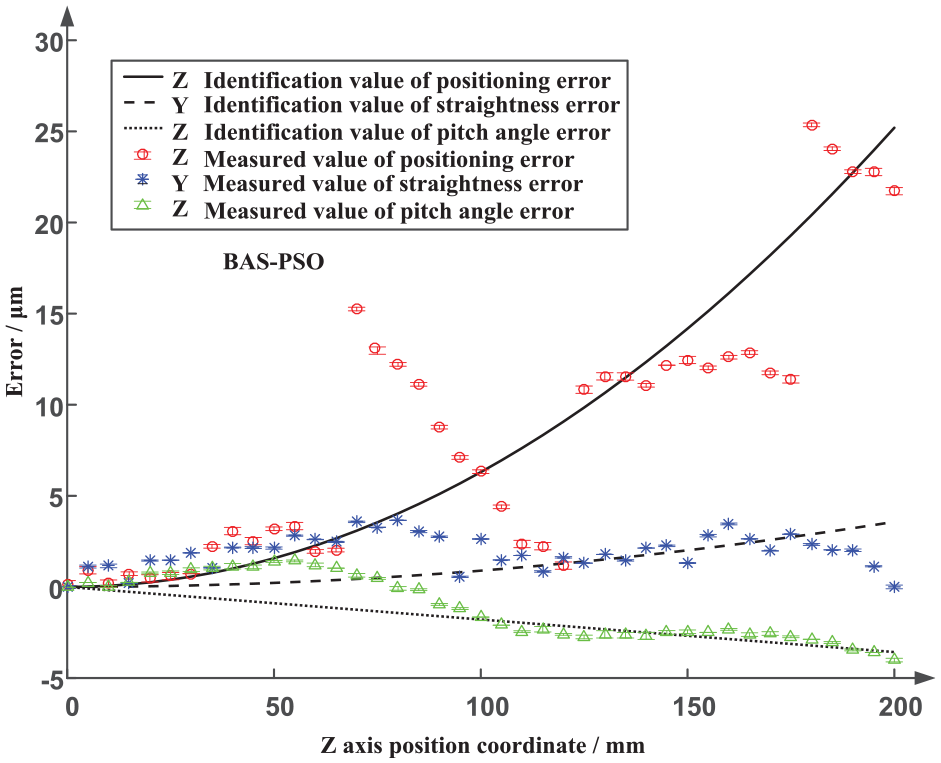
Comparison chart of the geometric errors at different positions on the Z-axis.
The possible reasons for the stepped curve along the axis length and a certain interval in the measurement error of the positioning error in Figure 11 are the long travel of the machine tools’X-axis. Some sections of the screw are not parallel to the guide rail, leading to the occurrence of the above curve error. The positioning error in Figure 12 exhibits an upward wavy shape. The ball screw can be twisted, and the guide rail is extremely tight during a long processing period. If the guide rail or the screw nut pair is tight, or the ball screw is insufficiently strong, the ball screw may twist, and the above curve error may occur. The laser interferometer measures the geometric error of each linear axis ball screw, and the measurement accuracy is high. In Figure 13, the Z position error measured by the laser interferometer is not continuous due to the defects in the machine tool; the error has a large jump and fall. However, the double ball-bar identification method cannot predict the defects of the machine tool, which is a smooth curve. Therefore, the results obtained by the laser interferometer in Figures 11 to 13 fluctuate more severely than those of the double ball-bar.
The change trend of the geometric error value identified by the double ball-bar and the corresponding geometric error value detected by the laser interferometer are the same. Except for the positioning errors of machine tool X and Z axis, the identification error variation range of straightness error of machine tool X, Z direction, positioning error, and straightness error of Y axis is 0–2.7 μm, and the identification error variation range of the three-axis pitch and yaw error is 0–2.4 μm (as shown in Figures 11–13). The above-mentioned identification error is relatively small, which meets the accuracy requirements of machine tool error identification. Due to the problem of the X and Z axis ball screws of the machine tool being measured, the positioning error of the machine tool measured by the laser interferometer has discontinuities and mutation points. However, the identification model established in this study cannot identify the discontinuities and mutation points, resulting in relatively large identification errors, but the identified error is consistent with the actual measurement error change trend. It can identify the continuously changing error and is used for accurately identifying the error of the machine tool with normal function. Therefore, the geometric error identification model of the machine tool based on the double ball-bar established in this study has usability and universality.
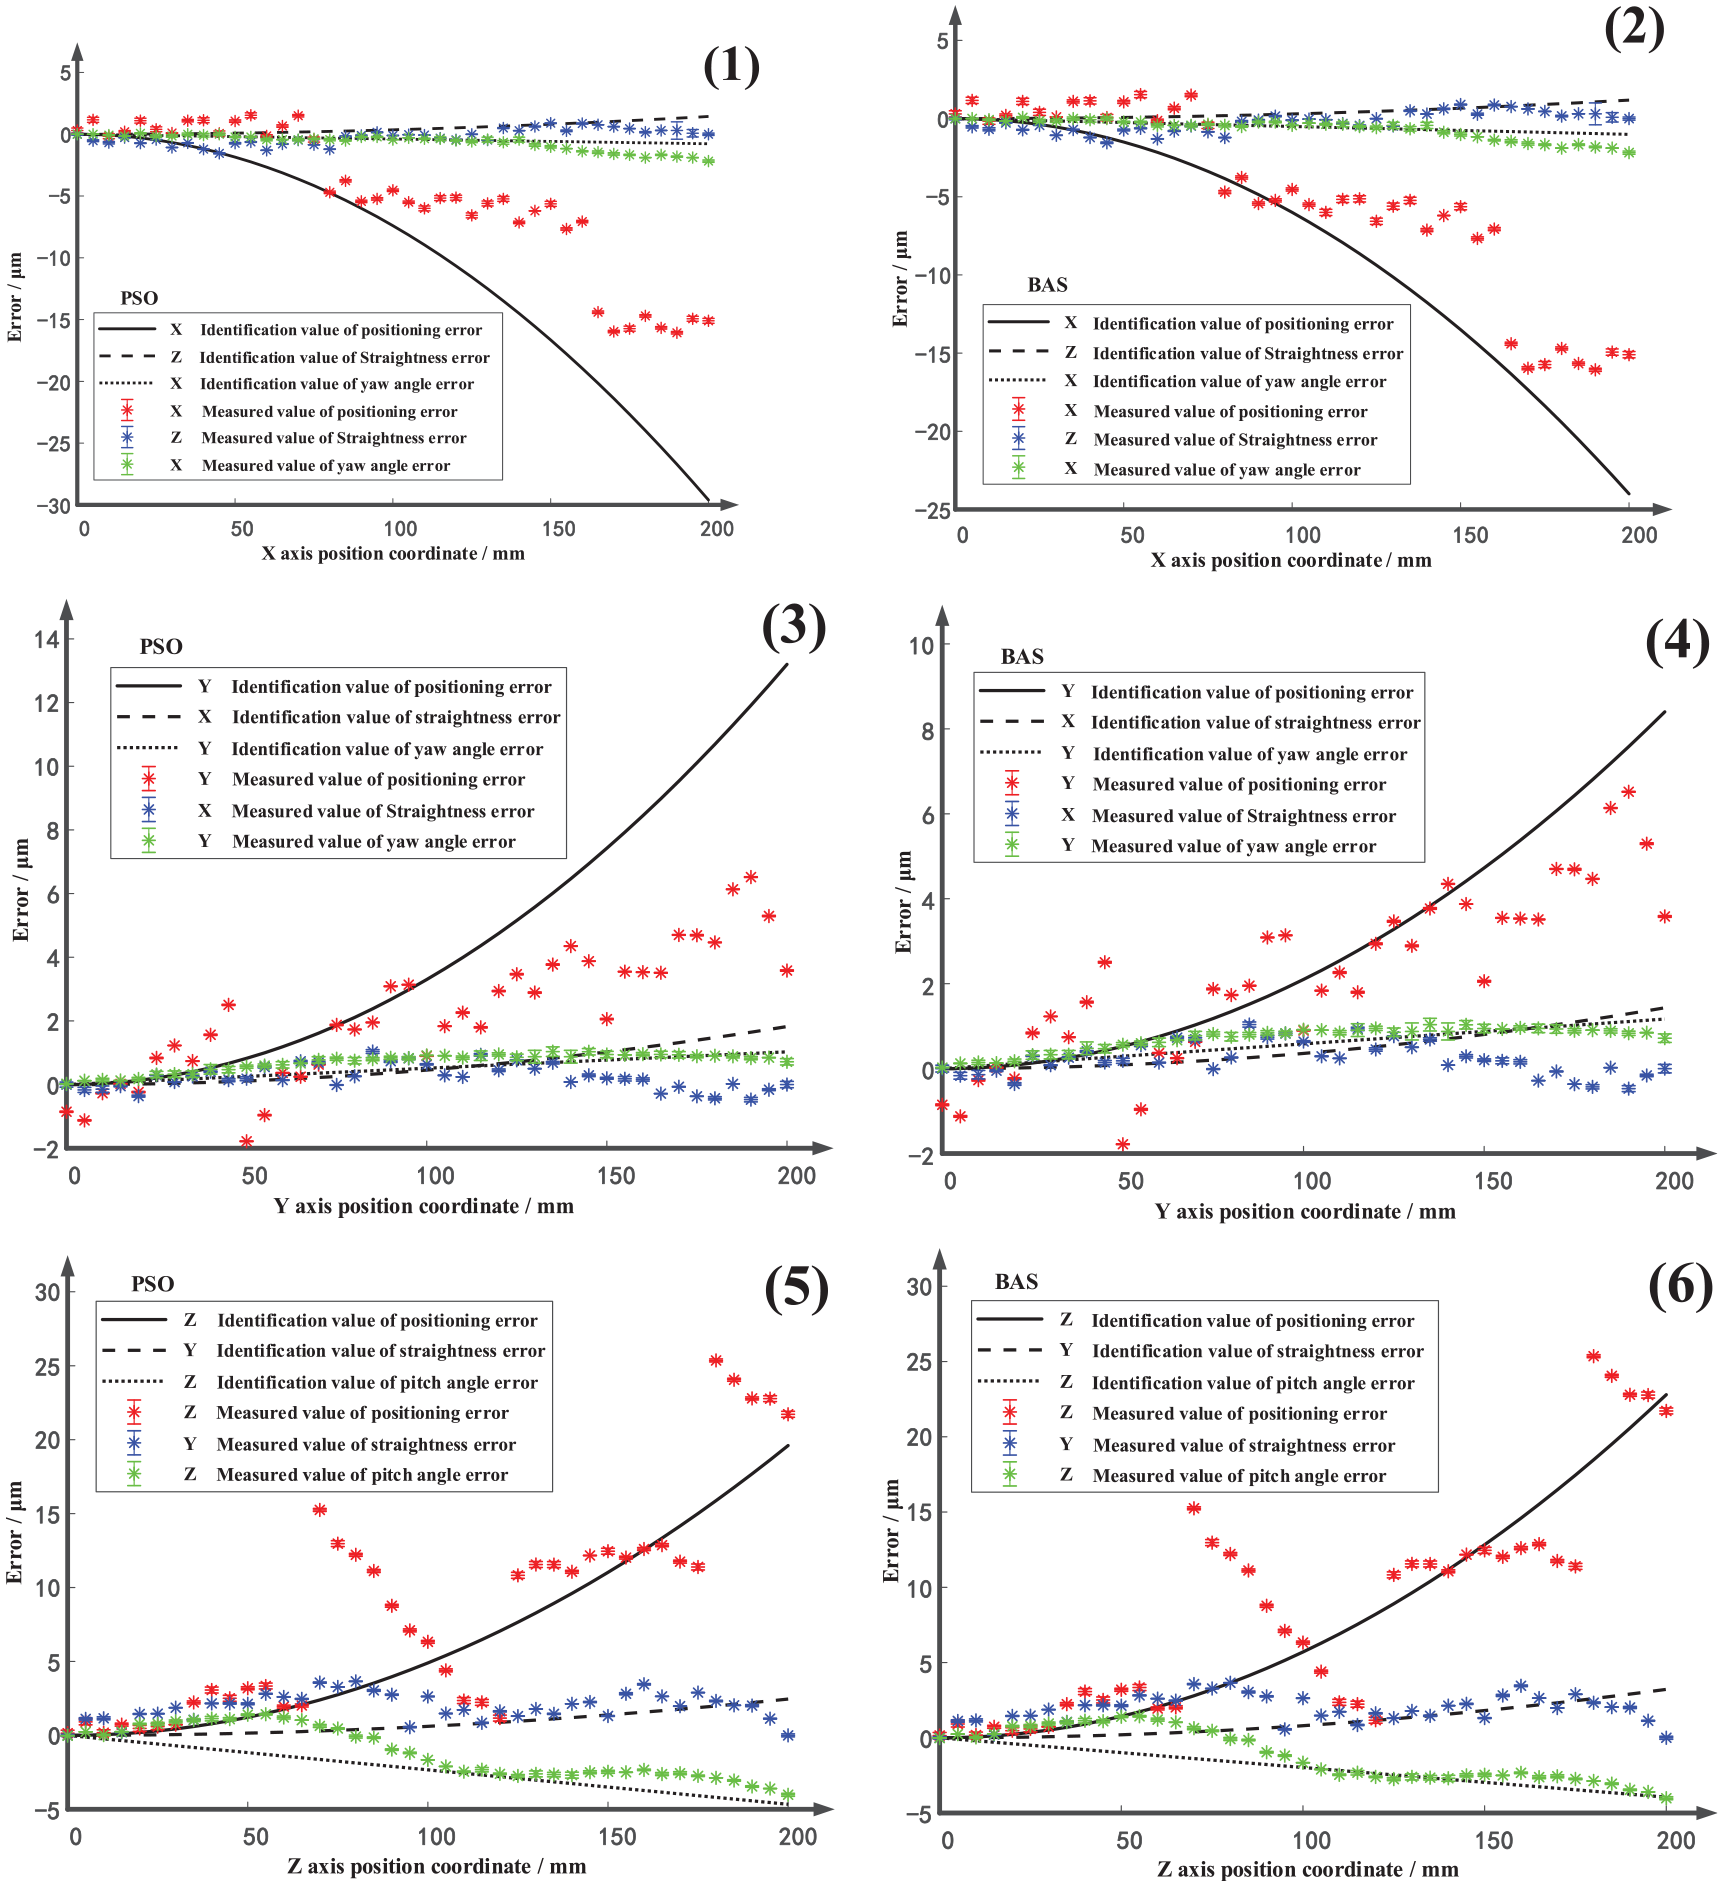
To verify that the BAS-PSO algorithm is more accurate than the others mentioned in this paper, we used the four algorithms to process the same set of data and compared their results with the results obtained by the laser interferometer. During actual error identification of machine tools, GA-PSO and BAS-PSO algorithms are used to solve the geometric error fitting coefficients. The calculated fitting coefficient results do not differ considerably, and the result of the comparison with the graphical method is not notable. Hence, the geometric error comparison chart of the GA-PSO algorithm is no longer shown here. Figure 14 shows the comparison of the geometric errors of PSO and BAS. Figure 14(k) shows the error identification using the PSO algorithm, where k = 1, 3, 5. Figure 14(v) presents the error identification using BAS, where v = 2, 4, 6. As indicated in Table 6, the processing results of the four algorithms were compared with the results of the laser interferometer.
Comparison of the corresponding geometric errors of two algorithms.
Comparison of the experimental results of four algorithms.
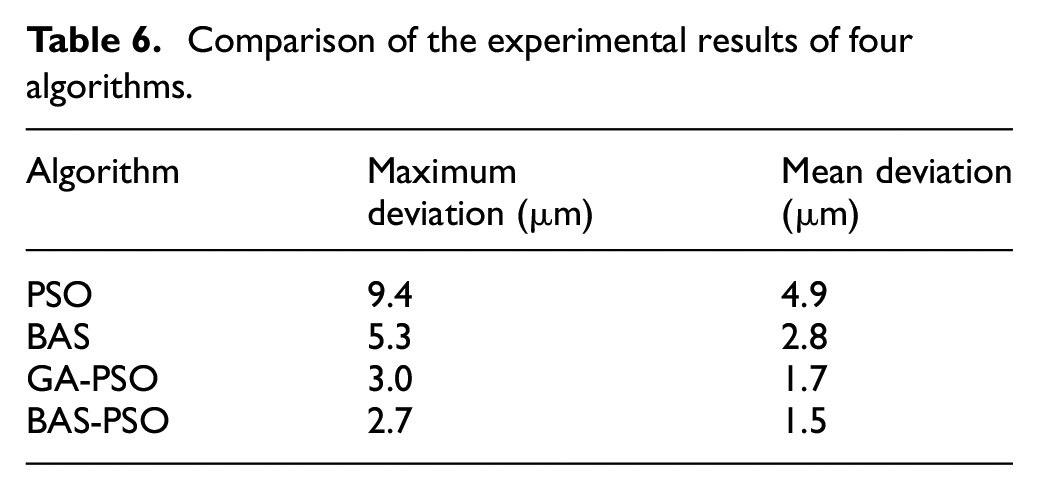
The error range between the identification results and the laser interferometer results is obtained by comparing the maximum deviations of the four algorithms, and the stability of the algorithm identification is measured using the average deviation. The comparison of the experimental results in Table 1 showed that the BAS-PSO algorithm is more accurate than the three other algorithms. BAS-PSO has high identification accuracy and is suitable for identifying the geometric error coefficients of CNC machine tools.
Conclusions
In this study, based on homogeneous transformation matrix, the position-dependent geometric error model for a three-axis vertical machining center is established, and the cubic polynomial function is used to fit the geometric error components. In addition, the identification equations between the error coefficient to be identified and the radial error value measured by the double ball-bar are established.
An error coefficient identification algorithm based on BAS-PSO is proposed, which integrates the antenna search operation of the beetle antennae search algorithm into the speed and position update process of the PSO algorithm to enhance the global search capability. The BAS-PSO algorithm is applied to solve the geometric error fitting coefficients of the CNC machine tools. The comparison of the results of PSO, BAS and the GA-PSO shows that the proposed BAS-PSO algorithm is superior to the other three algorithms in terms of optimization performance.
Twenty-one geometric errors, including the rolling angle errors, are identified using the proposed identification method, which are then compared with the single geometric error results of the three axes detected through laser interferometer. The results indicate that the proposed method has high accuracy, a maximum identification error of 2.7 µm at a low cost, consumes less time, and is easy to operate.
Footnotes
Acknowledgements
We thank Li Li, Zhang Yu, Ma Qun, and Zhang Mengyao for experimental support and Yang HT for fruitful discussions.
Declaration of conflicting interests
The author(s) declared no potential conflicts of interest with respect to the research, authorship, and/or publication of this article.
Funding
The author(s) disclosed receipt of the following financial support for the research, authorship, and/or publication of this article: This work was funded by the National Science Foundation of China (Grant No. 51675004).
Data availability statement
Data available on request from the authors. The data that support the findings of this study are available from the corresponding author upon reasonable request.