
Abstract
The visual guidance of AGV (automated guided vehicle) has gradually become one of the most important perception methods. Aiming at the problem that it is difficult to extract lane line accurately when AGV is running in complex working environment (such as uneven illumination, overexposure, lane line is not obvious, etc.), a scheme of lane line recognition under complex environment is proposed. Firstly, the variable scale image correction is carried out for the uneven illumination area in ROI (region of interest), and the threshold of Canny algorithm is adjusted adaptively according to the luminance of ROI region by Fuzzy-Canny algorithm; Secondly, the edge points matching the lane width feature are extracted by the way of aerial view. Finally, the curve fitting method based on RANSAC (Random Sample Consensus) is used to fit a curve with the lowest error rate and then get the lane center curve. The experimental results show that the processing algorithm used in this paper is feasible and effective, has strong robustness and fast computing performance, and can meet the requirements of intelligent AGV in various complex environments.
Keywords
Introduction
With the in-depth development of “made in China 2025”strategy, the whole manufacturing industry is urgently thinking about how to improve the degree of automation and intelligence of enterprises, and quickly keep up with the pace of Intelligent Manufacturing in the world. 1 Compared with high-speed manned automatic driving vehicles, AGV are the starting direction that can truly conceptualize and achieve large-scale commercialization under specific circumstances (such as high temperature, long-term continuous work), which can improve efficiency and reduce labor costs. AGV can also be used as the test target vehicle of high-speed driverless vehicle algorithm, which can provide a transition for high-speed driverless vehicle. 2 Taking into account the “COVID-19” recently occurring in various countries, AGV can give full play the advantages of unattended distribution in serious infectious diseases, such as transport medical supplies, food and other items to the destination, as well as the cleaning and disinfection of the streets, so as to avoid the risk of virus transmission caused by human contact. Therefore, it is necessary to carry out in-depth research on AGV.
One of the most significant differences between AGV and high-speed driverless vehicle is that AGV is tracking rather than autonomous navigation. At present, there are four kinds of AGV guidance modes: electromagnetic induction guidance, inertial guidance, magnetic navigation and visual guidance.3,4 In the electromagnetic induction mode, due to the conductor is buried in the ground, once the path is determined, it is difficult to adjust and change; Due to the limited accuracy of gyroscope, the positioning error will accumulate with the increase of the distance; The cost of design, construction and maintenance of magnetic guidance is much higher than other methods; Visual guidance has high flexibility, while it is urgent to solve the problem of image processing when the lane line is not obvious enough or the vision is disturbed. At the same time, the efficiency of real-time computing is also urgent to solve. At present, many scholars have carried out many researches on visual guidance. According to Garibotto, the frame capture gain and offset parameters in image processing must be adjusted according to different contrast conditions, so the adaptability and robustness of visual perception system to the changes of external environment should be improved. 5 J. ARRÓSPIDE proposes a visual tracking method based on Markov chain Monte Carlo (MCMC) particle filter. Compared with particle filter or Kalman filter, the tracking failure rate is lower, but it can’t deal with the problems such as the change of light rays and the incomplete identification lines; 6 Xing and sun et al. Proposed a light adaptive image segmentation method based on relax constraint support vector machine (SVM) classifier and kernel function to distinguish the original color features and light artifacts of road image, and achieved good results. However, this study did not focus on the situation that the color of the sign belt is close to the ground, nor did it consider the possible disordered lines on the ground Interference; 7 The team also carried out specific research on path recognition, and proposed an intelligent path recognition method based on KPCA-BPNN and IPSO-BTGWP to resist the interference of complex workspace, while the algorithm is complex and difficult to be directly applied to AGV; 8 Ning proposed a new method based on the symmetry of 3D lidar wheel point cloud to estimate the vehicle position and attitude, which solved the problem of limited body attitude information caused by the low installation position of AGV sensor; 9 Yang Yanyu corrects the single visual perception by building the GPS curve model of preview model and target track based on the GPS data, and completes the independent tracking. However, this method needs to manually make the vehicle complete the data collection according to the expected track before the vehicle completely runs autonomously, which is not widely applicable. 10 Generally speaking, there are many methods for lane line recognition at present, but only a few researches apply lane line width features to lane line recognition and extraction algorithms. Most researches take some complex and time-consuming algorithms to extract lane lines, while give up the most characteristic information. And in the complex environment, the edge extraction algorithm still needs to be improved and optimized. How to extract useful edge points in the complex and changeable environment and reduce the interference points as much as possible has become a key problem.
The extraction of lane line under complex illumination is a quite challenging problem, and image correction is the key to deal with this problem. The illumination component is usually low frequency, which can be extracted by Gaussian Filtering, while the edge preserving ability of Gaussian Filtering is quite poor. In addition, some scholars have adopted Bilateral Filtering algorithm to extract light components, but this method takes too long to be applied in practice. Scholar Kaiming proposed a Guided Filtering algorithm, the time complexity is only O(n), n is the total number of image pixels, independent of the filtering radius, which greatly improves the operation speed. Guided Filtering algorithm uses the local linear relationship between the guided image and the filtered output image (to ensure that the output image retains the local texture features of the guided image), and the calculated output image and the original image are calculated by the least square operation to make the edge of the output image as close as possible to the original image. If the original image is selected as the guiding image, the illumination extraction of the original image can be realized on the basis of preserving the local features of the original image. After illumination extraction, it is still necessary to design a reasonable image enhancement function to make the dark area brighter and the bright highlight area darker, so as to restore the whole picture to the state of near normal uniform light.
Lane line recognition technology is mainly divided into three parts: image edge extraction, lane line extraction and curve fitting. At present, the widely used edge extraction techniques include Sobel operator, Prewitt operator, Roberts operator and Canny operator. Among them, the first three algorithms have the advantages of simple implementation and fast operation, while they are vulnerable to noise and have poor edge positioning accuracy, which has certain limitations. 11 Canny algorithm is extended on the basis of the original first-order differential operator, adding two improvements: non maximum suppression and double threshold. Using non maximum suppression can not only effectively suppress the multi response edge, but also improve the positioning accuracy of the edge.12–14 Using double threshold can effectively reduce the rate of edge missing detection. Therefore, Canny algorithm has been applied and optimized by scholars in recent years, among which Canny algorithm based on Otsu adaptive threshold is the most widely used, and the problem that the threshold of traditional Canny algorithm is difficult to determine is solved by using the method of maximum variance between classes.15,16 However, because the image has the characteristics of large illumination variation and uneven variation range for the lane line as the research object, and also needs to consider the real-time problem, so the edge extraction method still needs to be improved. Lane line extraction is mainly to extract the edge points on the lane line and get rid of the influence of interference points on the subsequent processing. The research in this part is less than image edge extraction, and most scholars ignore the useful information that lane width is standardized, which leads to the algorithm design is too complex. The most widely used curve fitting methods are Hough transform, least square method and Random Sample Consensus (RANSAC). The characteristics of Hough transform algorithm lead to its high time and space complexity, and in the process of detection, it can only determine the direction of the line and lose the length information of the line segment, so it is not suitable for lane line detection directly.17,18 The least square method is only suitable for the data with less noise, but in many cases, some points which deviate from the curve obviously need to be discarded, so it is not suitable for lane line fitting. RANSAC curve fitting method is an improvement of the least square method. Through random sampling and increasing a certain number of iterations, the interference of noise points on the results is reduced. Therefore, it is more suitable to fit the lane line algorithm.19,20
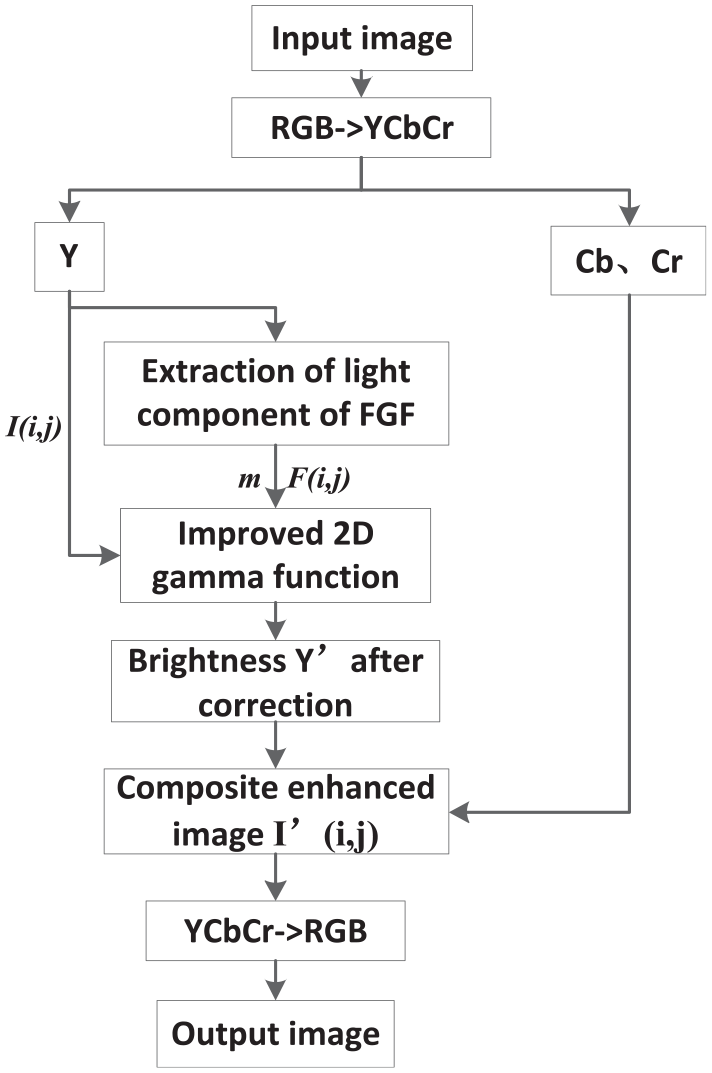
According to the above analysis, the main framework of the algorithm used in this paper is shown in the Figure 1:
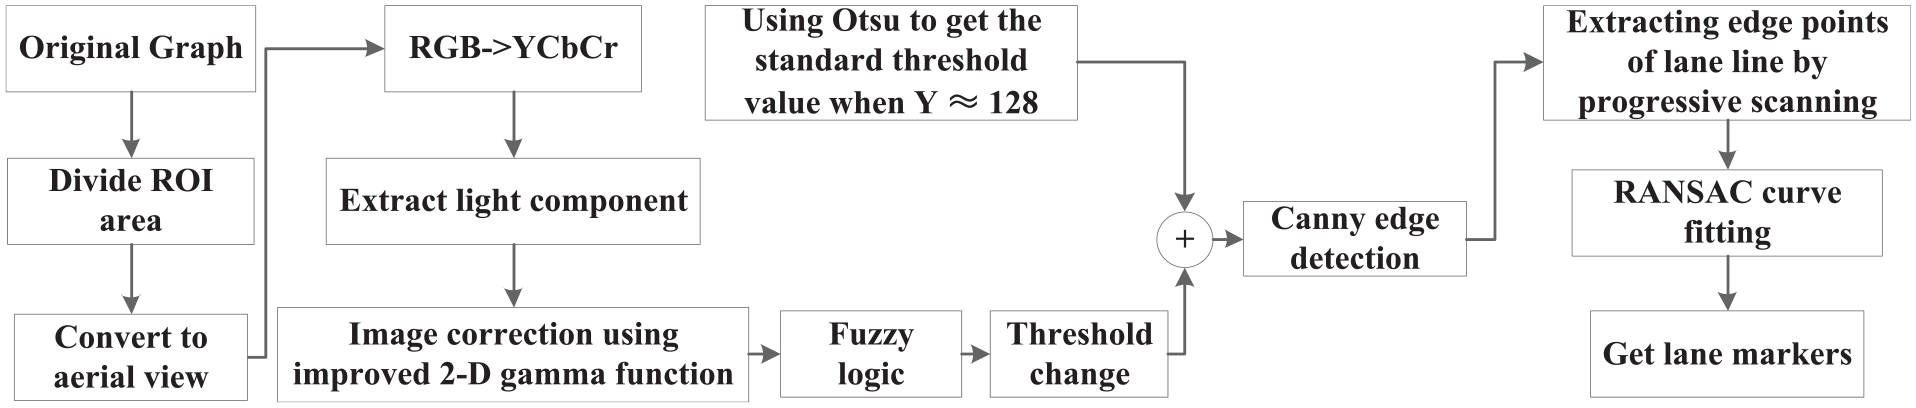
Algorithm framework.
The first section introduces the research background, the shortcomings of the existing technology and the overall framework of this paper; The second section introduces the image correction algorithm to deal with the image with uneven illumination; The third section introduces the Fuzzy-Canny edge extraction algorithm designed in this paper. After introducing the Canny algorithm of adaptive threshold based on Otsu, the threshold is adjusted by fuzzy logic according to the luminance of ROI area to improve the effect of edge detection; The fourth part introduces the algorithm based on lane width feature. Firstly, ROI area is transformed into bird’s-eye view, and edge points that meet the characteristics of lane line width are obtained according to scan line by line in the bird’s-eye view. Then, the curve fitting method based on RANSAC is used to fit a curve with the lowest error rate and get the center curve of lane line; The fifth part shows the final recognition results in different special cases, which Indicates that a series of algorithms used in this paper meet the requirements; The sixth part is the summary and prospect of the whole paper.
The main contributions of this paper include:
An image correction algorithm based on fast guided filtering (FGF) and variable scale 2-D gamma function is proposed for the case of uneven illumination in ROI region, which makes the processed image close to the image that under uniform illumination.
In this paper, a Fuzzy-Canny algorithm is designed, which takes the threshold value of the image under normal illumination as the benchmark, adjusts the high threshold value according to the brightness according to the fuzzy logic, and completes the adaptive adjustment of the threshold value under different illumination intensity on the premise of real-time.
Using lane width feature to filter the edge scattered points after preliminary extraction, then extract the edge points that meet the lane width feature, and then use RANSAC curve fitting to complete the fitting of lane center line, which has been verified in a variety of complex conditions.
Adaptive image correction based on two-dimensional gamma function
Inspired by Retinex algorithm, this paper proposes an enhanced correction algorithm based on Fast Guided filter (FGF) and improved two-dimensional gamma function.21,22 Firstly, the FGF is used to extract the illumination component in the image instead of the usual Gaussian function, and then a 2-D gamma function with variable parameters is constructed. According to the brightness of the image, the bottom number α of the index in the 2-D gamma function is adjusted in real time, in order to adjust the over bright and over dark areas more reasonably, and finally realize the adaptive enhancement of the image in the uneven illumination area.
Fast guided filtering
Guided filter is a kind of adaptive weight filter, which can smooth the image and keep the boundary at the same time. Due to its fine visual quality, fast speed and easy implementation, pilot filter has been widely used in practical products. 23 Although it is popular and has a variety of third-party applications, scholars such as He note that a simple but significant acceleration has not been utilized. 24 In this method, the filtering input image and the guidance image are sub sampled to calculate the local linear coefficients, and the up sampling of these coefficients is carried out. The upper sampling coefficient is used to generate the output on the original guidance image. This method reduces the time complexity of subsampling ratio s from O(n) to O(n2), and the actual acceleration is *10. Compared with other filtering methods, FGF can retain the edge details and local features better, and also has a very high speed of operation, so this paper uses FGF instead of Gaussian Filtering or Bilateral Filtering to extract the illumination components of the image.
As a linear filter, guided filter can be simply defined as follows:

where I is the guided image, q is the input image to be filtered, q is the filtered output image, and i is the index of the pixel, ωk refers to a filtering window in which the output image q is the linear transformation from the guiding image I, which is determined by ak and bk. K is the index of the local square window ω, and the radius is r. In order to filter the original image, on the basis of satisfying the above local linearity, it is necessary to make the output image approach the original image as much as possible, and adopt the least square method to minimize the reconstruction error between the output image and the original image:
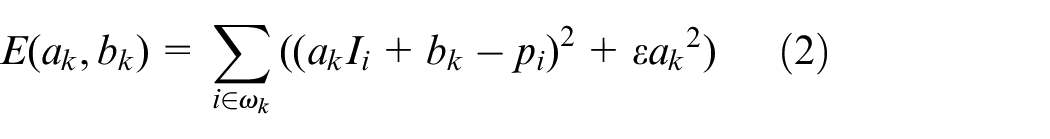
The penalty value ε is the regularization parameter introduced to prevent ak from excessive. The solution of equation (2) can be given by linear regression:
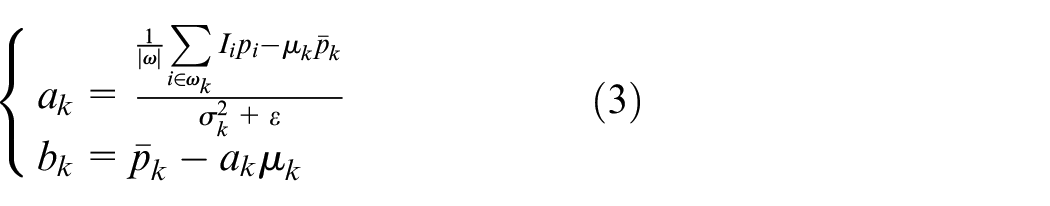
where |ω| is the number of pixels in the window, μ,
After finding ak and bk, the output image can be obtained according to the previous local linear model. However, since the same pixel will be included in many different filtering windows, ak and bk in each window are different, so it is necessary to take the average value of ak and bk for recalculation.
According to formula 3, it can be seen that the molecule of ak is actually the covariance of I and P. If the original image is used as a guide image, the molecule becomes
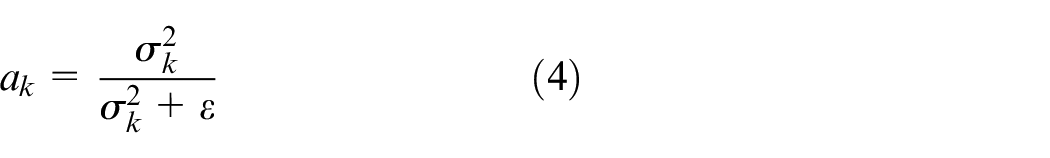
when the original image is rich in information (including edges), the variance will be correspondingly large. According to the above formula, ak will naturally be large, and the gradient information of the original image will be retained. In the flat area of the original image, ak will be smaller and bk will be larger. When ak is reduced to 0, bk will be uk, which is equivalent to mean filtering, with the strongest smoothing effect. On this basis, we use image pyramid to accelerate the calculation. First, the sub sampling is used for output, and then the upper sampling is used to output the final image. The main steps are as follows:
Conduct 1/s sub-sampling of the guide image I and the input image P to obtain I' and P' :
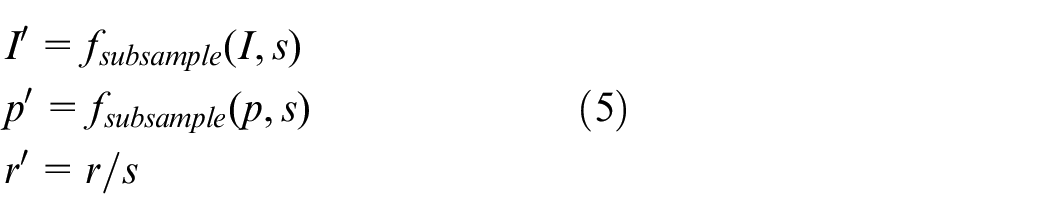
Preliminary calculation of coefficients a and b using I′ and P':
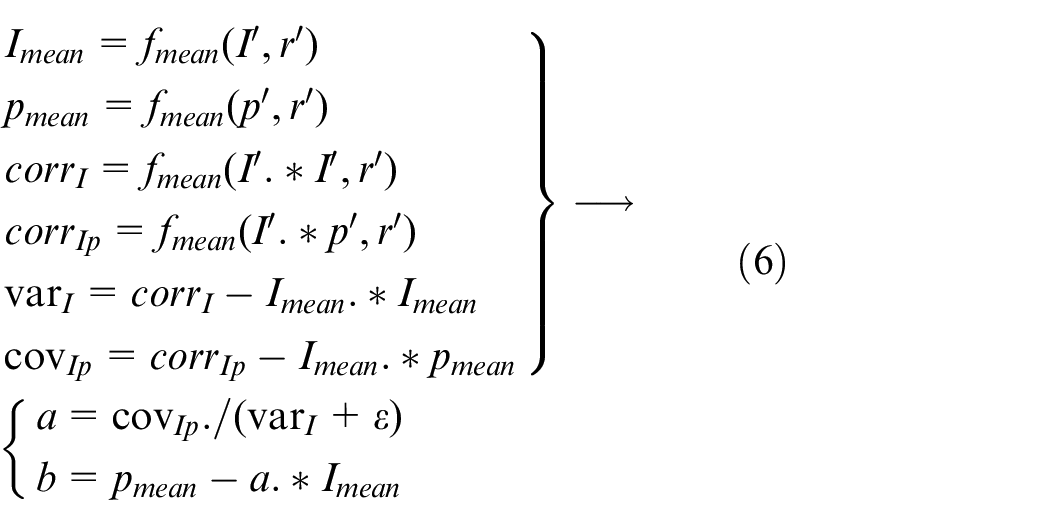
Among them, corr stands for correlation coefficient, var stands for variance, and cov stands for covariance.
Upsample a and b by a ratio s, and calculate to get the final output image Q:
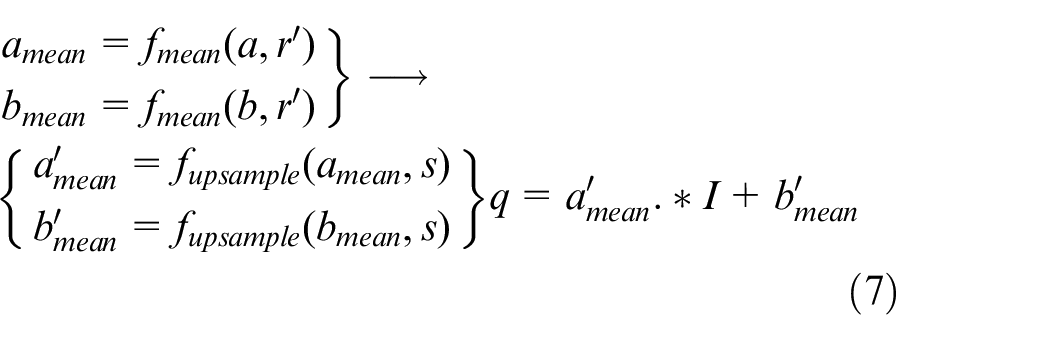
Due to the calculation part is the image of downsampling, the amount of calculation will be greatly reduced without introducing obvious distortion, so it becomes a fast guide image filter.
Improved two-dimensional gamma function
There are many scholars using 2-D gamma function to carry out adaptive image correction at present, while this paper has made some improvements and extensions to improve the adaptability and rationality of the algorithm. In general, gamma correction has the following standard forms:
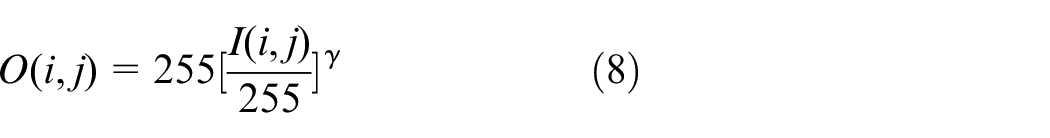
Among them, I(i, j) is the input image (original image), O(i, j) is the output image, and γ is the control parameter. When γ is greater than 1, the image becomes dark as a whole, when γ is less than 1 and greater than 0, the image becomes bright as a whole, and when γ is less than 0, the algorithm has no meaning. At present,
In this paper, some adjustments have been made to the traditional 2-D gamma function in order to establish a relationship with the gray value distribution characteristics of the image to be processed, as shown in the following formula:

where m is the mean value of brightness in the light component F(i, j), using m instead of the fixed value 128 can more reasonably represent the mean value of the current light component rather than the absolute mean value in the theoretical sense; Another change is to use variable scale α instead of fixed base number 2. The calculation of α is derived from the following.
Take the expected value of the improved gamma function formula, which should be equal to 128 in theory, and the formula after derivation is as follows:
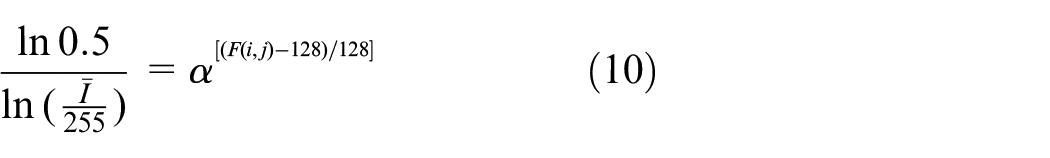
At this time, there are two extreme cases, the light component F(i, j) is all black or all white, so two values of α can be obtained:
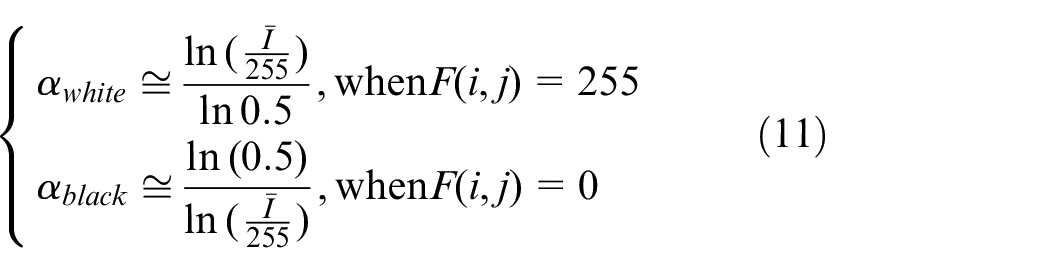
The two equations are represented by curves as shown in the Figure 2. Considering that the actual collected image will not have gray value greater than 220 or less than 30, 25–225 is selected as the interval of independent variable
α value curve.
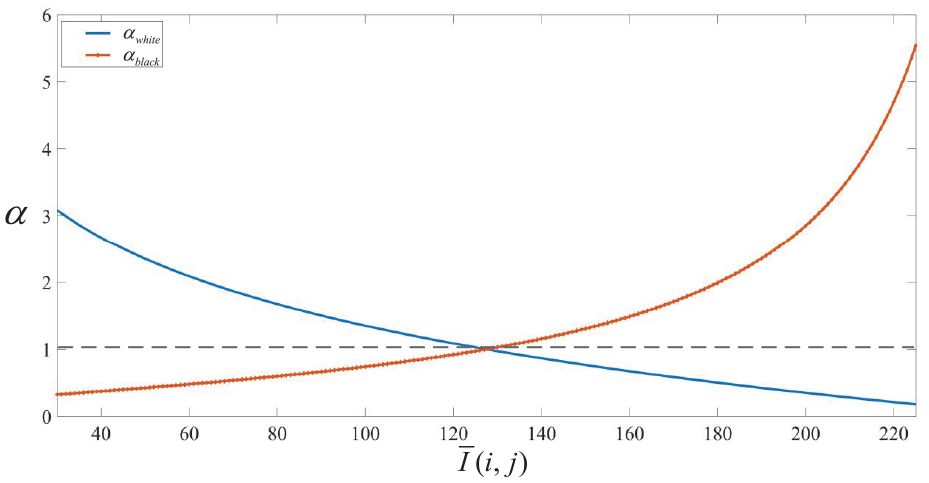
In this paper, the image correction algorithm flow for uneven illumination image is shown as Figure 3:
Flow chart of image correction processing.
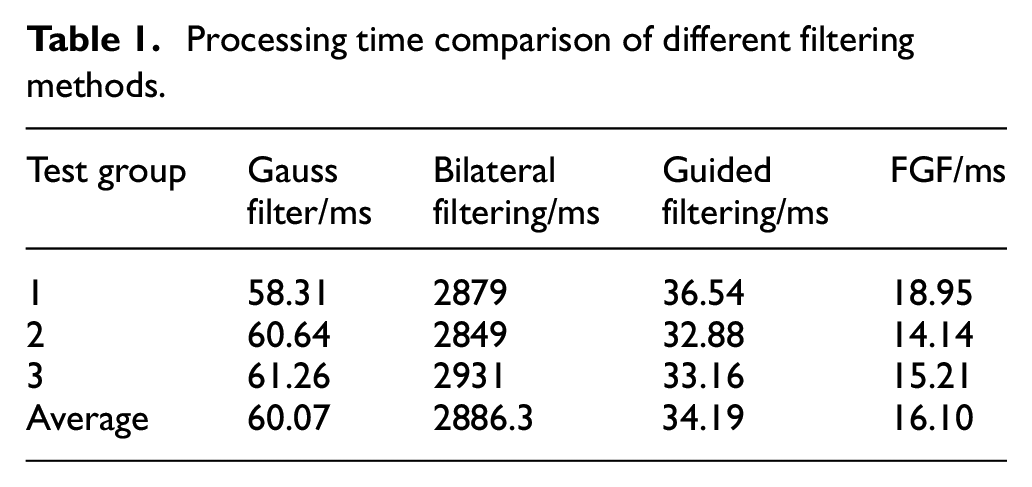
Because brightness V in HSV model is still related to color, and Y in YCbCr space is completely independent of color, brightness Y in YCbCr space is selected for adjustment. The comparison between the image processed by the algorithm designed in this paper and the traditional 2-D gamma algorithm using FGF is shown in the following Figure, and the processing time pairs with Gaussian Filtering, Guided Filtering and Bilateral Filtering 25 are shown in Table 1.
Processing time comparison of different filtering methods.
In the Figure 4, the α value calculated by the design method in this paper is 2.41, and the α value calculated by the design method in this paper in the following figure is 4.34. As a contrast, three α values are manually used to represent the processing results of the traditional two-dimensional gamma function (3, 2 and 1.67, respectively). Using traditional gamma function for image enhancement and correction requires manual setting of α value, which is quite different for different images. It is difficult to use the same set of α values to make the image get the best processing and make the lane line more obvious. It should be noted that although the use of this algorithm in the following figure causes a large distortion to the color of the shadow part, considering that the purpose is to better extract the lane line rather than image restoration, so as long as the lane line is clear and obvious under all kinds of uneven light conditions, and has a high degree of discrimination, it can be regarded as achieving the purpose.
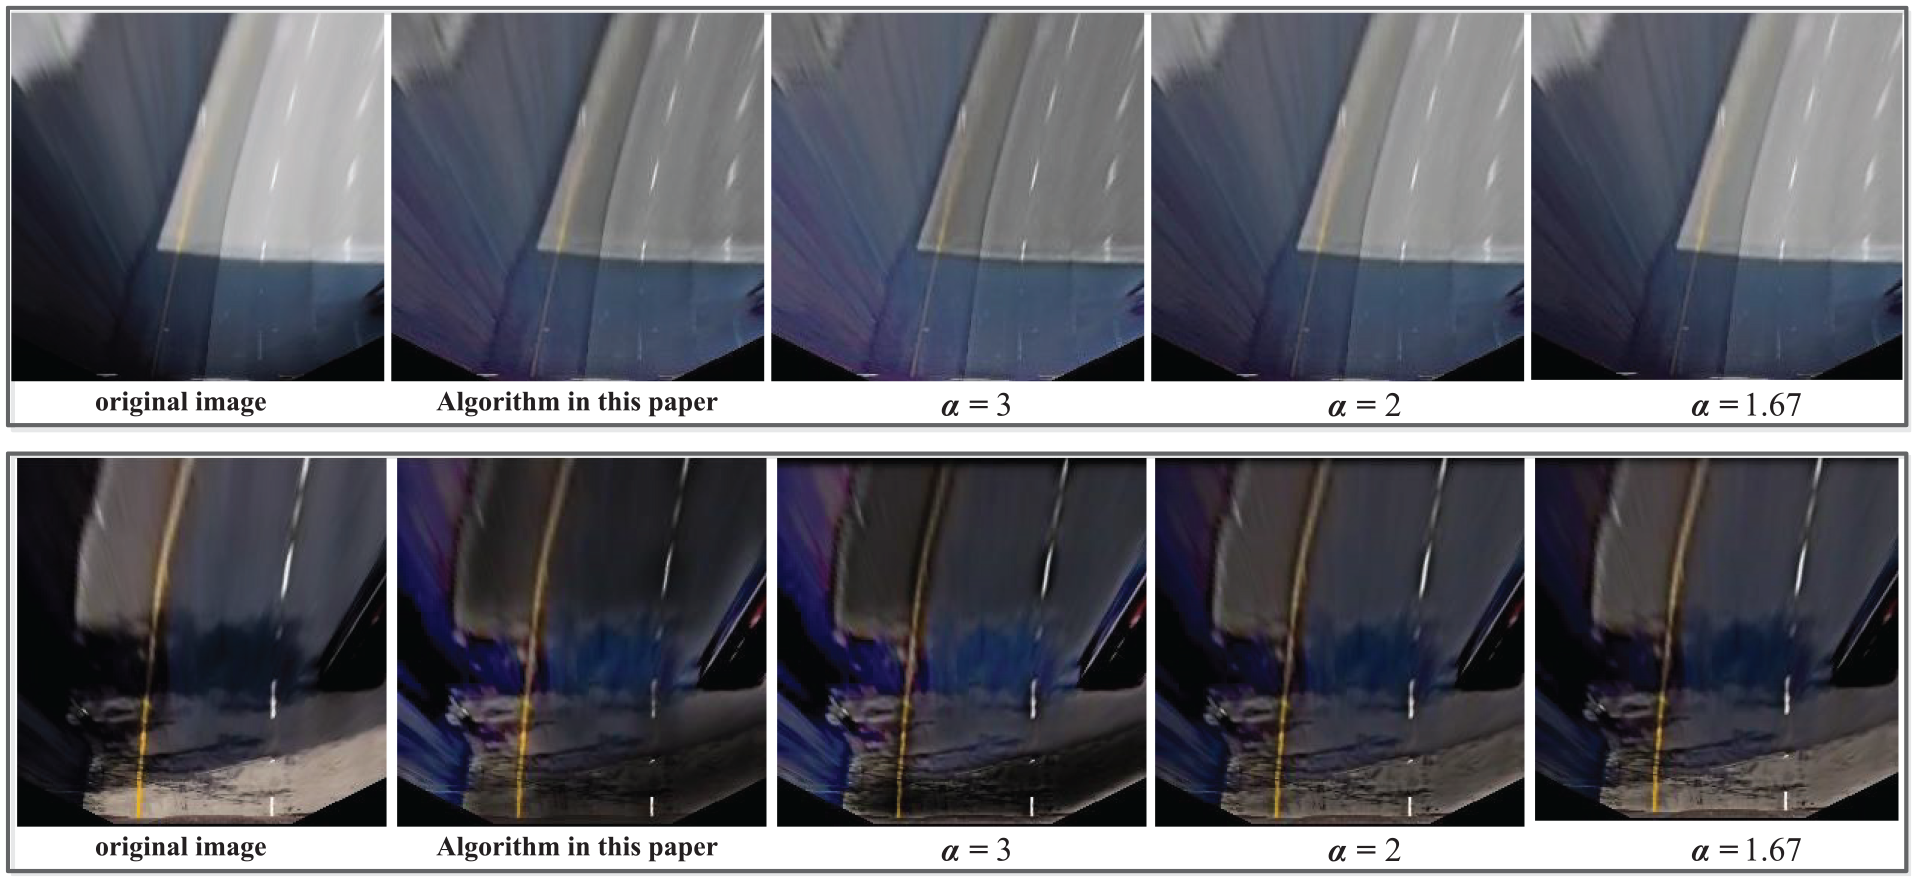
Image correction processing effect comparison.
The Gauss Filter, Bilateral Filter, Guide Filter and Fast Guide Filter are tested three times in total. The average value of each test is recorded and the final average value is taken. It can be seen that FGF always keeps the fastest operation speed, which is useful for engineering applications.
Fuzzy-Canny edge extraction algorithm
Traditional Canny algorithm
Canny algorithm has three strict edge detection criteria: Signal to Noise Ratio (SNR), location accuracy and single edge response. On the basis of the above indexes and criteria, the canny edge detector is the best approximation operator of the product of SNR and location, and the expression is approximate to the first derivative of Gaussian function. By combining the three criteria of Canny edge detection, the optimal detection operator can be obtained. Canny edge detection algorithm mainly includes the following four steps:
Using Gaussian filter to smooth image:
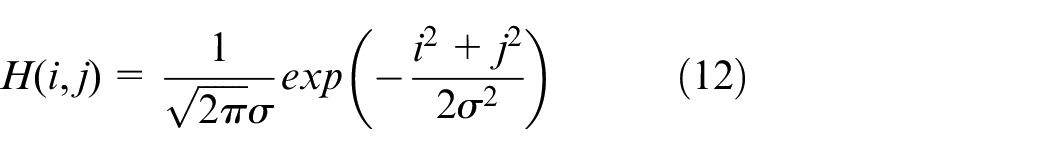

i and j represents the coordinates of the pixel point, and f(i, j) represents the value of the point in the original image.
The gradient amplitude and direction of each point in the smoothed image are calculated by the first-order partial derivative finite difference method and recorded in the gradient amplitude map and gradient direction map. The first-order partial derivative of 2*2 neighborhood is used to calculate the i, j direction partial derivative of the smoothed image G(i, j) according to the following formula.
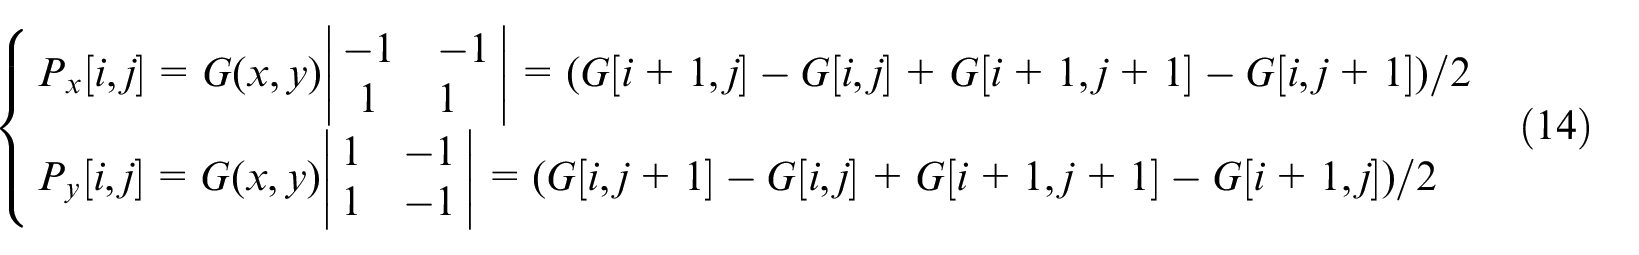
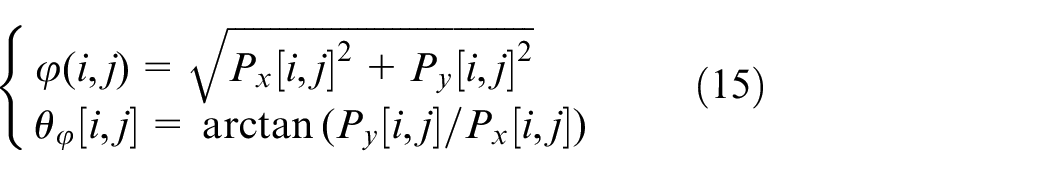
Calculate the amplitude and direction according to the following formula after finding out the deviation of x and y directions:
The gradient amplitude is suppressed by non maximum value. Only getting global gradient is not enough to determine the edge. In order to determine the edge, the point with the largest local gradient must be kept, while suppressing non maximum value is to set the non local maximum value point to zero to get the refined edge, and finally a series of candidate edge points are obtained.
Double threshold algorithm is used to detect and connect edges. Two thresholds TL and TH (TL < TH) are used to further process a series of candidate edge points obtained in the previous step. The points whose gradient value is greater than the TH are retained as edge points, the points whose gradient value is lower than the TL are eliminated, and the points whose gradient value is between the two thresholds and adjacent to edge points are retained. Finally, it is determined whether there are edge pixels larger than the high threshold in the eight directions of the reserved points, and the qualified pixels will be reserved. In short, the high threshold is used to find the edge scatter points on each line segment, while the low threshold is extended in two directions of these lines to find the edge fracture and connect these edges.
Adaptive threshold calculation based on Otsu
According to the above Canny algorithm, it can be clear that the selection of high and low thresholds is very important for the final lane edge extraction. At present, Otsu algorithm is widely used to determine the threshold automatically. 18 The basic idea is to divide image pixels into background and target, and get the optimal threshold by searching and calculating the maximum variance between classes.23,24,26 The best threshold should be the best separation between the two classes, and the best judgment of the separation between classes is based on the maximum of the variance between classes or the minimum of the variance within classes in the sense of mathematical statistics. 26 Therefore, in the selection of threshold value of traditional Canny algorithm, Otsu algorithm can be combined with gradient amplitude to get the high and low thresholds in Canny algorithm.27,28
If the total number of pixels in the image with gray level i is ni and the range of gray level is [0, L-1], then the total number of pixels is:
The size of L depends on the actual gray value range of the image.
The probability of each gray value is:
and Pi satisfies the following characteristics:
The pixels in the image are divided into two categories C0 and C1 by threshold. The background category C0 is composed of pixels with gray value [0, T-1], and the target category C1 is composed of pixels with gray value [T, L-1]. Then the probability of areas C0 and C1 are:
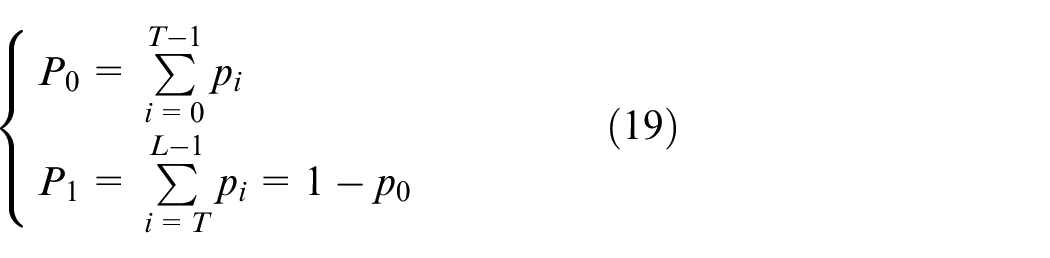
The average gray levels of background class C0 and target Class C1 are respectively:
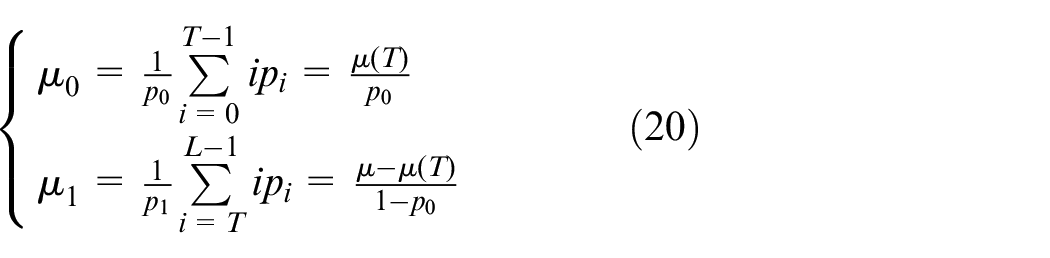
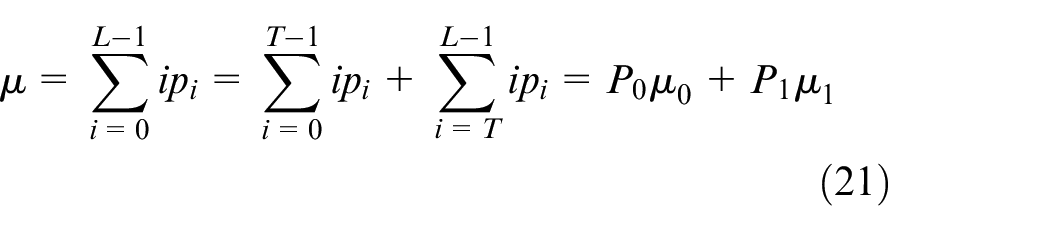
where μ is the average gray level of the whole image:
The total variance of background area and target area is:

Adaptive threshold method considering luminance
Although the above algorithm has been widely used, there are two main disadvantages when it is directly applied to the lane recognition of AGV, one is that this method can not deal with the complex environment such as uneven light; the other is that the traditional Otsu method to determine canny high and low threshold takes a long time, which is difficult to meet the real-time requirements of vehicles. To solve this problem, a Fuzzy-Canny algorithm considering luminance is adopted to adjust the threshold.
The luminance component Y can not only represent the luminance difference between two regions in the same image, but also maximize the luminance difference between different images compared with the chrominance component. Moreover, since the illumination inequality (such as the shade of trees, highlights, etc.) in ROI region has been greatly improved after image correction, Y has little change in the same image, so the average brightness value Y is used as the differentiation index of different images. At the same time, considering that the high threshold TH can distinguish the contour object from the background, this paper uses fuzzy logic algorithm to adaptively adjust the high threshold TH with the luminance Y of ROI area as the input, so that the high threshold is more suitable for lane line detection and more useful information can be extracted. The basic value of TH is determined by Otsu method described in Section 2.2 when the image Y value is 128, while the value of low threshold TL is determined by 0.4*TH.
After local image processing, the average value of Y in ROI area is taken as fuzzy input and Δ TH is taken as output. In this paper, when designing membership function of fuzzy control, Y is reduced by 51 times, which is mapped to the range of 0–5. After repeated experiments, it is determined that the change value of ΔTH is within |0.02| advisable, the parameters Y and ΔTH are transformed into the fuzzy sets of [0,5] and [−0.02,0.02] respectively. The fuzzy language variables corresponding to Y and ΔTH are shown in Figure 5: Y = {DB DM DS ZO LS LM LB}, ΔTH = {DB DM DS ZO LS LM LB}. Among them, DB, DM, DS, ZO, LS, LM and LB represent rather dark, dark, slightly dark, normal, slightly bright, bright and rather bright respectively. If the value of Y is close to 255, it means that the illumination in ROI area is strong. At this time, the high threshold TH should be increased to reduce the possibility of small particles being misjudged as edge points; If the value of Y is close to 0, it means that the illumination in ROI area is weak. In order to detect the edge of lane line, the high threshold TH should be reduced. The size of Y also needs to be considered to prevent excessive changes in high thresholds from counterproductive. After repeated experiments, it is appropriate to determine the change amount ΔTH within ±0.02. From the above analysis, the fuzzy rules and membership function of fuzzy system can be obtained:
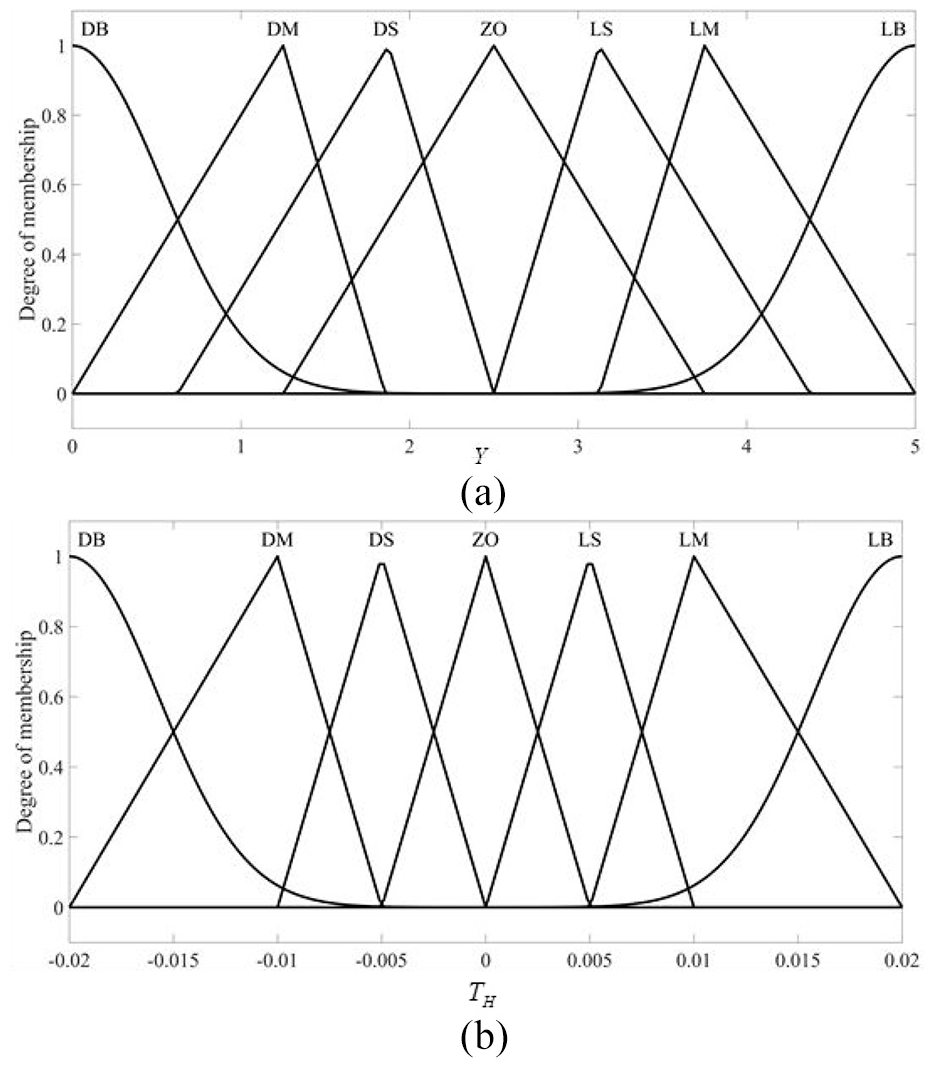
(a) Membership function of Y (b) Membership function of high threshold variation ΔTH.
In the design of fuzzy controller, the design of fuzzy rules determines the important part of its performance. In this paper, seven fuzzy rules are given for ΔTH, as follows:
R1: IF Y is PB THEN ΔTH is DB;
R2: IF Y is PM THEN ΔTH is DM;
R3: IF Y is PS THEN ΔTH is DS;
R4: IF Y is ZO THEN ΔTH is ZO;
R5: IF Y is NS THEN ΔTH is LS;
R6: IF Y is NM THEN ΔTH is LM;
R7: IF Y is NB THEN ΔTH is LB.
Analysis and verification of algorithm detection effect
Considering the high real-time requirement of vehicles, in order to improve the processing efficiency, this paper only deals with the ROI region of the image in the experiment. For this camera, the original image pixel is 720 * 1280, while only the lower part of the image is selected as ROI area to be processed by this algorithm, which can be obtained from the geometric relationship of projection:28,29
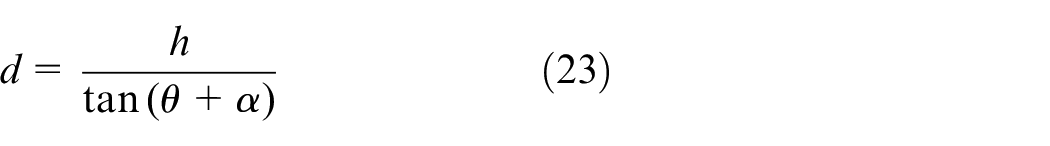

where h is the installation height of the camera, θ is the inclination angle of the camera, α is the angle between the camera scanning point and its optical axis, d is the transverse distance from the farthest scanning point to the camera, (xc, yc) is the projection point of the optical center of the camera on the imaging plane, f is the focal length of the camera, yi is the ordinate of the projection point of the camera scanning point on the imaging plane, dx is the size of one pixel in the image pixel coordinate system in the image physical coordinate system.
Assuming that the longitudinal target distance of lane line detection is D, according to formula (23) and formula (24), the vertical coordinates of the upper boundary yup and the lower boundary ydown of ROI in the image are respectively:
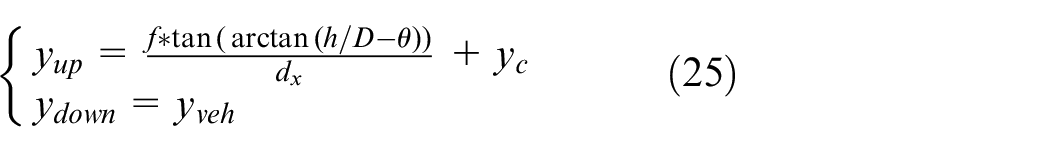
In the formula, yveh is the vertical coordinate of the vehicle hood in the image, which is the fixed value after the camera is installed, and can be adjusted according to the actual situation.
Considering the motion speed of the AGV, the region in the lower half of the image (the ordinate pixel is 450-710) is selected as the ROI region to be processed with this algorithm after calculation. The edge detection effect comparison between the shadow region and the highlight region is shown in Figure 6.
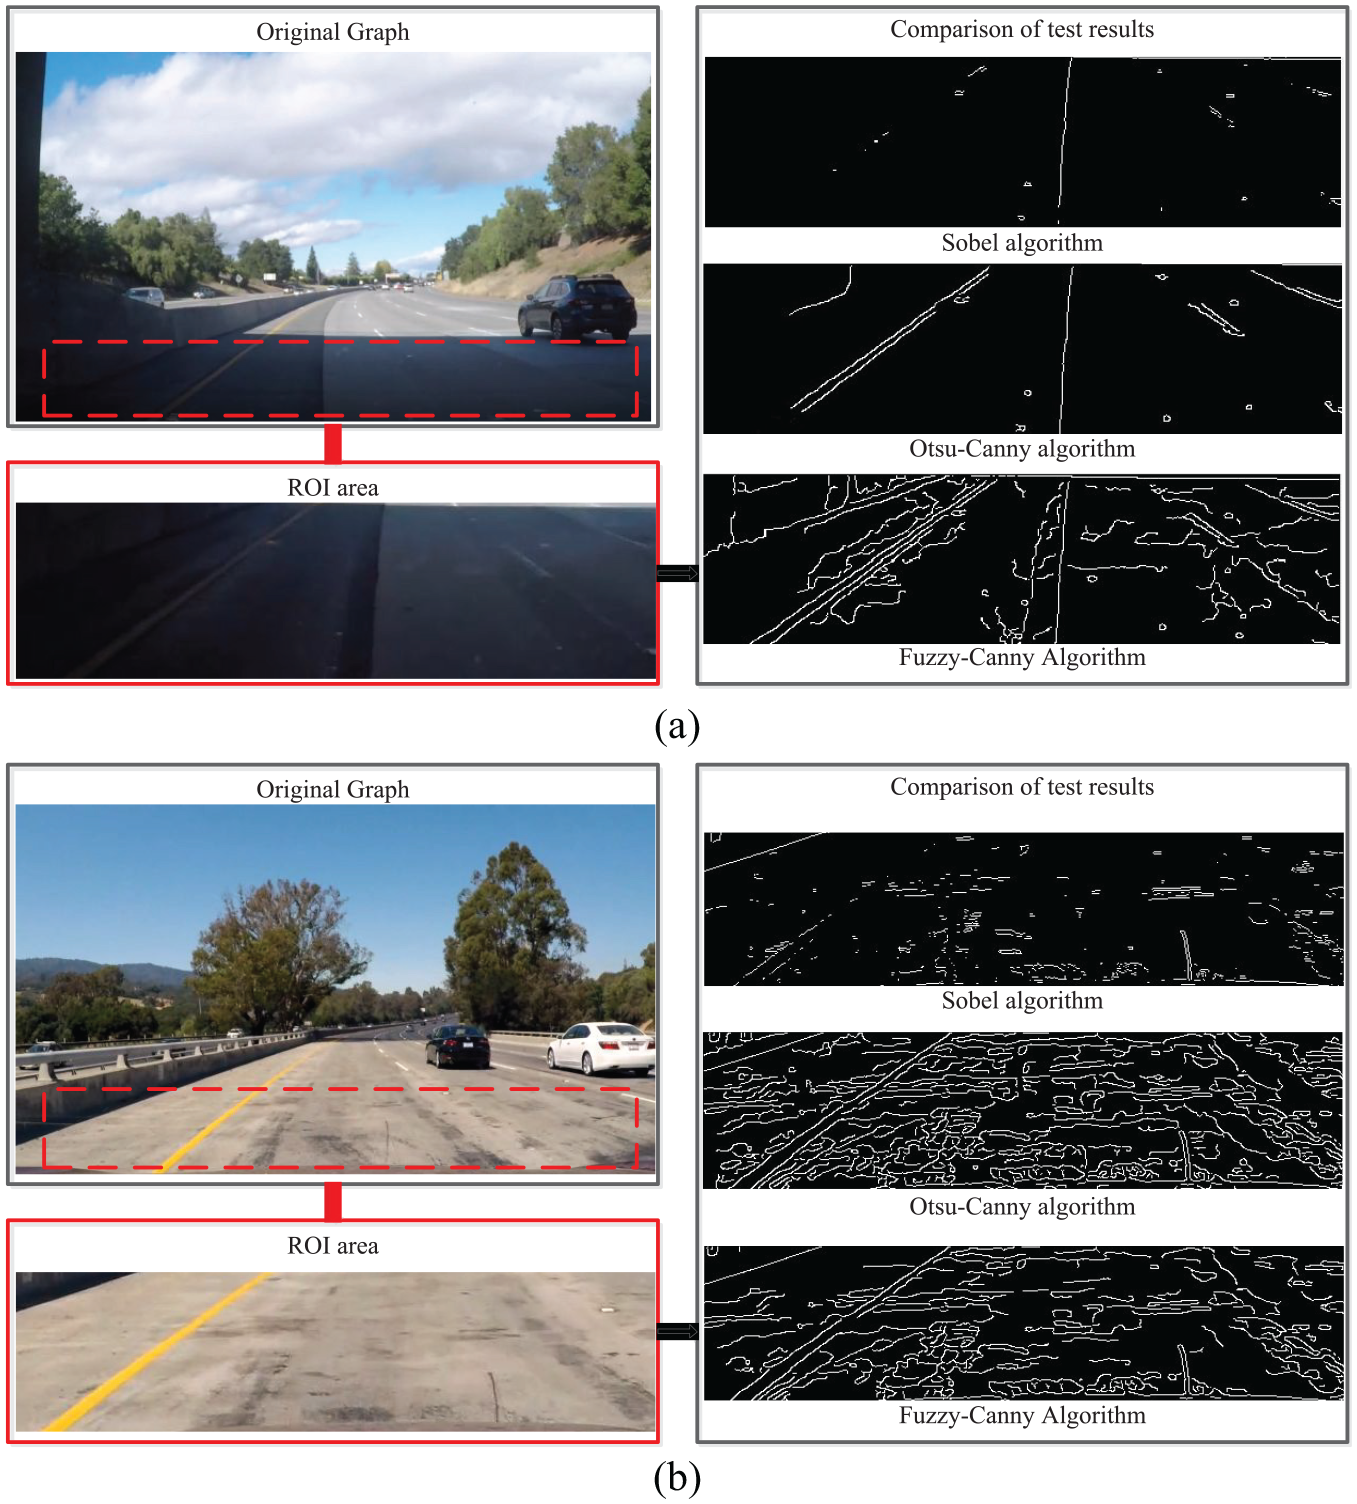
(a) Comparison of edge detection algorithms in shadow region; (b) Comparison of edge detection algorithms in highlighted regions.
It can be seen that although the Fuzzy-Canny method extracts more disordered edges when the ROI area is darker, the edge extraction of lane line is more complete, and the subsequent only need to filter out the lane line edge. The Fuzzy-Canny method reduces a considerable part of the disordered lines when the ROI area is bright, while the lane line is only slightly damaged, and then only needs curve fitting to solve the problem of partial missing.
Furthermore, we use Otsu-Canny algorithm and Sobel algorithm to compare with the Fuzzy-Canny algorithm designed in this paper. In order to make the contrast more meaningful, two kinds of test environment are set up: one is normal illumination condition; the other is the illumination uneven condition after image preprocessing designed in this paper. At the same time, the extraction method in reference 30 are introduced to compare the effect under complex illumination environment. The image preprocessing method in reference 30 is completely used in the illumination uneven test environment. In the above two environments, different edge extraction methods are used for experiments, and θline (extracted lane line pixel/lane line pixel) is used as the quantitative index, as shown in Table 2:
Comparison of effective edge extraction rate algorithms.
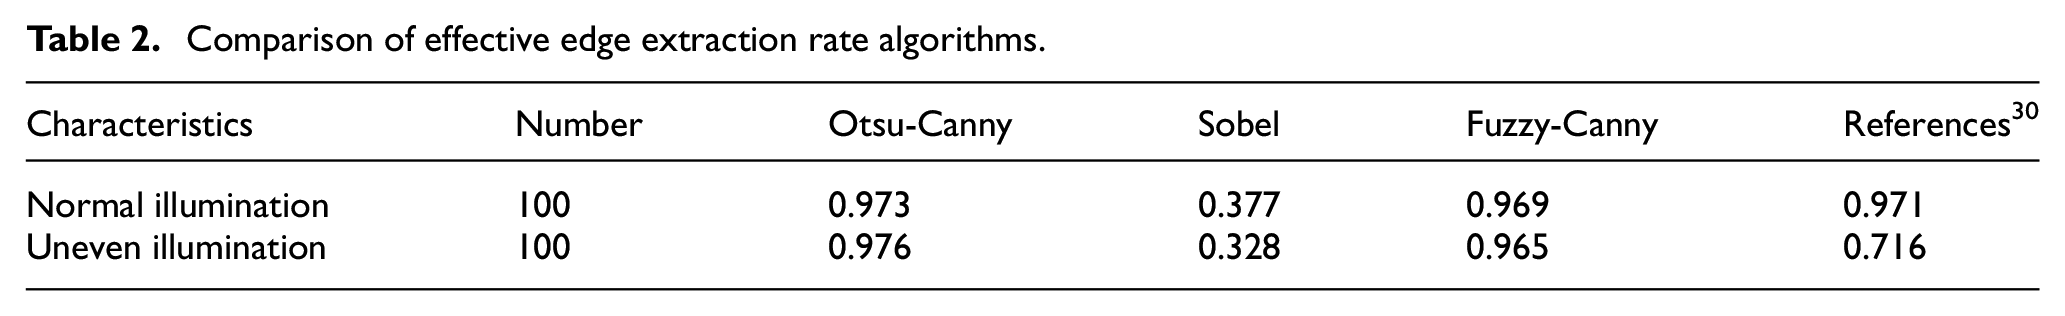
First of all, by comparing the edge algorithm, it can be seen that the Fuzzy-Canny designed in this paper can basically maintain the advantages of Otsu-Canny algorithm, and can extract more lane line pixels than Sobel operator; Secondly, through the comprehensive comparison of the overall algorithm, it can be seen that the combination of the preprocessing algorithm and the edge extraction algorithm in this paper can better deal with the complex changes of light and extract more lane line pixels than the method in literature 35.
Edge point filtering and recognition algorithm based on lane width feature
Through the introduction of adjusting the threshold value in Fuzzy-Canny algorithm in the previous section, we can see that even though enough edge points on the lane line are identified, there are still two problems: one is how to identify which scatter points belong to the lane line and which scatter points are useless noise points; the other is how to fit the edge points belonging to the lane line into a straight line or curve. To solve these two problems, the ROI area in the original image collected by the camera is transformed into an aerial view, then the edge points of the lane line are extracted by a feature point screening method based on the lane line width, and finally the edge points are fitted by the Bezier curve fitting algorithm based on RANSAC algorithm to get the identified lane line.
Inverse perspective transformation
Sheng scans the image line by line directly, and determines which scatter points belong to lane line by width matching. 31 This method does not consider that lane line in the image obtained by camera is not vertical, there is a certain angle in the image, so it needs reverse perspective transformation or distance conversion. Therefore, firstly, the image is transformed by inverse perspective in this paper, which makes preparation for the subsequent selection and extraction of lane line feature points.
The plane image with geometric deformation can be transformed into an undistorted top view by using the inverse perspective transformation algorithm. At present, there are two main methods to realize the inverse perspective transformation: the first one is to obtain the camera’s internal and external parameters by camera calibration method, the transformation formula is obtained by the multiplication of the internal and external parameter matrix according to the camera’s imaging model, and finally the top view after inverse perspective transformation is obtained by calculation.32,33 Although this method can correct the distortion of the camera, it involves many parameters and variables, the algorithm is complex and the operation require long time. The second method is to deduce the geometric relationship of perspective principle, and use the simplified inverse perspective transformation formula to calculate so as to obtain the top view of the image.29,34 This method is suitable for small angle camera with small distortion. Considering the characteristics and real-time of the camera used in this study, from the point of view of simplifying algorithm and realizing function, this paper makes some simplification to the first inverse perspective transformation method.
As the existing inverse perspective technology is relatively mature, this paper will not discuss its derivation process, and the overall transformation is as follows:
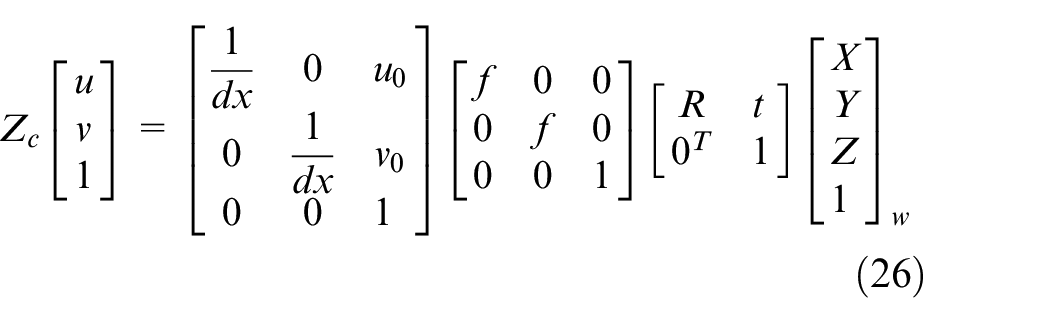
where the rotation matrix R is the matrix of 3*3, and t is the offset. From the back to the front, the middle three matrices are camera and world coordinate transformation matrix, projection relation matrix and pixel phase plane relation matrix.
Since the camera is installed inside the vehicle and has no roll angle, it can be simplified for the above type. If the camera is carefully installed and does not rotate relative to the Z axis, and considering that the horizon is actually horizontal, the plane where the road is located is taken as ZW = 0, then equation (26) can be simplified as equation (27).
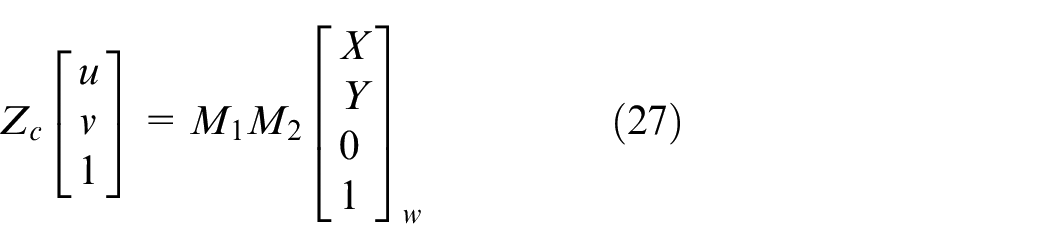
Among them, ZC is the perspective projection coefficient, M1 is the camera’s internal parameter matrix, which is determined by the camera’s internal parameters fx, fy, u0, v0; M2 is the external parameter matrix of the camera, where R and T are the coordinate transformation matrix determined by the location of the camera.
According to the above principle, the one-to-one correspondence between the points in the image plane and the points in the world coordinate system can be found, and then it can be transformed into an aerial view. It should be noted that, due to the small number of pixels in the distance, a large number of interpolation and fitting calculations are required when converting to the aerial view. Therefore, the transformation of the aerial view in the area far away from the sensor not only consumes computing power, but also cannot provide a clear lane line. Considering that the research object of this paper is low-speed driverless vehicle, so only the ROI area is transformed (for the same camera, the pixel coordinates of ROI area are fixed), finally make the two edges of lane line parallel, so that further analysis becomes easier.
Selection and extraction of feature points of lane line
After the image collected by the camera is transformed into the aerial view, the Fuzzy-Canny algorithm designed in the second chapter is used to process, and the binary image including the edge points and noise points is preliminarily obtained. Then, the binary image is filtered by progressive scanning method, and the edge points belonging to the lane line are extracted and the rest points are discarded, so as to reduce the impact of interference noise points on curve fitting. 35
This method makes use of the feature that the lane width is basically the same, the lane line with a width of 0.25 m is 4–5 pixels wide in the aerial view image in this paper, and the interior of the lane line is a connected area. The extraction method used in this paper is as follows:
Step 1: scan the binary image row by row, starting at the bottom of the image. If the gray value of the pixel points in a row is detected to be all 0, continue to scan the pixel points in the previous row, otherwise proceed to step 2.
Step 2: record the column number n of the first pixel point with a gray value of 255, and continue scanning of the next pixel point. If the gray value of the fourth or fifth pixel point from the column n is still 255, record the column number m of that point, and carry out step 3; otherwise, treat the first pixel point with a gray value of 255 as an interference point, set its value to zero and then continue scanning, and then repeat step 2.
Step 3: continue to detect the gray value of the pixel points in column n and column m of the above row. If the gray value is 255, repeat step 3; Otherwise, the gray value of the pixel points in the adjacent column is detected, if it is 255, repeat step 3; Otherwise, determine the two pixel points with a distance of 4 or 5 pixels in the step two as interference points, and set their values to 0. Continue with step 2 to scan from the next pixel in the row.
Step 4: after scanning the pixel points of each row and column, set the final gray value of all the pixel points between the two pixel points with the gray value of 255 to 255 in the same row.
The above process is shown in Figure 7:
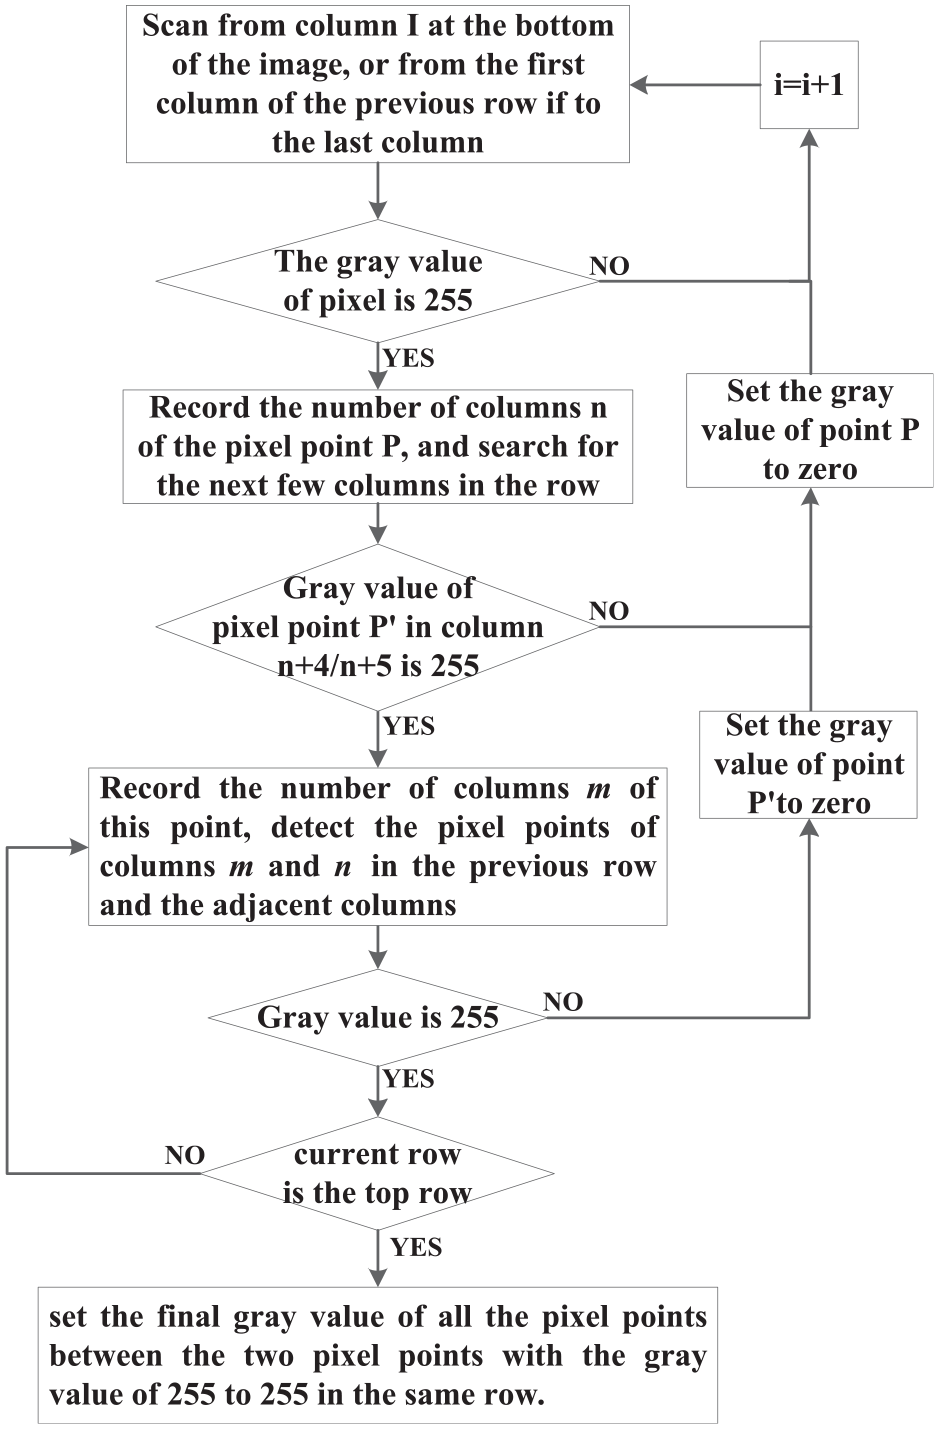
Flow chart of progressive scanning.
The results processed by the Fuzzy-Canny algorithm and the lane line extraction results after progressive scanning are shown in Figure 8. The Fuzzy-Canny algorithm extracts enough lane line edge points under the condition of reducing the number of interference points as much as possible, the progressive scanning method basically extracts the edge points belonging to the lane line from all pixel points successfully. In addition, it can be seen that the dotted lane line is still extracted because it conforms to the extraction rules designed in this paper, while due to AGV follows the solid line, the dotted lane line will be removed in the subsequent processing in this paper.
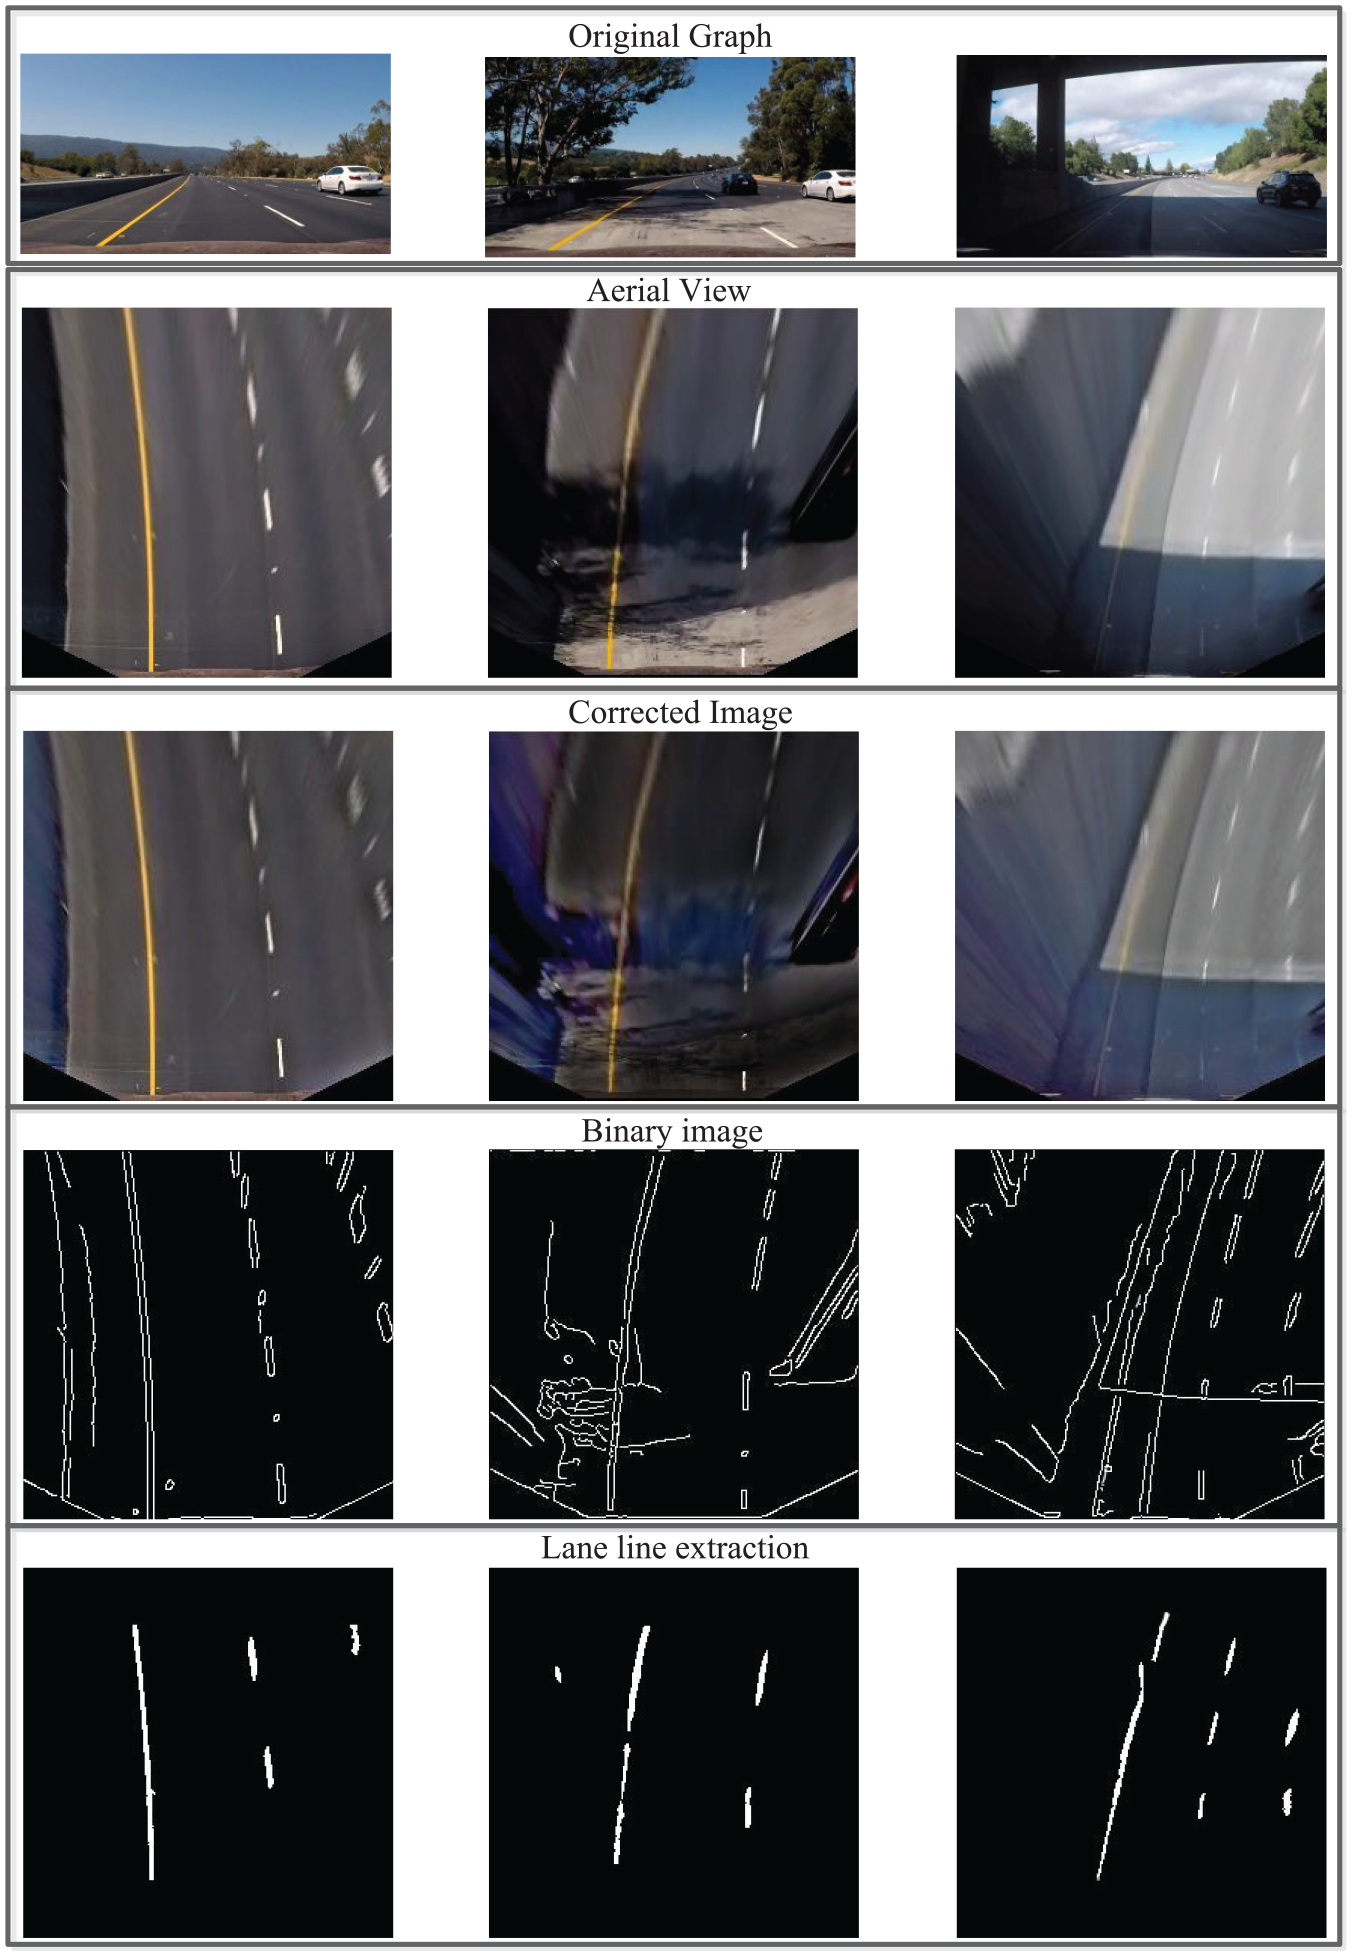
Binary graph and lane line filtering results in multi scene.
Curve fitting of feature points based on RANSAC
After preprocessing the image, there are scattered points on multiple lane lines. It is necessary to fit these scattered points to find a curve that can contain enough scattered points, that is, a curve that can contain enough scattered points. In this paper, RANSAC is used to fit the feature points to form the curve that best fits the lane line. Scholar Cao used canny method as the comparison object in his research and got poor lane line detection results. In addition to its lack of improvement on Canny algorithm, another important reason is that it used the least square method instead of RANSAC. The least square method is to find the most suitable curve from all the points. This method without abandoning leads to all the noise points being taken into account, so it is not suitable to use with Canny algorithm. RANSAC is a kind of non deterministic algorithm, it will produce a reasonable result under a certain probability, which allows more iterations to increase its probability. The operation process is as follows:

In short, after each fitting, there are corresponding data points within the tolerance range. Finding out that the number of data points meets the set confidence is the final fitting result. In this paper, the maximum number of iterations is determined by setting the confidence conditions. The number of iterations of steps 1–3 is related to the outliers proportion of the model and how high the confidence we need. It can be expressed by the following formula:
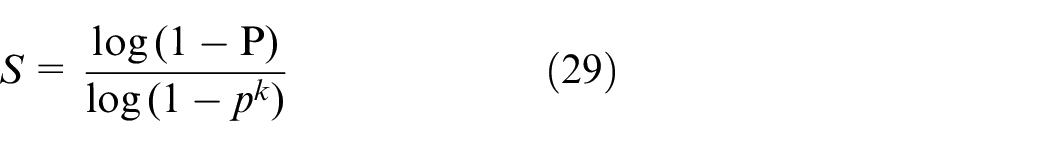
where S is the minimum number of tests required, P is the confidence level, p is the percentage of inliers and k is the number of random samples. The specific confidence level needs to be determined by repeated tests and comprehensive consideration of accuracy and real-time.
Test verification
In this paper, the above algorithms are verified in different scenarios, and the final lane line is marked on the original image, and some representative screenshots are selected as shown in Figure 9. In Figure 9, (a) is the normal illumination area, (b) is the uneven illumination area, (c) is the large shadow area, (d) is the line interference area, (e) is the high brightness area.
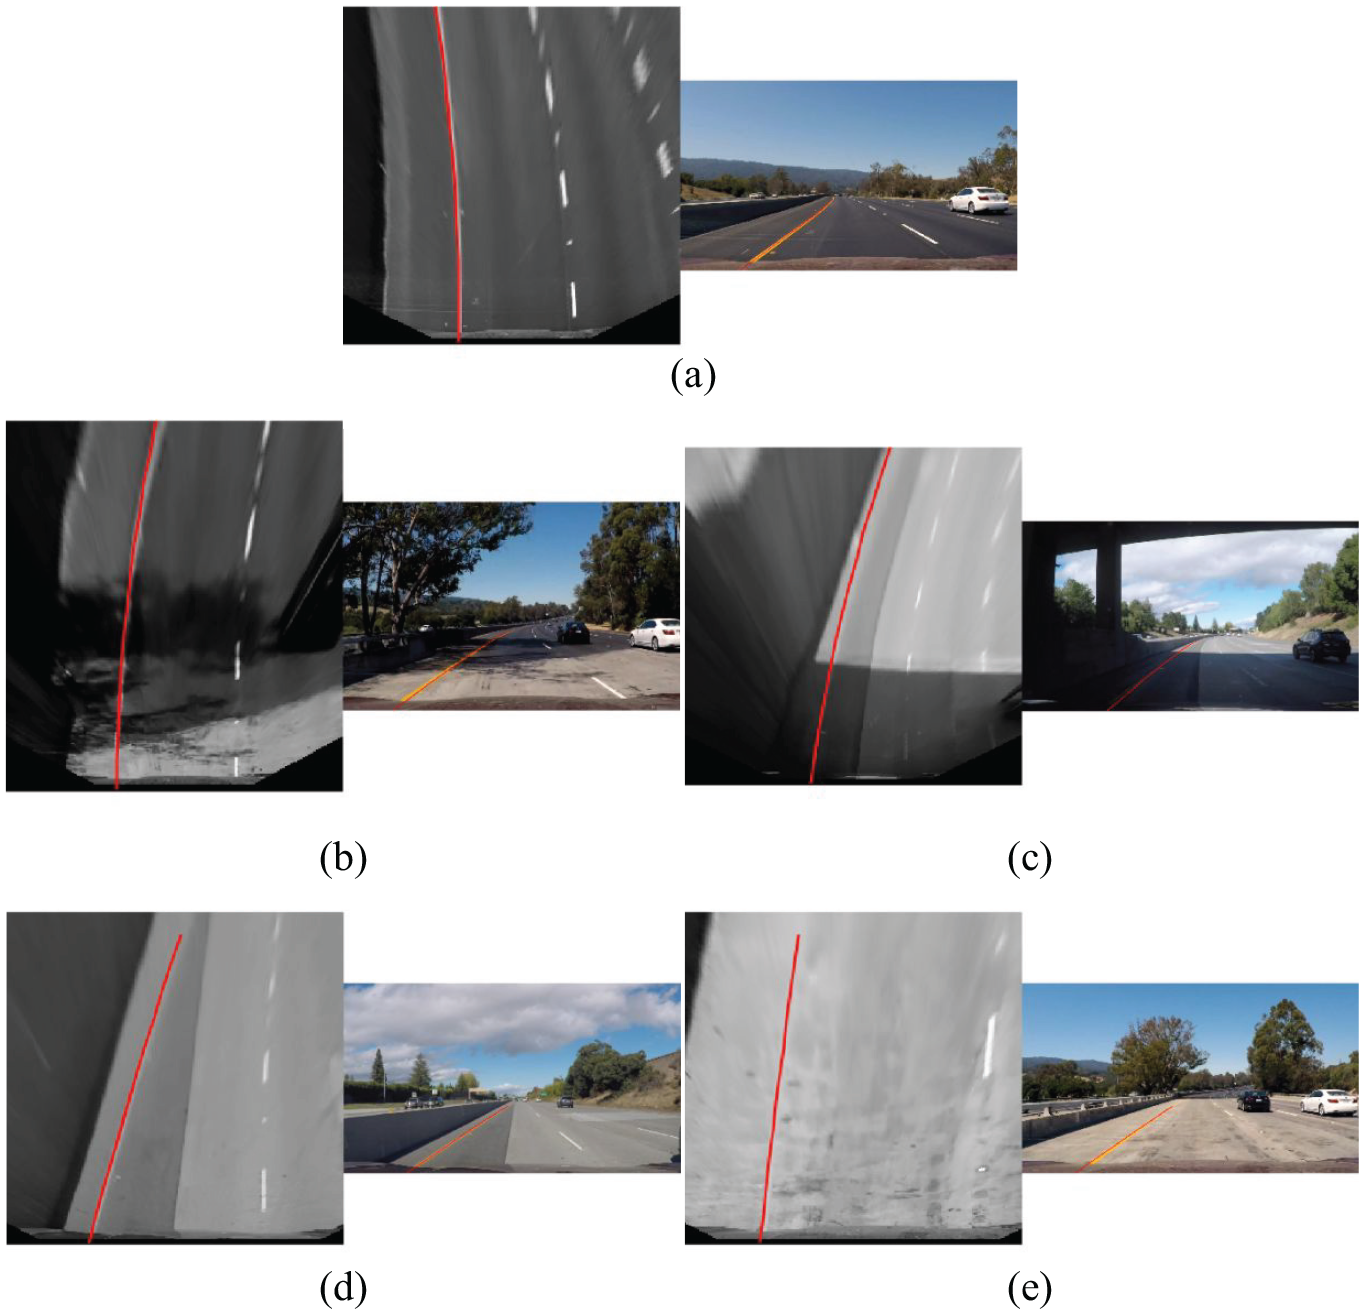
Lane line detection results in multiple scenes.
In this experiment, the camera acquisition frame rate is 30 frames per second, and the average output frame rate after the algorithm processing is 29.97 per second, which can be regarded as no frame dropping phenomenon, basically meeting the requirements of real-time processing. In Figure 9, the right side of each group of pictures is a video screenshot. It can be seen that continuous lane line recognition result curves can be obtained in different scenes, which can provide reliable guarantee for the stable operation of AGV. According to statistics, there are only about 11 frames of recognition failure or inaccurate recognition in 1950 frames of video, and the recognition rate is more than 98%.
From the above table, it can be seen that a series of algorithms designed in this paper can effectively extract the pixel points in the lane line in various complex environments, and it can fit the scatter diagram with a small number of interference points into the curve formed according to the shape of lane line, which provides a stable and reliable information source for AGV motion control.
When the least square method is selected to replace RANSAC for curve fitting, there is a considerable error in the area with a little more interference. Calculate the error rate (extracted non lane line pixels/total extracted pixels) of lane line edge points after extraction after using RANSAC fitting, the comparison with algorithm in reference 7 as shown in Table 3:
Segmentation error rates and image recognition rate for guide paths.
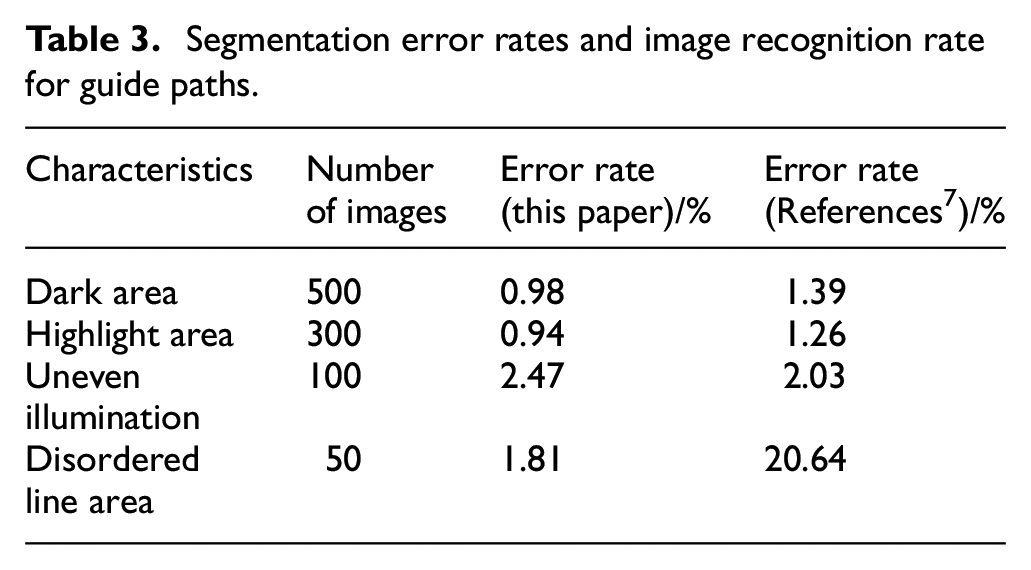
Although the SVM algorithm is used in document 7 to divide the illumination area, based on which the area image is enhanced and good results are achieved, while due to it completely extracts the lane line according to the chroma component, there is a large error when there are disordered lines with the same color as the lane line in the lane line range. At the same time, we can see that the image preprocessing in this paper can achieve the similar processing effect with reference. 7
Conclusion
With the change of the times and the development of the society, AGV based on vision has received a lot of attention, but it still faces much difficulties in visual recognition. One of the most challenging problems is the recognition of lane line when driving in trace. It is well known that AGV is not always in a stable indoor environment, but in a variety of complex environments. Therefore, this paper has carried out in-depth lane line recognition in complex lighting environment. In order to distinguish and correct the uneven area of illumination on the premise of real-time, this paper uses the method based on FGF and improved 2-D gamma function to quickly correct the image with uneven area of illumination. and then designs a Fuzzy-Canny segmentation algorithm, taking the threshold value under the standard brightness value Y as the benchmark, and the threshold value is adjusted adaptively by judging the value of Y at present; In addition, this paper also uses the significant feature of lane width to extract the edge points that meet this feature, and finally uses the method of RANSAC feature point fitting to get the identified lane line. The experimental results in several representative scenes show that the method has a strong adaptability to complex lighting conditions, and can identify path pixels in the field of view in areas with high reflection, dark shadow and uneven illumination, etc. Under the premise of real-time, there is basically no recognition failure under the normal road and special environment. In the future research work, a Fuzzy-Canny segmentation algorithm based on the neural network will be studied. The trained neural network will be used to learn the brightness and chroma changes of the image to adjust the threshold more reasonably. In addition, a vision based AGV will be developed to fully validate our method in more scenes of road environment and similar factory environment combined with motion control.
Footnotes
Declaration of conflicting interests
The author(s) declared no potential conflicts of interest with respect to the research, authorship, and/or publication of this article.
Funding
The author(s) disclosed receipt of the following financial support for the research, authorship, and/or publication of this article: This work was supported by the Key Laboratory of Road and Traffic Engineering of the Ministry of Education, Tongji University under grant K201903; the national key research and development plan program under grant 2018YFB0104803; the Primary Research and Development Plan of Jiangsu Province under grant BE2017129 and the Six Talent Peaks Project of Jiangsu Province under grant JXQC-042.